Differential spatiotemporal development of Purkinje cell populations and cerebellum-dependent sensorimotor behaviors
- Department of Neuroscience, Erasmus MC, Netherlands
- Princeton Neuroscience Institute, United States
- Department for Developmental Origins of Disease, University Medical Center Utrecht Brain Center and Wilhelmina Children’s Hospital, Netherlands
Figures
Figure 1 with 5 supplements
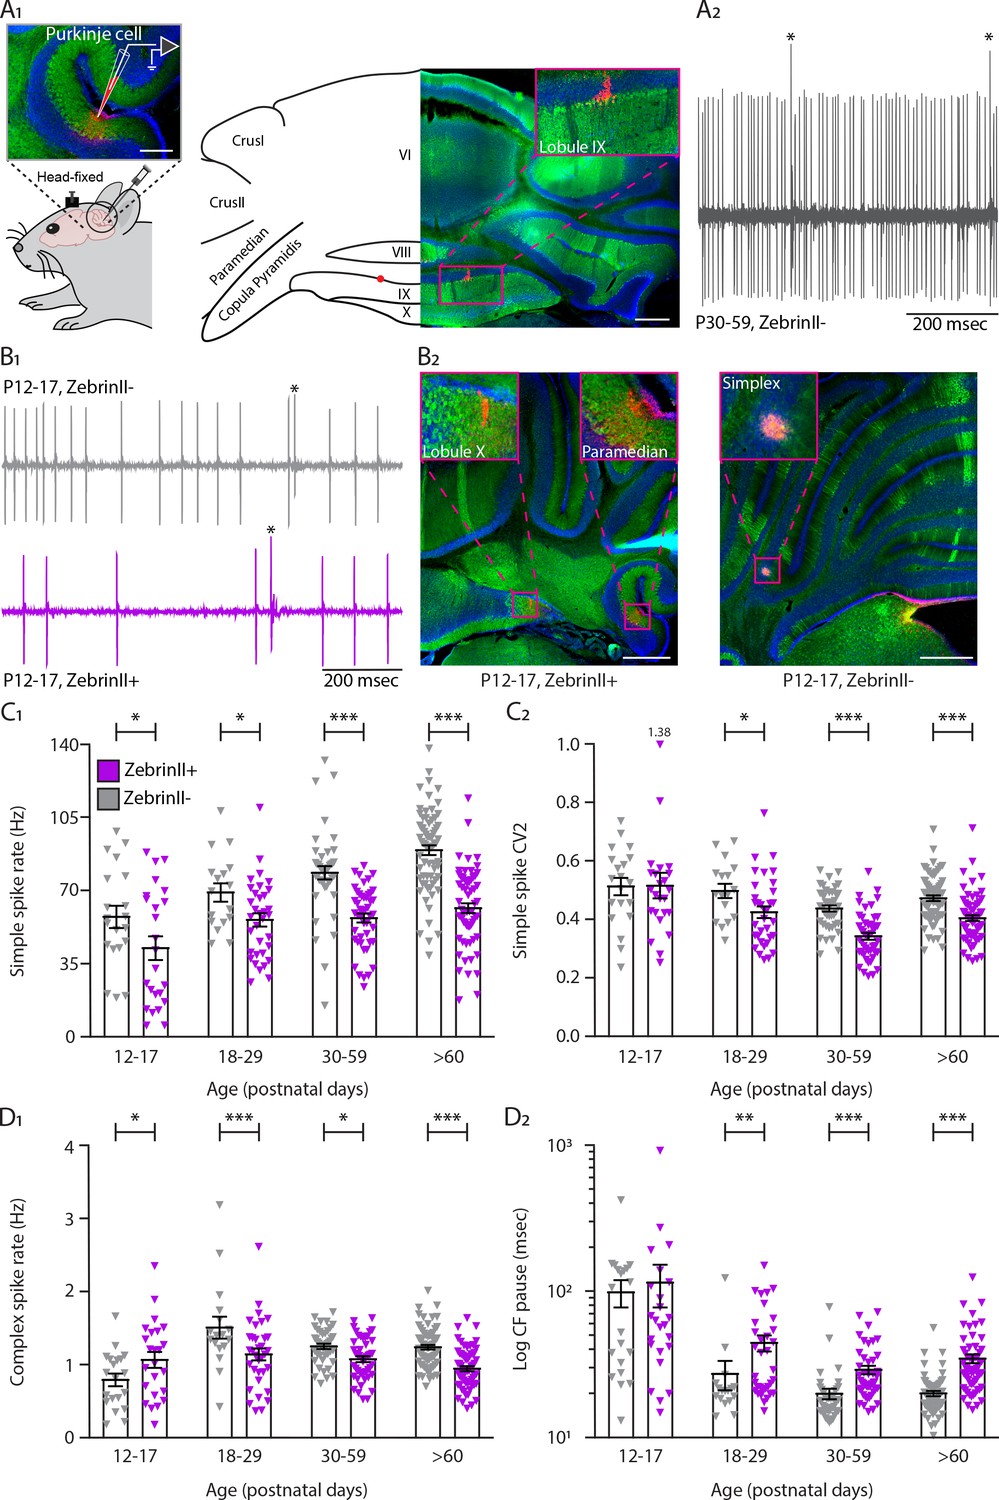
Simple and complex spike activity develops differently between ZebrinII-related Purkinje cell populations.
(A1) Schematic illustration of single unit cerebellar extracellular recordings in Purkinje cells of awake head-fixed mice (left). Schematic representation of a cerebellar coronal section and respective image showing lobules VI, VIII, IX and X, Crus I, Crus II, Paramedian, and Copula Pyramidis. Cerebellar coronal section with PCs labeled with Aldolase C (green). Inset showing recording site marked with biocytin (red) in lobule IX (right). (A2) Example trace of in vivo P30-59 ZebrinII– Purkinje cell recording identified by its hallmark feature, the occurrence of complex spikes (asterisks) and simple spikes. (B1) Example traces of extracellular Zebrin– and Zebrin+ Purkinje cell recordings at P12-17 with clearly distinguishable simple spikes and complex spikes (asterisks). (B2) Photomicrographs of coronal sections with examples of ZebrinII+ (left) and ZebrinII– (right) P12-17 Purkinje cells in lobule X, Paramedian, and Simplex, respectively. Purkinje cells are labeled with Aldolase C (green). Insets showing recording sites marked with biocytin (red) in lobule X, Paramedian (left) and Simplex (right). (C1) Purkinje cell simple spike firing rate, (C2) coefficient of variation 2 (CV2) for simple spikes, (D1) complex spike firing rate and (D2) Climbing fiber pause recorded in vivo for ZebrinII– Purkinje cells (gray) and ZebrinII+ Purkinje cells (purple) in four age groups. Age groups: P12-17, P18-29, P30-59, and >P60. Error bars represent SEM., for values see Supplementary file 1. * denotes p<0.05, **p<0.001 and ***p<0.0001. Scale bars = (A1) 100 µm (left), 500 µm (right), and (B2) 500 µm.
-
Figure 1—source data 1
Purkinje cell in vivo source data 1.
- https://cdn.elifesciences.org/articles/63668/elife-63668-fig1-data1-v2.xlsx
Figure 1—figure supplement 1
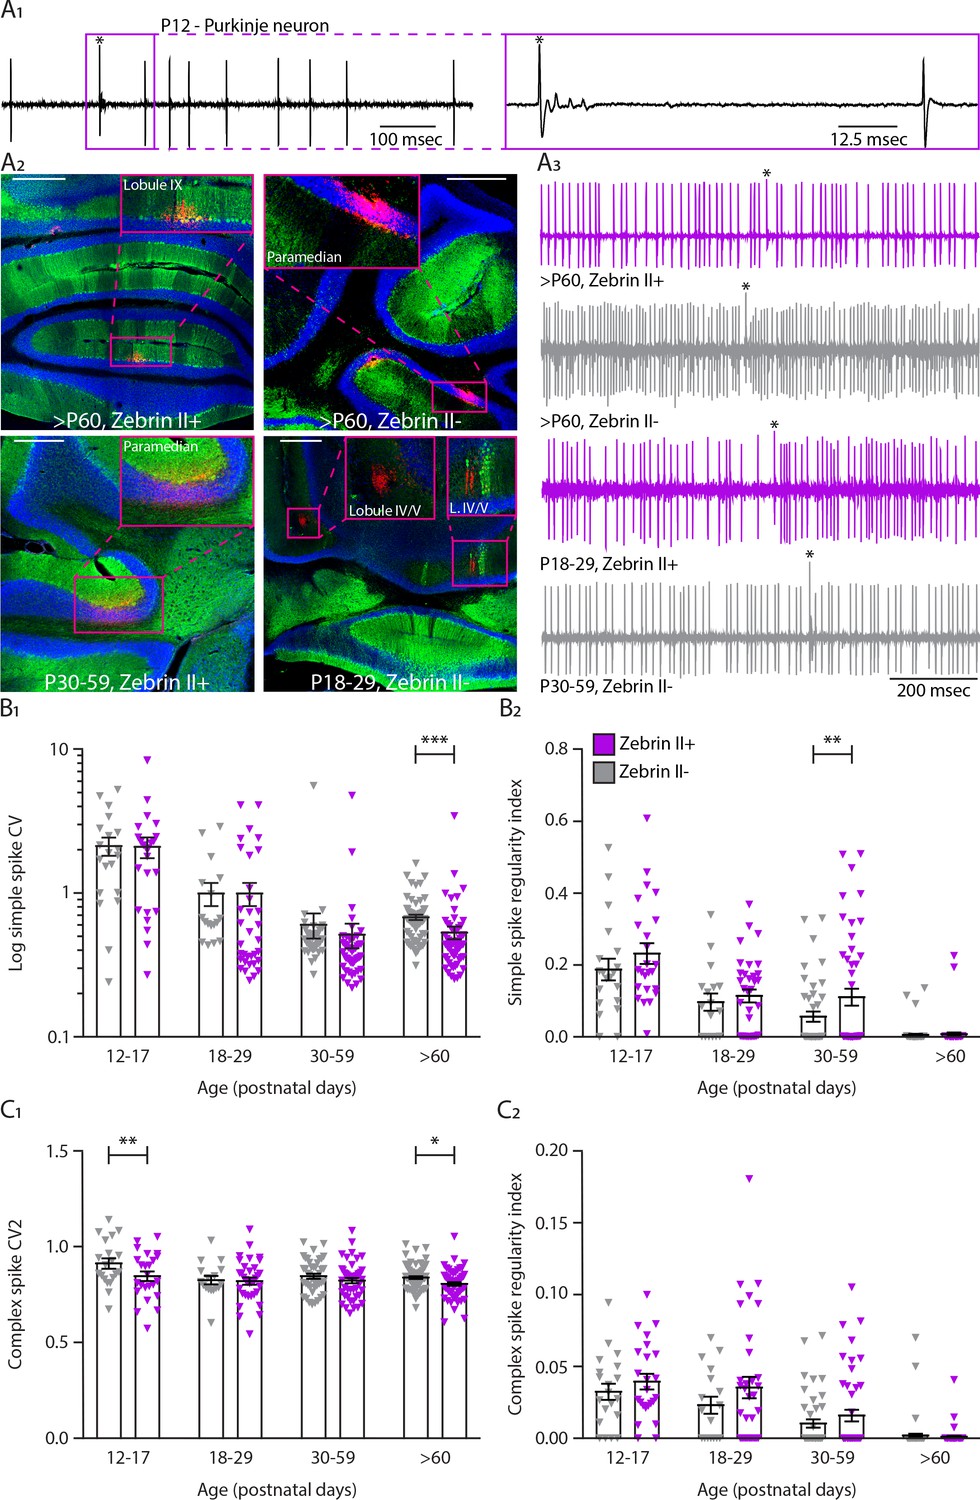
In vivo extracellular recordings of simple and complex spike activity in different ZebrinII-related Purkinje cell populations during development.
(A1) Example trace of a young P12 Purkinje cell recording identified by its hallmark feature, the occurrence of complex spikes (asterisk) and simple spikes (left). Inset depicting the complex spike (asterisk) following a climbing fiber pause with clear visible spikelets (right). (A2) Photomicrographs of coronal sections with examples of P18-29 ZebrinII–, P30-59 ZebrinII+, >P60 ZebrinII+, and ZebrinII– Purkinje cells labeled with Aldolase C (green). Insets showing recording sites marked with biocytin (red) in lobules IX IV/V and Paramedian. (A3) Example traces of ZebrinII– and ZebrinII+ Purkinje cells extracellular recordings at >P60 ZebrinII+ an ZebrinII–, P18-29 ZebrinII+, and P30-59 ZebrinII– with clearly distinguishable simple spikes and complex spikes (asterisks). (B1) Purkinje cell coefficient of variation (CV) for simple spikes, (B2) regularity index for simple spikes, (C1) coefficient of variation 2 (CV2) for complex spikes and (C2) regularity index for complex spikes recorded in vivo for ZebrinII– Purkinje cells (gray) and ZebrinII+ Purkinje cells (purple) in four age groups. Age groups: P12-17, P18-29, P30-59, and >P60. Error bars represent SEM., for values see Supplementary file 1. * denotes p<0.05, **p<0.001 and ***p<0.0001. Scale bars = (A2) 500 µm (top left, top right, bottom right) and 250 µm (bottom left).
Figure 1—figure supplement 2
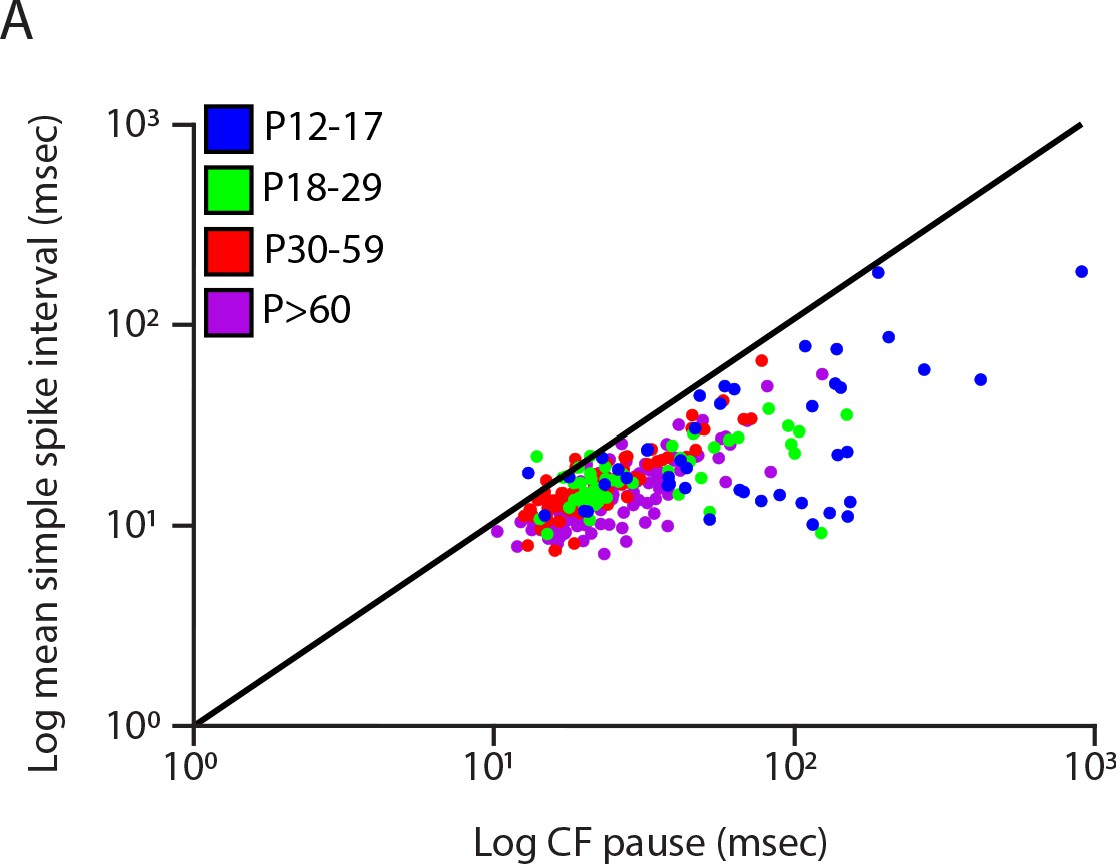
Climbing fiber pause is longer than inter-simple spike-interval in the majority of the recorded cells.
(A) Scatterplot of the log mean simple spike-interval versus the log climbing fiber (CF) pause of all cells recorded in four age groups (blue: P12-17; green: P18-29; red: P30-59 and purple: P>60). The diagonal black line represents the reference line where the climbing fiber pause is equally long as the simple spike-interval.
Figure 1—figure supplement 3
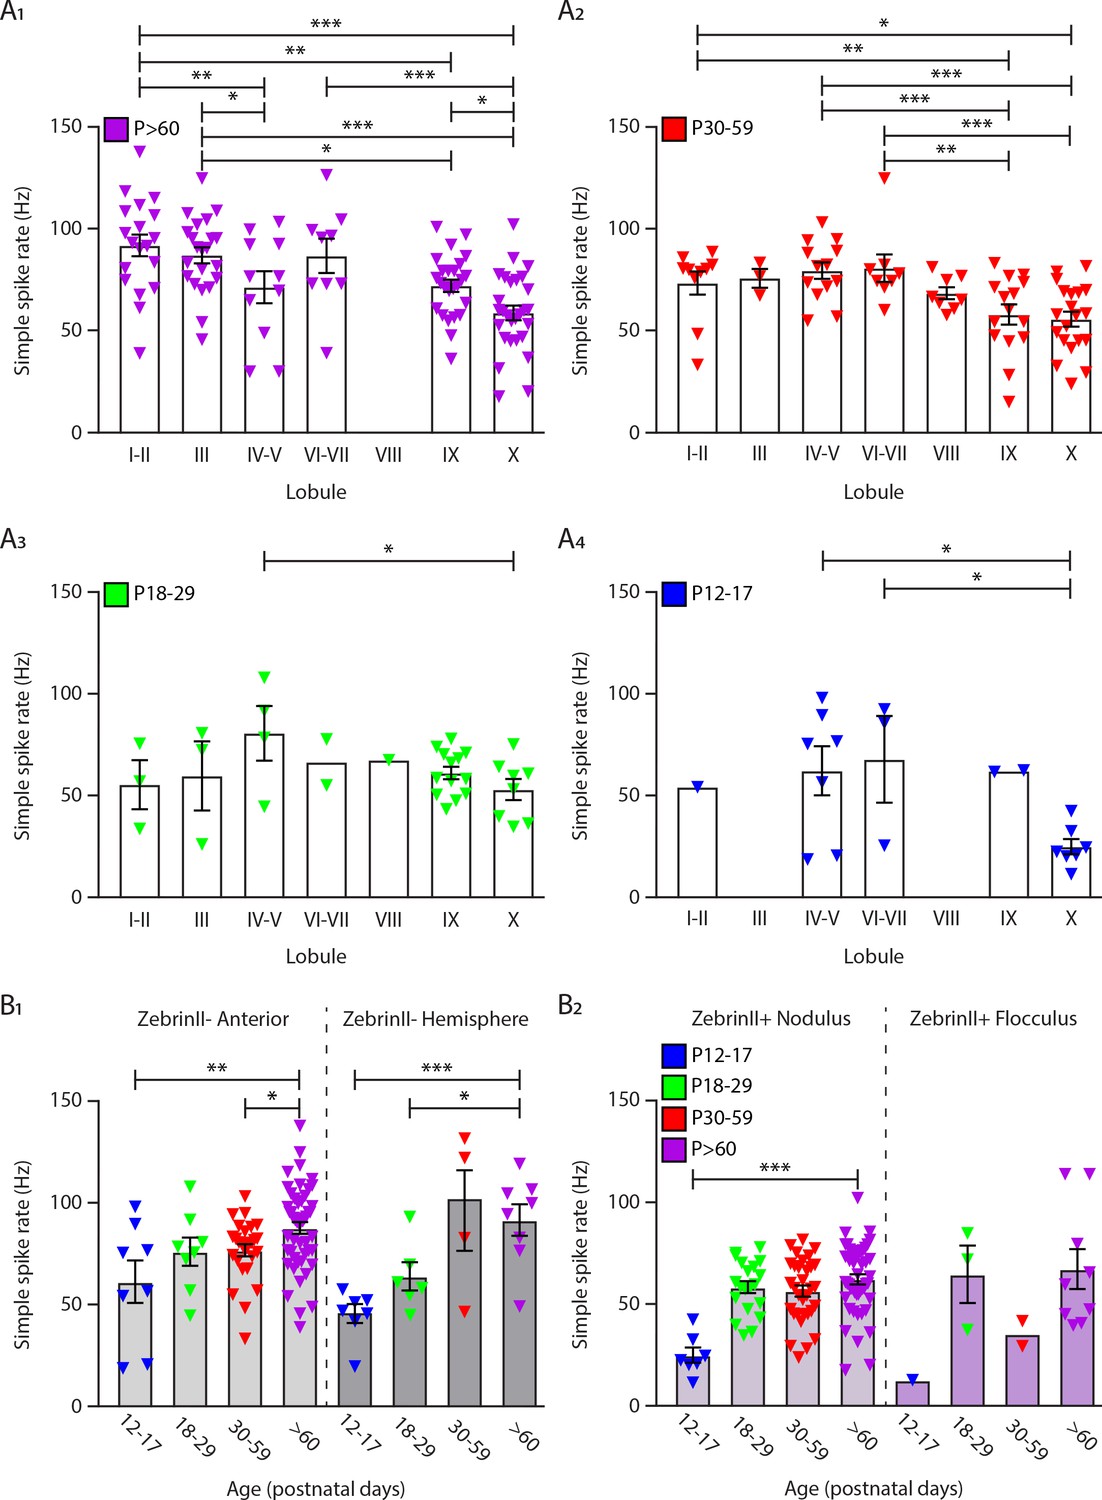
In vivo extracellular recordings of simple spike activity distributed by lobules and cerebellar regions during development.
Purkinje cell simple spike firing rate in vivo for Purkinje cells in all lobules at (A1) >P60, (A2) P30-59, (A3) P18-29 and (A4) P12-17. Purkinje cell simple spike firing rate in vivo for (B1) ZebrinII– Purkinje cells in lobules I to V and ZebrinII– Purkinje cells in the hemispheres and for (B2) ZebrinII+ Purkinje cells in the nodulus and ZebrinII+ Purkinje cells in the floculus in four age groups. Error bars represent SEM., for values see Supplementary file 1. * denotes p<0.05, **p<0.001, and ***p<0.0001.
Figure 1—figure supplement 4
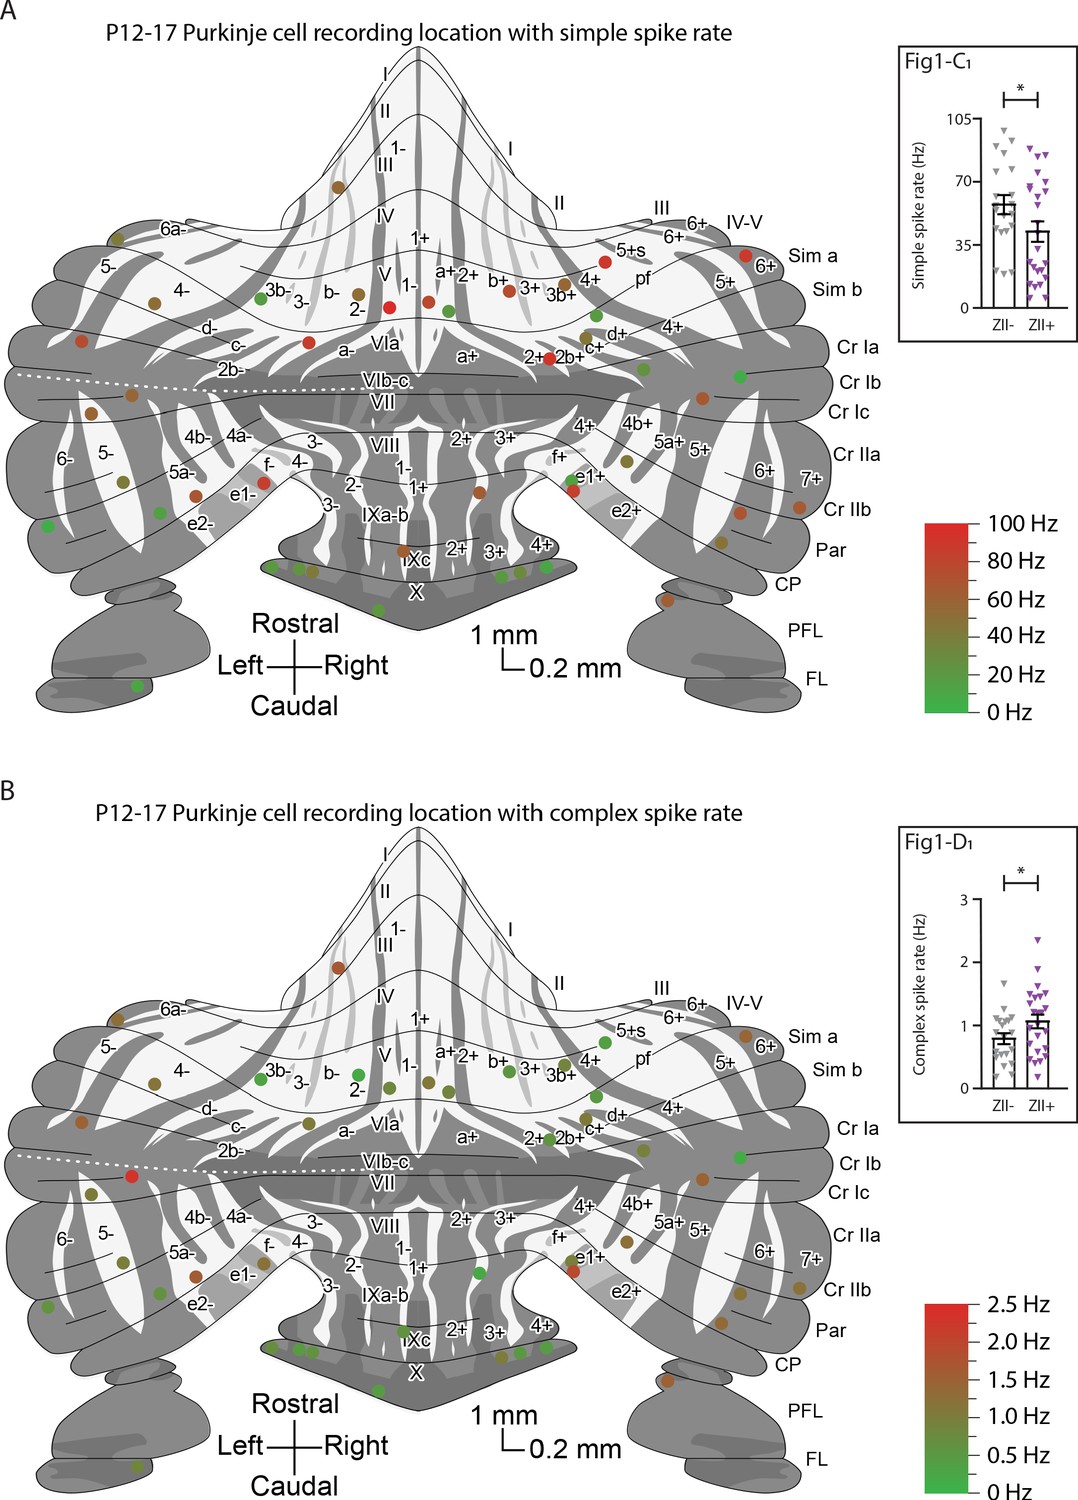
Overview with color-coded simple spike and complex spike rate for all identified ZebrinII– and ZebrinII+ Purkinje cells.
(A) P12-P17 Purkinje cell recording location with simple spike rate and (B) P12-P17 Purkinje cell recording location with complex spike rate.
© 2007, John Wiley & Sons. The schematic drawing in panels A and B is redrawn from Figure 3 from Sugihara and Quy, 2007b, with permission from John Wiley & Sons, Inc. It is not covered by the CC-BY 4.0 licence and further reproduction of this panel would need permission from the copyright holder.
Figure 1—figure supplement 5
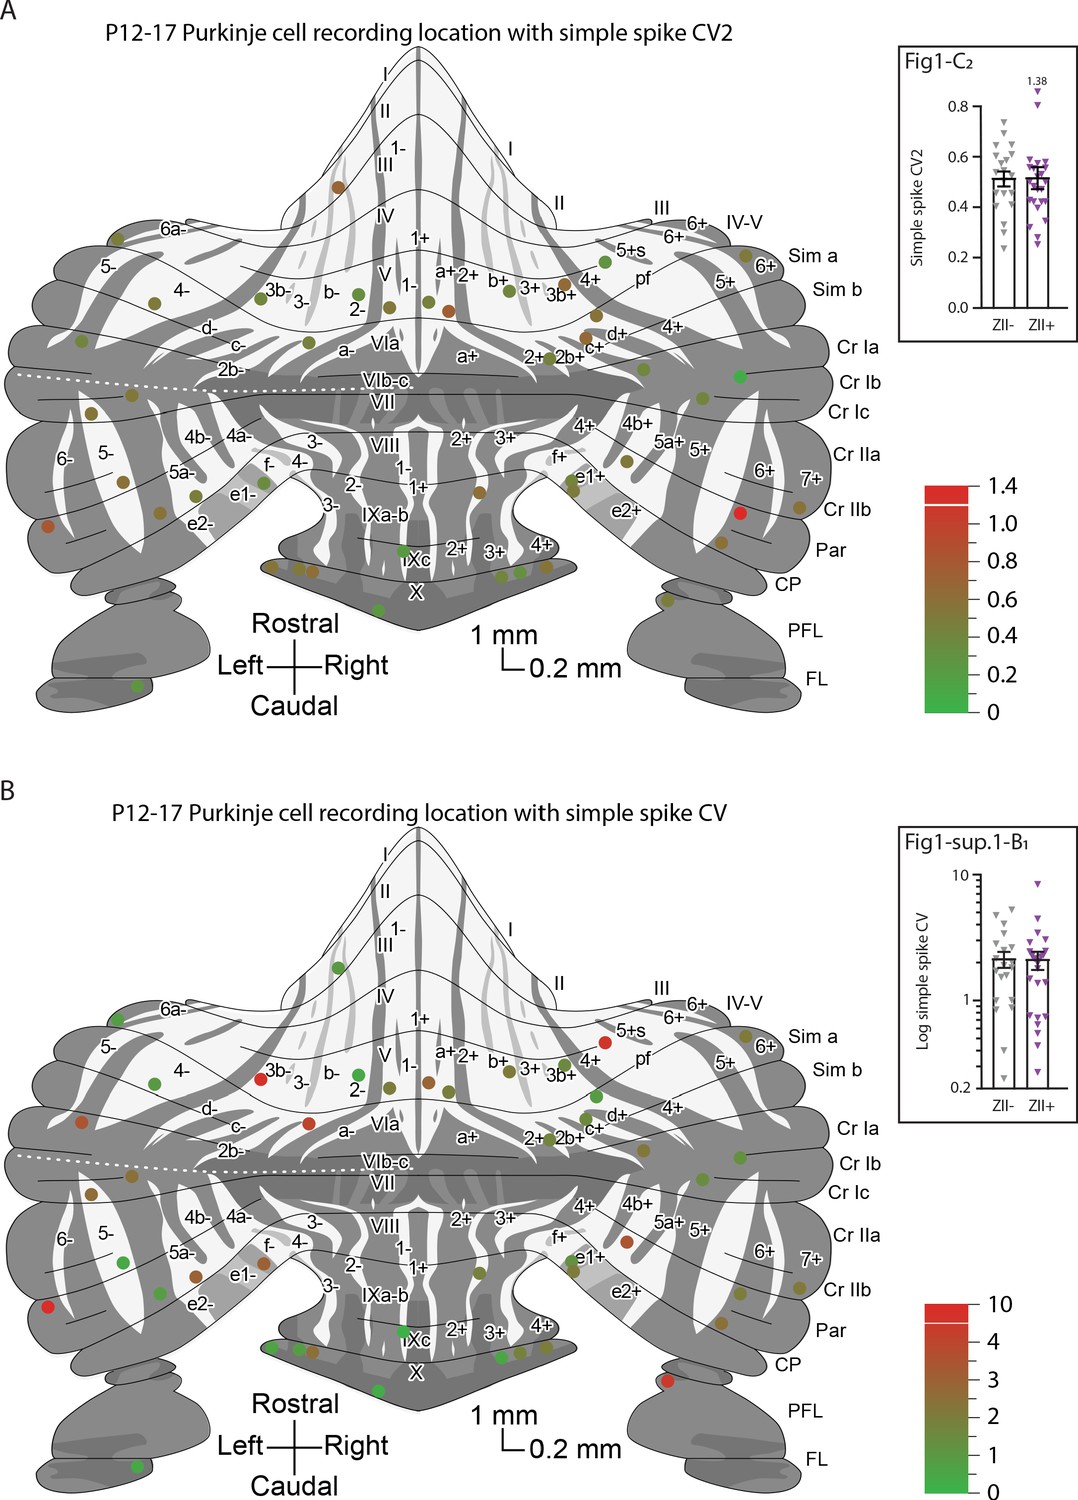
Overview with color-coded simple spike coefficient of variation 2 (CV2) and coefficient of variation (CV) for all identified ZebrinII– and ZebrinII+ cells.
(A) P12-P17 Purkinje cell recording location with simple spike coefficient of variation (CV2) and (B) P12-P17 Purkinje cell recording location with simple spike coefficient of variation (CV).
© 2007, John Wiley & Sons. The schematic drawing in panels A and B is redrawn from Figure 3 from Sugihara and Quy, 2007b with permission from John Wiley & Sons, Inc. It is not covered by the CC-BY 4.0 licence and further reproduction of this panel would need permission from the copyright holder.
Figure 2 with 2 supplements
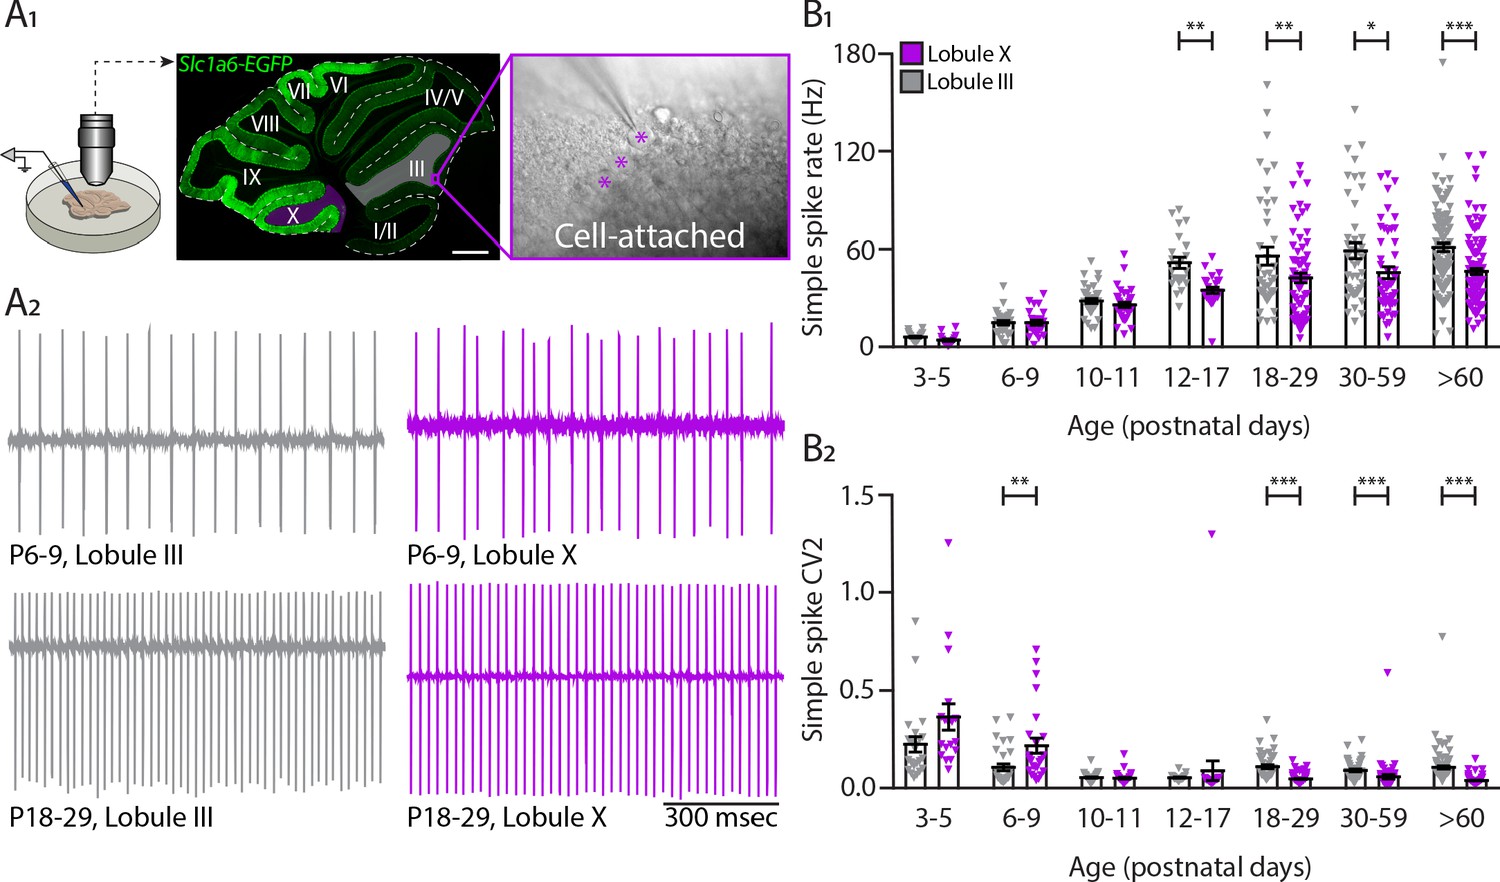
Intrinsic activity develops differently between lobule III and lobule X Purkinje cell populations.
(A1) Cell-attached recordings in vitro in Slc1a6-EGFP mice that express eGFP in Purkinje cells. Recordings of intrinsic Purkinje cell activity were made in lobules III and X. Purkinje cells were identified by the size of the soma (asterisk) clearly visible in the Purkinje cell layer. (A2) Example traces of cell-attached recordings of lobule III and X Purkinje cells at P6-9 and P18-29. (B1) Purkinje cell intrinsic simple spike rate and (B2) coefficient of variation 2 (CV2) recorded in vitro for lobule III Purkinje cells (gray) and lobule X Purkinje cells (purple) in seven age groups. Age groups: P3-5, P6-9, P10-11, P12-17, P18-29, P30-59, and >P60. Error bars represent SEM, for values see Supplementary file 1. * denotes p<0.05, **p<0.001, and ***p<0.0001. Scale bar = (A1) 500 µm.
-
Figure 2—source data 1
Purkinje cell in vitro source data 1.
- https://cdn.elifesciences.org/articles/63668/elife-63668-fig2-data1-v2.xlsx
Figure 2—figure supplement 1
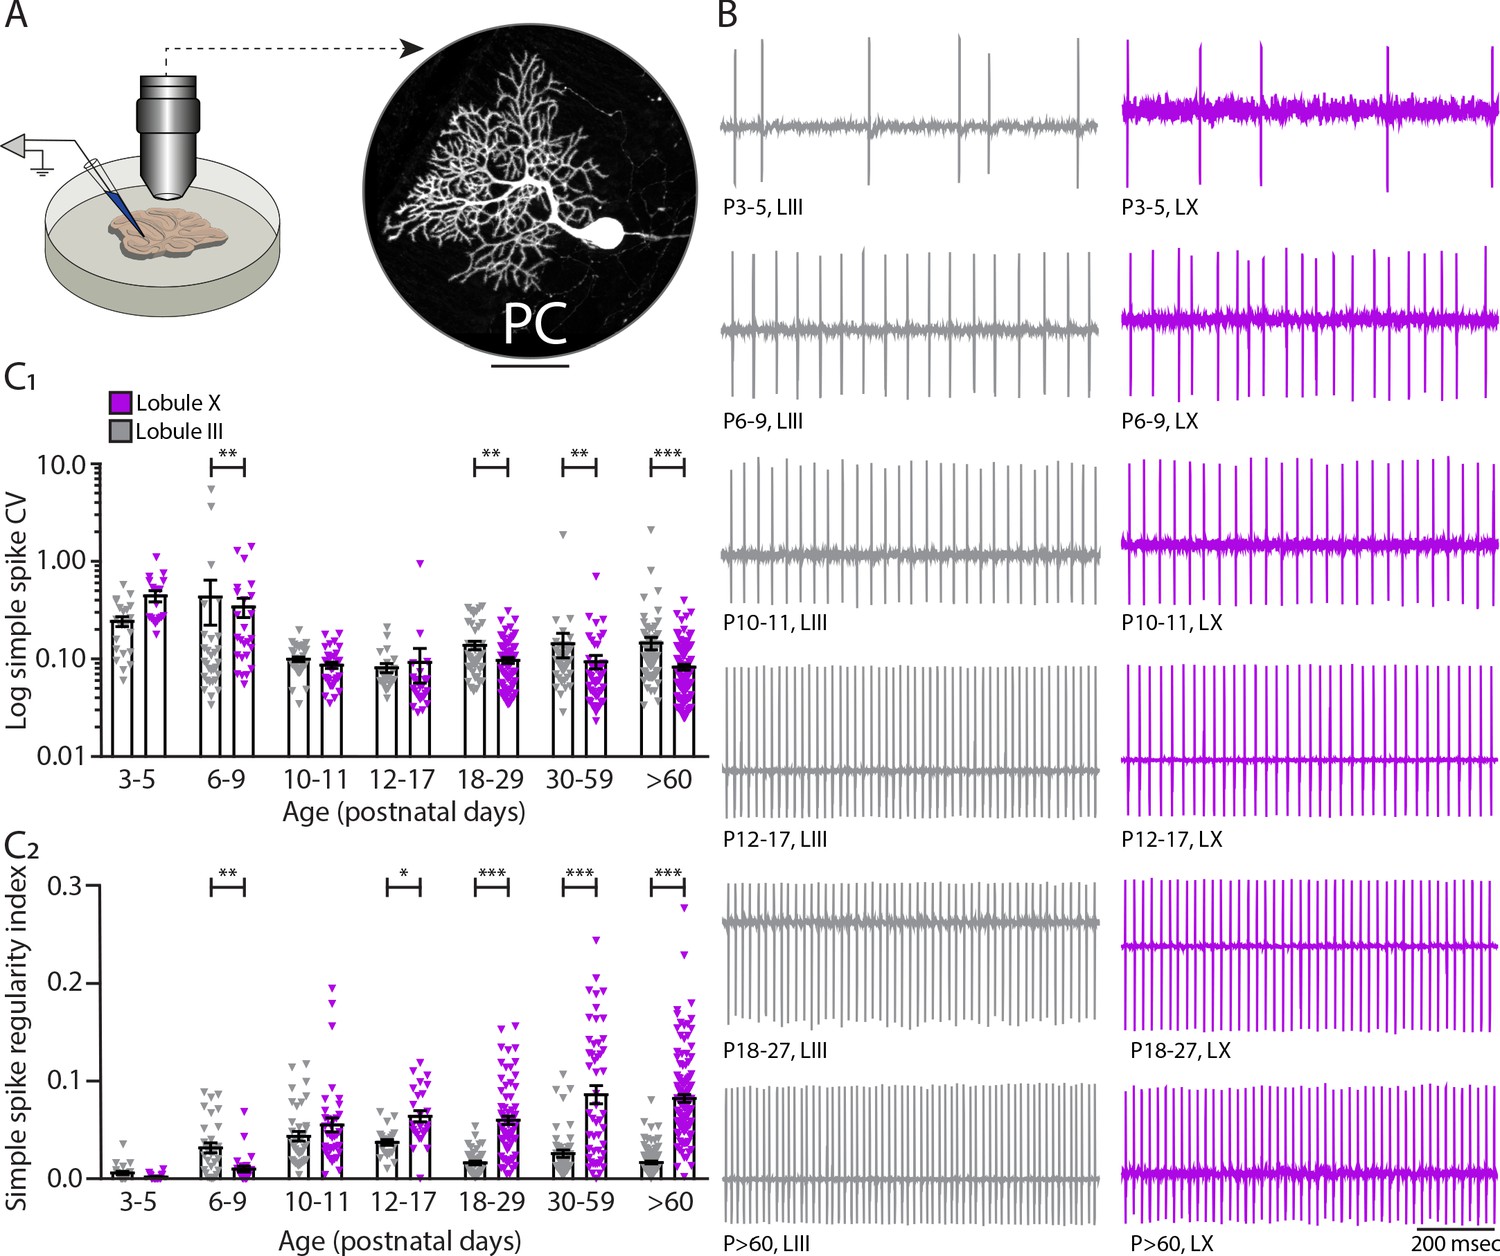
In vitro cell-attached recordings of intrinsic activity in different Purkinje cell populations during development.
(A) Schematic of cell-attached recordings in vitro in lobules III and X (left) and example of a Purkinje cell filled with biocytin and stained afterwards (right). (B) Example traces of cell-attached recordings of lobule III and X Purkinje cells at different developmental ages. (C1) Purkinje cell coefficient of variation (CV) and (C2) regularity index recorded in vitro for lobule III Purkinje cells (gray) and lobule X Purkinje cells (purple) in seven age groups. Age groups: P3-5, P6-9, P10-11, P12-17, P18-29, P30-59, and >P60. Error bars represent SEM., for values see Supplementary file 1. * denotes p<0.05, **p<0.001, and ***p<0.0001. Scale bar = (A) 50 µm.
Figure 2—figure supplement 2
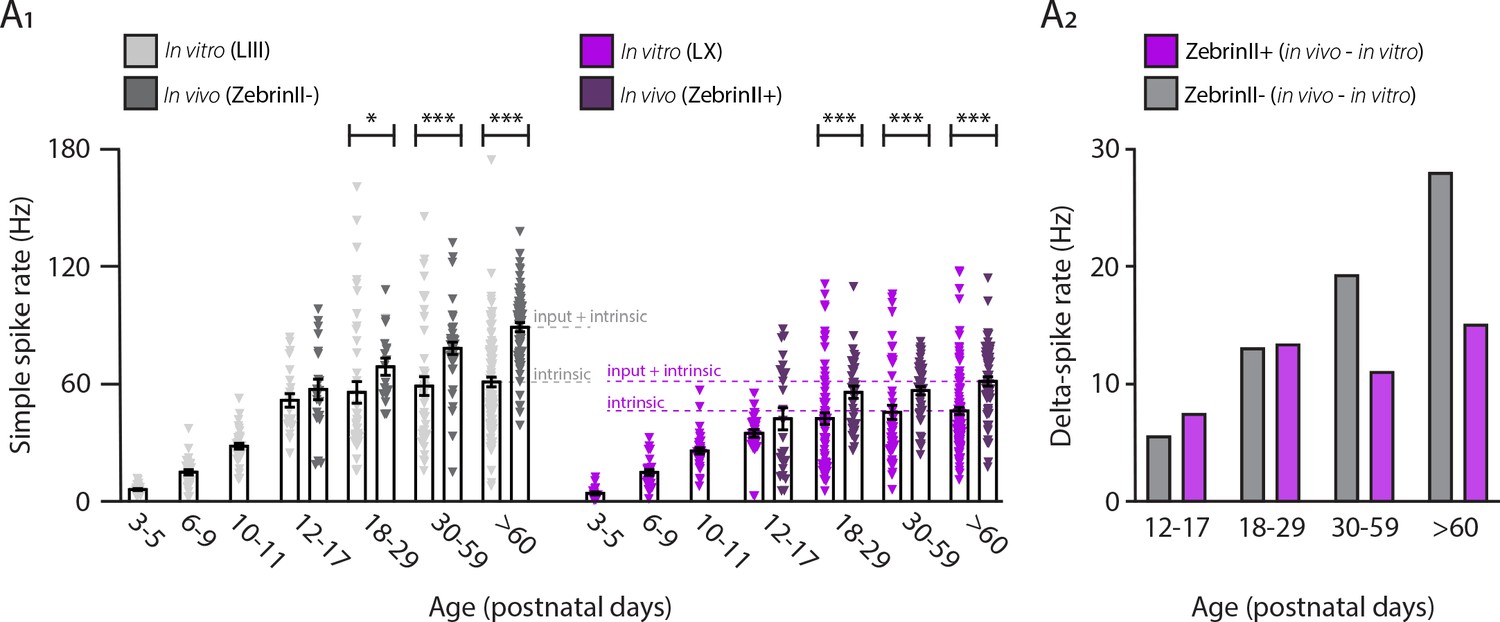
Lobule III and ZebrinII– Purkinje cell simple spike rate results from a higher intrinsic and input driven component when compared with lobule X and ZebrinII+ Purkinje cells.
(A1) Purkinje cell intrinsic simple spike rate recorded in vitro for lobule III Purkinje cells (gray) and lobule X Purkinje cells (purple) and Purkinje cell simple spike firing rate recorded in vivo for ZebrinII– Purkinje cells (gray) and ZebrinII+ Purkinje cells (purple). (A2) The input-driven spike rate is represented by delta-spike rate for ZebrinII– Purkinje cells (gray) and ZebrinII+ Purkinje cells (purple). Age groups: P3-5, P6-9, P10-11, P12-17, P18-29, P30-59, and >P60. Error bars represent SEM., for values see Supplementary file 1. * denotes p<0.05, **p<0.001, and ***p<0.0001.
Figure 3 with 1 supplement
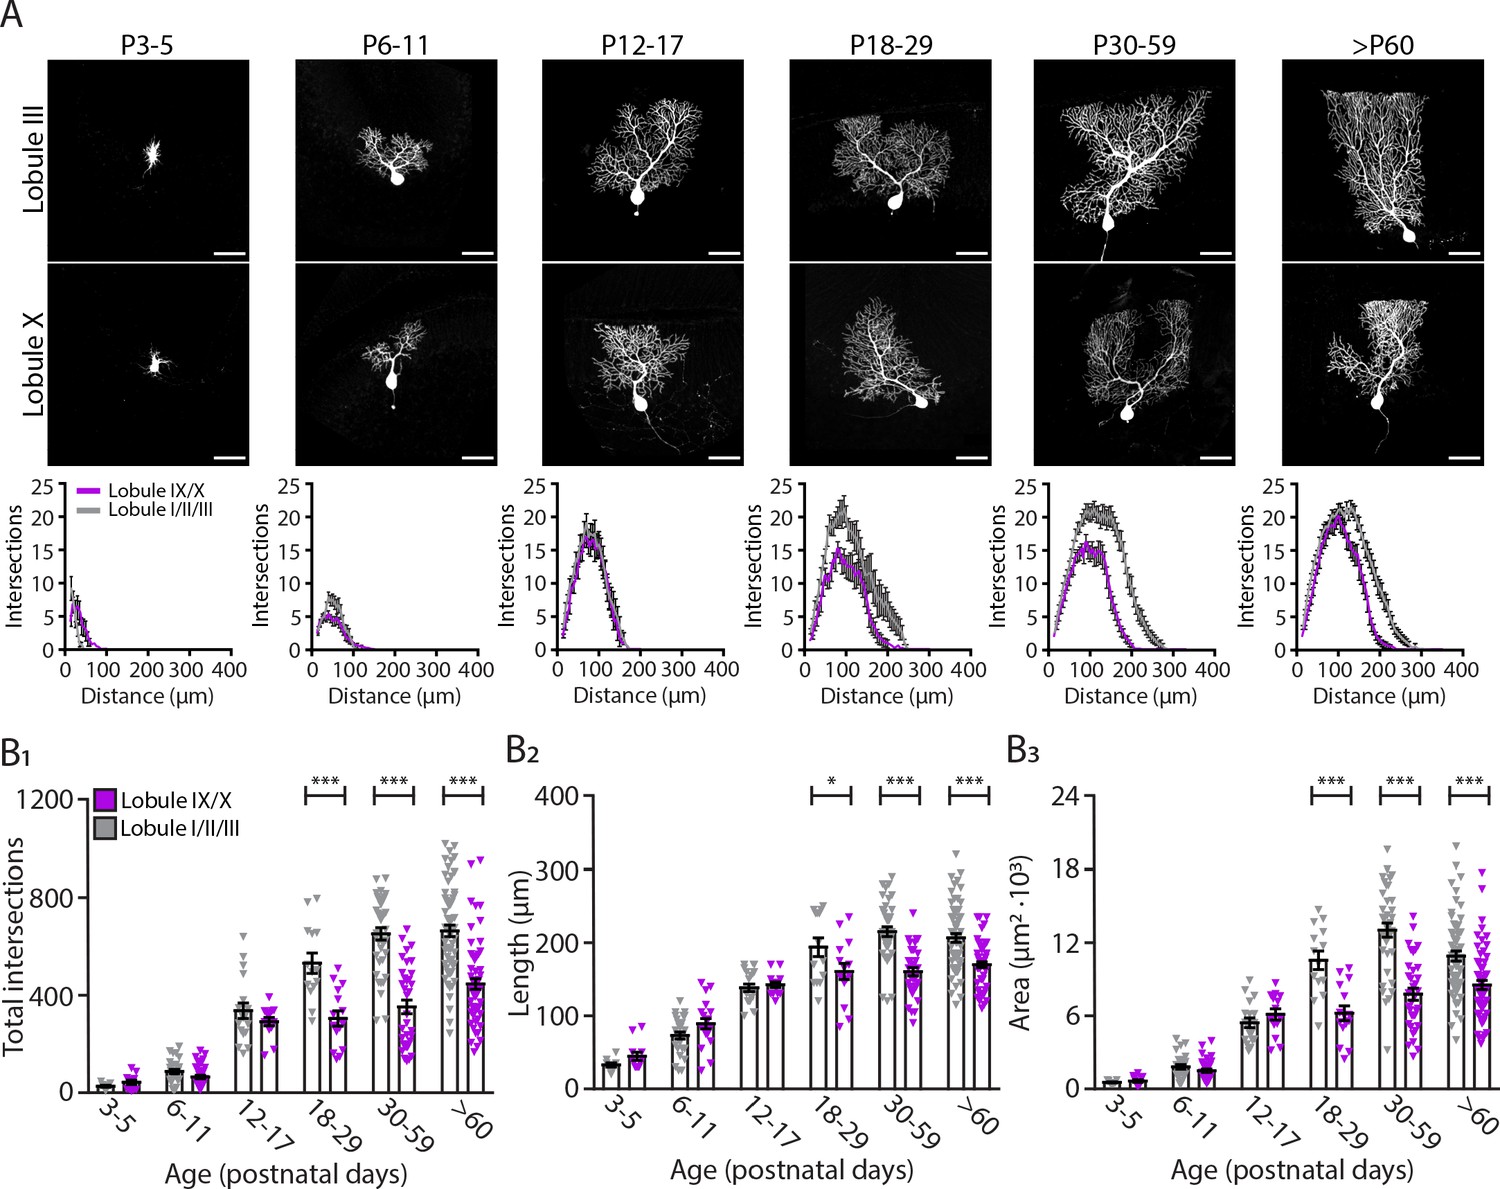
Purkinje cells located in the lobule III display a larger and elaborated dendritic tree.
(A) Photomicrographs of Purkinje cells filled with biocytin in lobule III and X (top panel); and sholl analysis of Purkinje cells located in lobules I/II/III (gray) or IX/X (purple) in six age groups (lower panel). (B1) Total number of intersections, (B2) longest dendrite length and (B3) area analysis for lobules I/II/III Purkinje cells (gray) and lobules IX/X Purkinje cells (purple) in six age groups. Age groups: P3-5, P6-11, P12-17, P18-29, P30-59, and >P60. Error bars represent SEM, for values see Supplementary file 1. * denotes p<0.05, **p<0.001, and ***p<0.0001. Scale bar = (A) 50 µm.
-
Figure 3—source data 1
Purkinje cell dendritic morphological source data 1.
- https://cdn.elifesciences.org/articles/63668/elife-63668-fig3-data1-v2.xlsx
Figure 3—figure supplement 1
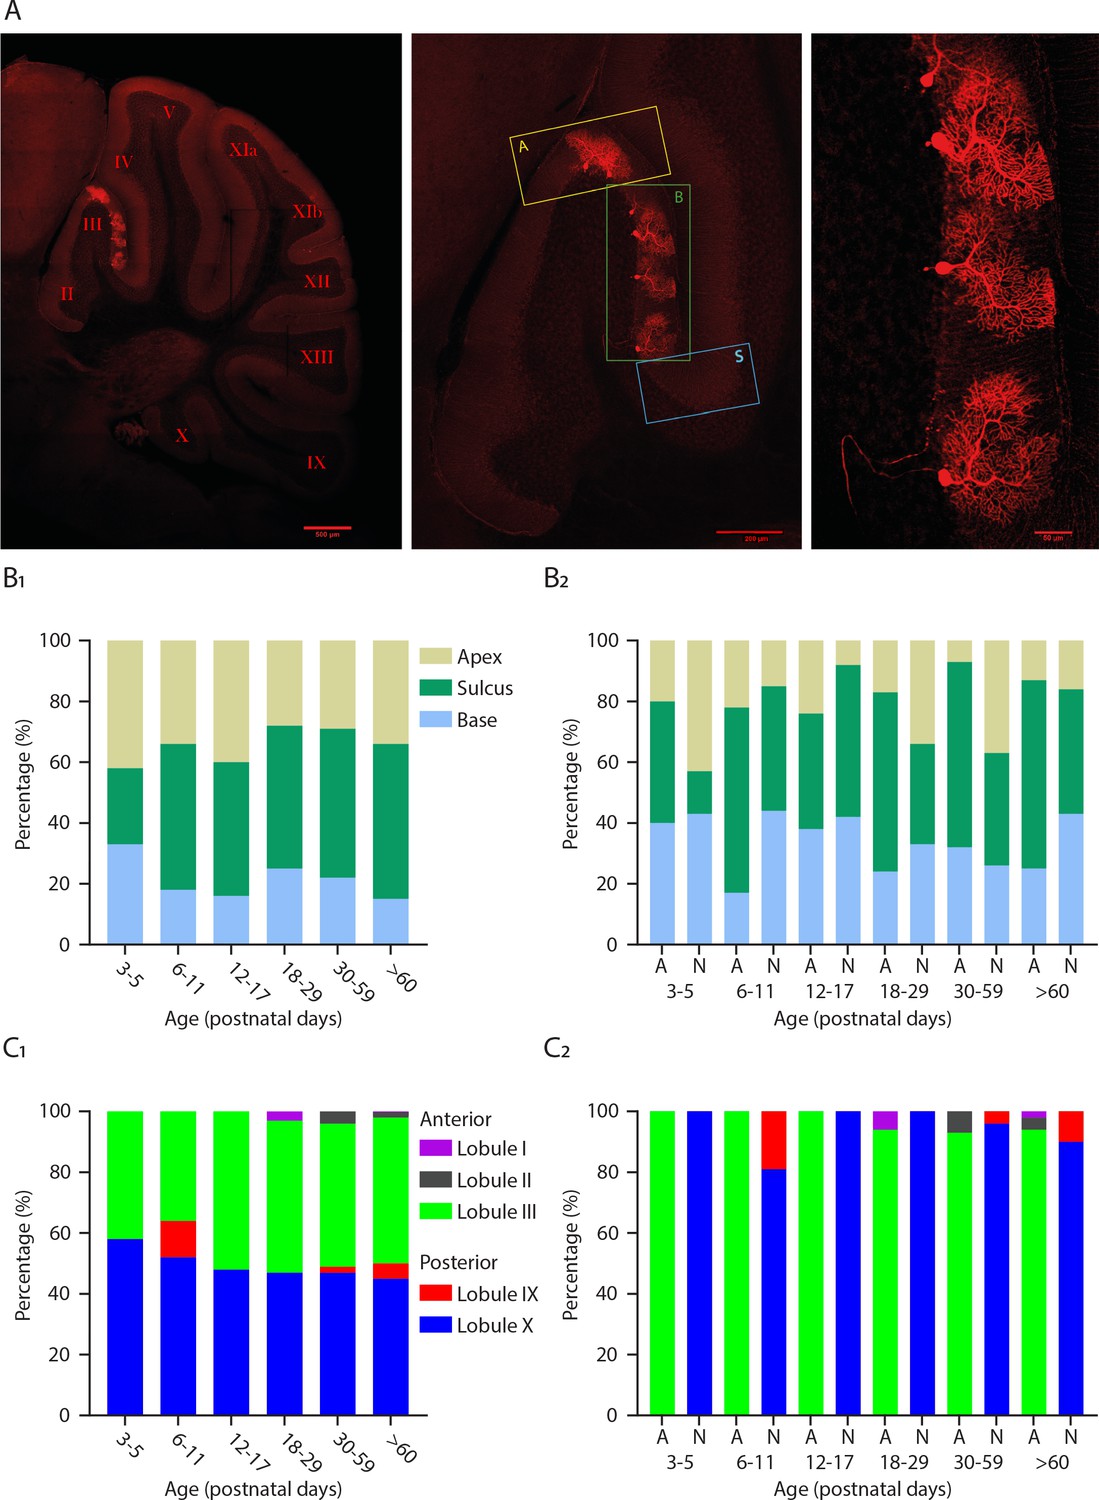
Purkinje cell location in the cerebellum within each lobule.
(A) Photomicrographs of Purkinje cells filled with biocytin in lobule III; regions within lobule III (A = apex; B = base; S = sulcus), Scale bar = 500, 200 and 50 µm. (B1) Percentage of Purkinje cells localized in the apex, sulcus or base at different developmental ages and (B2) percentage of Purkinje cells localized in the apex, sulcus or base at different developmental ages between A (anterior) and N (nodular) lobules. (C1) Percentage of Purkinje cells localized in anterior lobules I, II, and III and nodular lobules IX and X at different developmental ages and (C2) percentage of Purkinje cells localized in lobules I, II, and III and lobules IX and X at different developmental ages between A (anterior) and N (nodular) lobules.
-
Figure 3—figure supplement 1—source data 1
Apex, Base, Sulcus source data 1.
- https://cdn.elifesciences.org/articles/63668/elife-63668-fig3-figsupp1-data1-v2.xlsx
Figure 4
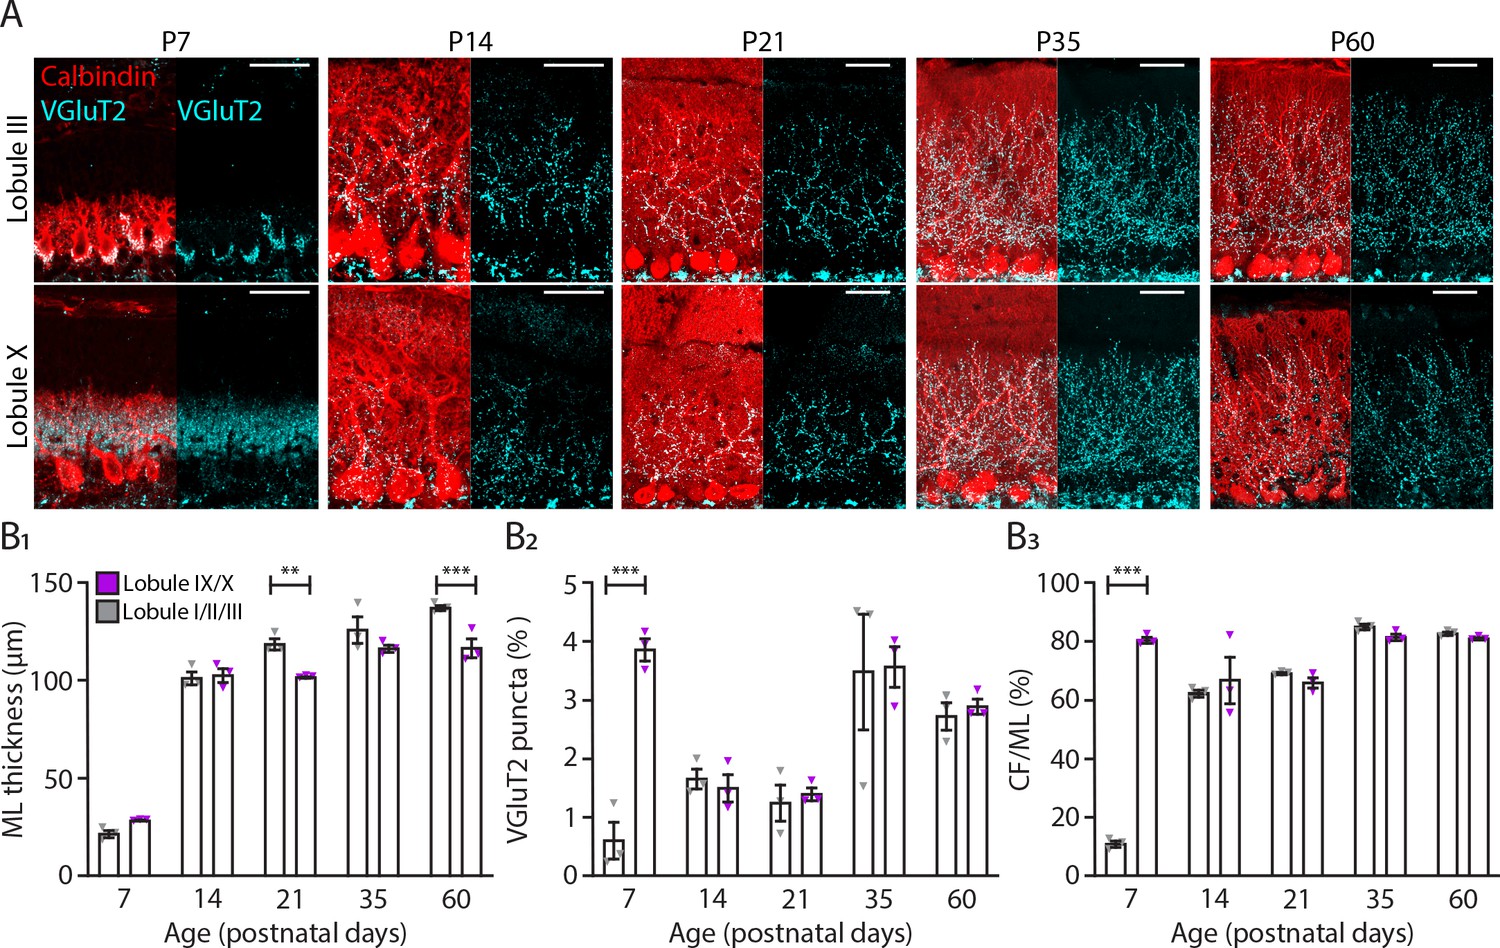
Translocation of climbing fibers occurs earlier in the nodular regions of the cerebellum.
(A) Photomicrographs of lobule III and lobule X regions depicting climbing fiber (VGluT2 staining, cyan) and Purkinje cell (calbindin, red) development in five age groups. (B1) Molecular layer (ML) thickness, (B2) VGluT2 puncta per area of region of interest and (B3) climbing fiber (CF) extension per ML thickness quantification for lobules I/II/III (gray) and lobules IX/X (purple) in five age groups. Age groups: P7, P14, P21, P35, and P60. Error bars represent SEM, for values see Supplementary file 1. * denotes p<0.05, **p<0.001, and ***p<0.0001. Scale bar = (A) 40 µm.
-
Figure 4—source data 1
VGluT2 puncta source data 1.
- https://cdn.elifesciences.org/articles/63668/elife-63668-fig4-data1-v2.xlsx
-
Figure 4—source data 2
Molecular layer thickness and climbing fiber height source data 2.
- https://cdn.elifesciences.org/articles/63668/elife-63668-fig4-data2-v2.xlsx
Figure 5 with 1 supplement

ZebrinII+ Purkinje cell axons are larger and less dense at all early postnatal ages.
(A) Photomicrographs of cerebellar sections demonstrating sparse labeling of Purkinje cells. Left panels are stained with antibodies against ZebrinII as well as red fluorescent protein (RFP) to label Purkinje cells expressing RFP. Right panels are stained with DAPI and RFP to show examples of Purkinje cells and Purkinje cell axon arbors (top inset and bottom inset, respectively) in sagittal and coronal cerebellar sections (top and bottom right panels, respectively). (B) Photomicrographs of example ZebrinII– and ZebrinII+ axon arbors from P10, P14, and P21 mice. (C) Sholl analysis of all axon arbors at P7, P10, P14, and P21, average crosses are indicated with points and fitted with a smoothed line. (D1-3) Sholl analyses of ZebrinII– and ZebrinII+ groups of axons at P10, P14, and P21, respectively. (E1) Total number of intersections, (E2) longest dendrite length and (E3) axon arbor area analysis for all axons at different ages. (F1) Total number of intersections, (F2) longest dendrite length and (F3) axon arbor area analysis for ZebrinII– (gray) and ZebrinII+ axon arbors (purple) at P10, P14, and P21. Error bars represent SEM., for values see Supplementary file 1. * denotes p<0.05, **p<0.001, and ***p<0.0001. Scale bars = (A) 500 µm in large panels; 20 µm in top inset, 50 µm in bottom inset. (B) 20 µm.
-
Figure 5—source data 1
Purkinje cell axonal morphological source data 1.
- https://cdn.elifesciences.org/articles/63668/elife-63668-fig5-data1-v2.xlsx
Figure 5—figure supplement 1
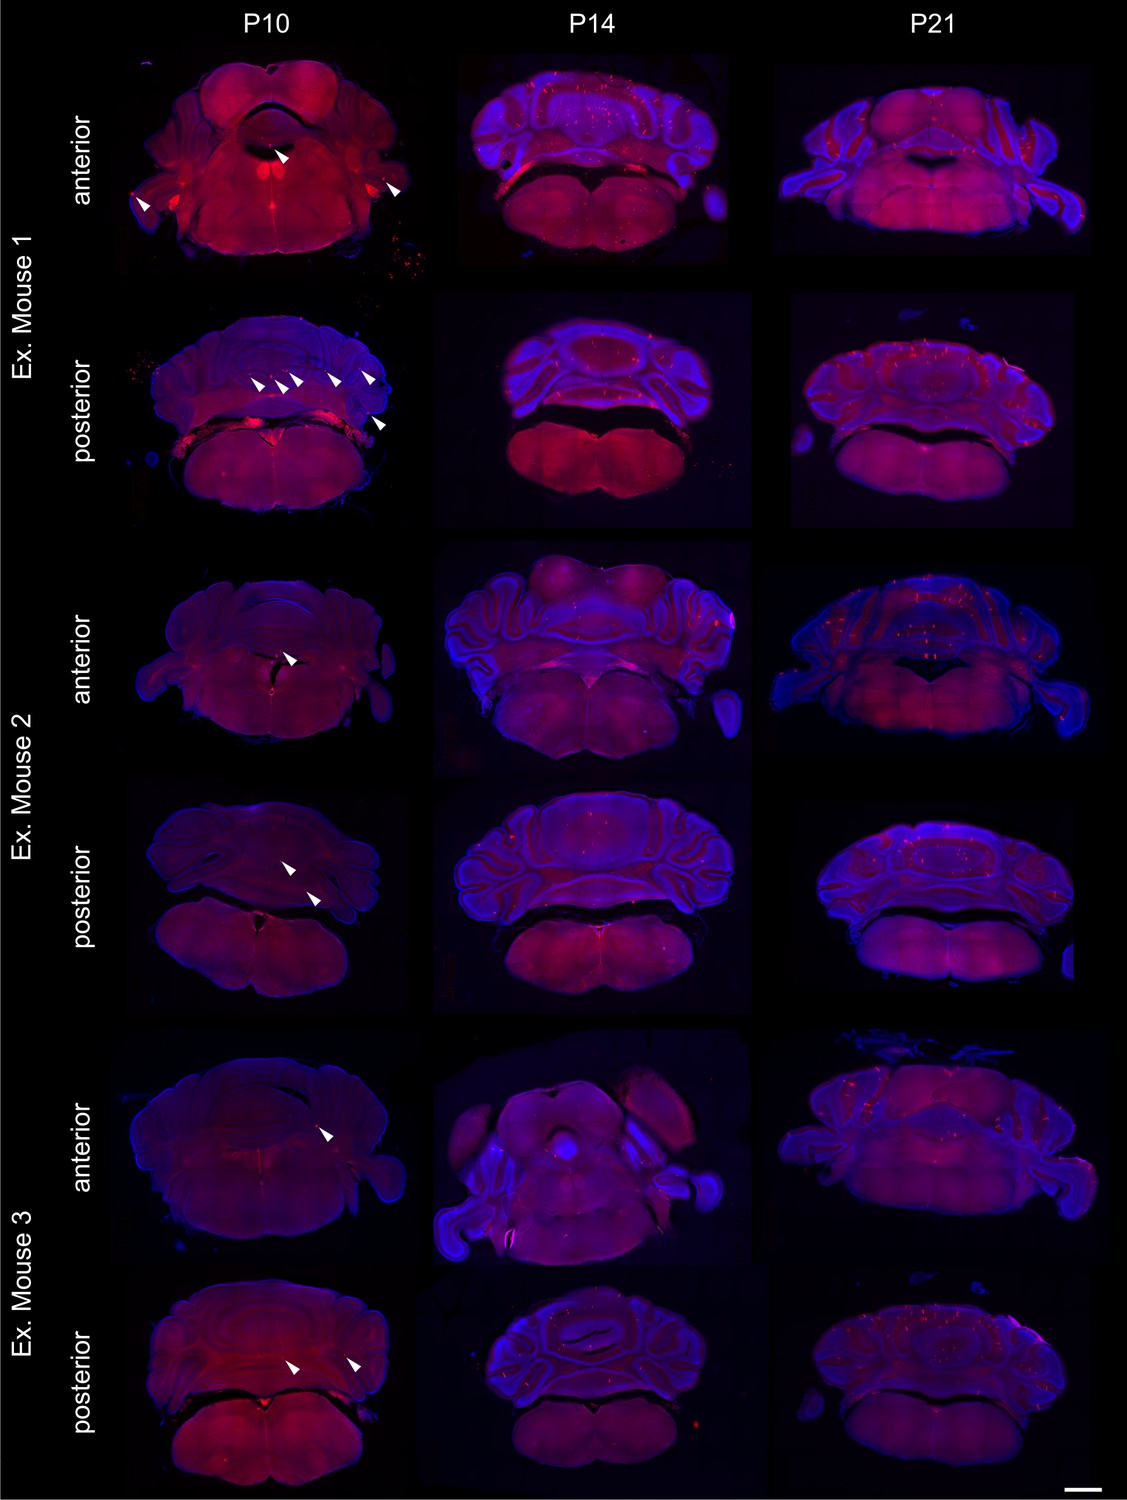
Random distribution of labeled Purkinje cells for axon analysis.
Sparsely labeled Purkinje cells are randomly distributed throughout the cerebellar cortex at P10, P14, and P21 as exemplified by three representative mice at each age. Purkinje cells are labeled with red fluorescent protein (RFP, red) and the structure of the sections are visible with DAPI (blue). A representative coronal section from the anterior and posterior cerebellum are shown for each mouse. White arrowheads indicate Purkinje cells at P10 when dendrites are not as developed. Purkinje cells in coronal sections are visible as planar lines at P14 and P21. Scale bar = 1 mm.
Figure 6 with 4 supplements

Differential development of cerebellar regions impacts the maturation of cerebellar-specific behaviors.
(A1) Schematic illustration of eye movement recording setup. Mice are head-fixed in the center of a turntable (green arrow) for vestibular stimulation and surrounded by a random dotted pattern drum (red arrow) for visual stimulation. A CCD camera was used for infrared (IR) video-tracking of the left eye (top left). Examples of nasal (N) and temporal (T) eye positions. Red circles = pupil fit; black cross = corneal reflection (CR); white cross = pupil (P) center. Example trace of eye position (gray) with drum position (red), during stimulation at an amplitude of 5° and frequency of 0.6 Hz (top right). Cerebellar circuitry controlling compensatory eye movements and their adaptation. Purkinje cells in the flocculus (FL) receive vestibular and visual input via the mossy fiber (MF) - parallel fiber (PF) system (green) and climbing fiber which influence eye movements via the vestibular nuclei (VN) and the oculomotor (OM) neurons. PN, pontine nuclei; GC, granule cell (bottom left). Photomicrograph of the flocculus a ZebrinII+ Purkinje cell predominant region; Purkinje cells labeled with Aldolase C (green) (bottom right). (A2) Results of 5 days of vestibule-ocular reflex (VOR) phase reversal training, probed by recording VOR (in the dark before, between and after sessions) with mice kept in the dark in between experimental sessions in young (P21-25, dotted line) and adult (P70-90, full line) mice. (B1) Schematic illustration of the eyeblink conditioning setup. Head-fixed mice on a freely moving treadmill, are presented a green LED light (conditioned stimulus, CS) followed several hundred milliseconds later by a weak air-puff on the eye (unconditioned stimulus, US). Eyelid movements were recorded with a camera (top). Cerebellar circuitry controlling eyeblink conditioning. Purkinje cells in the paravermal region around the primary fissure receive inputs carrying sensory information from for example the pontine nuclei (PN) through the mossy fiber-parallel fiber (MF-PF) pathway and the error signal from the inferior olive (IO) through the climbing fiber (CF). These Purkinje cells in turn influence eyelid muscles via the anterior interposed nucleus (AIN) and motor nuclei (MN) (bottom left). Photomicrograph of the base of paravermis a ZebrinII– Purkinje cell predominant region; Purkinje cells labeled with Aldolase C (green) (bottom right). (B2) As a result of repeated conditioned stimulus (CS)-unconditioned stimulus (US) pairings, mice will eventually learn to close their eye in response to the conditioned stimulus (CS), which is called the conditioned response (CR) (top). Percentage of conditioned response (CR%) in young (dotted line) and adult (full line) mice during 5 days of training (bottom). Error bars represent SEM., for values see Supplementary file 1. * denotes p<0.05, **p<0.001, and ***p<0.0001. Scale bars = (A) 200 µm.
-
Figure 6—source data 1
Eyeblink source data 1.
- https://cdn.elifesciences.org/articles/63668/elife-63668-fig6-data1-v2.xlsx
-
Figure 6—source data 2
Eye movement source data 2.
- https://cdn.elifesciences.org/articles/63668/elife-63668-fig6-data2-v2.xlsx
Figure 6—figure supplement 1
Compensatory eye movements in young and adult mice.
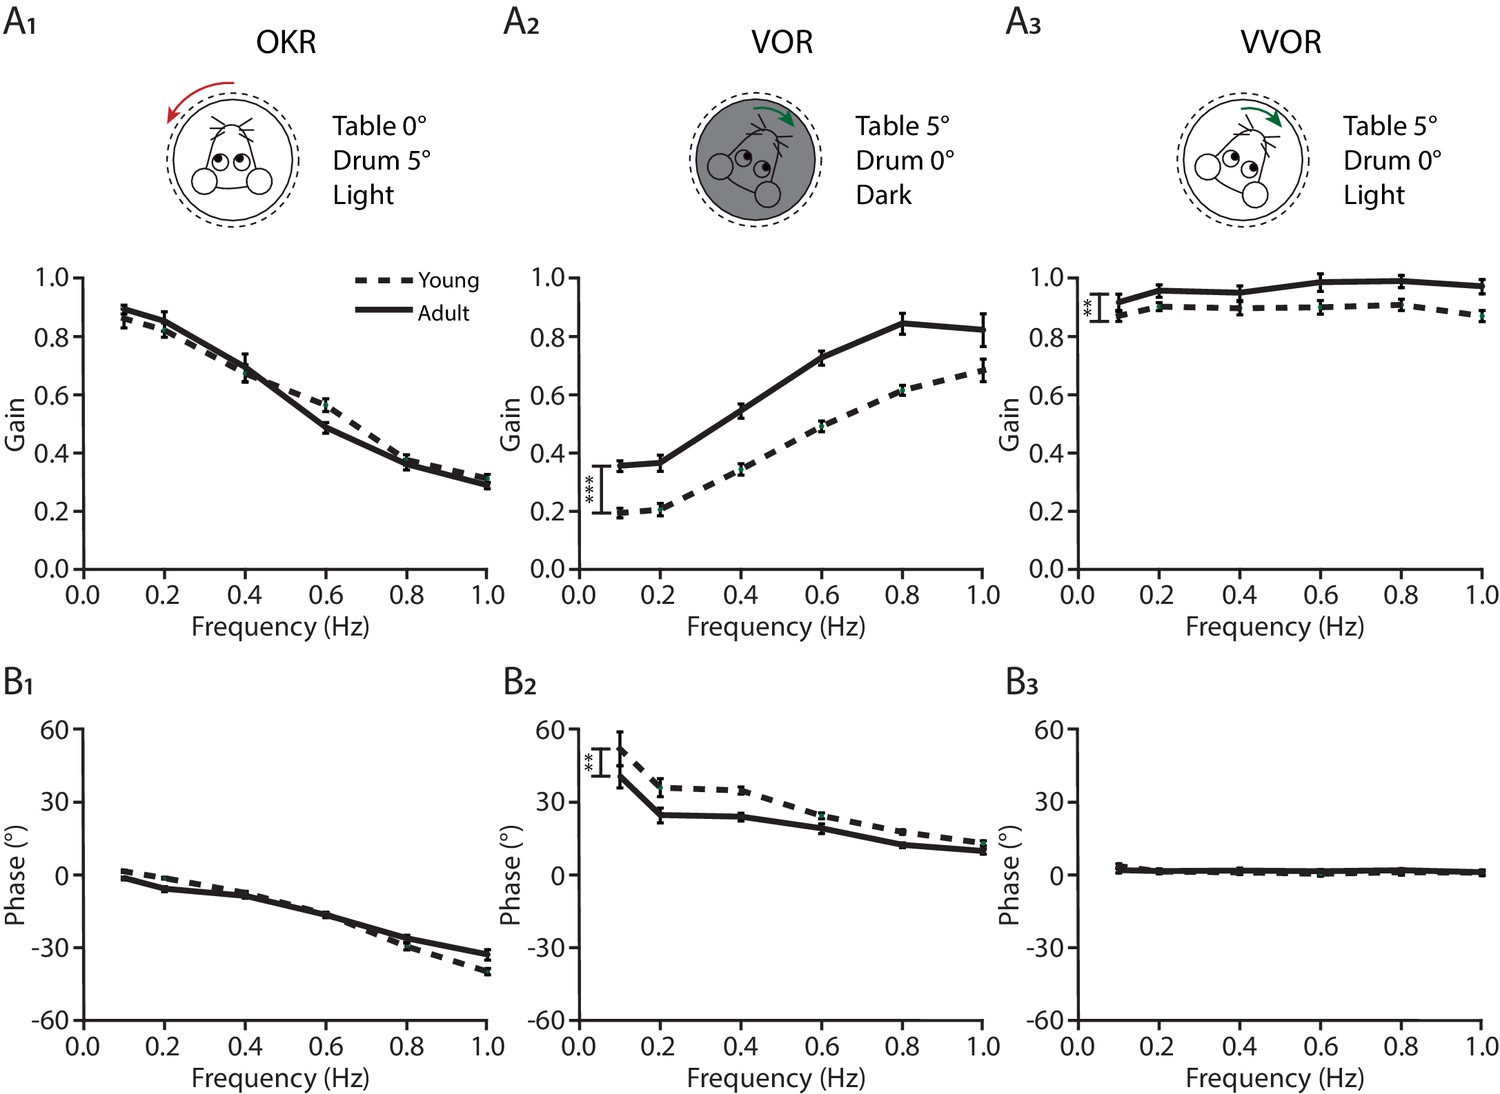
Gain (top) and phase (bottom) of baseline performance of compensatory eye movements: (A1 and B1) the optokinetic reflex (OKR), (A2 and B2) the vestibulo-ocular reflex (VOR) and (A3 and B3) the visually enhanced VOR (VVOR) in young (dotted line) and adult (full line) mice. Error bars represent SEM., for values see Supplementary file 1. * denotes p<0.05, **p<0.001 and ***p<0.0001.
Figure 6—figure supplement 2
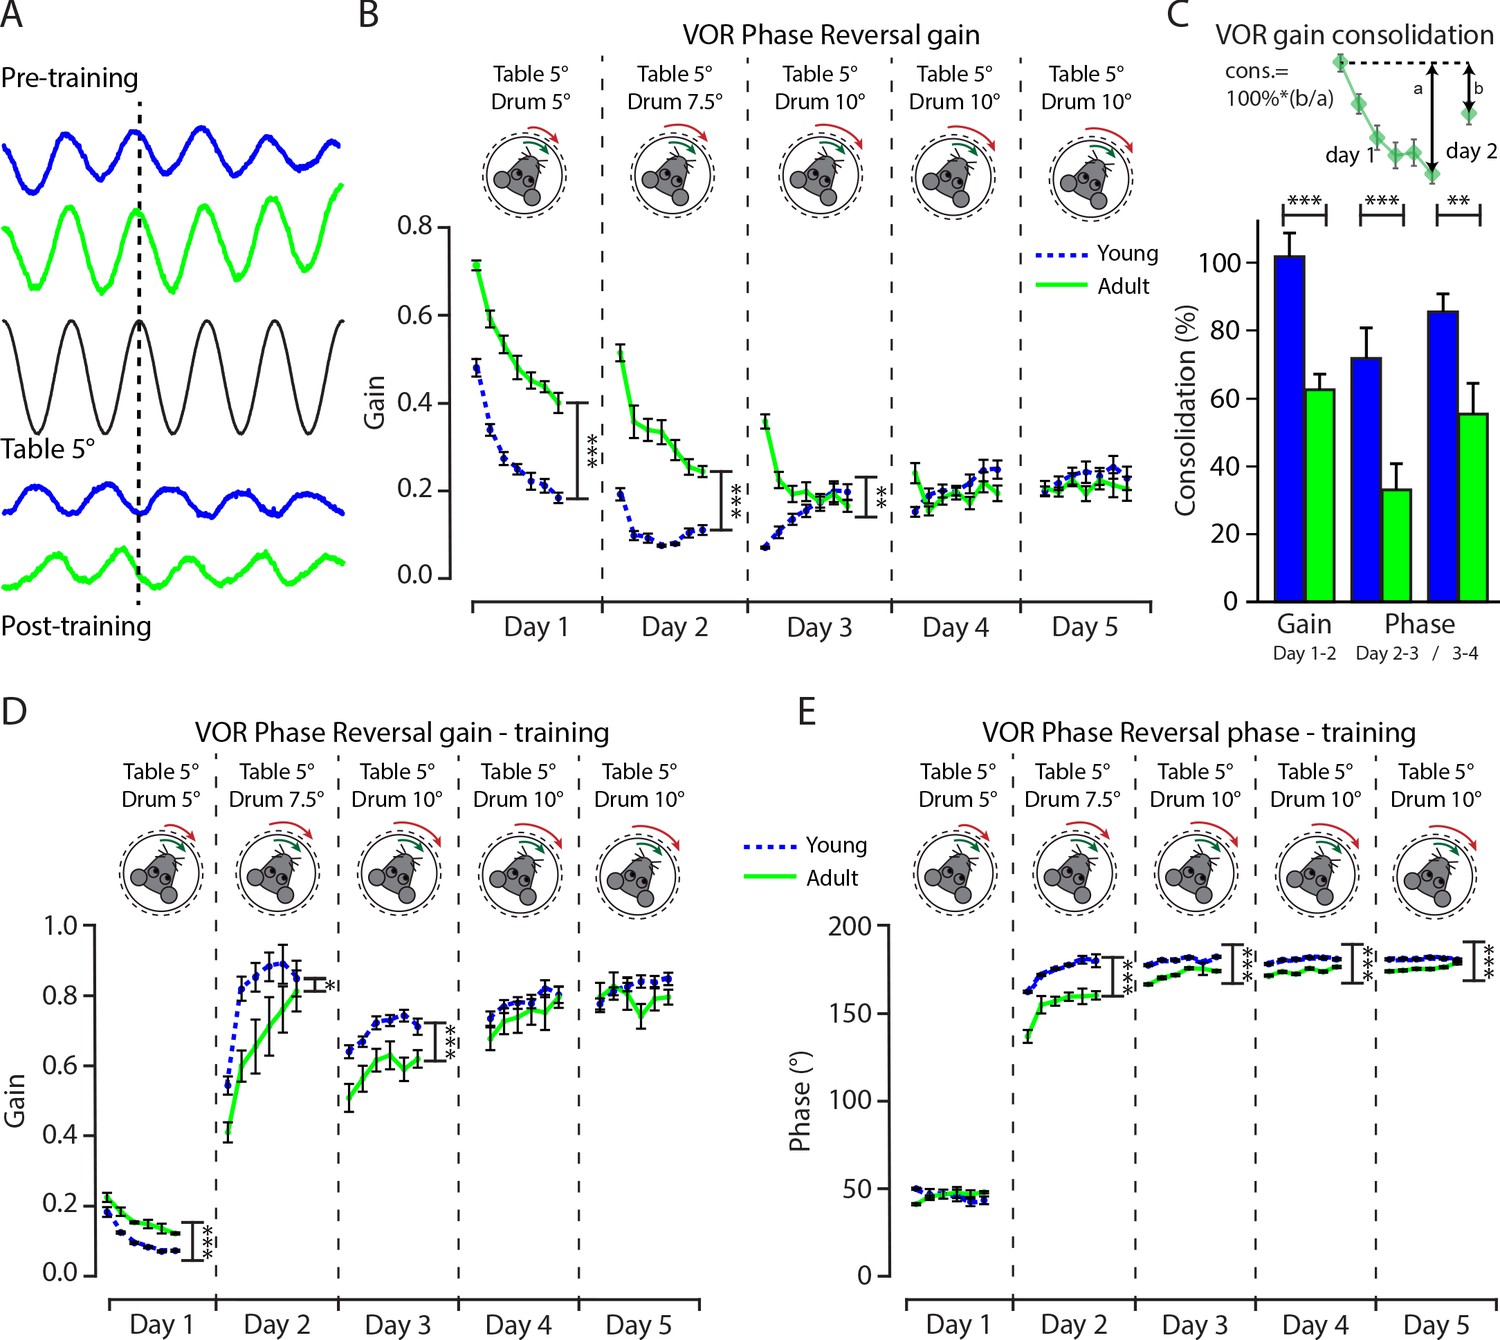
Vestibulo-ocular reflex phase reversal gain, overnight consolidation, and gaze during training differ between juvenile and adult mice.
(A) Example trace of eye movement position in young (blue) and adult (green) mice before and after training in relation with the table position (black) at an amplitude of 5°. (B) Gain of 5 days of vestibulo-ocular reflex (VOR) phase reversal, probed by recording VOR (in the dark before, between, and after sessions) with mice kept in the dark in between experimental sessions, in young (dotted line blue) and adult (full line green) mice. (C) Illustration of VOR gain consolidation analysis and the percentage of consolidation between young (blue) and adult (green) mice at days 1-2, 2–3, and 3–4. (D) Gain and (E) phase of 5 days of VOR phase reversal training, in young (dotted line blue) and adult (full line green) mice. Error bars represent SEM., for values see Supplementary file 1. * denotes p<0.05, **p<0.001, and ***p<0.0001.
Figure 6—figure supplement 3
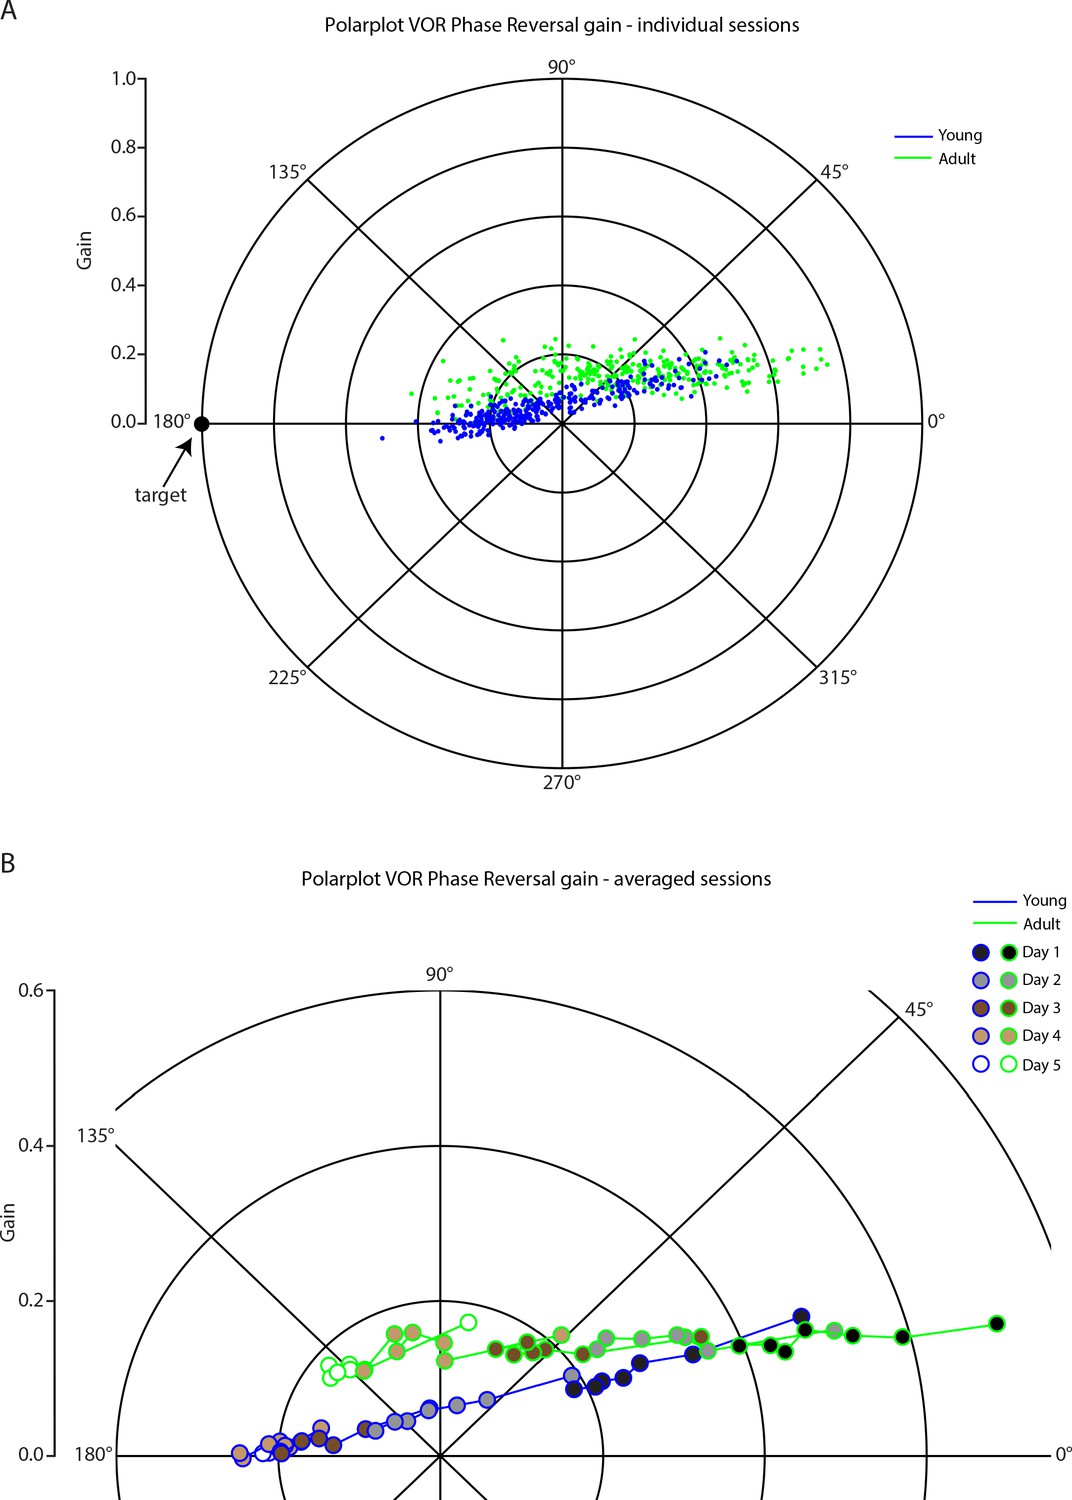
Polar plot for vestibulo-ocular reflex phase reversal gain.
Vestibulo-ocular reflex (VOR) phase reversal gain in (A) individual sessions and (B) averaged sessions per 5 days in young (blue) and adult (green) mice.
Figure 6—figure supplement 4
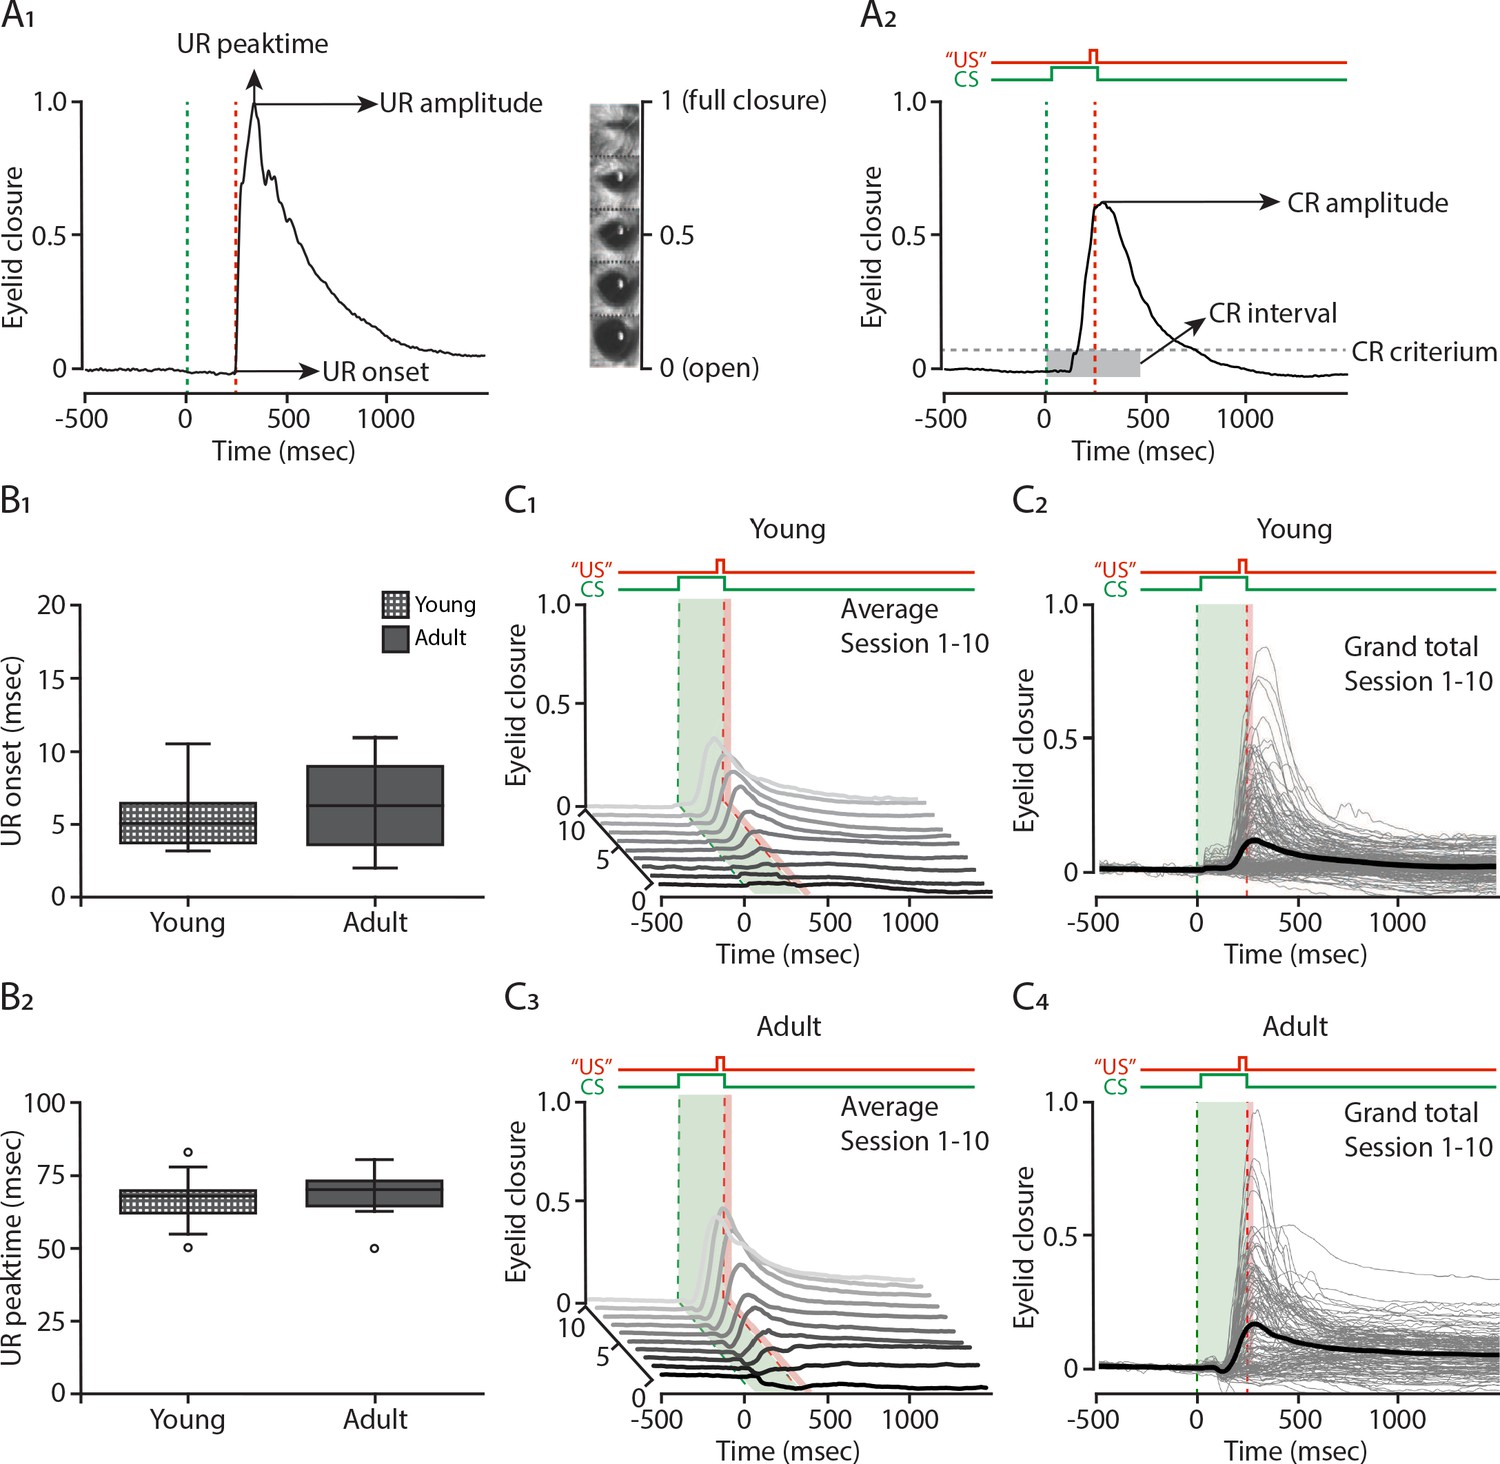
Eyeblink conditioning in young and adult mice.
(A1) Example traces of a single unconditioned response and (A2) a single conditioned response. Insets: mouse eye video captures show eyelid closure ranging from 0 (fully-open) to 1 (fully-closed). (B1) The onset and (B2) peak time of the unconditioned response (UR) in young (dotted square) and adult (full square) mice. Comparison of fraction of eyelid closure between young (top) and adult mice (bottom). (C1 and C3) Waterfall plot showing the averaged eyeblink trace during conditioned stimulus (CS)-only trials for the 10 sessions (color intensity increasing from sessions 1 to 10). (C2 and C4) Session averages (thin gray lines) per mouse and overall average (thick black lines) for the 10 sessions.
Figure 7
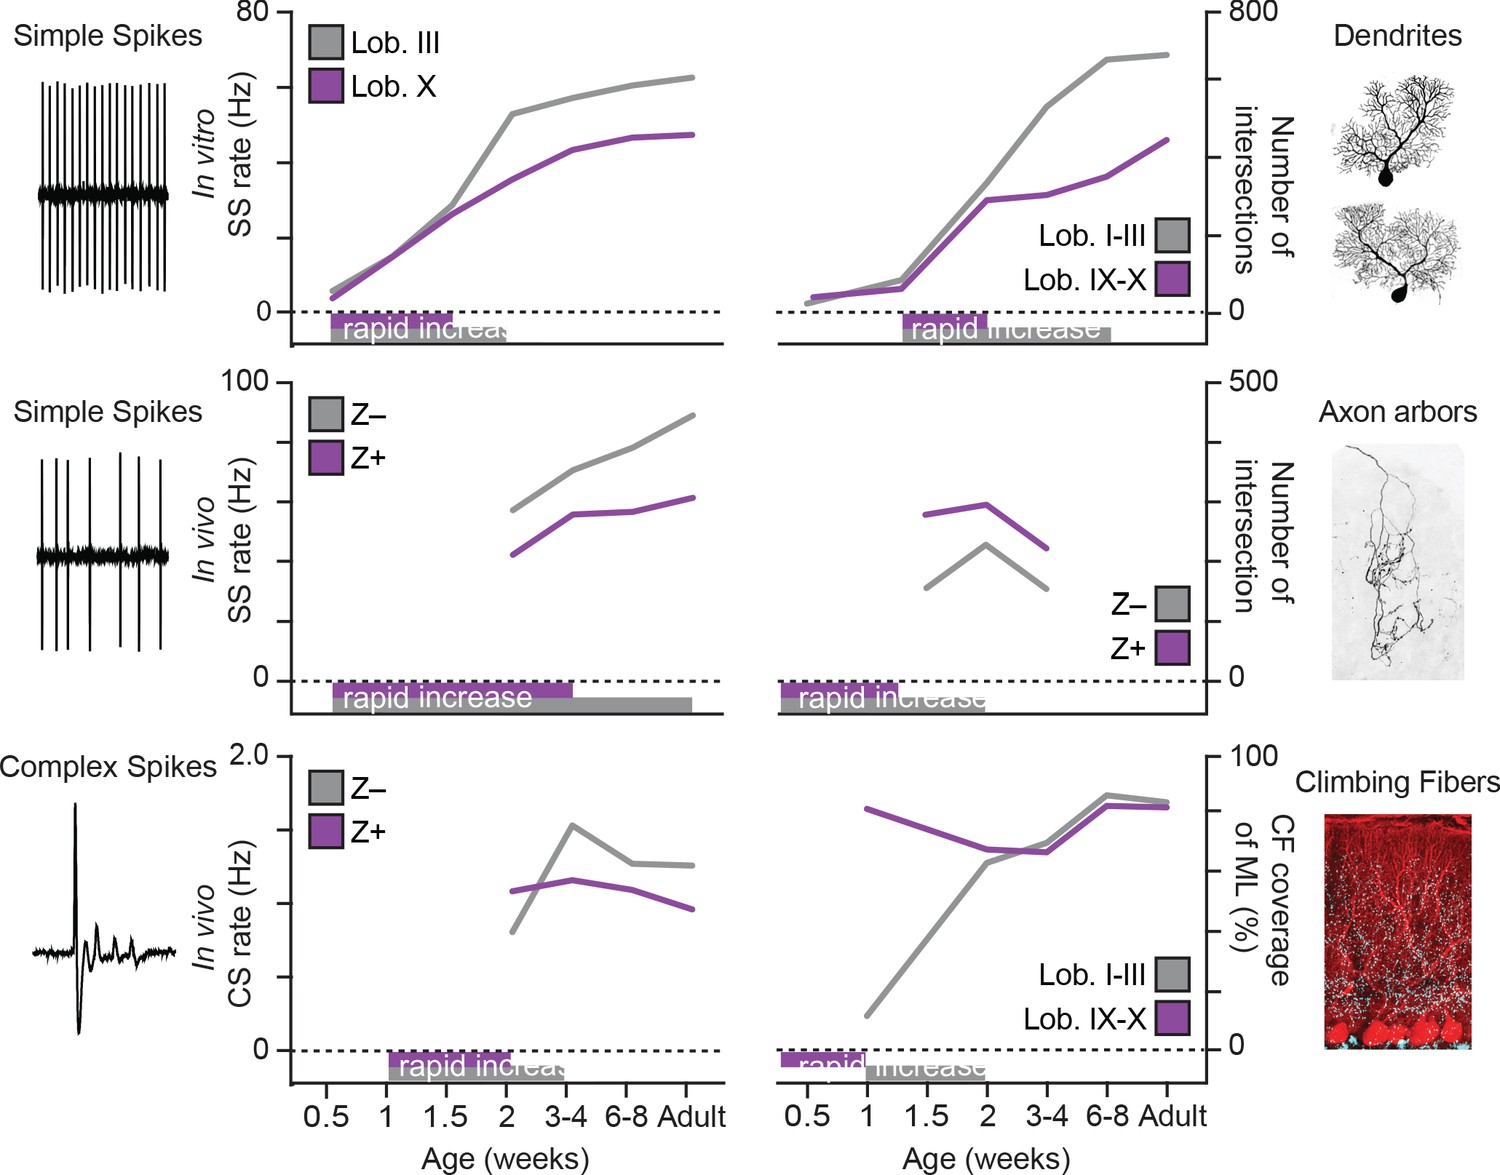
Summary of developmental timelines of Purkinje cell activity and morphology.
Left, selected features for physiological activity, represented by simple spike firing rate in vitro, simple spike rate in vivo and complex spike rate in vivo. Below the graphs periods of rapid development are indicated, either based on our data or by extrapolation when first recorded levels are already high, see e.g. simple spike rate in vivo. Right, selected morphological features, represented by dendritic shape, axonal shape (both as total number of intersections) and climbing fibers (as % of climbing occupation of molecular layer). Note that, although not all data points are available and extrapolation is required, the general trend emerging is that of rapid development in the second postnatal week (P7 to P14) and that Lobule III/ZebrinII– PCs typical complete rapid development later. Z– = ZebrinII negative, Z+ = ZebrinII positive, SS = simple spike, CS = complex spike.
Tables
Key resources table
| Reagent type (species) or resource | Designation | Source or reference | Identifiers | Additional information |
|---|---|---|---|---|
| Strain, strain background (Mus musculus) | Slc1a6-EGFP | Gong et al., 2003 | MMRRC: 012845-UCD | (Tg(Slc1a6-EGFP) HD185Gsat/Mmucd) |
| Strain, strain background (Mus musculus) | Pcp2-creERT2 | Institut Clinique de la Souris, France Jackson Laboratory | MGI:97508; ICS: 0273 | (Tg(Pcp2-creERT2)17.8.ICS) |
| Strain, strain background (Mus musculus) | Ai14 | The Jackson Laboratory | JAX: 007908 | (Gt(ROSA)26Sortm14(CAG-tdTomato)Hze/J) |
| Strain, strain background (Mus musculus) | C57BL/6 | The Jackson Laboratory Janvier Labs Charles River | JAX: 00055 Janvier: C57BL/6JRj CR: C57BL/6NCrl | |
| Antibody | Goat anti-ZebrinII/Aldolase C (Goat polyclonal) | Santa Cruz Biotechnology | Cat# sc-12065 RRID:AB_2242641 RRID:AB_2315622 | 1:1000 |
| Antibody | Mouse anti- Calbindin D-28K (Mouse monoclonal) | Swant | Cat# 300 RRID:AB_10000347 | 1:10,000 |
| Antibody | Guinea pig anti-VGluT2 (Guinea pig polyclonal) | Millipore | Cat# AB2251-l RRID:AB_2665454 | 1:2000 |
| Antibody | Rabbit anti-RFP (Rabbit polyclonal) | Rockland | Cat# 600-401-379 RRID:AB_2209751 | 1:1000 |
| Antibody | Cy3 Streptavidin | Jackson ImmunoResearch | Cat# 016-160-084 RRID:AB_233724 | 1:1000 |
| Antibody | Cy3-AffiniPure Donkey anti-Mouse (Mouse polyclonal) | Jackson ImmunoResearch | Cat# 715-165-150 RRID:AB_2340813 | 1:1000 |
| Antibody | Alexa Fluor 488-AffiniPure Donkey anti-Guinea Pig (Guinea pig polyclonal) | Jackson ImmunoResearch | Cat# 706-545-148 RRID:AB_2340472 | 1:1000 |
| Antibody | Donkey anti-goat Daylight 488 (Goat polyclonal) | Jackson ImmunoResearch | Cat# 705-486-147 RRID:AB_2616594 | 1:500 |
| Antibody | Cy3-AffiniPure Donkey Anti-Rabbit (Rabbit polyclonal) | Jackson ImmunoResearch | Cat# 711-165-152 RRID:AB_2307443 | 1:500 |
| Chemical compound, drug | 4’,6-Diamidine-2’-phenylindole dihydrochloride (DAPI) | Thermo Fisher Scientific | Cat# D3571 RRID:AB_2307455 | |
| Chemical compound, drug | Paraformaldehyde (PFA) | Millipore | Cat# 104005 | 4% |
| Chemical compound, drug | Biocytin | Sigma-Aldrich | Cat# B4261 | 1% |
| Chemical compound, drug | Evans Blue | Sigma-Aldrich | Cat# E2129 | 0.5% |
| Chemical compound, drug | Picrotoxin | Hello Bio Ltd | Cat# HB0506 | 100 µM |
| Chemical compound, drug | NBQX | Hello Bio Ltd | Cat# HB0442 | 10 µM |
| Chemical compound, drug | D-AP5 | Hello Bio Ltd | Cat# HB0225 | 50 µM |
| Chemical compound, drug | Mineral oil | Sigma-Aldrich | Cat# M3516 | |
| Chemical compound, drug | Tamoxifen | Sigma-Aldrich | Cat# T5648 | |
| Software, algorithm | FIJI (ImageJ) | National Institute of Health | RRID:SCR_002285 | |
| Software, algorithm | MATLAB 2008, 2016 | MathWorks | RRID:SCR_001622 | |
| Software, algorithm | ZEN digital Imaging for Light Microscopy | ZEISS | RRID:SCR_013672 | |
| Software, algorithm | Leica Application Suite X (LAS X) | Leica Microsystems | RRID:SCR_013673 | |
| Software, algorithm | Clampfit 10 | Molecular Devices | RRID:SCR_011323 | |
| Software, algorithm | Patchmaster | HEKA Electronics | RRID:SCR_000034 | |
| Software, algorithm | GraphPad Prism | GraphPad Software | RRID:SCR_002798 | |
| Software, algorithm | Compensatory eye movements analysis | Schonewille group | https://github.com/MSchonewille/iMove | |
| Software, algorithm | Eyeblink conditioning analysis | Neurasmus B.V. Rotterdam | RRID:SCR_021043 | |
| Other | Leica SM2000 R sliding microtome | Leica Biosystems | RRID:SCR_018456 | |
| Other | P-1000 Puller | Sutter Instrument | RRID:SCR_021042 | |
| Other | LSM 700 laser scanning confocal | ZEISS | RRID:SCR_017377 | |
| Other | SP5 confocal | Leica Microsystems | RRID:SCR_020233 | |
| Other | SP8 confocal | Leica Microsystems | RRID:SCR_018169 | |
| Other | Axio Imager.M2 | ZEISS | RRID:SCR_018876 |
Additional files
-
Supplementary file 1
Data for in vivo, in vitro electrophysiology, anatomical and behavioral quantifications.
Descriptive values are represented as mean ± SEM. p=postnatal, Z−=ZebrinII negative, Z+=ZebrinII positive, LIII = lobule III, LX = lobule X, LI-III = lobules I/II/III, LIX-X = lobules IX/X.
- https://cdn.elifesciences.org/articles/63668/elife-63668-supp1-v2.docx
-
Transparent reporting form
- https://cdn.elifesciences.org/articles/63668/elife-63668-transrepform-v2.docx
Download links
A two-part list of links to download the article, or parts of the article, in various formats.
Downloads (link to download the article as PDF)
Open citations (links to open the citations from this article in various online reference manager services)
Cite this article (links to download the citations from this article in formats compatible with various reference manager tools)
Differential spatiotemporal development of Purkinje cell populations and cerebellum-dependent sensorimotor behaviors
eLife 10:e63668.
https://doi.org/10.7554/eLife.63668


