The Hippo pathway controls myofibril assembly and muscle fiber growth by regulating sarcomeric gene expression
- Aix Marseille University, CNRS, IBDM, Turing Center for Living Systems, France
- Max Planck Institute of Biochemistry, Germany
- Institute of Bioengineering, School of Life Sciences, École Polytechnique Fédérale de Lausanne (EPFL), Switzerland
Figures
Figure 1 with 1 supplement
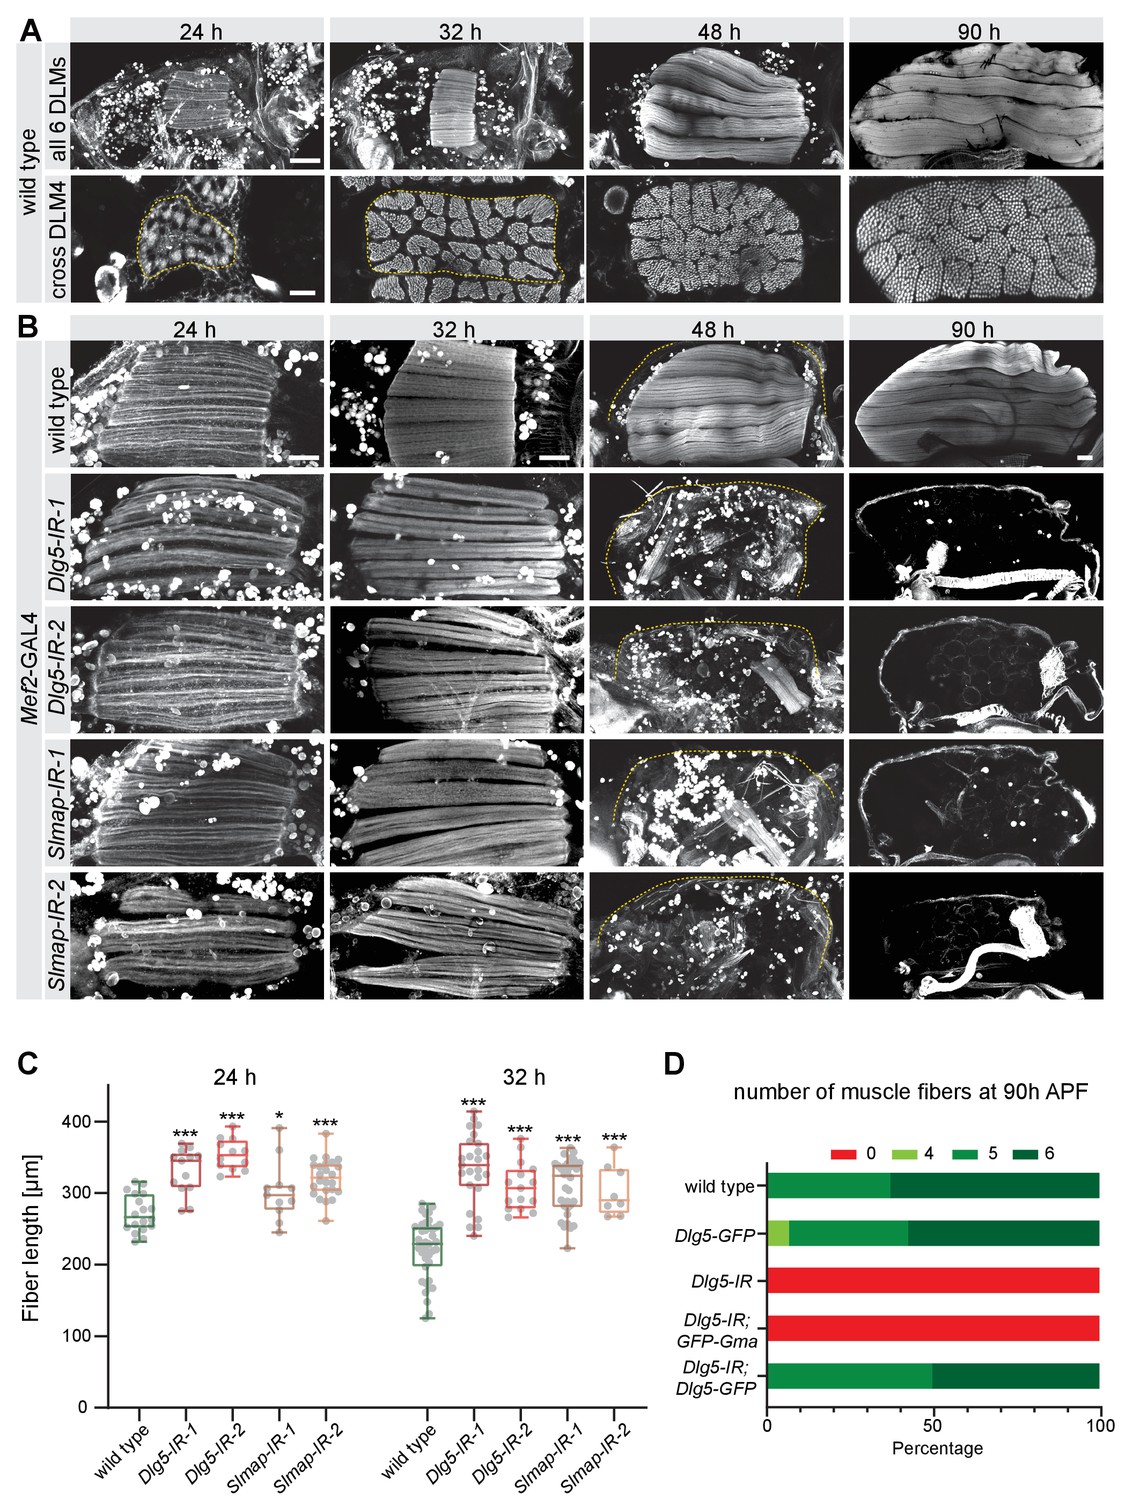
Dlg5 and Slmap are essential for flight muscle morphogenesis.
(A) Time-course of wild-type dorsal longitudinal indirect flight muscle (DLM) development. Longitudinal sections (upper panel) of all DLMs and cryo cross-sections (lower panel) of DLM4 were stained for actin. Note the muscle fiber growth in length and width. Scale bars represent 100 µm for longitudinal and 10 µm for cross-sections. (B) Longitudinal views of developing flight muscles at 24 hr, 32 hr, 48 hr, and 90 hr after puparium formation (APF) of wild-type, Dlg5, or Slmap knockdown genotypes (independent RNAi lines IR-1 and 2) stained for actin. Note that Dlg5-IR and Slmap-IR muscles are too long at 24 hr and 32 hr APF, and are lost after 32 hr APF. The dotted lines highlight the cuticle. Scale bars represent 50 µm. (C) Box plot showing flight muscle fiber length at 24 hr and 32 hr APF of the indicated genotypes. Each dot represents the average flight muscle length from one pupa (see Materials and methods). Box extends from 25% to 75%, line marks median, whiskers extend from max to min, all data points superimposed. Student’s t-test, *** p-value<0.001, *p value < 0.05. All following box plots are plotted the same way. N ≥ 8 pupae for each genotype. (D) Number of flight muscle fibers in half thoraces at 90 hr APF of the indicated genotypes. Note that UAS-Dlg5-GFP but not UAS-GFP-Gma rescues the fiber atrophy phenotype of Dlg5 knockdown (Dlg1-IR-1, in all the following figures IR refers to IR-1).
Figure 1—figure supplement 1

Dlg5 and Slmap proteins are conserved and required for flight.
(A) Protein domain organisation comparing Drosophila Dlg5 to human Dlg5 and Drosophila Dlg1 (isoform M), as well as Drosophila Slmap to human Slmap. Note the conservation of Dlg5 and Slmap between Drosophila and human. PDZ: PSD95/Dlg1/ZO-1 domain; SH3: SRC Homology 3; L27 domain; GuKc: Guanylate kinase domain; FHA: Forkhead associated domain. (B) Viability and flight tests of wild type (Mef2-GAL4 control) as well as Dlg5 or Slmap knock-down genotypes. Note that knock-down for each of both genes results in viable but flightless adult flies.
Figure 2 with 1 supplement
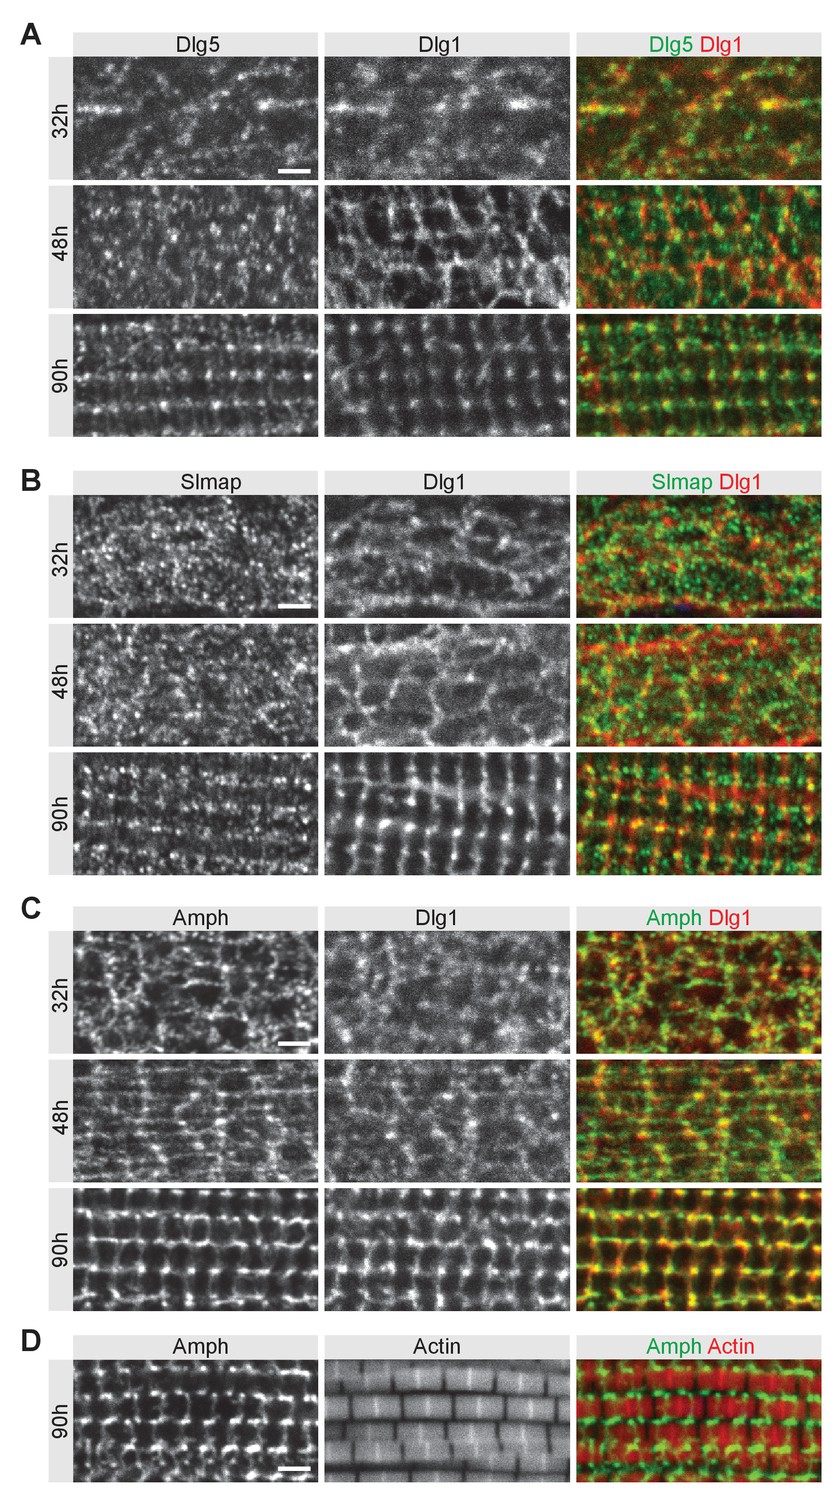
Dlg5 and Slmap partially co-localise with Dlg1 during T-tubule morphogenesis.
(A–C) Wild-type developing flight muscles at 32 hr, 48 hr, and 90 hr after puparium formation (APF) co-stained for T-tubule marker Dlg1 with Dlg5 (A) or Slmap (B) or with another T-tubule marker Amphiphysin (C). (D) Wild-type flight muscles at 90 hr APF co-stained for Amphiphysin and actin with phalloidin. Scale bars represent 2 µm.
Figure 2—figure supplement 1
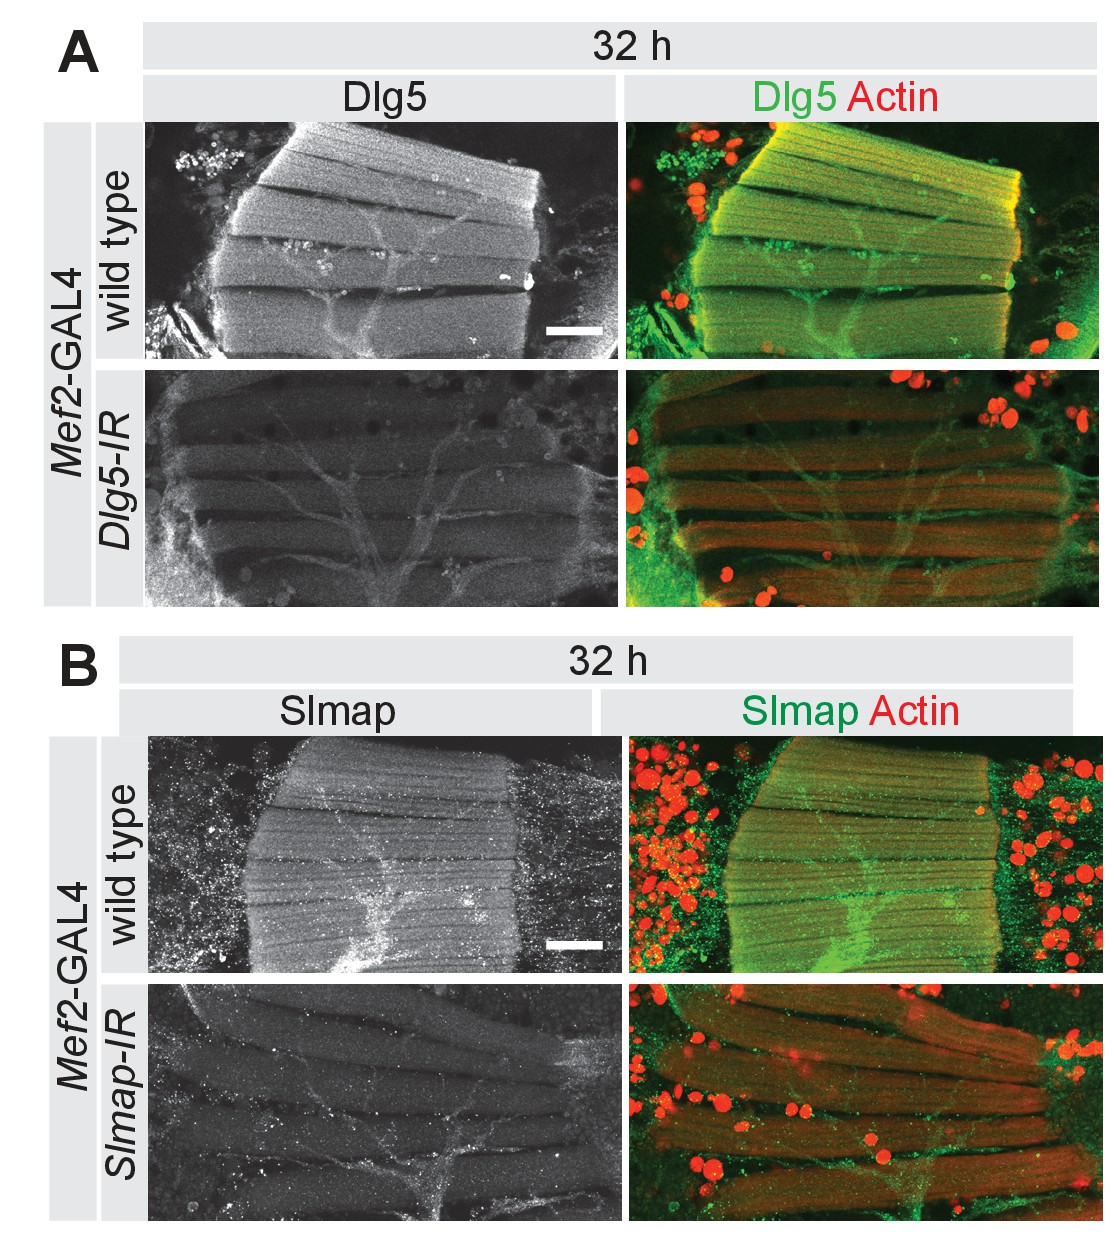
Dlg5 and Slmap protein knock-down efficiency.
(A, B) Longitudinal sections of all DLMs at 32 after puparium formation (APF) comparing wild type to (A) Dlg5-IR and (B) Slmap-IR muscle fibers, stained for actin and Dlg5 (A) or Slmap (B). Note the decreased levels of antibody labelling in knock-down muscles. Scale bars represent 50 µm.
Figure 3
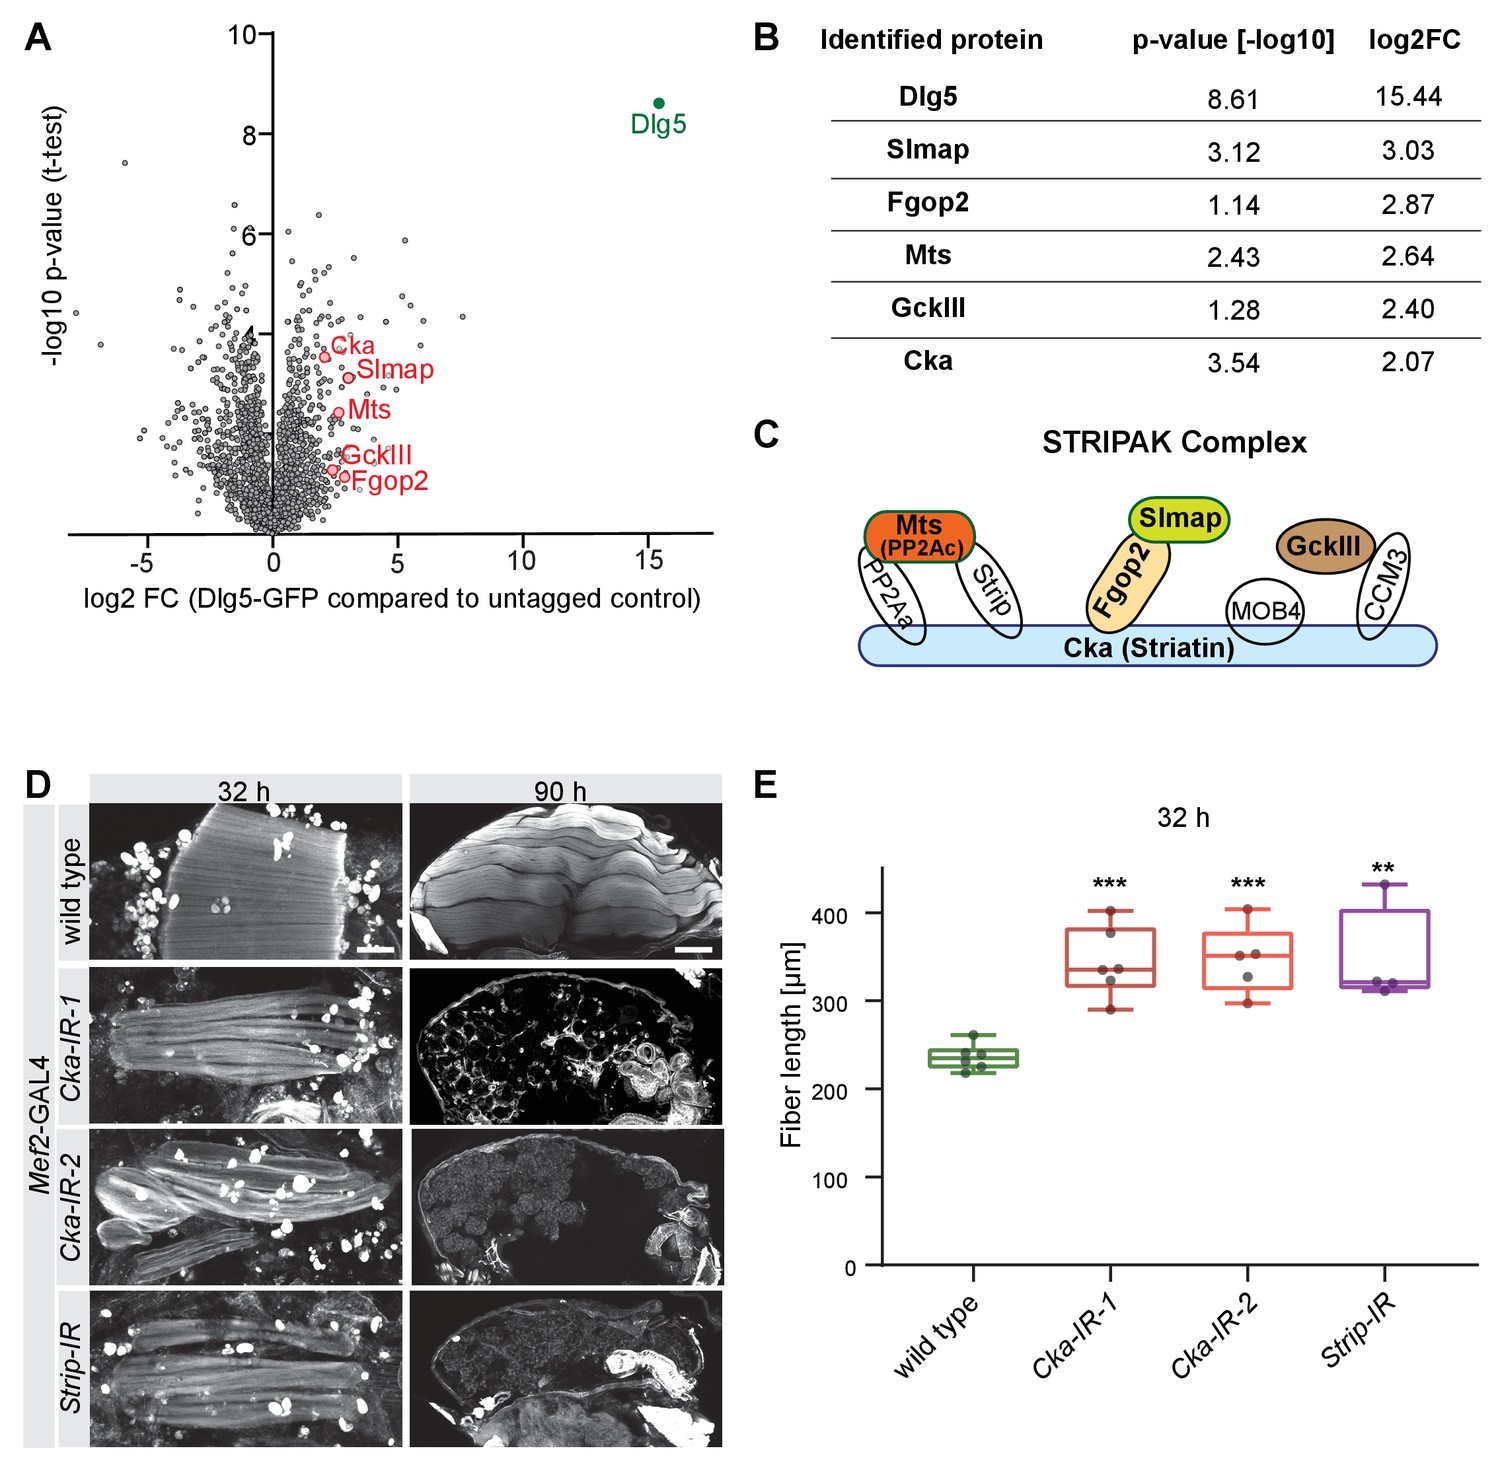
Dlg5 binds to the STRIPAK complex.
(A) Volcano plot showing proteins enriched in GFP pull-down from Mef2-GAL4, UAS-Dlg5-GFP 24 hr - 48 hr after puparium formation (APF) pupae. Y-axis shows statistical significance (-log10) and x-axis the log2fold change (FC) compared to Mef2-GAL4 control (see Supplementary file 1). STRIPAK complex components are highlighted in red. (B) Table showing the log2fold change and p-values of the selected STRIPAK complex components. (C) Simplified schematic of the STRIPAK complex (adapted from Duhart and Raftery, 2020). Proteins identified in the Dlg5-GFP pull-down are coloured. (D) Flight muscles at 32 hr and 90 hr APF of wild type, Cka (independent RNAi lines IR-1 and 2) or Strip knockdown genotypes stained for actin. Note the compaction defect at 32 hr APF followed by muscle atrophy. Scale bars represent 50 µm for 32 hr and 100 µm for 90 hr APF. (E) Box plot showing dorsal-longitudinal flight muscle (DLM) fiber length at 32 hr APF of the indicated genotypes. Each dot is the average from one pupa. Student’s t-test, *** p-value<0.001, ** p-value<0.01.
Figure 4 with 1 supplement
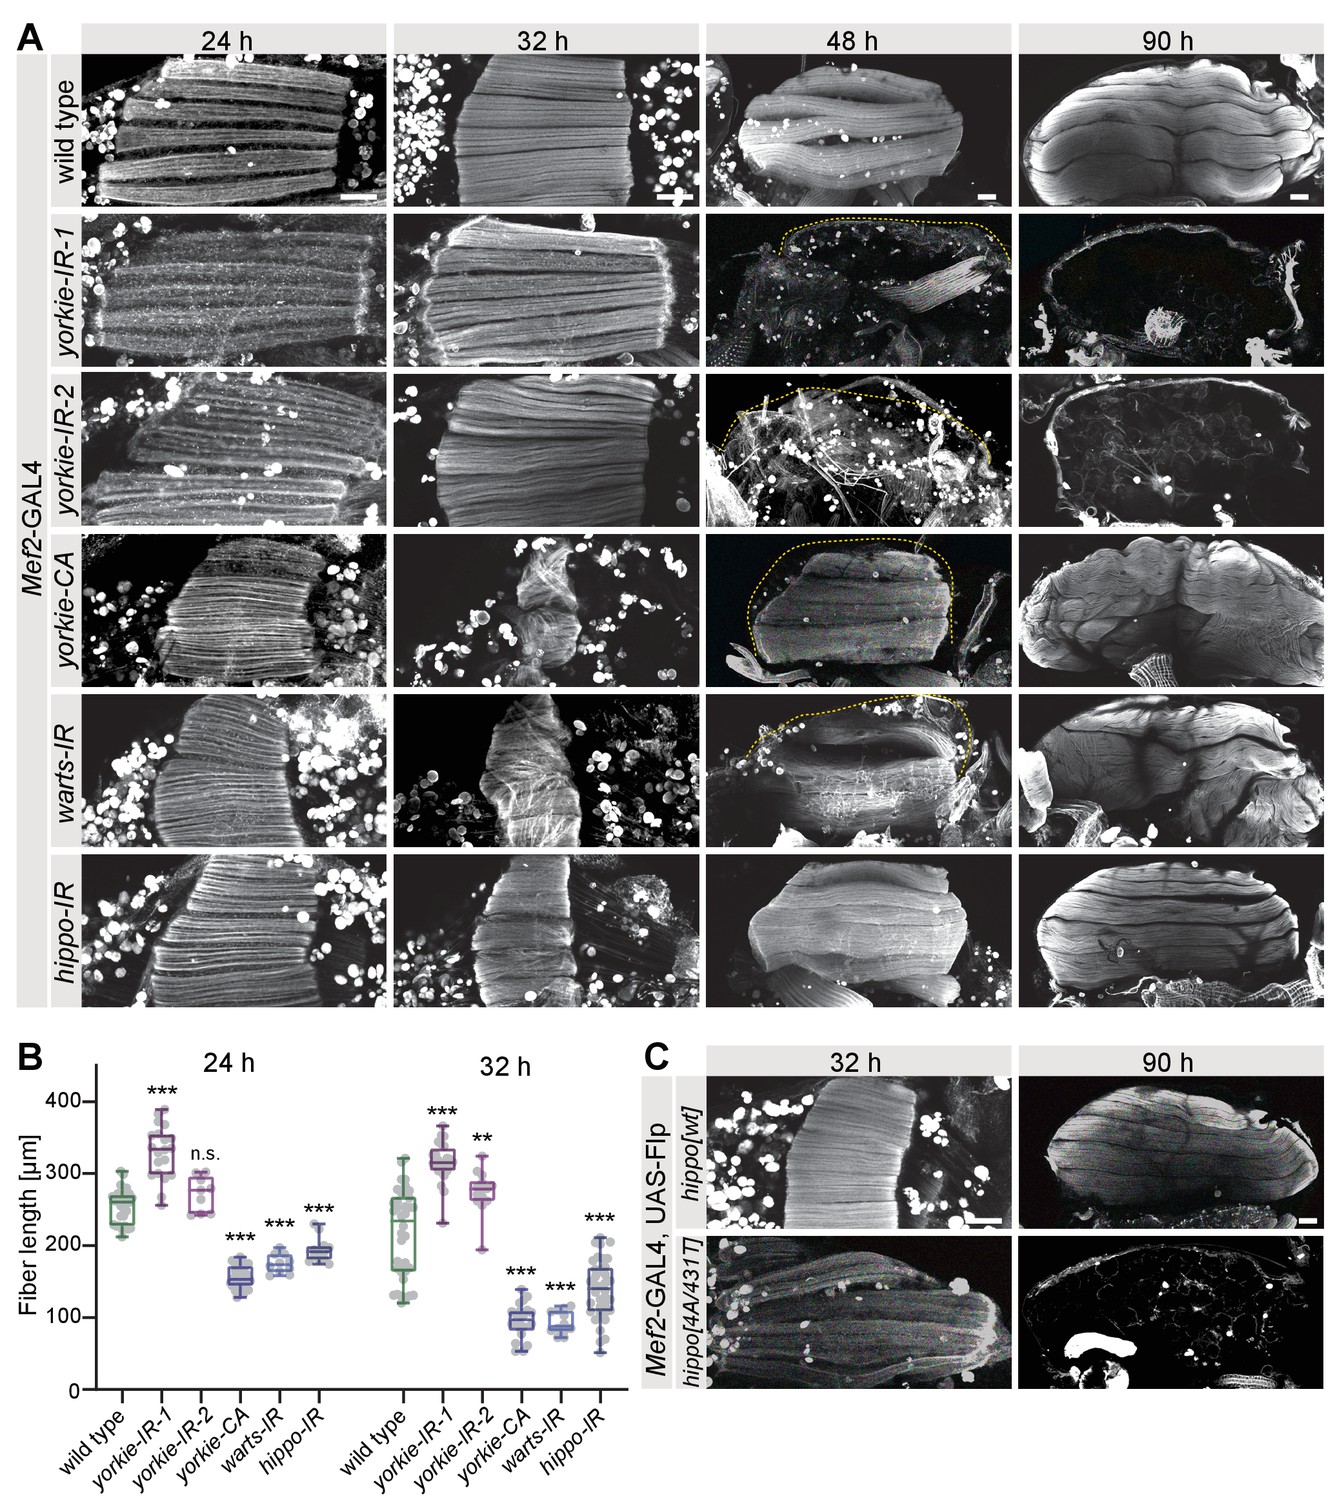
The Hippo pathway regulates muscle morphogenesis.
(A) Flight muscles at 24 hr, 32 hr, 48 hr, and 90 hr after puparium formation (APF) from wild type, yorkie knock-down (independent RNAi lines IR-1 and 2), yorkie-CA, as well as warts and hippo knockdown genotypes stained for actin. The dotted lines highlight the cuticle. Note the too long yorkie-IR muscles but too short yorkie-CA, warts-IR, and hippo-IR muscles at 24 hr and 32 hr APF. (B) Box plot showing muscle fiber length at 24 hr and 32 hr APF of the indicated genotypes. Student’s t-test, *** p-value<0.001, **p value<0.01. (C) Flight muscles at 32 hr and 90 hr APF from pupae expressing either wild-type hippo or Slmap-binding-deficient hippo[4A/431T] (under control of the milder tubulin promoter). The FRT stop cassette is removed by muscle-specific Mef2-GAL4-driven Flp recombinase. All scale bars represent 50 µm.
Figure 4—figure supplement 1

The Hippo pathway is required for muscle function.
(A) Viability and flight tests comparing wild type (Mef2-GAL4 control) to knockdown or over-expression of Hippo pathway components. (B) Cryo cross-sections of dorsal longitudinal muscle 4 from 24 hr and 32 hr after puparium formation (APF) wild type, Dlg5, Slmap, or yorkie-IR and yorkie-CA pupae. Scale bars represent 10 µm. (C) Line graph showing mRNA expression levels of Dlg5, Slmap, hippo, yorkie, warts, and scalloped during the flight muscle development. Data extracted from Spletter et al., 2018. (D) Longitudinal section of flight muscles at 32 hr APF comparing wild type to hippo-IR, stained for actin and anti-Hippo. Note the decreased levels of Hippo in knock-down muscles. Scale bar represents 50 µm. (E) Flight muscles at 32 hr APF from wild type, co-stained for anti-Hippo and anti-Slmap. Scale bar represents 2 µm.
Figure 5 with 1 supplement
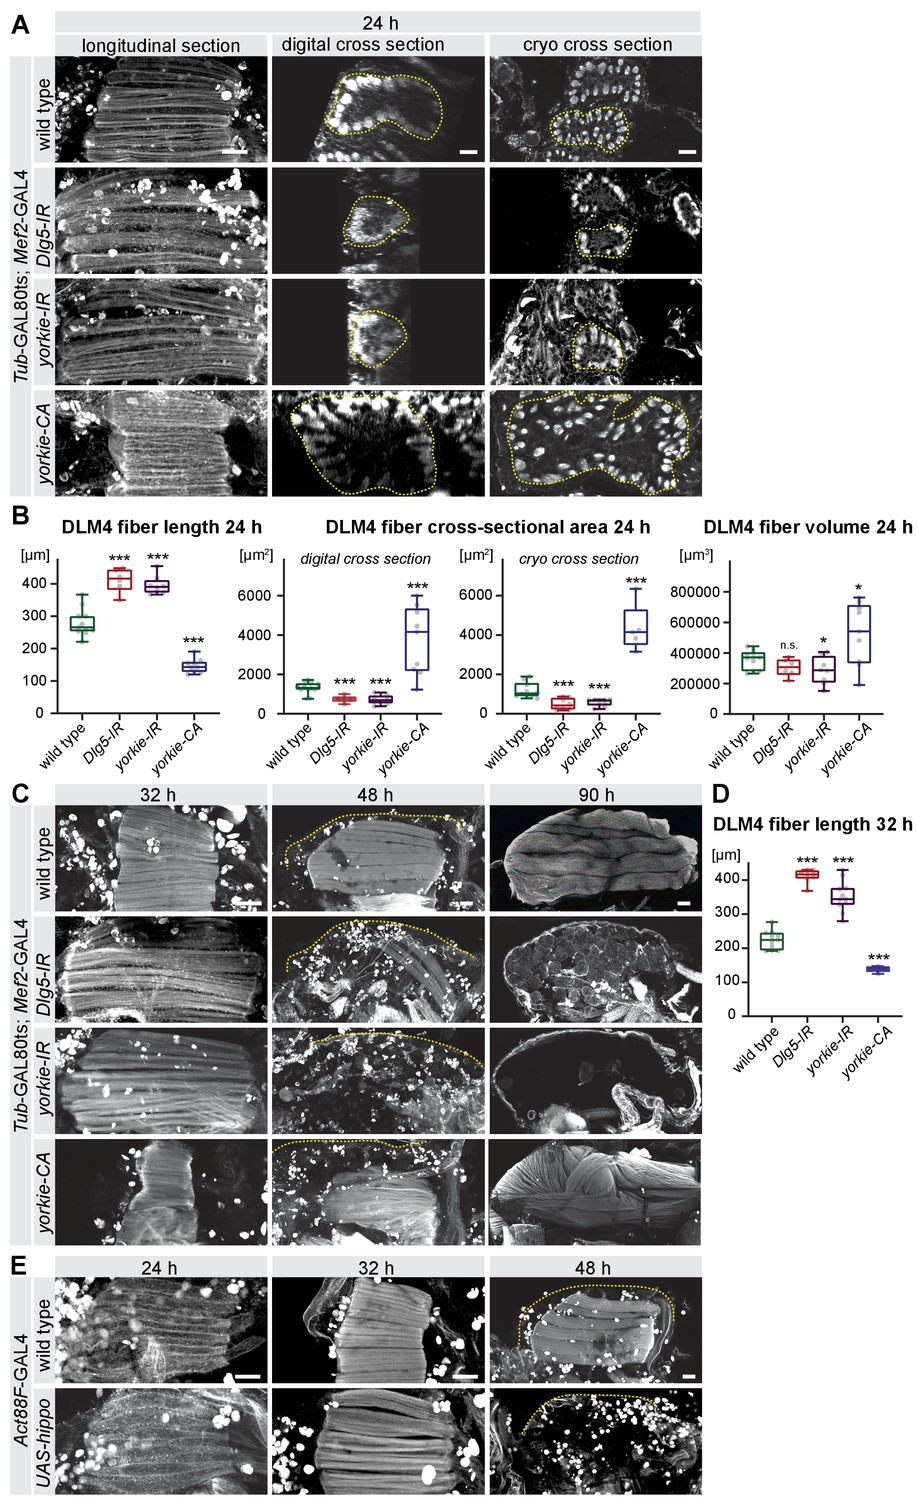
The Hippo pathway is important for post-mitotic muscle development.
(A–D) Developing flight muscles at 24 hr, 32 hr, 48 hr, and 90 hr after puparium formation (APF) from wild type, Dlg5-IR, yorkie-IR, and yorkie-CA TubGAL80ts Mef2-GAL4 pupae, in which GAL4 activity was restricted to pupal stages (shift to 31°C at 0 hr APF). (A) Longitudinal sections of all flight muscles, as well as digital and cryo cross-sections of dorsal-longitudinal flight muscle 4 (DLM4) at 24 hr APF. Dotted lines highlight the fiber area. (B) Box plot displaying DLM4 muscle fiber length, fiber cross-sectional area from digital and cryo cross-sections as well as the calculated DLM4 fiber volume at 24 hr APF (calculated by multiplying length with digital cross-sectional area for each pupa). Student’s t-test, *** p-value<0.001, * p-value<0.05. (C) Flight muscles at 32 hr, 48 hr, and 90 hr APF. Note the too long muscles in Dlg5-IR, yorkie-IR at 32 hr APF followed by muscle atrophy and the too short yorkie-CA fibers at 32 hr that develop disorganised fibers at 90 hr APF. (D) Box plot illustrating the average muscle fiber length at 32 hr APF. Student’s t-test, *** p-value<0.001. (E) Control and Act88F-GAL4 UAS-hippo flight muscles at 24 hr, 32 hr and 48 hr APF. Note the induced fiber compaction defect followed by the muscle atrophy. All scale bars represent 50 µm for longitudinal sections and 10 µm for cross-sections.
Figure 5—figure supplement 1
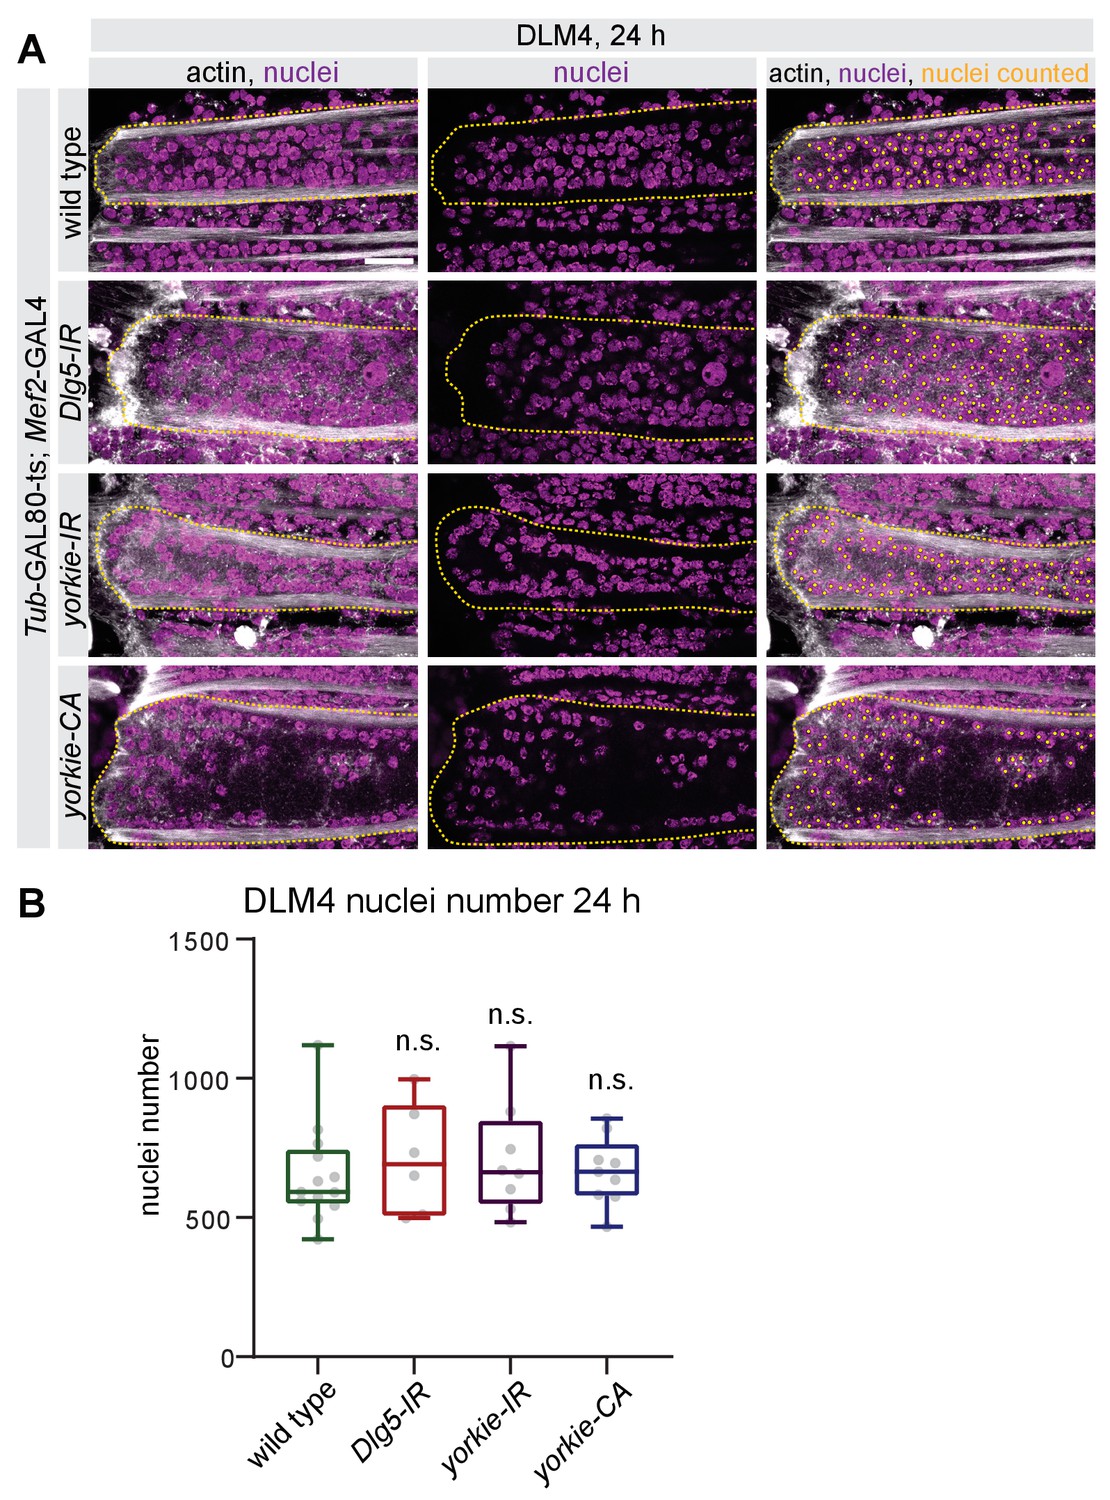
The Hippo pathway is not required for myoblast fusion.
(A) Quantification of nuclei number of dorsal-longitudinal flight muscle 4 (DLM4) at 24 hr after puparium formation (APF) from wild type, Dlg5-IR, yorkie-IR, and yorkie-CA TubGAL80ts Mef2-GAL4 (shifted to 31°C at 0 hr APF). Fibers were stained for actin (phalloidin) and nuclei (DAPI). Images illustrating how the nuclei counting was done using longitudinal sections of DLM4. Since fiber widths vary in different genotypes, for illustration purposes different numbers of z-planes were maximum projected to result in comparable volumes. Dotted lines highlight the cell borders of the fibers. Scale bar represents 20 µm. (B) Box plot showing total DLM4 nuclei numbers at 24 hr. Each dot represents one pupa. Student’s t test, n.s. p>0.05.
Figure 6 with 1 supplement
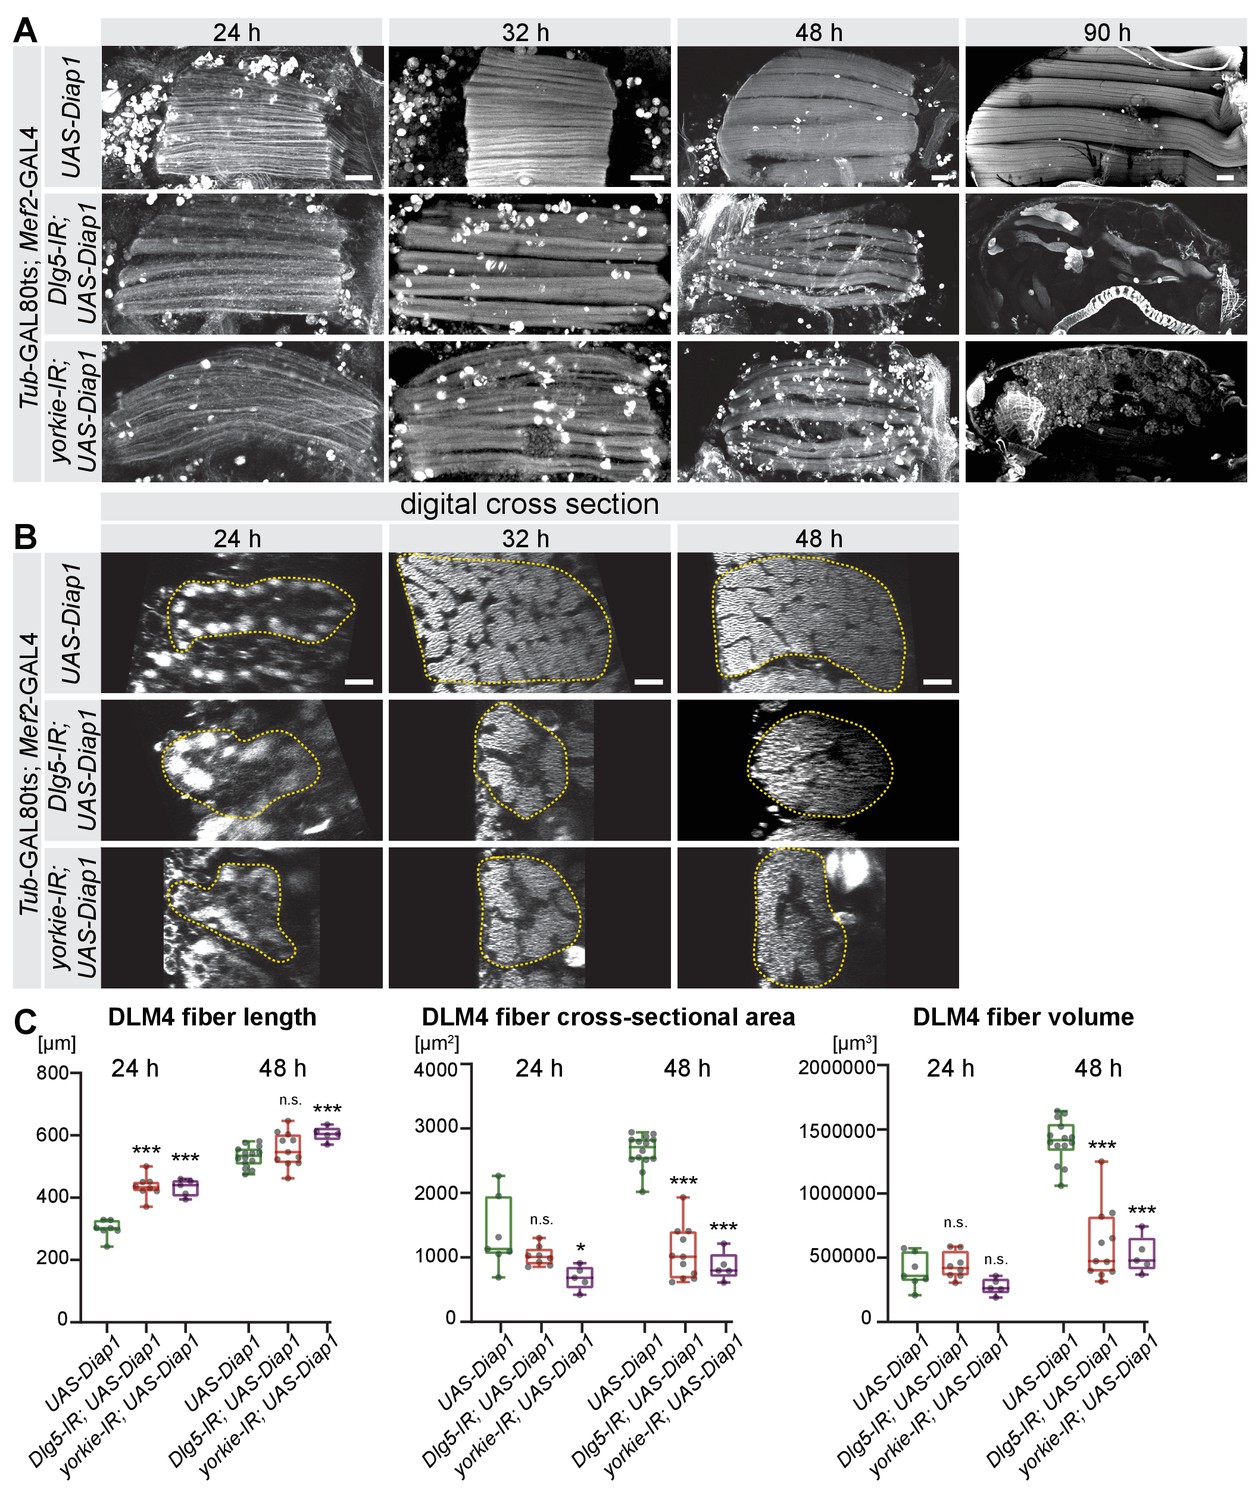
The Hippo pathway is essential for post-mitotic muscle fiber growth.
(A, B) Longitudinal sections of all dorsal-longitudinal flight muscles (DLM) at 24 hr, 32 hr, 48 hr, and 90 hr after puparium formation (APF) (A) and digital cross-sections of DLM4 at 24 hr, 32 hr, and 48 hr APF (B) from wild type, Dlg5-IR and yorkie-IR TubGAL80ts Mef2-GAL4 UAS-Diap1 (shifted to 31°C at 0 hr APF) stained for actin. Scale bars represent 50 µm for longitudinal sections and 10 µm for cross-sections. In B dotted lines highlight the fiber areas. (C) Box plots showing DLM4 fiber length, digital cross-sectional area, and volume (calculated by multiplying length with digital cross-sectional area for each pupa) at 24 hr and 48 hr APF. Student’s t test, *** p-value<0.001, * p-value<0.05.
Figure 6—figure supplement 1
Apoptosis block and muscle growth.
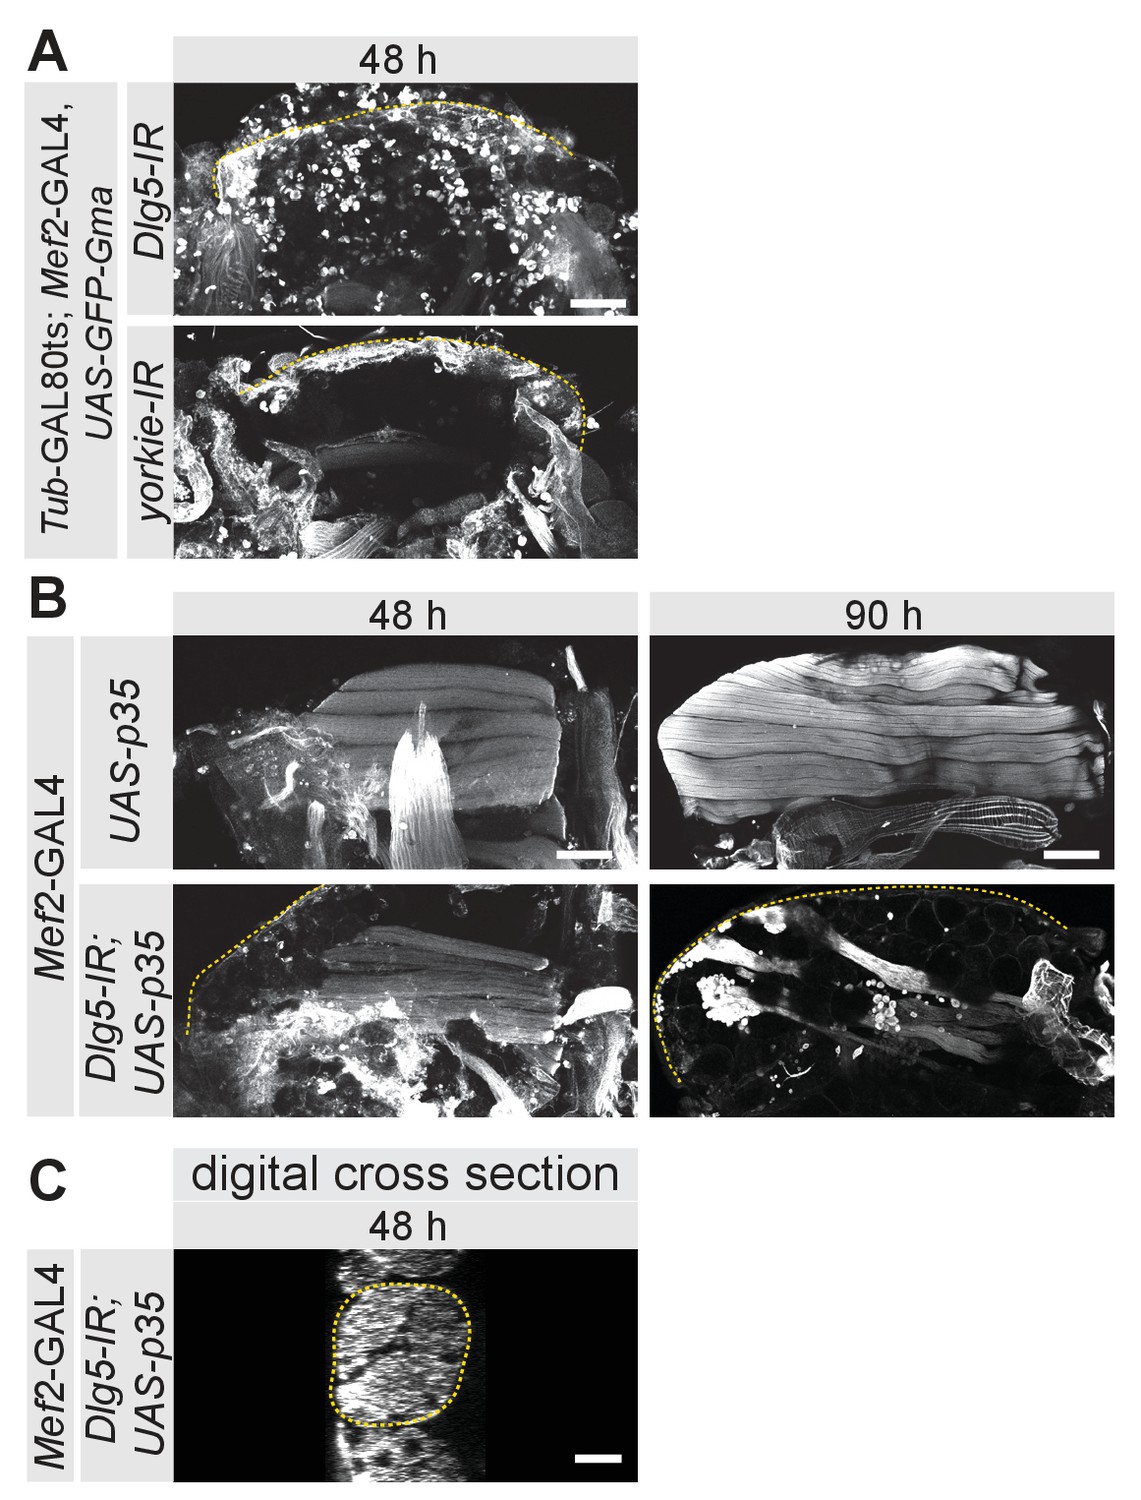
(A) Hemi-thoraces at 90 hr after puparium formation (APF) from Dlg5-IR and yorkie-IR TubGAL80ts Mef2-GAL4 UAS-GFP-Gma pupae, in which GAL4 activity was restricted to pupal stages (shift to 31°C at 0 hr APF). Note the empty thoraces in these double UAS-lines, which serve as controls for GAL4 dilution for Figure 6. (B) Longitudinal sections of flight muscles at 48 hr and 90 hr APF from UAS-p35 and UAS-p35 Dlg5-IR Mef2-GAL4 stained for actin. The dotted lines highlight the cuticle and scale bars represent 100 µm. (C) Digital cross-section of dorsal-longitudinal flight muscle 4 (DLM4) at 48 hr APF from UAS-p35 Dlg5-IR Mef2-GAL4 stained for actin. Dotted lines highlight the fiber area. Note the small fiber cross-section area. Scale bar represent 10 µm.
Figure 7 with 2 supplements
The Hippo pathway is essential for myofibrillogenesis.
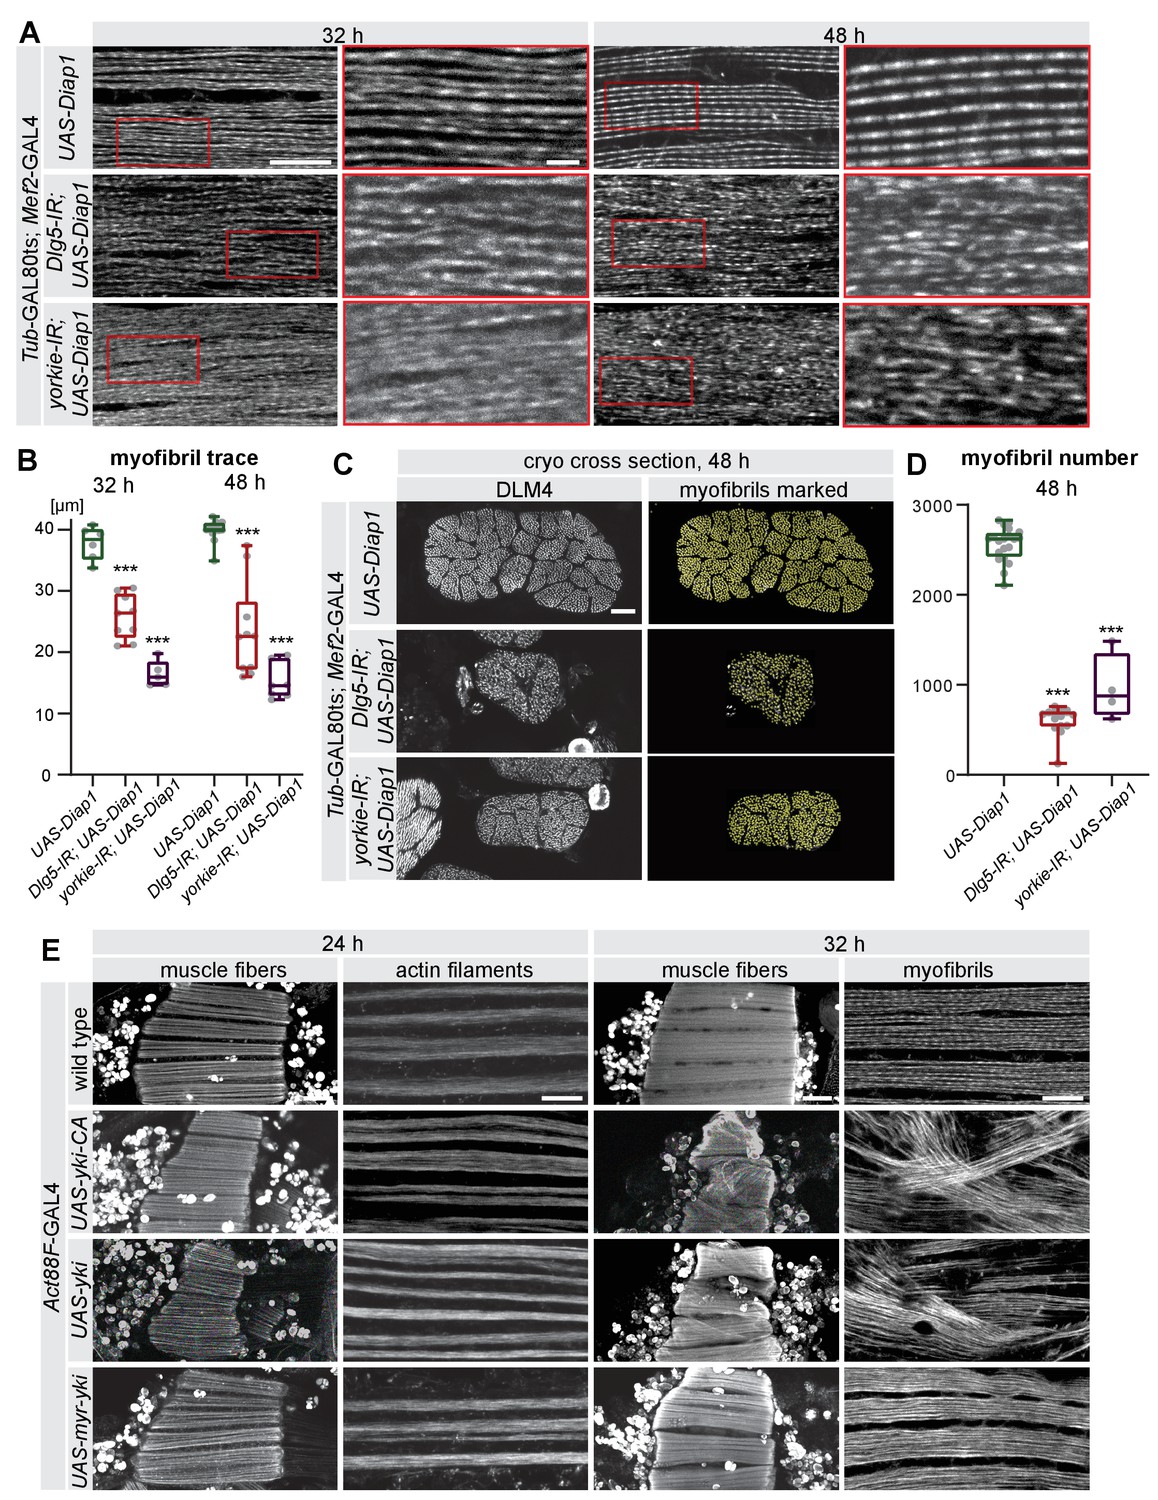
(A) Myofibrils visualised by phalloidin from control, Dlg5-IR, and yorkie-IR UAS-Diap1 TubGAL80ts Mef2-GAL4 muscles at 32 hr and 48 hr after puparium formation (APF; shifted to 31°C at 0 hr APF). The red-boxed areas are magnified. Note the less regular myofibril pattern of Dlg5-IR and yorkie-IR muscles at 32 hr APF that makes it hard to trace an individual myofibril (see Figure 7—figure supplement 1A). Even at 48 hr APF, myofibrils from Dlg5-IR and yorkie-IR are hard to trace continuously. Scale bars represent 10 µm in the overviews and 2 µm in the zoomed red boxes. (B) Box plot of traced myofibril length in a 40 × 20 × 2.5 µm volume (see Figure 7—figure supplement 1A). Student’s t test, *** p-value<0.001. (C) Cryo cross-sections of dorsal-longitudinal flight muscle 4 (DLM4) from control, Dlg5-IR and yorkie-IR UAS-Diap1 TubGAL80ts Mef2-GAL4 muscles at 48 hr APF (shifted to 31°C at 0 hr APF). Yellow dots represent the myofibrils recognised by the MyofibrilJ plug-in to automatically count the number of myofibrils per DLM4 fiber (Spletter et al., 2018). Scale bar represents 10 µm. (D) Box plot of myofibril number in DLM4 of indicated genotypes at 48 hr APF. Student’s t test, *** p-value<0.001. (E) Flight muscle and myofibril morphologies of muscles expressing yorkie-CA, yorkie, or myr-yorkie under the control of post-mitotic Act88F-GAL4 at 24 hr and 32 hr APF. Scale bars represent 50 µm in muscle fiber images and 10 µm in myofibril images.
Figure 7—figure supplement 1

Myofibril tracing, nuclei positions in Dlg5-IR and yorkie-IR muscles and muscle growth in kon-IR fibers.
(A) Myofibrils visualised by phalloidin from control, Dlg5-IR, and yorkie-IR UAS-Diap1 TubGAL80ts Mef2-GAL4 muscles at 32 hr and 48 hr after puparium formation (APF; shifted to 31°C at 0 hr APF). Myofibrils were traced with Simple Neurite Tracer and traces are highlighted in red. Note that in Dlg5-IR and yorkie-IR myofibrils traces are short. Scale bars represent 10 µm. (B) Flight muscles stained for actin (phalloidin) and nuclei (DAPI) from control, Dlg5-IR, and yorkie-IR UAS-Diap1 TubGAL80ts Mef2-GAL4 muscles at 32 hr (shifted to 31°C at 0 hr APF). Note that nuclei fail to distribute between the myofibril bundles but cluster centrally in Dlg5-IR and yorkie-IR fibers. Scale bar represents 10 µm. (C) Box plot of myofiber cross-sectional areas from cryo cross-sections of dorsal-longitudinal flight muscle 4 (DLM4) from control, Dlg5-IR, and yorkie-IR UAS-Diap1 TubGAL80ts Mef2-GAL4 muscles at 48 hr APF. Student’s t test, *** p-value<0.001. (D, E) Longitudinal sections of flight muscles (D) and digital cross-sections of DLM4 (E) at 24 hr, 32 hr, and 48 hr APF from wild type and kon-IR Mef2-GAL4 stained for actin. Scale bars represent 50 µm for longitudinal sections and 10 µm for cross-sections. In E, dotted lines highlight the fiber area. (F) Box plots showing DLM4 fiber length, digital cross-sectional area, and volume (calculated by multiplying length with digital cross-sectional area) at 24 hr and 48 hr APF. Student’s t test, *** p-value<0.001.
Figure 7—figure supplement 2
Yorkie is active in the nucleus.
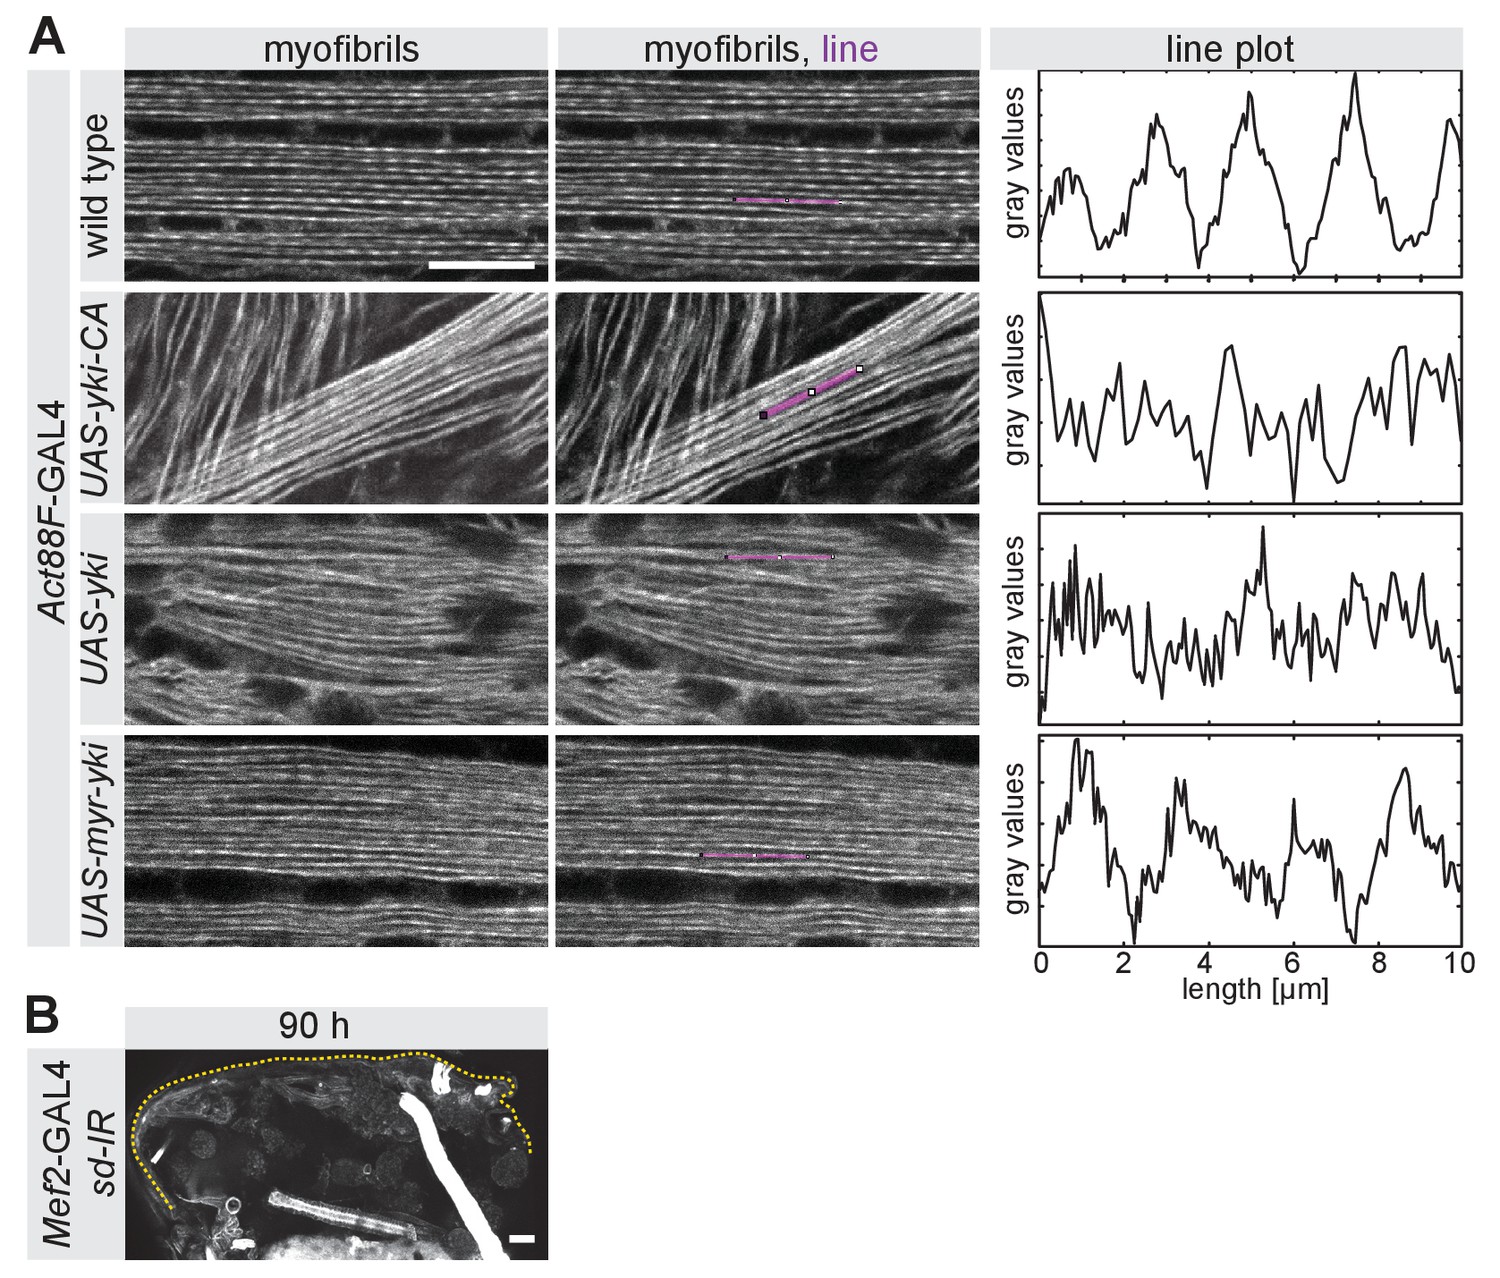
(A) Intensity profiles of control myofibrils compared to UAS-yorkie-CA, UAS-wild-type-yorkie or UAS-myr-yorkie expressed with the post-mitotic Act88F-GAL4 driver at 32 hr after puparium formation (APF). Note the less pronounced actin periodicity in UAS-yki and UAS-yki-CA compared to wild-type control. Scale bar represents 10 µm. (B) 90 hr APF half thorax from scalloped-IR Mef2-GAL4. The dotted lines highlight the cuticle. Scale bar represents 50 µm.
Figure 8 with 1 supplement
Yorkie transcriptionally controls sarcomeric and mitochondrial genes expression.
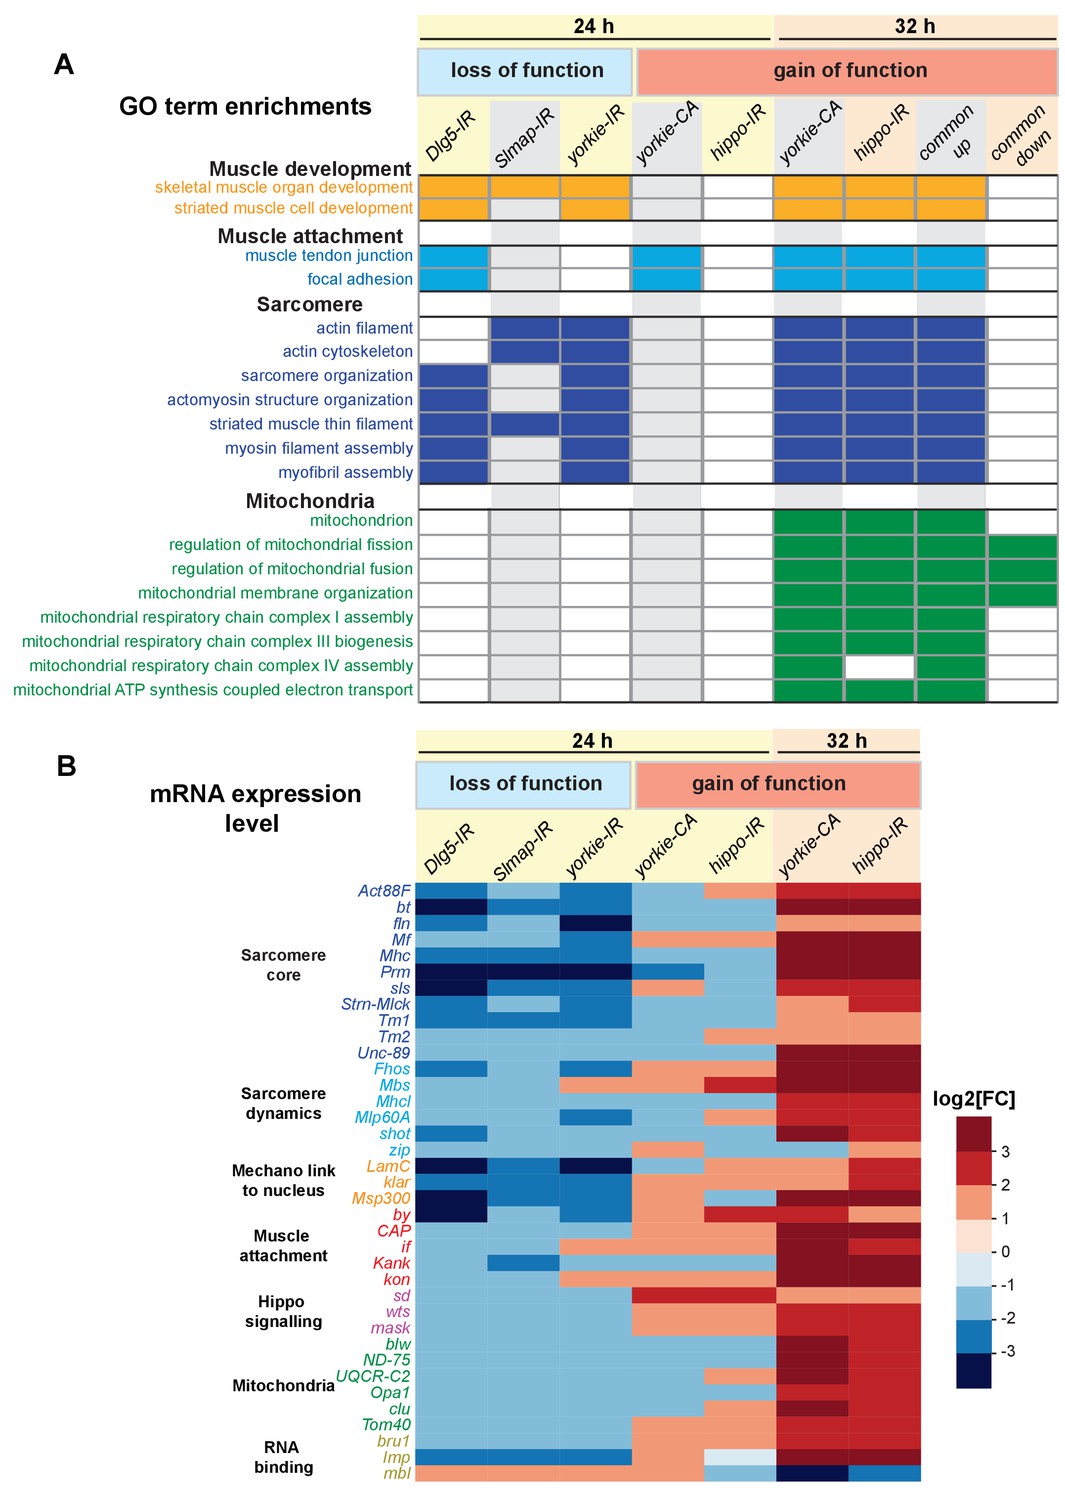
(A) Gene ontology (GO)-term enrichments in genes lists that are significantly changed in the various loss (Dlg5-IR, Slmap-IR, yorkie-IR) and gain-of-function (yorkie-CA, hippo-IR) yorkie conditions at 24 hr and 32 hr after puparium formation (APF) compared to wild-type controls (see Supplementary file 3). Note the strong enrichment of sarcomere related GO-terms in the 24 hr APF loss-of-function and the 32 hr APF gain-of-function condition. Thirty-two hr APF gain of function is also strongly enriched for mitochondrial GO-terms. (B) Plot displaying the log2-fold change of transcript levels for individual genes of the above genotypes compared to control (up in red, down in blue). Note the strong downregulation of the sarcomeric genes in the 24 hr APF loss-of-function conditions, in particular the titin homologs bt and sls, as well as Mhc, Prm and Act88F.
Figure 8—figure supplement 1
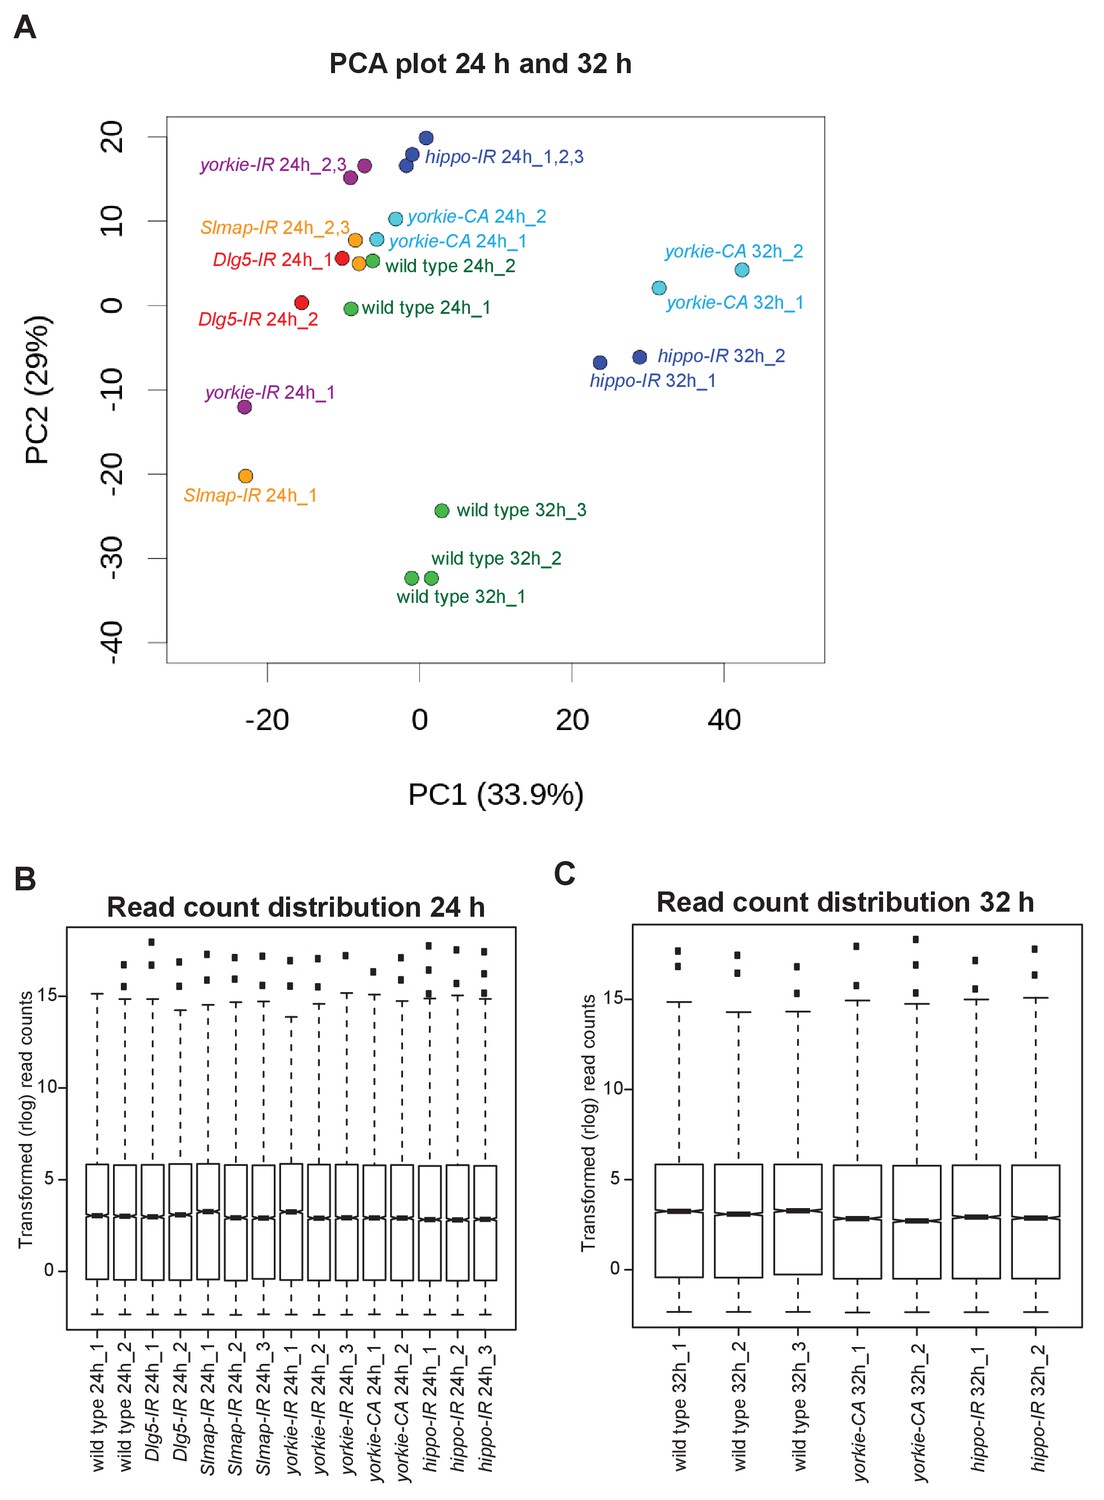
PCA analysis and BRB sequencing read counts.
(A) Principal component analysis (PCA) of BRB-sequencing replicates. Note the distinct clustering of 24 hr from 32 hr after puparium formation (APF) samples. Most but not all samples of similar genotypes cluster together. (B, C) Transformed read count distributions of the 24 hr (B) and 32 hr APF (C) samples.
Figure 9 with 1 supplement

Yorkie regulates sarcomere protein expression.
(A, B) Mhc-GFP (A) and Act88F-GFP (B) proteins levels visualised with a GFP nanobody together with actin comparing wild-type control with yorkie-IR and yorkie-CA at 24 hr and 32 hr after puparium formation (APF). Scale bars represent 2 µm. GFP channel is displayed using the ‘fire’ look-up table. (C) Quantification of relative GFP protein levels compared to wild type (wild-type mean set to one for each individual experiment). Bar plots display average normalised value and each dot represents one hemithorax. Student’s t test, *** p-value<0.001, ** p-value<0.01 * p-value<0.05.
Figure 9—figure supplement 1
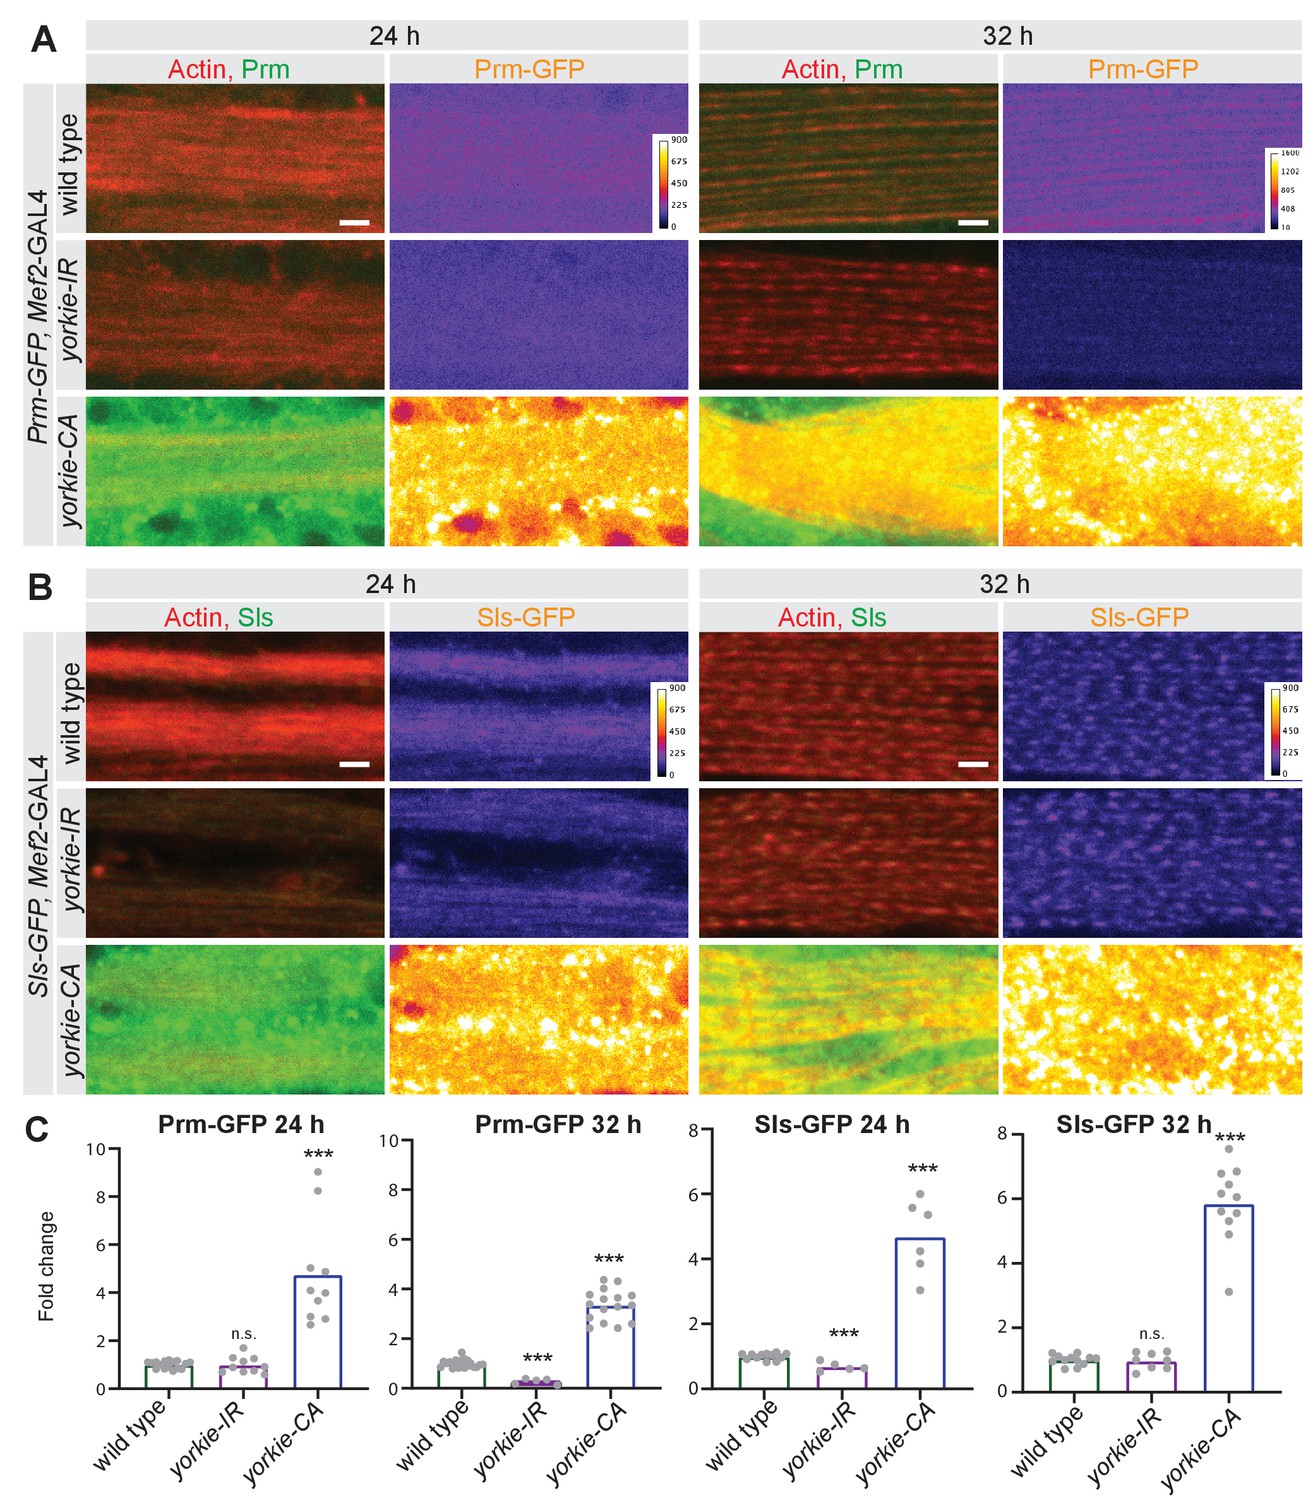
Yorkie regulates sarcomere protein expression.
(A, B) Prm-GFP (A) and Sls-GFP (B) proteins levels visualised with a GFP nanobody together with actin comparing wild type control with yorkie-IR and yorkie-CA at 24 hr and 32 hr after puparium formation (APF). Scale bars represent 2 µm. GFP channel is displayed using the ‘fire’ look-up table. (C) Quantification of relative GFP protein levels compared to wild type (wild type mean set to one for each individual experiment). Bar plots display average normalised value and each dot represents one hemithorax. Student’s t test, *** p-value<0.001.
Figure 10
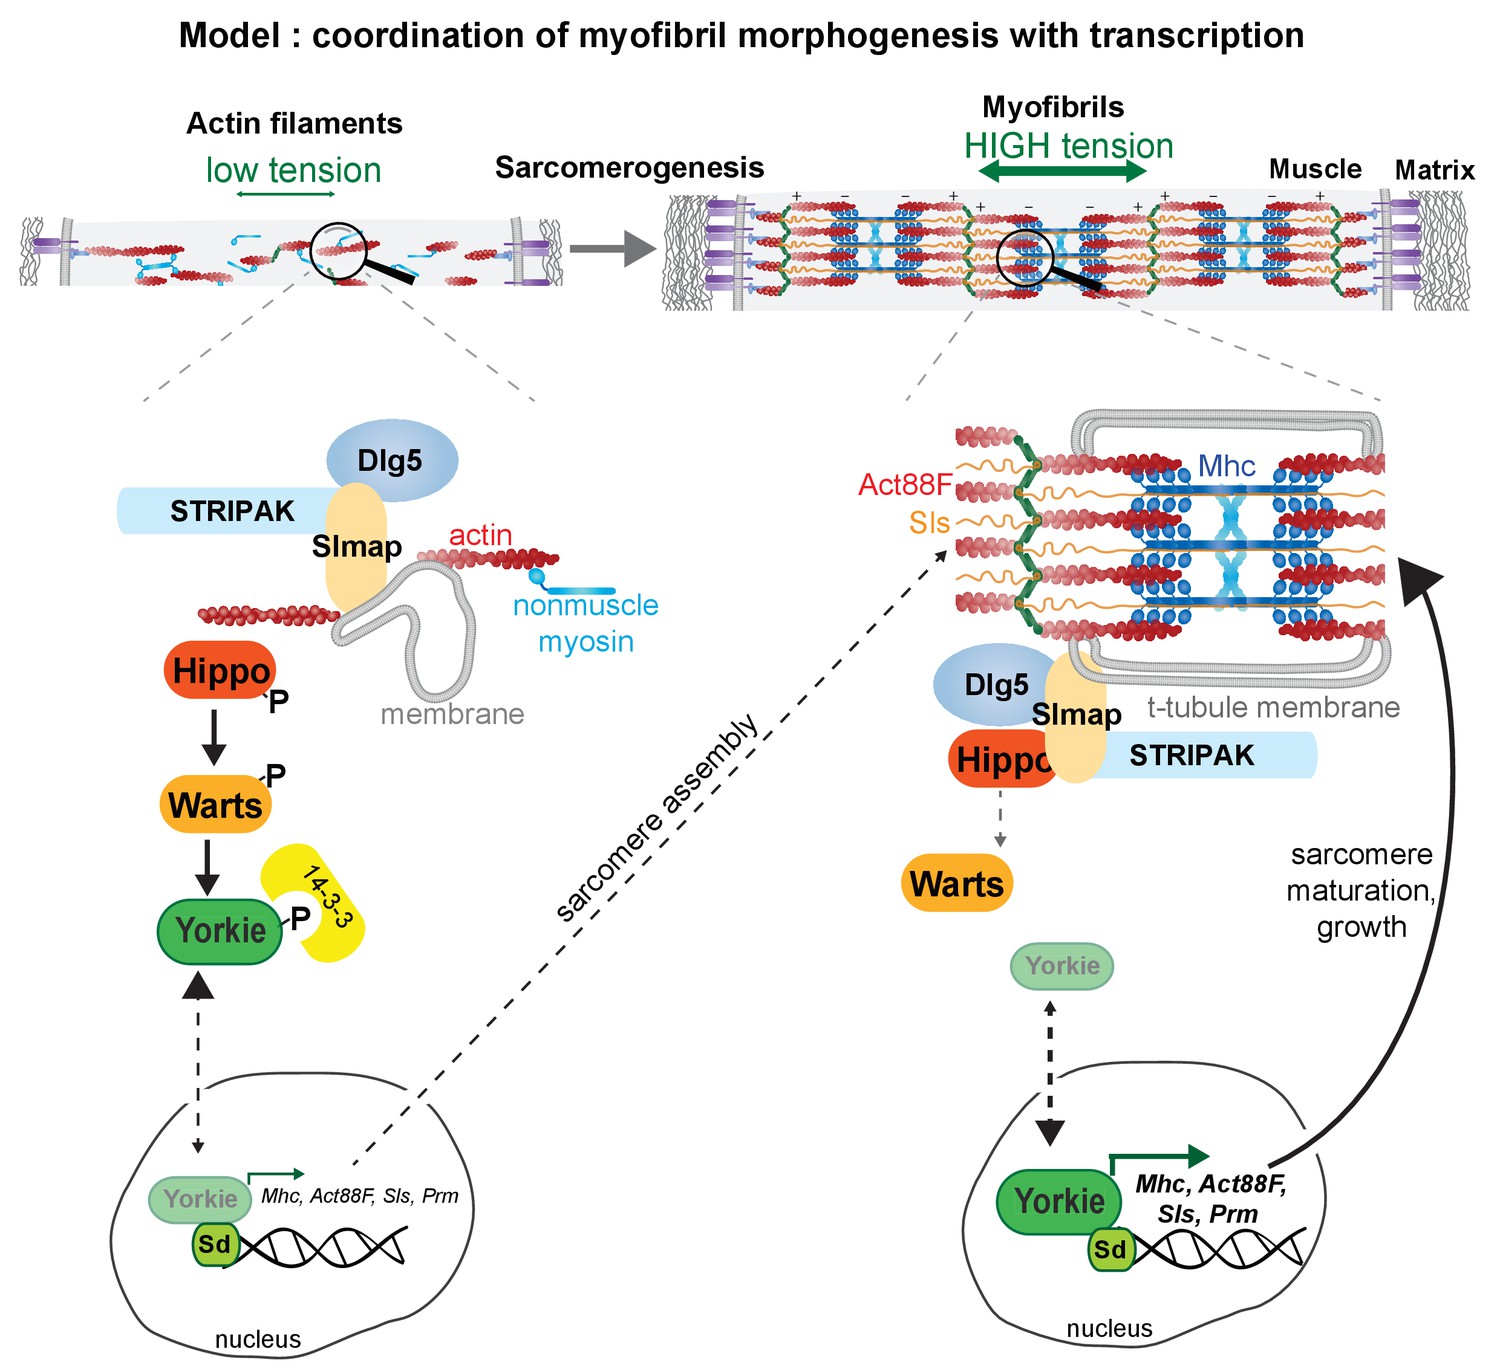
Model of Yorkie’s role how to coordinate myofibrillogenesis with transcription during muscle morphogenesis.
Tables
Key resources table
| Reagent type (species) or resource | Designation | Source or reference | Identifiers | Additional information |
|---|---|---|---|---|
| Genetic reagent (D. melanogaster) | w- | BDSC: 3605 | ||
| Genetic reagent (D. melanogaster) | Dlg5-IR-1 | VDRC: 22496 | Pruned from the VDRC collection | |
| Genetic reagent (D. melanogaster) | Dlg5-IR-2 | VDRC: 101596 | ||
| Genetic reagent (D. melanogaster) | Dlg5-IR-3 | BDSC: 30925 | w[*]; P{w[+mC]=UAS-Dlg5.RNAi}3, source: Helena Richardson | |
| Genetic reagent (D. melanogaster) | Slmap-IR-1 | VDRC: 8199 | ||
| Genetic reagent (D. melanogaster) | Slmap-IR-2 | BDSC: 32509 | y[1] sc[*] v[1] sev[21]; P{y[+t7.7] v[+t1.8]=TRiP.HMS00513}attP2 | |
| Genetic reagent (D. melanogaster) | Cka-IR-1 | BDSC: 28927 | y[1] v[1]; P{y[+t7.7] v[+t1.8]=TRiP.HM05138}attP2 | |
| Genetic reagent (D. melanogaster) | Cka-IR-2 | VDRC: 35234 | ||
| Genetic reagent (D. melanogaster) | Strip-IR | BDSC: 34657 | y[1] sc[*] v[1] sev[21]; P{y[+t7.7] v[+t1.8]=TRiP.HMS01134}attP2 | |
| Genetic reagent (D. melanogaster) | yorkie-IR-1 | VDRC: 111001 | ||
| Genetic reagent (D. melanogaster) | yorkie-IR-2 | VDRC: 40497 | ||
| Genetic reagent (D. melanogaster) | warts-IR-1 | VDRC: 111002 | ||
| Genetic reagent (D. melanogaster) | warts-IR-2 | BDSC: 41899 | y[1] sc[*] v[1] sev[21]; P{y[+t7.7] v[+t1.8]=TRiP.GL01331}attP2 | |
| Genetic reagent (D. melanogaster) | Hippo-IR | VDRC: 104169 | ||
| Genetic reagent (D. melanogaster) | sd-IR | VDRC: 101497 | ||
| Genetic reagent (D. melanogaster) | kon-IR | VDRC: 106680 PMID:24631244 | ||
| Genetic reagent (D. melanogaster) | UAS-Dlg5-GFP | BDSC: 30927 | w[*]; P{w[+mC]=UAS-Dlg5.RNAi}2, source: Helena Richardson | |
| Genetic reagent (D. melanogaster) | Mef2-GAL4 | BDSC: 27390 | y[1] w[*]; P{w[+mC]=GAL4-Mef2.R}3 | |
| Genetic reagent (D. melanogaster) | UAS-Flp; Mef2-GAL4 | this study | Mef2GAL4 on third combined with UAS-Flp on X | |
| Genetic reagent (D. melanogaster) | UAS-GFP-Gma | BDSC: 31776 PMID:11784030 | ||
| Genetic reagent (D. melanogaster) | Tub-GAL80-ts | BDSC: 7016 PMID:14657498 | ||
| Genetic reagent (D. melanogaster) | hippo[wt] | Duojia Pan, UT Soutwestern, USA PMID:29262338 | tub-FRT-y+-FRT-FLAG-hpo | |
| Genetic reagent (D. melanogaster) | hippo[4A/431T] | Duojia Pan, UT Soutwestern, USA PMID:29262338 | tub-FRT-y+-FRT-FLAG-hpo[4A/431T] | |
| Genetic reagent (D. melanogaster) | Act88F-GAL4 | Richard Cripps, San Diego State University, USA PMID:22008792 | ||
| Genetic reagent (D. melanogaster) | UAS-Hippo | Barry Thompson, John Curtin School of Medical Research, Australia PMID:14502295 | ||
| Genetic reagent (D. melanogaster) | UAS-Diap1 | BDSC: 6657; Barry Thompson, John Curtin School of Medical Research, Australia | w[*]; P{w[+mC]=UAS-DIAP1.H}3 | |
| Genetic reagent (D. melanogaster) | UAS-p35 | BDSC:5072; Barry Thompson, John Curtin School of Medical Research, Australia | ||
| Genetic reagent (D. melanogaster) | yorkie-CA | BDSC: 28836; Barry Thompson, John Curtin School of Medical Research, Australia PMID:18256197 | y[1] w[*]; P{w[+mC]=UAS-yki.S168A.GFP.HA}10-12-1 | |
| Genetic reagent (D. melanogaster) | UAS-Yki | Richard G. Fehon, University of Chicago, USA PMID:30032991 | wild type Yorkie tagged with FLAG | |
| Genetic reagent (D. melanogaster) | UAS-myr-Yki | Richard G. Fehon, University of Chicago, USA PMID:30032991 | membrane tethered wild type Yorkie tagged with FLAG | |
| Genetic reagent (D. melanogaster) | Mhc-GFP | VDRC: 318471 PMID:26896675 | fTRG500 | |
| Genetic reagent (D. melanogaster) | Act88F-GFP | VDRC: 318362 PMID:26896675 | fTRG10028 | |
| Genetic reagent (D. melanogaster) | Prm-GFP | VDRC: 318114 PMID:26896675 | fTRG475 | |
| Genetic reagent (D. melanogaster) | Sls-GFP [CA06744] | Allan Spradling, Carnegie Institution for Science, Maryland, USA PMID:17194782 | ||
| Chemical compound, drug | GFP-Booster Atto488 | ChromoTek GmbH gba488 | ||
| Chemical compound, drug | Rhodamine Phalloidin | Thermo Fischer Scientific R415 | ||
| Chemical compound, drug | Vectashield with DAPI | Biozol VEC-H-1200 | ||
| Chemical compound, drug | Fluoroshield with DAPI | Sigma F6057 | ||
| Chemical compound, drug | anti-Dlg5, rabbit | this study | ||
| Chemical compound, drug | anti-Slmap, rabbit | this study | ||
| Chemical compound, drug | anti-Dlg1, mouse | DSHB: 4F3 PMID:11709153 | ||
| Chemical compound, drug | anti-Hippo, guinea pig | Georg Halder, VIB-KU Leuven, Belgium PMID:16341207 | ||
| Chemical compound, drug | anti-Amphiphysin, rabbit | Jörg Großhans, Georg-August-Universität, Göttingen, Germany PMID:11711432 | ||
| Chemical compound, drug | Tissue-Tek O.C.T. | Weckert Labotechnik 4583; Sakura Finetek | ||
| Chemical compound, drug | FEATHER Microtome Blades, C35 | pfmmedical, Cologne, Germany 207500003 | ||
| Chemical compound, drug | TRIzol | Thermo Fischer Scientific 15596026 |
Additional files
-
Supplementary file 1
Data table containing data from Figures 1, 3, 4, 5, 6, 7 and 9.
- https://cdn.elifesciences.org/articles/63726/elife-63726-supp1-v2.xlsx
-
Supplementary file 2
Table listing the expression levels and fold changes as well as normalised p-values of the BRB-seq data compared to the wild-type controls.
All or only the significantly different genes are listed.
- https://cdn.elifesciences.org/articles/63726/elife-63726-supp2-v2.xlsx
-
Supplementary file 3
GO enrichment terms of the significantly different gene lists of the various genotypes and time points.
- https://cdn.elifesciences.org/articles/63726/elife-63726-supp3-v2.xlsx
-
Transparent reporting form
- https://cdn.elifesciences.org/articles/63726/elife-63726-transrepform-v2.docx
Download links
A two-part list of links to download the article, or parts of the article, in various formats.
Downloads (link to download the article as PDF)
Open citations (links to open the citations from this article in various online reference manager services)
Cite this article (links to download the citations from this article in formats compatible with various reference manager tools)
The Hippo pathway controls myofibril assembly and muscle fiber growth by regulating sarcomeric gene expression
eLife 10:e63726.
https://doi.org/10.7554/eLife.63726


