CEP78 functions downstream of CEP350 to control biogenesis of primary cilia by negatively regulating CP110 levels
- Department of Biology, Section for Cell Biology and Physiology, University of Copenhagen, Denmark
- Department of Radiation Biology, Institute for Cancer Research, Norwegian Radium Hospital, Oslo University Hospital, Norway
- Department of Biochemistry and Molecular Biology, University of Southern Denmark, Denmark
- Institute of Molecular and Clinical Ophthalmology Basel (IOB), Switzerland
- Department of Ophthalmology, University of Basel, Switzerland
- Department of Genetics and Genome Biology, University of Leicester, United Kingdom
- Department of Computational Biology, University of Lausanne, Switzerland
Figures
Figure 1 with 1 supplement
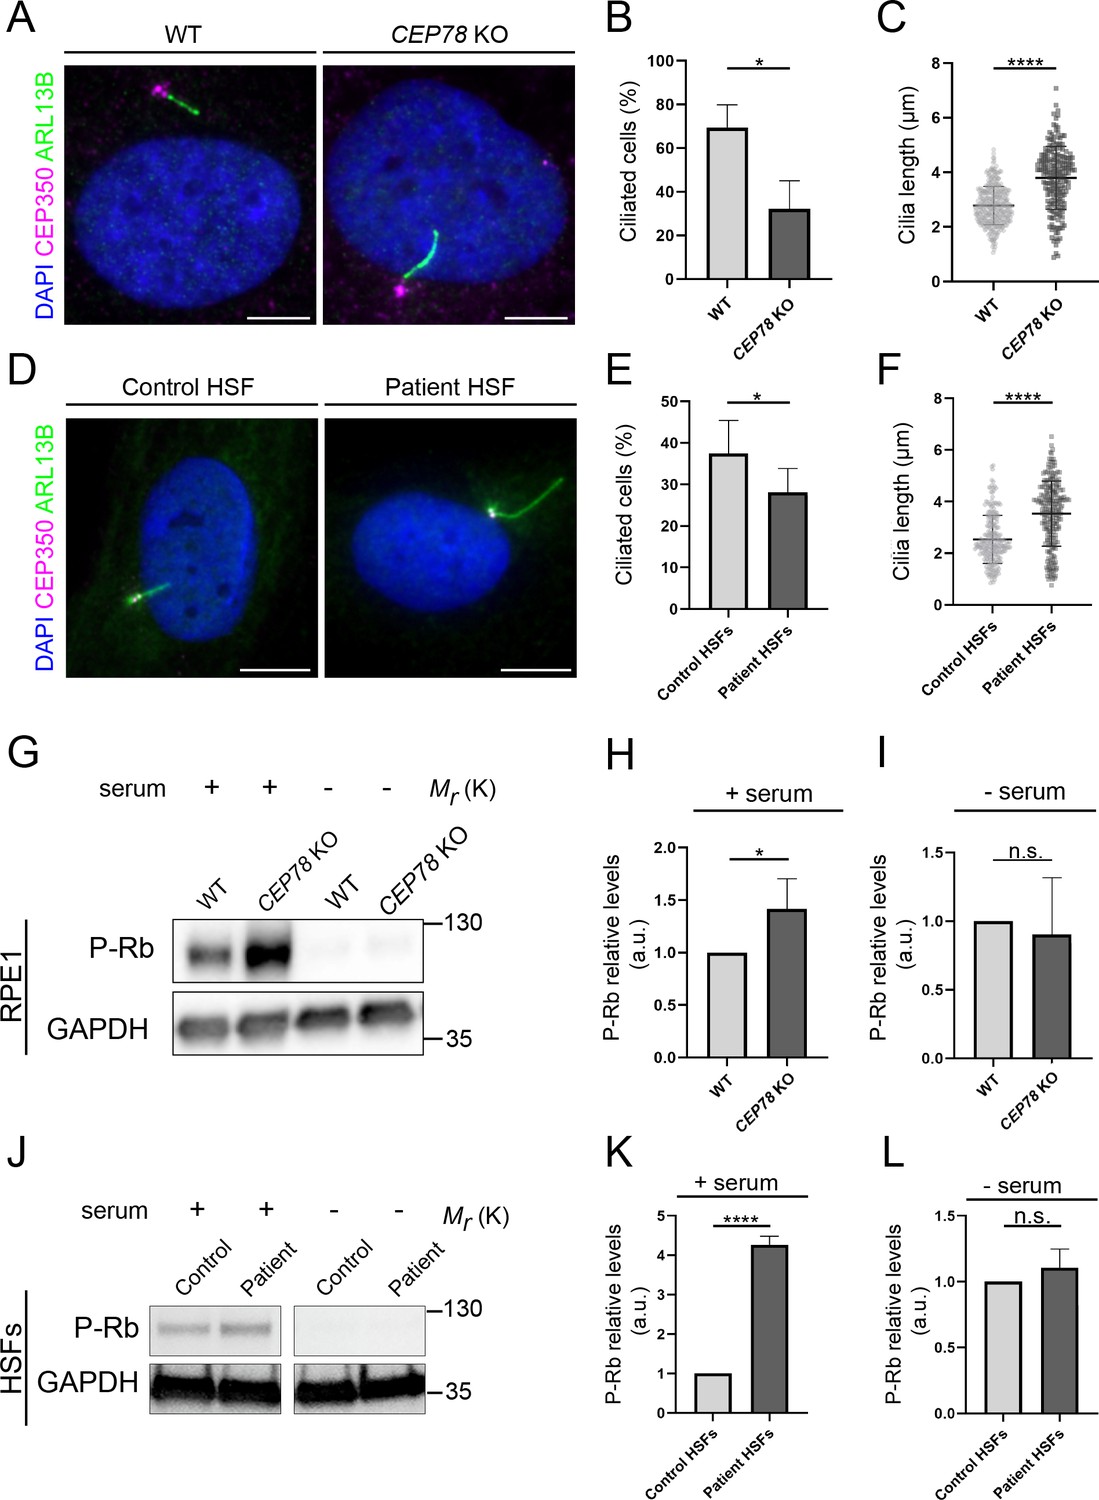
CEP78 mutant cells display fewer, but longer primary cilia.
(A) Representative immunofluorescence microscopy (IFM) images of serum-deprived RPE1 wildtype (WT) and CEP78 knockout (KO) cells stained with the indicated antibodies; DAPI marks the nucleus. Scale bar, 5 μm. (B, C) Quantification of the percentage of ciliated cells (B) and the length of residual cilia (C) in WT and CEP78 KO cells, based on images as shown in (A). Data were normalized in relation to WT values. Student’s t-test (two-tailed, unpaired) was used for the statistical analysis. Graphs in (B) represent accumulated data from three individual experiments (n = 384 for WT and n = 322 for CEP78 KO cells). Graphs in (C) show data from three individual experiments (n = 338 for WT and n = 198 for CEP78 KO cells). (D) Representative IFM images of serum-deprived control and CEP78 mutant (Patient) human skin fibroblasts (HSFs) stained with the indicated antibodies; DAPI marks the nucleus. Scale bar, 5 μm. (E, F) Quantification of the percentage of ciliated cells (E) and the length of residual cilia (F) in control and CEP78 patient HSFs (data from HSFs derived from patient 2702 r34, individual II-3; Nikopoulos et al., 2016), based on images as shown in (D). Graphs in (E) represent accumulated data from seven individual experiments (n = 678 for control HSFs; n = 707 for patient-derived HSFs). Graphs in (F) show data from seven individual experiments (n = 237 for control HSFs; n = 216 for patient-derived HSFs). Data were normalized in relation to control values. A Student’s t-test (unpaired, two-tailed) was performed to address differences in the ciliary frequency and length between control and patient HSFs. (G) Western blot analysis of Rb phosphorylated on S807/811 (P–Rb) in RPE1 WT and CEP78 KO cells grown with or without serum. (H, I) Quantification of data shown in (G) from three independent experiments analyzed in duplicates. (J) P-Rb blots from HSFs derived from control and patient HSFs grown with or without serum (data from HSFs derived from patient F3: II:1; Ascari et al., 2020). GAPDH was used as a loading control. (K, L) Quantification of data shown in (J) from three independent experiments analyzed in duplicates. Student’s t-test (two-tailed, unpaired) was used for the statistical analysis in (H, I) and (K, L). Error bars of graphs represent SD and data are shown as mean ± SD. a.u., arbitrary units; *p<0.05; ****p<0.0001; n.s., not statistically significant.
-
Figure 1—source data 1
Original western blots corresponding to Figure 1G.
The upper blots are labeled with pRb antibody and lower blots with GAPDH antibody.
- https://cdn.elifesciences.org/articles/63731/elife-63731-fig1-data1-v2.pdf
-
Figure 1—source data 2
Original western blots corresponding to Figure 1J.
The upper blots are labeled with pRb antibody and lower blots with GAPDH antibody.
- https://cdn.elifesciences.org/articles/63731/elife-63731-fig1-data2-v2.pdf
Figure 1—figure supplement 1
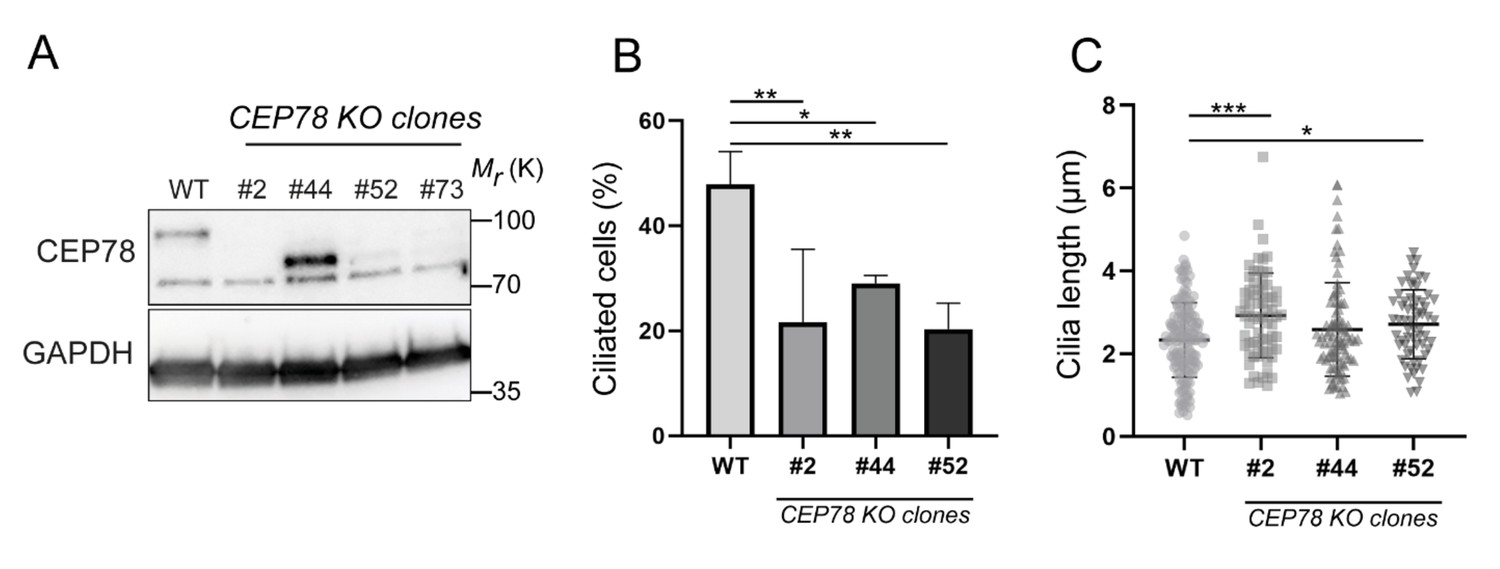
Western blot analysis and ciliary frequency and length in RPE1 wildtype (WT) and CEP78 knockout (KO) clones.
(A) Western blot analysis of serum-deprived RPE1 WT and four different CEP78 KO clones, generated by CRISPR/Cas9 methodology. Blots were probed with antibodies against CEP78 and GAPDH (loading control), as indicated. The lower band in the CEP78 blot is due to unspecific staining of the antibody. Molecular mass markers are indicated in kDa to the right. Unless otherwise indicated, clone #73 was used for all experiments in RPE1 cells performed in this article and is designated CEP78 KO. (B, C) Quantification of ciliary frequency (B) and length (C) in serum-deprived RPE1 WT and different CEP78 KO clones. Differences in cilia numbers and size between the WT and the several CEP78 KO clones were addressed through accumulated data from three independent experiments (for cilia frequency: n = 304 for WT; n = 308 for clone #2; n = 321 for clone #44 and n = 311 for clone #52; and for ciliary length: n = 145 for WT; n = 68 for clone #2; n = 98 for clone #44 and n = 62 for clone #52) by performing an ordinary one-way ANOVA with Dunnet´s multiple comparison test amongst all groups, in relation to WT cells mean (control group). Error bars in (B, C) indicate mean ± SD. *p<0.05; **p<0.01; ***p<0.001.
-
Figure 1—figure supplement 1—source data 1
Original western blots for Figure 1—figure supplement 1.
Left, CEP78 blot; right, GAPDH blot.
- https://cdn.elifesciences.org/articles/63731/elife-63731-fig1-figsupp1-data1-v2.pdf
Figure 2 with 3 supplements
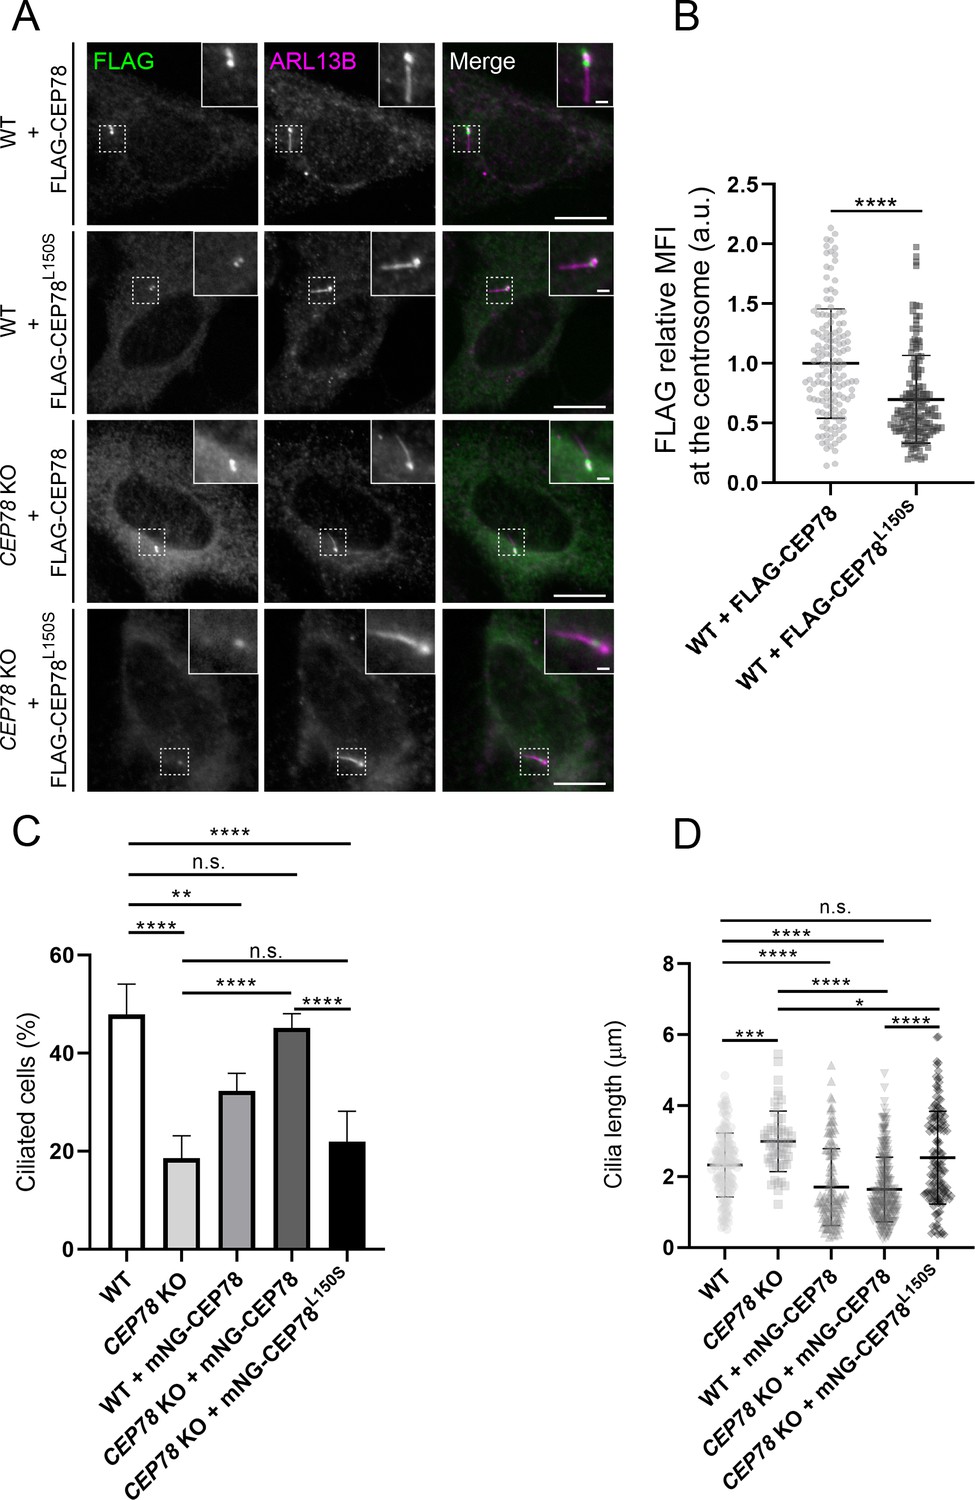
Analysis of RPE1 wildtype (WT) and CEP78 knockout (KO) cells expressing FLAG- or mNG-tagged CEP78 or CEP78L150S fusions.
(A) Representative immunofluorescence microscopy (IFM) images of serum-starved WT and CEP78 KO cells transiently expressing FLAG-CEP78 and FLAG-CEP78L150S labeled with antibodies against FLAG (green) and ARL13B (magenta). Insets show enlarged views of the cilia-centrosome region. Scale bars: 5 μm in original images and 1 μm in magnified images. (B) Quantification of the relative mean fluorescence intensity (MFI) of FLAG-CEP78 and FLAG-CEP78L150S at the centrosome in serum-starved WT cells. Accumulated data from three individual experiments (n = 145 and n = 151 for cells transfected with FLAG-CEP78 and FLAG-CEP78L150S, respectively). Student’s t-test (two-tailed, unpaired) was used for the statistical analysis. Data is shown as mean ± SD. (C, D) Quantification of the percentage of ciliated cells (C) or ciliary length (D) in serum-deprived WT and CEP78 KO cells stably expressing mNG-CEP78 or mNG-CEP78L150S. Analysis on cilia numbers and length was performed through accumulated data from three independent experiments for WT, CEP78 KO, and WT + mNG-CEP78 cells and five independent experiments for CEP78 KO cells expressing either the mNG-CEP78 or the mNG-CEP78L150S (for ciliary frequency: n = 304 for WT; n = 322 for CEP78 KO; n = 425 for WT + mNG-CEP78; n = 621 for CEP78 KO + mNG-CEP78, and n = 638 for CEP78 KO + mNG-CEP78L150S; for ciliary length: n = 145 for WT; n = 56 for CEP78 KO; n = 138 for WT + mNG-CEP78; n = 280 for CEP78 KO + mNG-CEP78 and n = 141 for CEP78 KO + mNG-CEP78L150S). Ordinary one-way ANOVA with Dunnett’s multiple comparison test was used for the statistical analysis of the ciliary frequency and length amongst all groups, in relation to the mean of WT cells, designated as the control group. Differences between CEP78 KO and CEP78 KO+ mNG-CEP78; CEP78 KO and CEP78 KO + mNG-CEP78L150S and CEP78 KO + mNG-CEP78 and CEP78 KO + mNG-CEP78L150S were addressed in a pairwise fashion using an unpaired and two-tailed Student's t-test. Error bars in (C) indicate SD and data in (D) is presented as mean ± SD. *p<0.05; **p<0.01; ***p<0.001; ****p<0.0001; n.s., not statistically significant; a.u., arbitrary units.
Figure 2—figure supplement 1
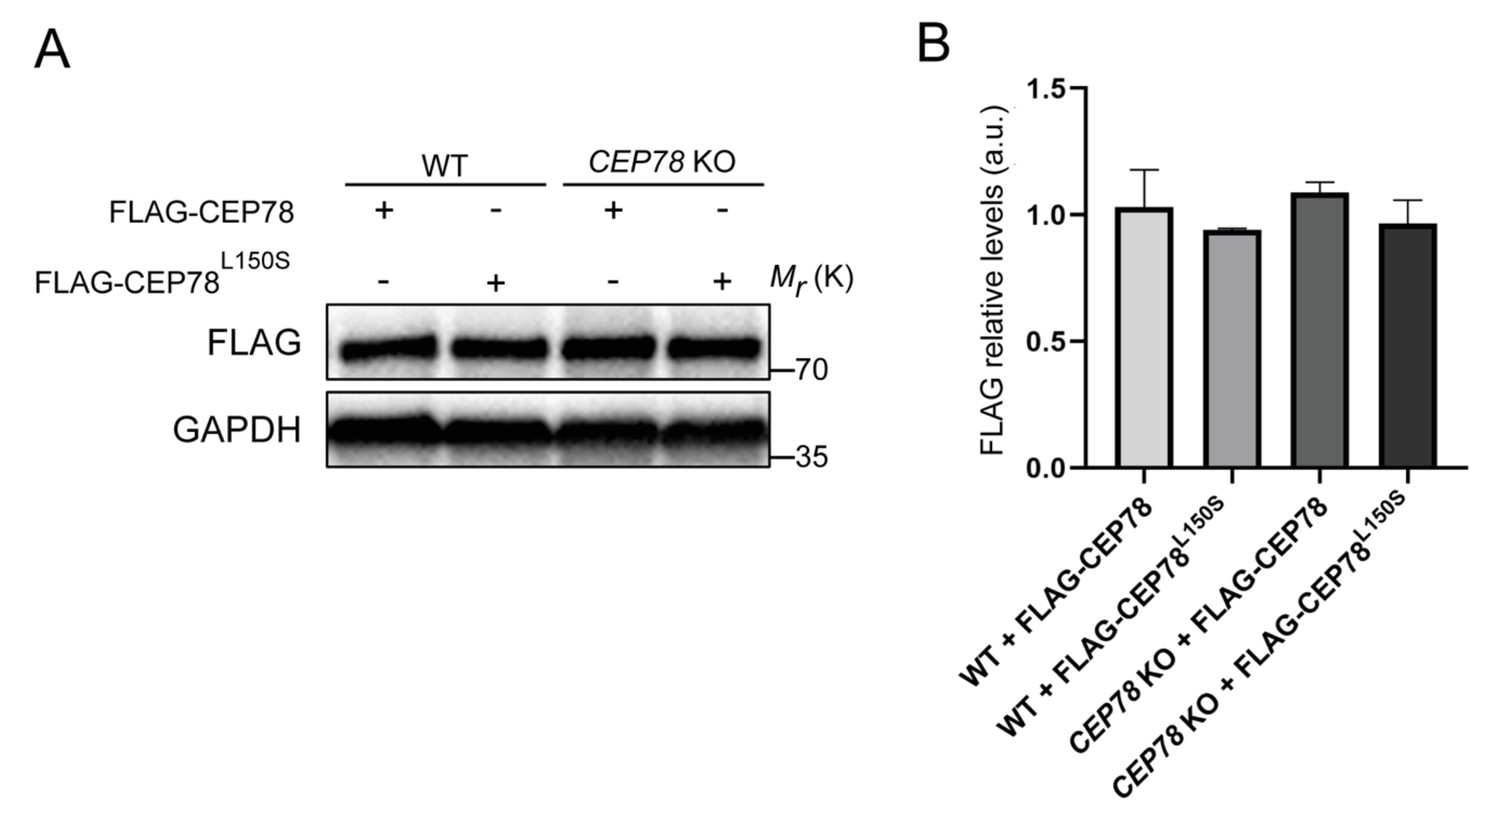
Expression of FLAG-CEP78 and FLAG-CEP78L150S in RPE1 wildtype (WT) and CEP78 knockout (KO) cells.
(A) FLAG blots from serum-deprived WT and CEP78 KO lysates transfected with indicated FLAG fusions. GAPH was used as a loading control. (B) Quantification of data depicted in (A). Graphs of the FLAG blots are presented as the mean + SD from three individual experiments analyzed in duplicates. Ordinary one-way ANOVA with Tukey’s multiple comparison test was used for the statistical analysis, where no significant statistical differences were reported between the groups.
-
Figure 2—figure supplement 1—source data 1
Original western blots for Figure 2—figure supplement 1.
Left, FLAG blot; right, GAPDH blot.
- https://cdn.elifesciences.org/articles/63731/elife-63731-fig2-figsupp1-data1-v2.pdf
Figure 2—figure supplement 2

CEP78 endogenous antibody binds equally well to FLAG-CEP78 WT and L150S mutant fusions.
293T cells transiently expressing FLAG-CEP78 or FLAG-CEP78L150S were subjected to immunoprecipitation (IP) with FLAG. Pellet fractions were analyzed by SDS-PAGE and western blotting using antibodies against FLAG and endogenous CEP78. Molecular mass marker is indicated in kDa to the left of the blots.
-
Figure 2—figure supplement 2—source data 1
Original western blots for Figure 2—figure supplement 2.
Left, FLAG blot; right, CEP78 blot.
- https://cdn.elifesciences.org/articles/63731/elife-63731-fig2-figsupp2-data1-v2.pdf
Figure 2—figure supplement 3
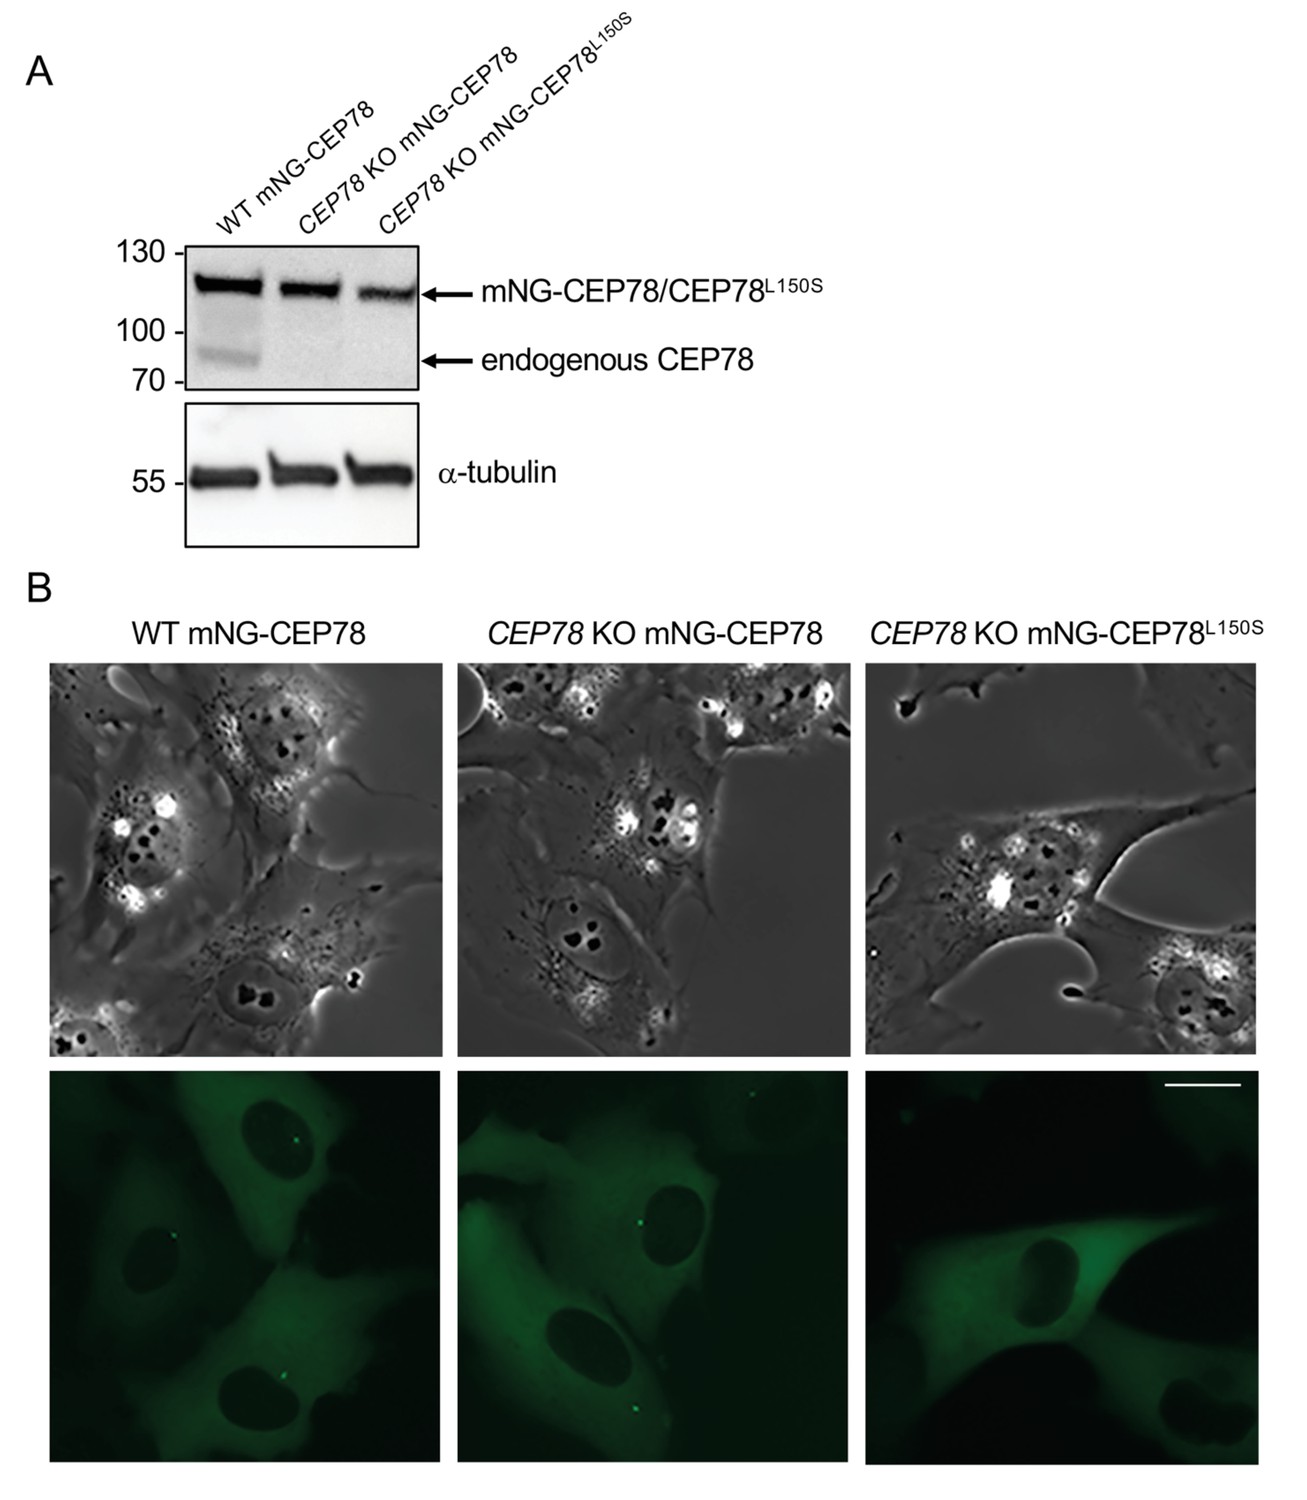
Stable expression of mNG-CEP78 and mNG-CEP78L150S in RPE1 wildtype (WT) and CEP78 knockout (KO) cells.
(A) Western blots of lysates of serum-deprived WT and CEP78 KO RPE1 cells lines stably expressing the indicated mNG-tagged fusions. The blots were probed with antibodies against CEP78 (upper panel) and α-tubulin (loading control; lower panel). Molecular mass markers are shown in kDa to the left. (B) Representative light (upper panels) and fluorescence (lower panels) images of live cells expressing the indicated fusions. Note that mNG-CEP78 is concentrated at the centrosome, whereas mNG-CEP78L150S is not. Scale bar, 20 μm.
-
Figure 2—figure supplement 3—source data 1
Original western blots for Figure 2—figure supplement 3.
Left, CEP78 blot; right, α-tubulin blot.
- https://cdn.elifesciences.org/articles/63731/elife-63731-fig2-figsupp3-data1-v2.pdf
Figure 3 with 1 supplement
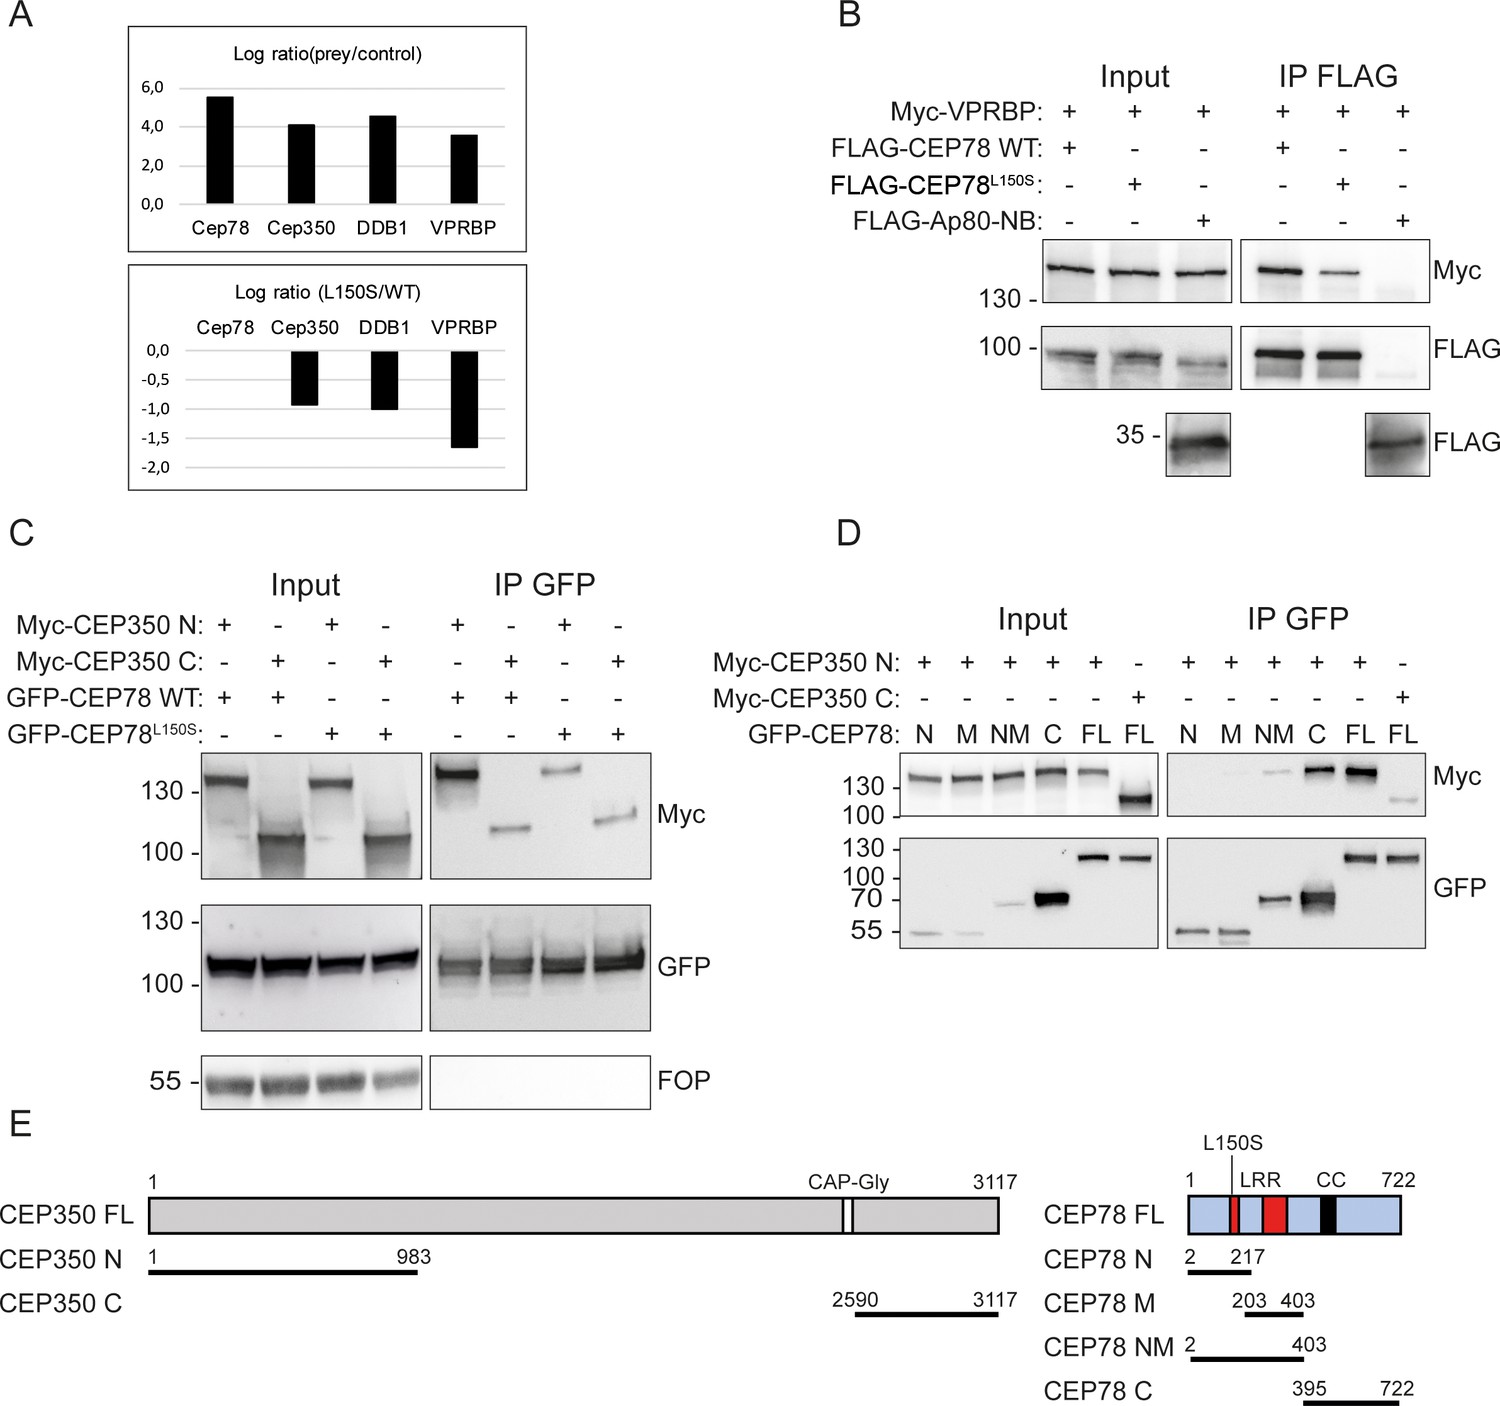
CEP78 interacts with the EDD-DYRK2-DDB1VPRBP complex and CEP350.
(A) Overview of results from CEP78 interactome analysis in 293T cells grown in Stable Isotope Labeling by Amino acids in Cell culture (SILAC) medium. Cells expressing FLAG-CEP78 wildtype (WT), FLAG-CEP78L150S, or FLAG-Ap80 (negative control) were subjected to FLAG immunoprecipitation (IP) and pellets analyzed by mass spectrometry. The upper panel displays affinity enrichment of Cep78 and interaction partners in FLAG-CEP78 WT cells relative to control cells. The lower panel shows how the CEP78L150S mutation weakens these interactions relative to CEP78 WT using ratios normalized for equal affinity enrichment of FLAG-tagged CEP78. (B–D) 293T cells expressing the indicated Myc-, FLAG-, or GFP-fusions were subjected to IP with anti-FLAG (B) or -GFP (C, D) beads and input and pellet fractions analyzed by SDS-PAGE and western blotting with Myc, FLAG, or GFP antibodies as indicated. FLAG-Ap80-NB used in (B) is a negative control. Molecular mass markers are indicated in kDa to the left of the blots. (E) Schematic of the CEP350 and CEP78 fusions used in IP analysis. LRR: leucine-rich repeat; CC: coiled coil. The CEP350 constructs were described in Eguether et al., 2014; Hoppeler-Lebel et al., 2007; the CEP78 constructs were generated in this study based on published sequence information (Hossain et al., 2017; Ascari et al., 2020; Brunk et al., 2016). N: N-terminal region; M: middle region; NM: N-terminal plus middle region; C: C-terminal region; FL: full length.
-
Figure 3—source data 1
Raw data from the CEP78 interactome analysis depicted in Figure 3A.
293T cells grown in Stable Isotope Labeling by Amino acids in Cell culture (SILAC) medium and expressing FLAG-CEP78 wildtype (WT), FLAG-CEP78L150S, or FLAG-Ap80 (negative control) were subjected to FLAG immunoprecipitation (IP) and pellets analyzed by mass spectrometry.
- https://cdn.elifesciences.org/articles/63731/elife-63731-fig3-data1-v2.xlsx
-
Figure 3—source data 2
Original western blots corresponding to Figure 3B.
Upper left, input Myc blot; upper middle, input 100 kDa FLAG blot; upper right, immunoprecipitation (IP) Myc and 100 kDa FLAG blots; bottom left, input 35 kDa FLAG blot; bottom right, IP 35 kDa FLAG blot.
- https://cdn.elifesciences.org/articles/63731/elife-63731-fig3-data2-v2.pdf
-
Figure 3—source data 3
Original western blots corresponding to Figure 3C.
Upper left, input Myc blot; upper middle, immunoprecipitation (IP) Myc blot; upper right, input GFP blot; bottom left, IP GFP blot; bottom middle, input FOP blot; bottom right, IP FOP blot.
- https://cdn.elifesciences.org/articles/63731/elife-63731-fig3-data3-v2.pdf
-
Figure 3—source data 4
Original western blots corresponding to Figure 3D.
Upper left, input Myc blot; upper right, immunoprecipitation (IP) Myc blot; lower left, input GFP blot; lower right, IP GFP blot.
- https://cdn.elifesciences.org/articles/63731/elife-63731-fig3-data4-v2.pdf
Figure 3—figure supplement 1
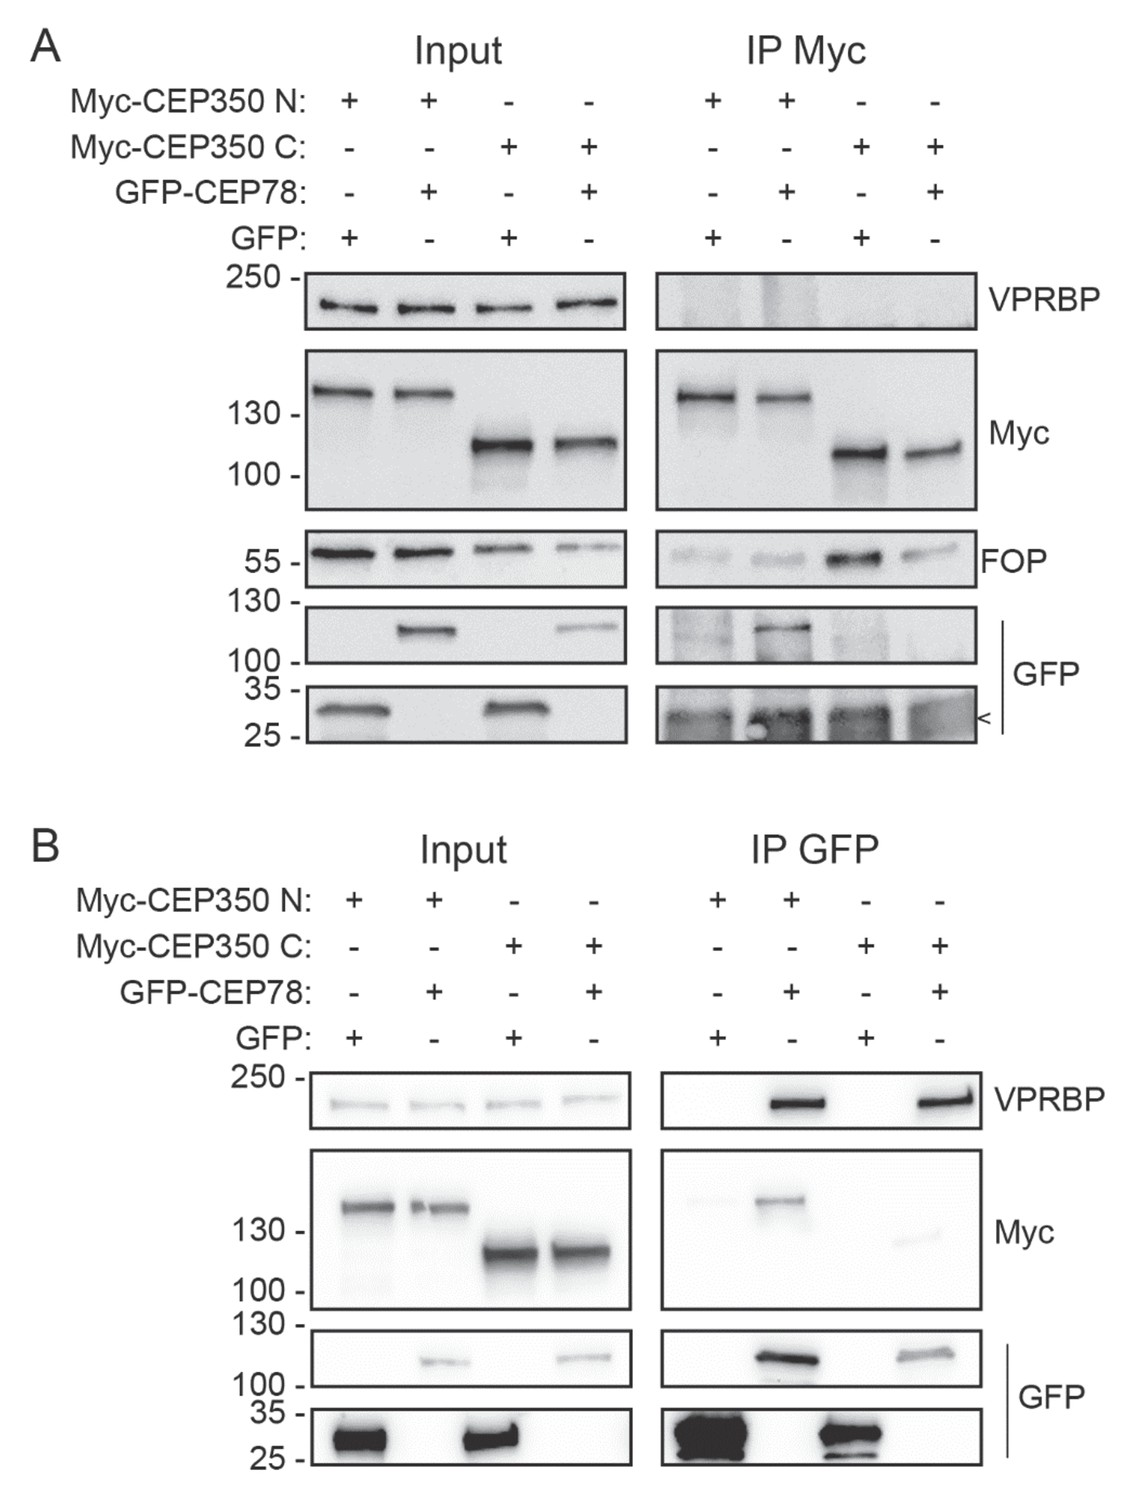
CEP78 associates independently with CEP350 and VPRBP.
(A) 293T cells expressing the indicated Myc- or GFP-fusions were subjected to immunoprecipitation (IP) with Myc antibody-coated beads and input and pellet (IP Myc) fractions analyzed by SDS-PAGE and western blotting with VPRBP, Myc, FOP, or GFP antibodies as indicated. (B) Similar analysis as in (A), but using GFP antibody-coated beads for IP instead of Myc beads. Molecular mass markers are indicated in kDa to the left of the blots. Arrowhead in (A) indicates IgG band observed in the lower part of the GFP blot.
-
Figure 3—figure supplement 1—source data 1
Original western blots for Figure 3—figure supplement 1A.
Top row from left to right: input VPRBP blot, immunoprecipitation (IP) VPRBP blot, input Myc blot. Second row from left to right: IP Myc blot, input FOP blot, IP FOP blot. Third row from left to right: input GFP blot (upper), IP GFP blot (upper). Fourth row left to right: input GFP blot (lower), IP GFP blot (lower).
- https://cdn.elifesciences.org/articles/63731/elife-63731-fig3-figsupp1-data1-v2.pdf
-
Figure 3—figure supplement 1—source data 2
Original western blots for Figure 3—figure supplement 1B.
Top row, input VPRBP blot; second row, immunoprecipitation (IP) VPRBP blot; third row left, input Myc blot; third row right, IP Myc blot; fourth row left, input GFP blots; fourth row right, IP GFP blots.
- https://cdn.elifesciences.org/articles/63731/elife-63731-fig3-figsupp1-data2-v2.pdf
Figure 4 with 1 supplement

CEP350 regulates stability and centrosomal recruitment of CEP78.
(A) 3D structured illumination microscopy (SIM) analysis of mNG-CEP78 and CEP350 localization in wildtype (WT) RPE1 cells, relative to CP110 and CEP164 (maximal z-projections). Cells were fixed and stained with the indicated antibodies. Montage panels show single-channel images of the mother centriole region (left panels) and overlays on previously published electron micrographs of isolated mother centrioles from KE37 cells, reproduced with permission from Paintrand et al., 1992 (top: cross-sections of proximal and subdistal-appendage region; bottom: side view). Scale bar, 200 nm. (B) Western blot analysis of CEP78 and α-tubulin (loading control) in serum-deprived hTERT-RPE1-BFP-Cas9 control (pMCB306), CEP350 knockout (KO) or FOP KO cells (Kanie et al., 2017). (C) Quantification of data in (B), based on three independent experiments analyzed in duplicates. Error bars indicate SD. Statistical analysis was done using Student’s t-test (unpaired, two-tailed). (D, F) Immunofluorescence microscopy (IFM) analysis of serum-deprived control and CEP350 KO ciliated (D) and non-ciliated cells (F) using antibodies as indicated. Dashed boxes indicate cropped images to highlight the centrosomal/ciliary area. Scale bars: 5 µm in representative images and 1 µm in insets. (E, G) Quantification of the relative mean fluorescence intensity (MFI) of CEP78 at the centrosome in serum-starved, ciliated (E) and non-ciliated (G) control and CEP350 KO cells, based on images as shown in (D) and (F), respectively. Statistical analysis was done using a two-tailed and unpaired Mann–Whitney test for ciliated cells and two-tailed and unpaired Student’s t-test for non-ciliated cells. Accumulated data from three individual experiments (n = 128 and 132 for control and CEP350 KO ciliated cells, respectively; n = 101 and 107 for control and CEP350 KO non-ciliated cells, respectively). a.u., arbitrary units; *p<0.05; **p<0.01; ****p<0.0001.
-
Figure 4—source data 1
Original western blots for Figure 4B.
Left, CEP78 blot; right, α-tubulin blot.
- https://cdn.elifesciences.org/articles/63731/elife-63731-fig4-data1-v2.pdf
Figure 4—figure supplement 1
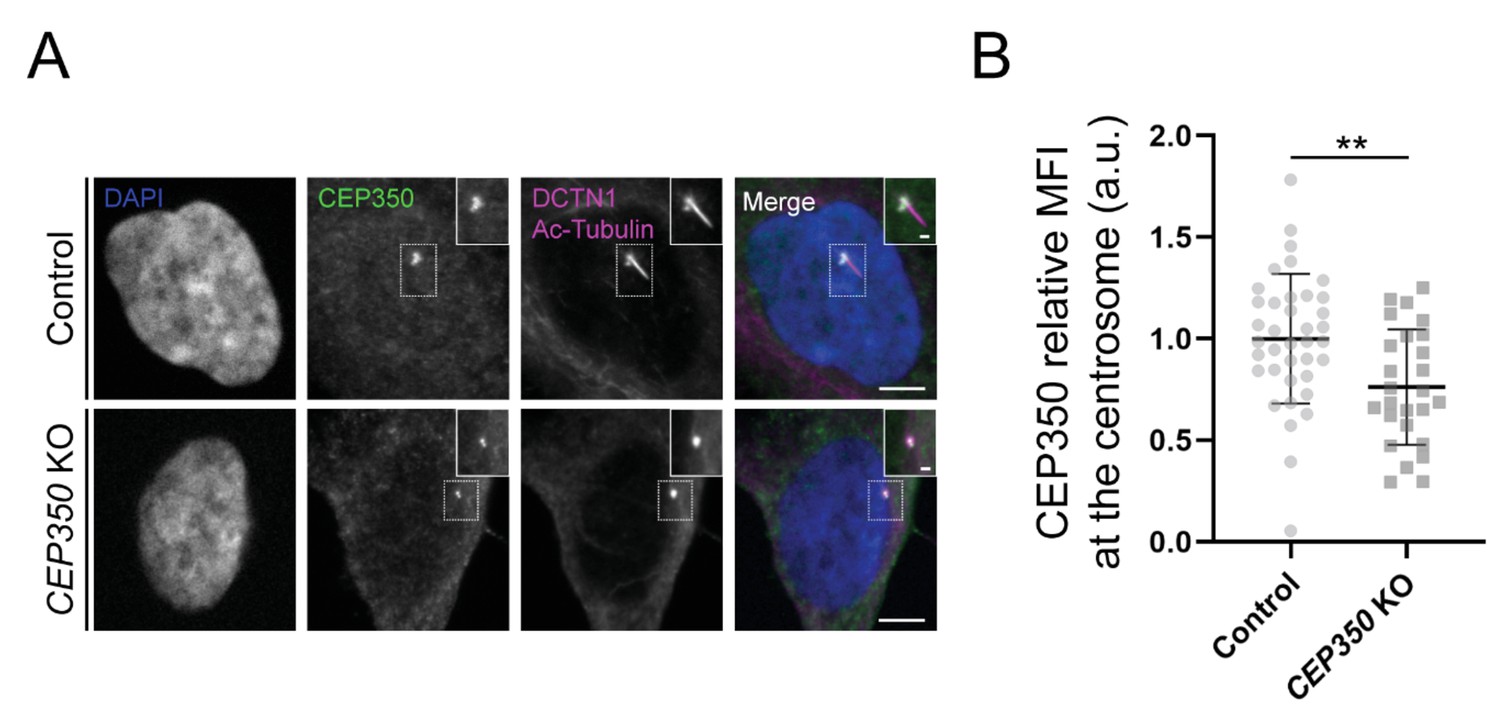
Validation of CEP350 knockout (KO) cells by immunofluorescence microscopy (IFM) analysis.
(A) RPE1 control and CEP350 KO cells were serum starved for 24 hr before fixation and staining with the indicated antibodies and DAPI for nuclear visualization. Insets show closeups of the centrosomal/ciliary area (dashed boxes). Scale bars: 5 µm in representative images and 1 µm in closeups. (B) Quantification of CEP350 mean fluorescence intensity (MFI) at the centrosome, based on images as shown in (A). A total of 38 and 26 cells were analyzed for control and CEP350 KO cells, respectively. For statistical analysis, the data was first normalized to the control group values and differences were assessed using an unpaired and two-tailed Student's t-test. Data is shown as the mean ± SD. a.u., arbitrary units; **p<0.01.
Figure 5
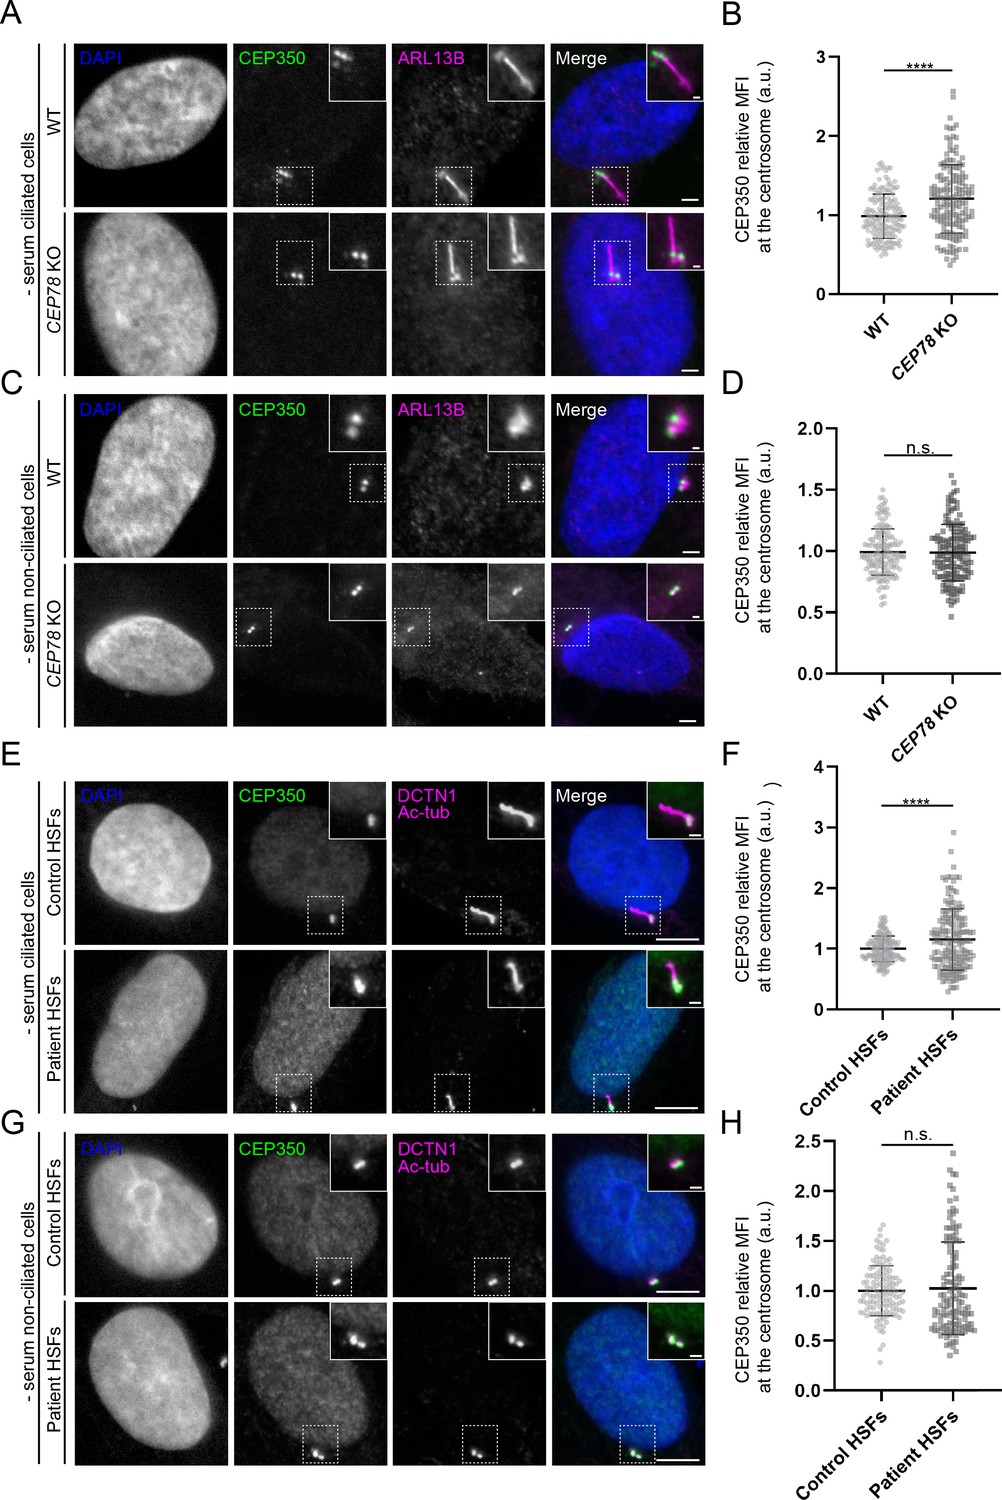
Altered centrosomal levels of CEP350 in CEP78 mutant cells.
(A, C, E, G) Representative immunofluorescence microscopy (IFM) images of ciliated (A) and non-ciliated (C) serum-deprived RPE1 wildtype (WT) and CEP78 knockout (KO) cells, and ciliated (E) and non-ciliated (G) serum-deprived control and CEP78-deficient (Patient) human skin fibroblasts (HSFs) (combined data from HSFs from patient F3: II:1 [Ascari et al., 2020] and patient 2702 r34, individual II-3 [Nikopoulos et al., 2016]) labeled with antibodies indicated in the figure. Insets show closeups of the centrosomal/ciliary area (dashed boxes). Scale bars: 5 µm in representative images and 1 µm in closeups. (B, D). Quantification of CEP350 relative mean fluorescence intensity (MFI) at the centrosome based on images as shown in (A, C). Data is shown as mean ± SD. A Student’s t-test was used as statistical analysis between the two groups based on three individual experiments (n = 157 or 158 for ciliated cells and n = 144–152 for non-ciliated cells). (F, H) Quantification of CEP350 relative MFI at the centrosome in HSFs based on images as shown in (E, G). Data is shown as mean ± SD. Student’s t-test was used as statistical analysis between the two cell groups based on seven individual experiments with a total of 154 and 156 analyzed ciliated cells (F), and three individual experiments with a total of 122 or 126 analyzed non-ciliated cells (H). a. u., arbitrary units; n.s., not statistically significant; ****p<0.0001.
Figure 6 with 2 supplements
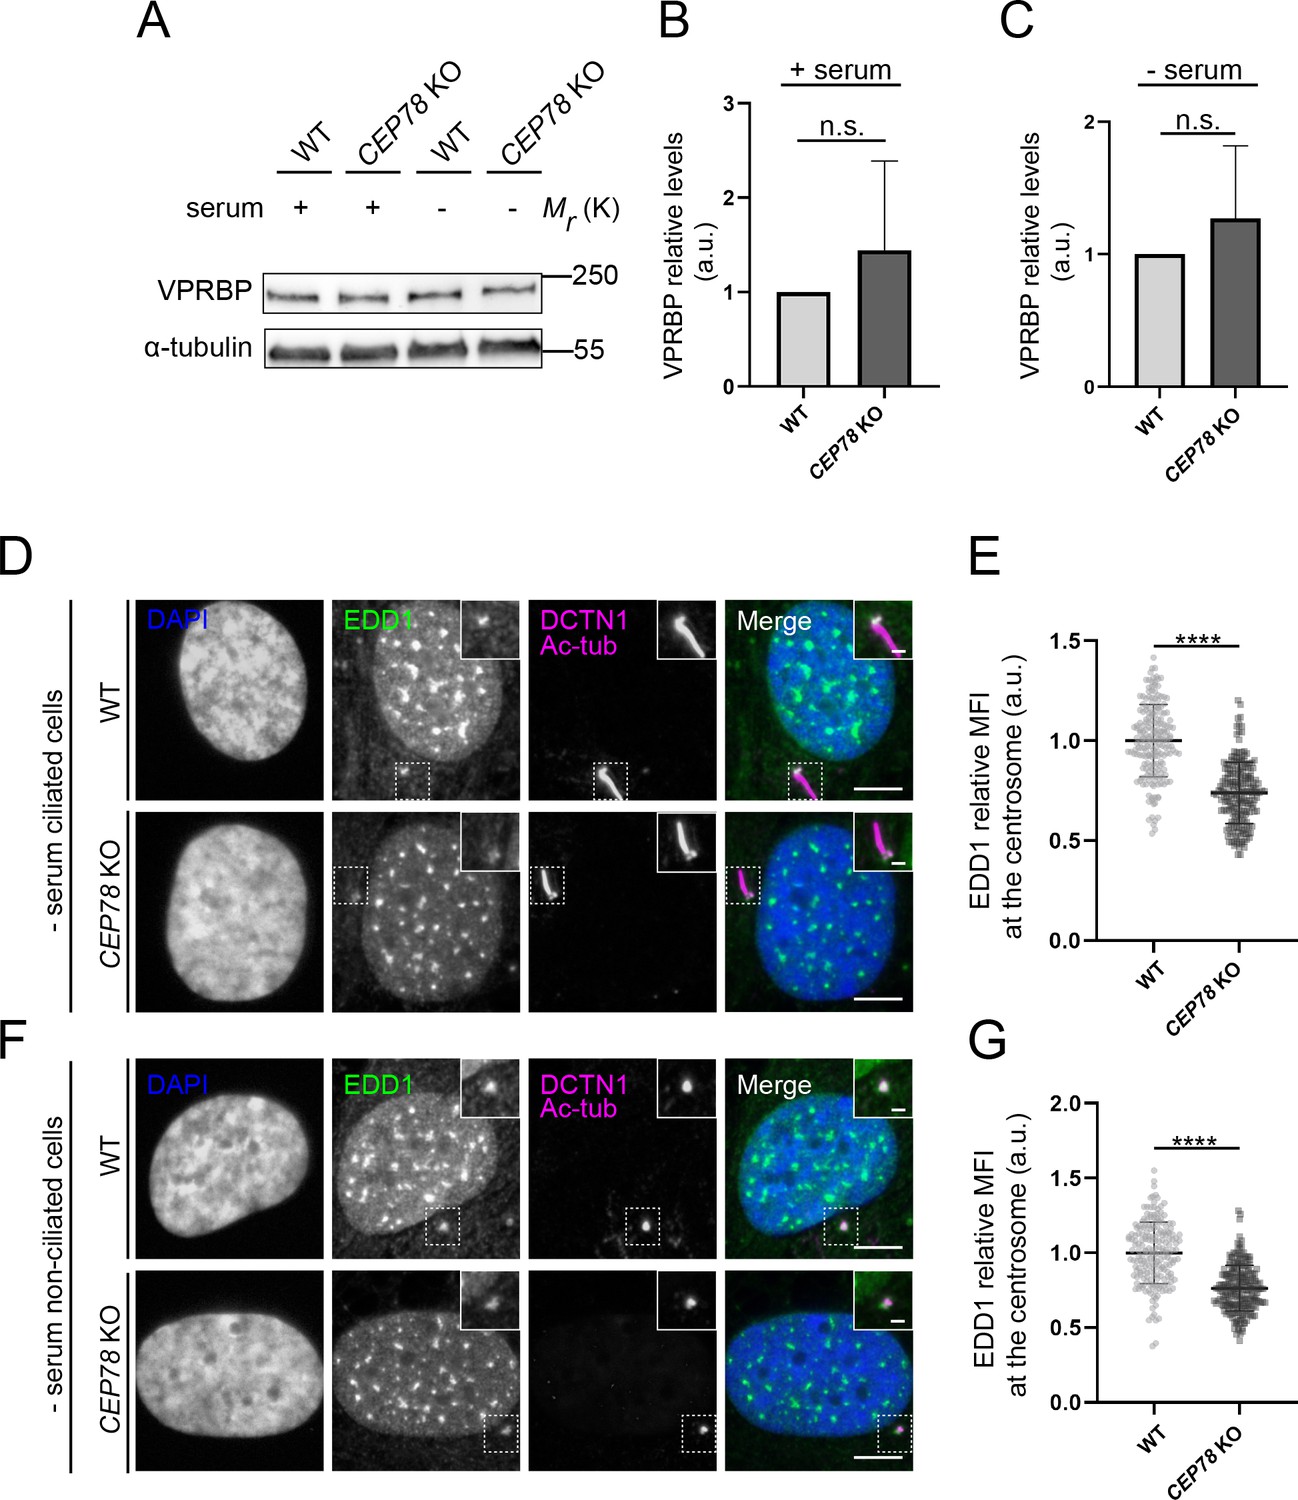
Analysis of EDD-DYRK2-DDB1VPRBP complex components in CEP78-deficient cells.
(A) Western blot analysis of VPRBP in lysates from serum-fed and serum-deprived RPE1 wildtype (WT) and CEP78 knockout (KO) cells. α-tubulin was used as a loading control. (B, C) Quantification of the VPRBP relative levels in the different conditions depicted in (A). Statistical analysis was performed using a Student’s t-test (unpaired, two-tailed) from five independent experiments analyzed in duplicates. Error bars indicate SD. (D, F) Representative immunofluorescence microscopy (IFM) images of ciliated (D) and non-ciliated (F) serum-deprived RPE1 WT and CEP78 KO cells labeled with antibodies against EDD1 (green) and DCTN1 plus acetylated tubulin (magenta). DAPI was used to mark the nucleus (blue). Insets show enlarged views of the cilium-centrosome region. Scale bars: 5 μm in original images and 1 μm in closeups. (E, G) Quantification of the EDD1 mean fluorescence intensity (MFI) at the centrosome based on images as shown in (D) and (F) using a two-tailed and unpaired Student’s t-test. Data is shown as mean ± SD. Student’s t-test from three independent experiments (n = 194 and n = 201 for ciliated WT and CEP78 KO cells, respectively; n = 194 and n = 217 for non-ciliated WT and CEP78 KO cells, respectively). Data is shown as mean ± SD. a.u., arbitrary units; n.s., not statistically significant; ****p<0.0001.
-
Figure 6—source data 1
Original western blots for Figure 6A.
Left, VPRBP blot; right, α-tubulin blot.
- https://cdn.elifesciences.org/articles/63731/elife-63731-fig6-data1-v2.pdf
Figure 6—figure supplement 1

VPRBP centrosomal levels are increased or unchanged in RPE1 CEP78 knockout (KO) cells.
(A, C) Representative immunofluorescence microscopy (IFM) micrographs of ciliated (A) and non-ciliated (C) serum-starved RPE1 wildtype (WT) and CEP78 KO cells labeled with the antibodies indicated in the figure. DAPI was used to mark the nucleus (blue). Insets show enlarged views of the cilium-centrosome region. Scale bars: 5 μm in original images and 1 μm in closeups. (B, D) Quantification of the VPRBP mean fluorescence intensity (MFI) at the centrosome based on images shown in (A) and (C) based on data from three independent experiments (n = 156 and n = 158 for ciliated WT and CEP78 KO cells, respectively; n = 162 and n = 166 for non-ciliated WT and CEP78 KO cells, respectively) using a two-tailed and unpaired Student’s t-test. Data is shown as mean ± SD and was first normalized in relation to WT values. a.u., arbitrary units; **p<0.01; n.s., not statistically significant.
Figure 6—figure supplement 2

EDD1 centrosomal levels are reduced in RPE1 CEP350 knockout (KO) cells.
(A, C) Representative immunofluorescence microscopy (IFM) micrographs of ciliated (A) and non-ciliated (C) serum-starved RPE1 control and CEP350 KO cells labeled with the antibodies indicated in the figure. DAPI was used to mark the nucleus (blue). Insets show enlarged views of the cilium-centrosome region. Scale bars: 5 μm in original images and 1 μm in closeups. (B, D) Quantification of the EDD1 mean fluorescence intensity (MFI) at the centrosome based on images as shown in (A) and (C) using a two-tailed and unpaired Student's t-test from two independent experiments (n = 105 and n = 111 for ciliated wildtype [WT] and CEP78 KO cells, respectively; n = 118 for non-ciliated WT and CEP78 KO cells). Data is shown as mean ± SD and was first normalized in relation to WT values. a.u., arbitrary units; ****p<0.0001.
Figure 7 with 4 supplements

CEP78-deficient cells display elevated cellular and centrosomal levels of CP110.
(A) Western blot analysis of lysates from serum-deprived RPE1 wildtype (WT) and CEP78 knockout (KO) cells using indicated antibodies. GAPDH was used as a loading control. (B) Quantification of the data shown in (A), based on four independent experiments analyzed in duplicates. Error bars indicate SD. Statistical analysis was done using Student’s t-test (unpaired, two-tailed). (C, F) Representative immunofluorescence microscopy (IFM) images of serum-starved ciliated (C) and non-ciliated (F) RPE1 WT and CEP78 KO cells labeled with antibodies against CP110 (green), combined DCTN1 and acetylated tubulin (Ac-tub; magenta) and DAPI to mark the nucleus (blue). Insets show enlarged views of the cilium-centrosome area. Scale bars: 5 µm in original images and 1 µm in closeups. (D, G) Quantification of the relative mean fluorescence intensity (MFI) of CP110 at the centrosome based on images as shown in (C) and (F), respectively. Student’s t-test (unpaired, two-tailed) from three independent biological experiments (n = 90 and n = 75 for ciliated RPE1 WT and CEP78 KO cells, respectively; n = 75 and n = 82 for non-ciliated RPE1 WT and CEP78 KO cells, respectively) was used for statistical analysis. Data is presented as mean ± SD. (E) Quantification of the relative MFI of CP110 at the mother centriole based on images shown in (C). Mann–Whitney test (two-tailed and unpaired) was used as statistical analysis based on two independent experiments (n = 61 and n = 62 for RPE1 WT and CEP78 KO cells, respectively). Data is presented as mean ± SD. (H) Representative IFM images of serum-deprived healthy and CEP78-deficient (Patient) human skin fibroblasts (HSFs) (data from patient 2702 r34, individual II-3 described in Nikopoulos et al., 2016) labeled with the indicated antibodies. DAPI was used as counterstaining to mark the nucleus. Dashed lines show closeup images of the centrosome region. Scale bars: 5 µm in original images and 1 µm in closeups. (I) Quantification based on observations of 151 and 155 cells of CEP78 control and patient cells, respectively, from three individual experiments. Student’s t-test (unpaired and two-tailed) was used to assess the differences between the two groups. a.u., arbitrary units; n.s., not statistically significant; **p<0.01; ***p<0.001; ****p<0.0001.
-
Figure 7—source data 1
Original western blots for Figure 7A.
Left, CP110 blot; right, GAPDH blot.
- https://cdn.elifesciences.org/articles/63731/elife-63731-fig7-data1-v2.pdf
Figure 7—figure supplement 1
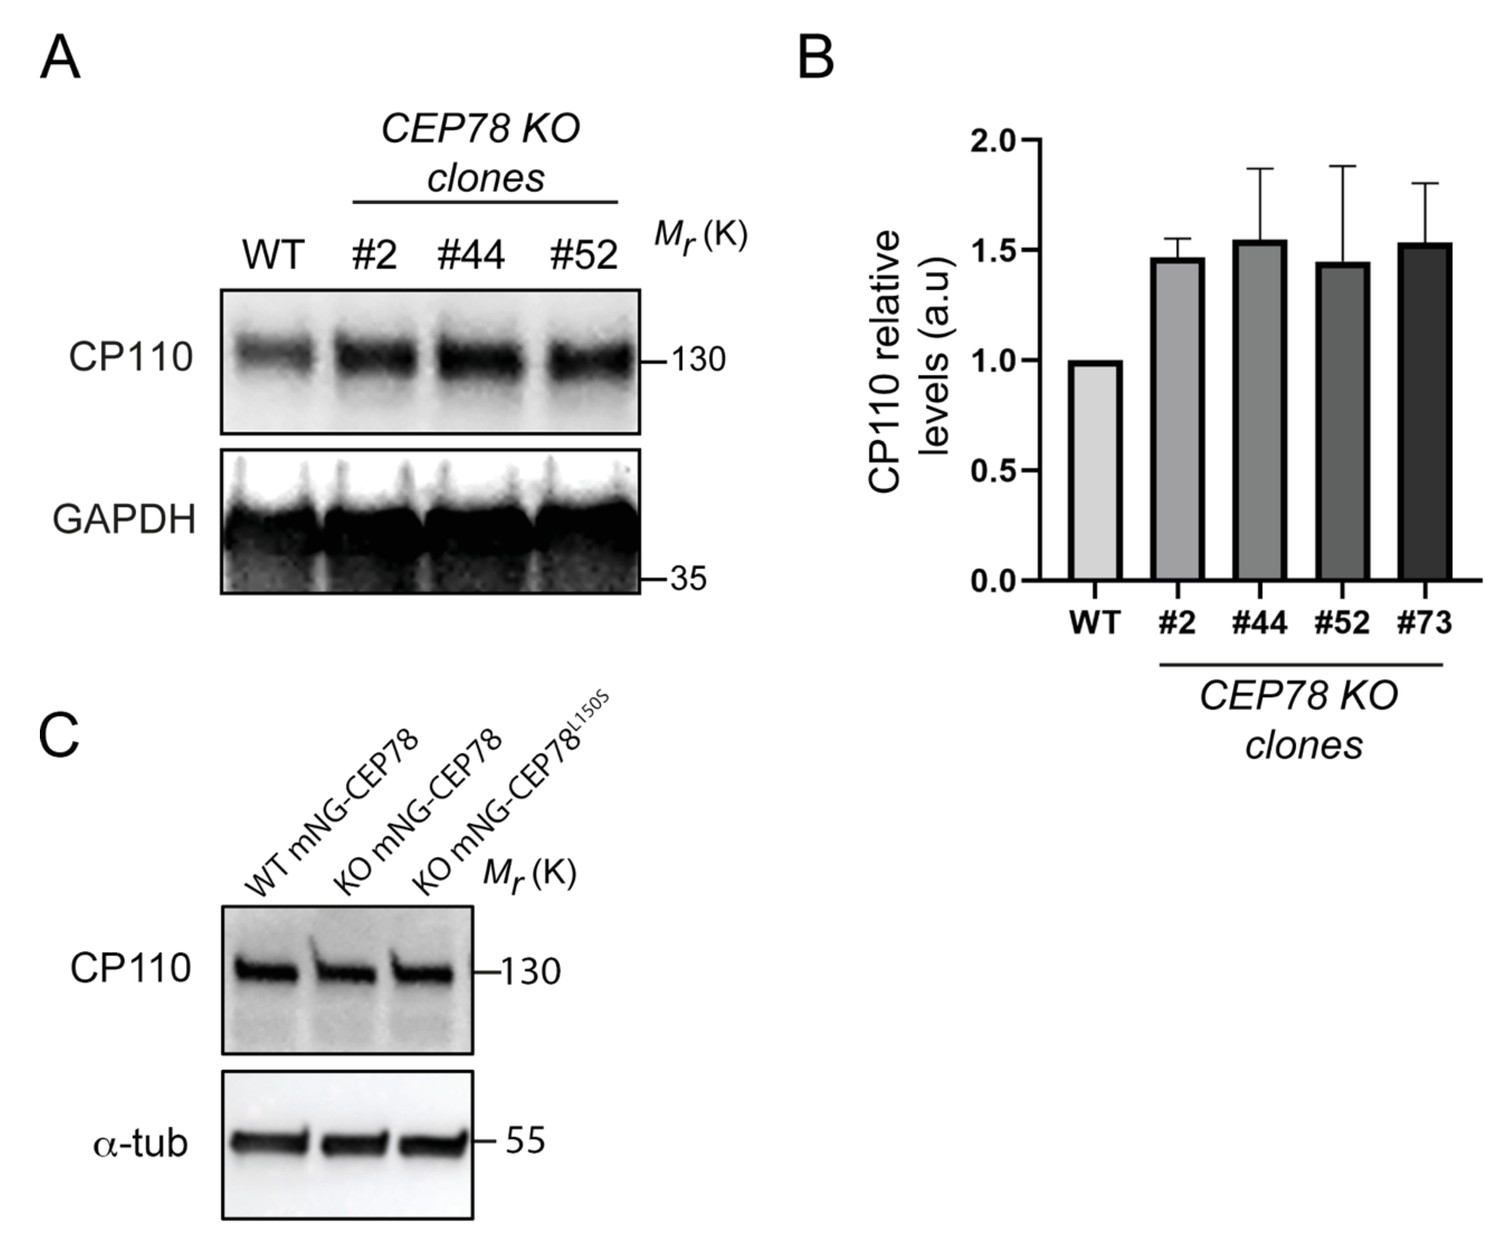
Elevated cellular CP110 levels in RPE1 CEP78 knockout (KO) clones.
(A) Western blot analysis of serum-deprived RPE1 wildtype (WT) and three different CEP78 KO clones, as indicated. Blots were probed with antibodies against CP110 and GAPDH (loading control). Molecular mass markers are indicated in kDa to the right. (B) Quantification of relative cellular CP110 levels based on blots as shown in (A) from two independent experiments. The means of the CEP78 KO clones were compared in relation to the WT mean, selected as the control group using an ordinary one-way ANOVA followed by a Dunnet's multiple comparison test. Error bars of graphs represent SD, and data are shown as mean ± SD. (C) Representative western blot of WT and CEP78 KO cells (KO; clone #73) stably expressing mNG-CEP78 or mNG-CEP78L150S as indicated. Blots were probed with indicated antibodies (α-tub = α-tubulin) and the molecular mass markers are indicated in kDa to the right of the blot. Quantification of relative CP110 band intensities revealed no significant changes between the three conditions; CP110 level relative to that of WT mNG-CEP78 was 95% ± 12% for the CEP78 KO mNG-CEP78 line and 90% ± 9% for the CEP78 KO mNG-CEP78L150S line, respectively (n = 3). Blots were probed with indicated antibodies.
-
Figure 7—figure supplement 1—source data 1
Original western blots for Figure 7—figure supplement 1.
Left, CP110 (upper) and GAPDH blots in (A). Right, CP110 (upper) and α−tubulin (lower) blots in (C).
- https://cdn.elifesciences.org/articles/63731/elife-63731-fig7-figsupp1-data1-v2.pdf
Figure 7—figure supplement 2
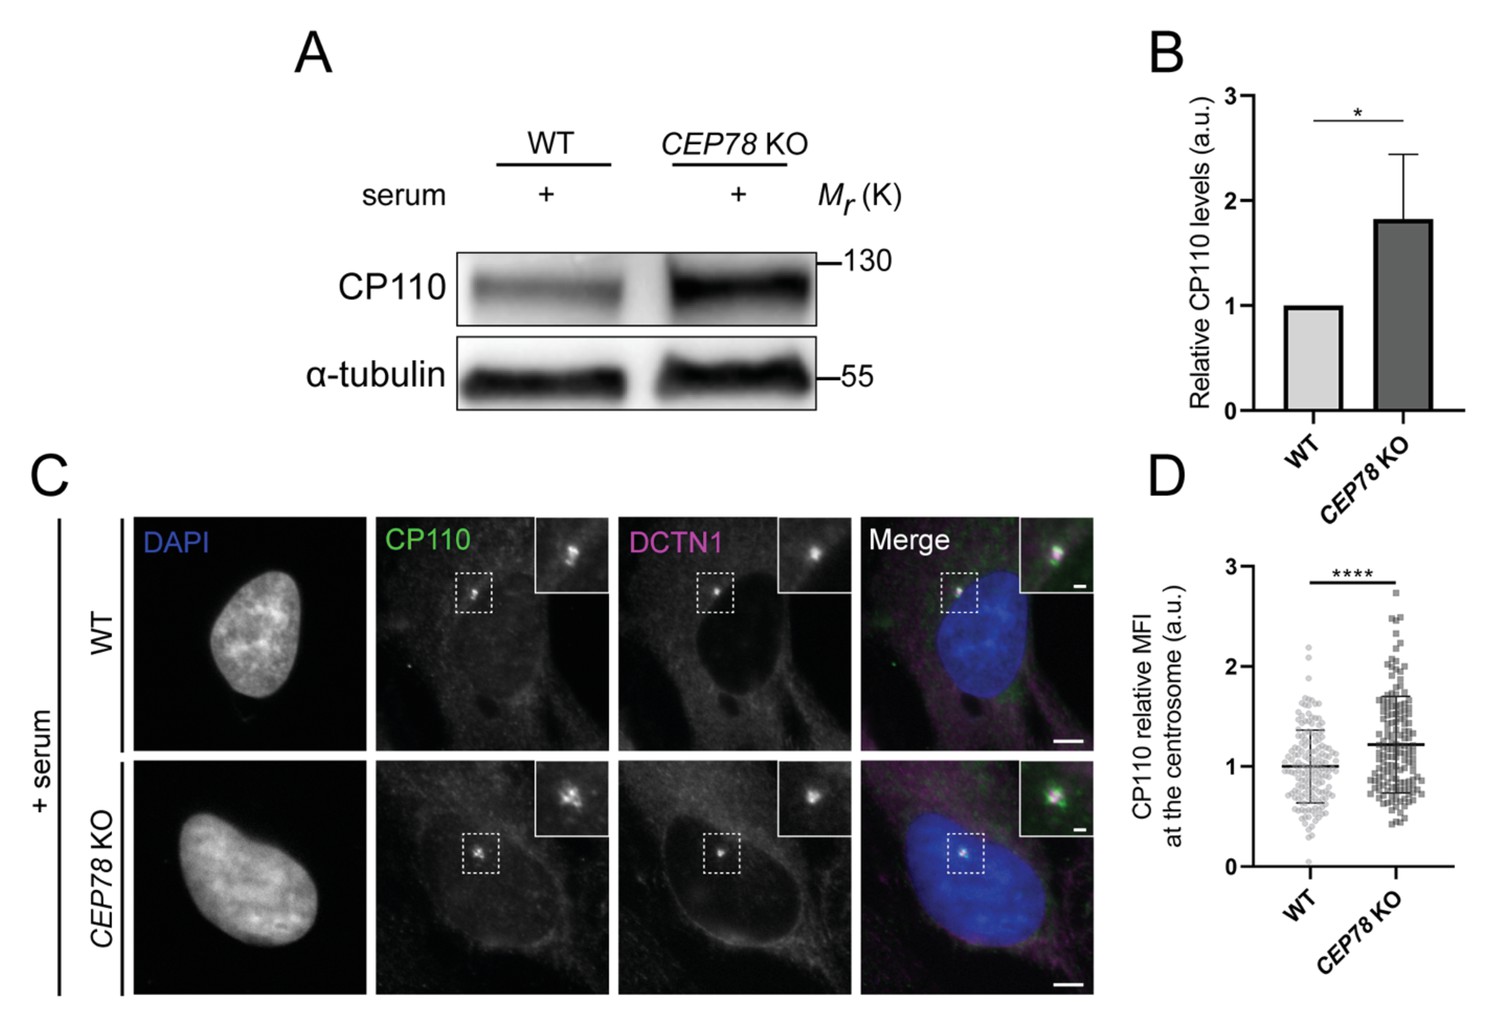
Serum-fed CEP78-deficient cells display elevated cellular and centrosomal levels of CP110.
(A) CP110 western blot analysis of lysates from RPE1 wildtype (WT) and CEP78 knockout (KO) cells grown in the presence of serum; α-tubulin serves as loading control. (B) Quantification of the CP110 blots depicted in (A) based on four individual experiments analyzed in duplicates. Error bars indicate SD. Student’s t-test (unpaired, two-tailed) was used to analyze the differences between both cellular groups. (C) Representative immunofluorescence microscopy (IFM) images of cycling RPE1 WT and CEP78 KO cells labeled with the indicated antibodies. DAPI was used to mark the nucleus. Insets show closeup images of the centrosome region. Scale bars: 5 µm in original images and 1 µm in closeups. (D) Data quantification of the relative mean fluorescence intensity (MFI) of CP110 based on images as shown in (C). Data is presented as mean ± SD. Statistical analysis was performed using Student’s t-test (unpaired, two-tailed) of three independent experiments (n = 158 for WT and n = 147 for CEP78 KO cells). a.u., arbitrary units; *p<0.05; ****p<0.0001.
-
Figure 7—figure supplement 2—source data 1
Original western blots for Figure 7—figure supplement 2A.
Top, CP110 blot; bottom, α-tubulin blot.
- https://cdn.elifesciences.org/articles/63731/elife-63731-fig7-figsupp2-data1-v2.pdf
Figure 7—figure supplement 3
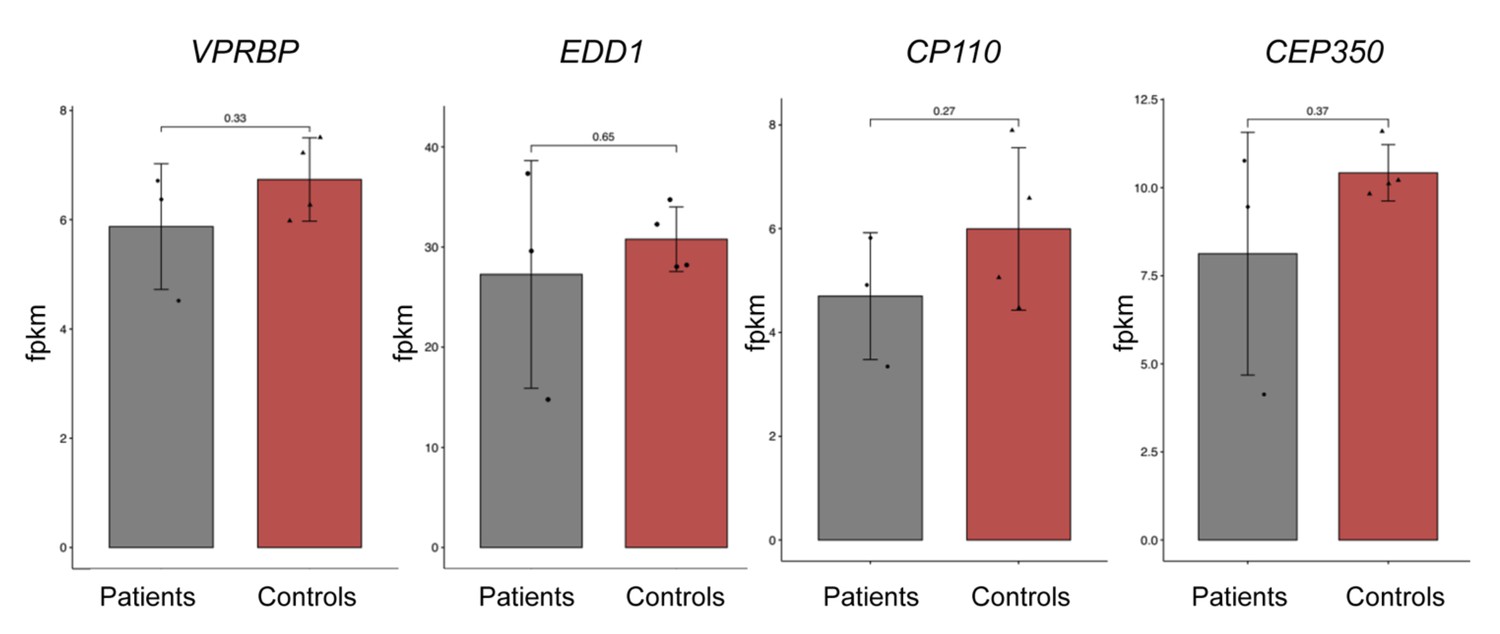
Barplots showing expression of CP110, CEP350, VRPBP, and EDD1 genes for patients (n = 3) and controls (n = 4), based on RNA-seq data of skin fibroblasts.
Expression levels are shown in fragments per kilobase of transcript sequence per millions base pairs sequenced (FPKM). The patient data are combined data from human skin fibroblasts (HSFs) derived from three different CEP78 probands; F3 individual II:1 described in Ascari et al., 2020 and KN10 individual II-1 and 2716s15 individual II-2 described in Nikopoulos et al., 2016. Control data are combined data from HSFs from four unaffected individuals described in the same studies. Nominal p-values derived from unpaired two-tailed t-tests are shown on top of the bars. None of the comparisons were significantly different (p<0.05).
-
Figure 7—figure supplement 3—source data 1
Raw RNA-seq data for Figure 7—figure supplement 3.
- https://cdn.elifesciences.org/articles/63731/elife-63731-fig7-figsupp3-data1-v2.xlsx
Figure 7—figure supplement 4
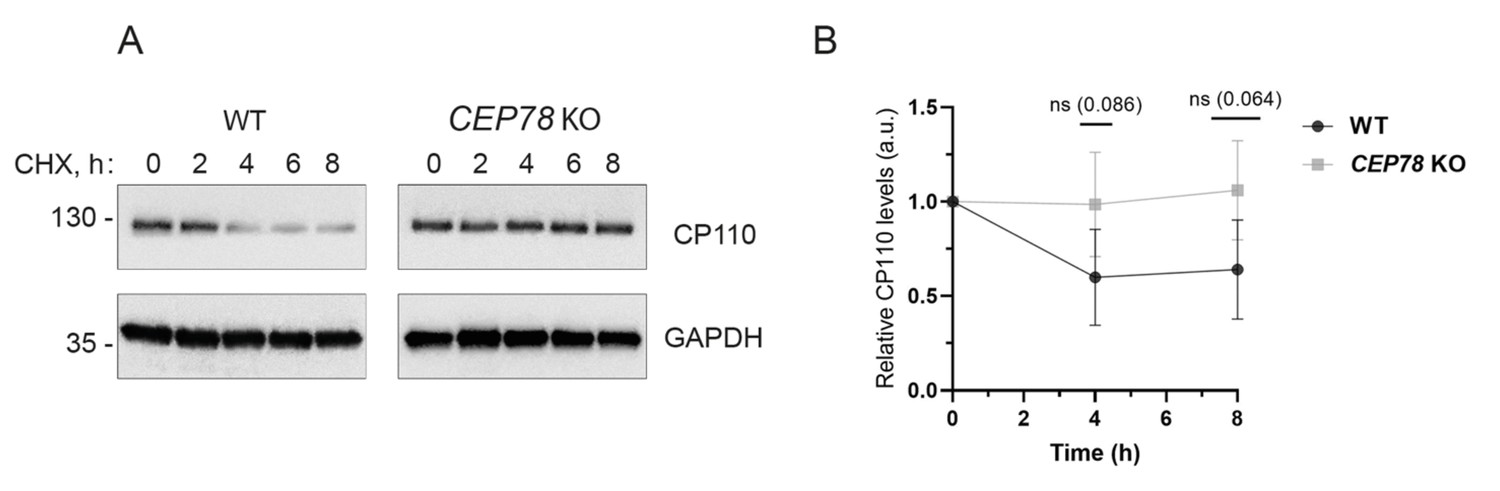
Relative CP110 levels in wildtype (WT) and CEP78 knockout (KO) cells treated with cycloheximide.
(A) Representative western blot of lysates from serum-deprived WT and CEP78 KO cells treated with 200 ng/ml cycloheximide (CHX) for the indicated times. The drug was added at the onset of serum deprivation (time 0 hr). Blots were probed with CP110 and GAPDH (loading control) antibodies; molecular mass markers are shown in kDa to the left. (B) Quantification of average CP110 levels determined based on western blots as shown in (A). The analysis is based on data from four independent experiments, normalized to the relative CP110 level for each cell type at time zero. Note that the data indicates decline in CP110 levels with time in the WT cells but not in the CEP78 KO cells; however, due to fluctuations from experiment to experiment the changes were not statistically significant (ns; p values denoted in parenthesis above the graphs). The data is presented as mean ± SD.
-
Figure 7—figure supplement 4—source data 1
Original western blots for Figure 7—figure supplement 4A.
Upper left, wildtype (WT) CP110 blot; upper right, WT GAPDH blot. Lower left, CEP78 knockout (KO) CP110 blot; lower right, CEP78 KO GAPDH blot.
- https://cdn.elifesciences.org/articles/63731/elife-63731-fig7-figsupp4-data1-v2.pdf
Figure 8 with 1 supplement

Depletion of CP110 from CEP78 knockout (KO) cells rescues their ciliation frequency phenotype.
(A) Representative western blots of RPE1 wildtype (WT) or CEP78 KO cells treated with control (siMock) or CP110-specific siRNA (siCP110). Cells were deprived of serum and blots were probed with antibody against CP110 or α-tubulin (loading control). (B) Quantification of relative cellular CP110 levels under different conditions based on blots as shown in (A) (n = 5 for WT and n = 4 for CEP78 KO cells; each sample was analyzed in duplicates). Error bars indicate SD. Data was normalized in relation to the WT cells transfected with Mock siRNA (WT siMock), designated as the control group. Differences of CP110 relative levels between CEP78 KO cells transfected with Mock or CP110 siRNA and WT cells transfected with CP110 siRNA in relation to control were assessed by performing an ordinary one-way ANOVA with a Dunnet's multiple comparison test. Differences of CP110 cellular levels between CEP78 KO cells transfected with the same siRNAs were addressed using an unpaired and two-tailed Student’s t-test. (C) Representative immunofluorescence microscopy (IFM) images of serum-deprived RPE1 WT and CEP78 KO cells treated with control (siMock) or CP110-specific siRNA (siCP110) and stained for ARL13B (green). DAPI marks the nucleus. Dashed boxes indicate cropped images to highlight the centrosomal/ciliary zone. Scale bars, 5 μm in representative images and 1 µm in insets. (D, E) Quantification of percentage of ciliated cells (D) and length of remaining cilia (E) in RPE1 WT or CEP78 KO cells treated with control (siMock) or CP110-specific siRNA (siCP110). The quantification is based on images as shown in (C) and represents data from four and five independent experiments, respectively, for RPE1 WT (n = 554–617 cells per condition) and CEP78 KO cells (n = 846–856 cells per condition). Ordinary one-way ANOVA with Dunnett’s multiple comparison test was used to compare the mean of the remaining groups in relation with the mean of RPE1 WT cells treated with siMock, which was designated as the control group. Differences between CEP78 KO cells transfected with the above-mentioned siRNA were discriminated using an unpaired and two-tailed Student's t-test. Bars in (D) represent SD and data in (E) is presented as mean ± SD. a.u., arbitrary units; *p<0.05; **p<0.01; ***p<0.001; ****p<0.0001. (F) Proposed model for how CEP78 regulates ciliogenesis and ciliary length control. See text for details.
-
Figure 8—source data 1
Original bots for Figure 8A.
Left, CP110 blot; right, α-tubulin blot.
- https://cdn.elifesciences.org/articles/63731/elife-63731-fig8-data1-v2.pdf
Figure 8—figure supplement 1
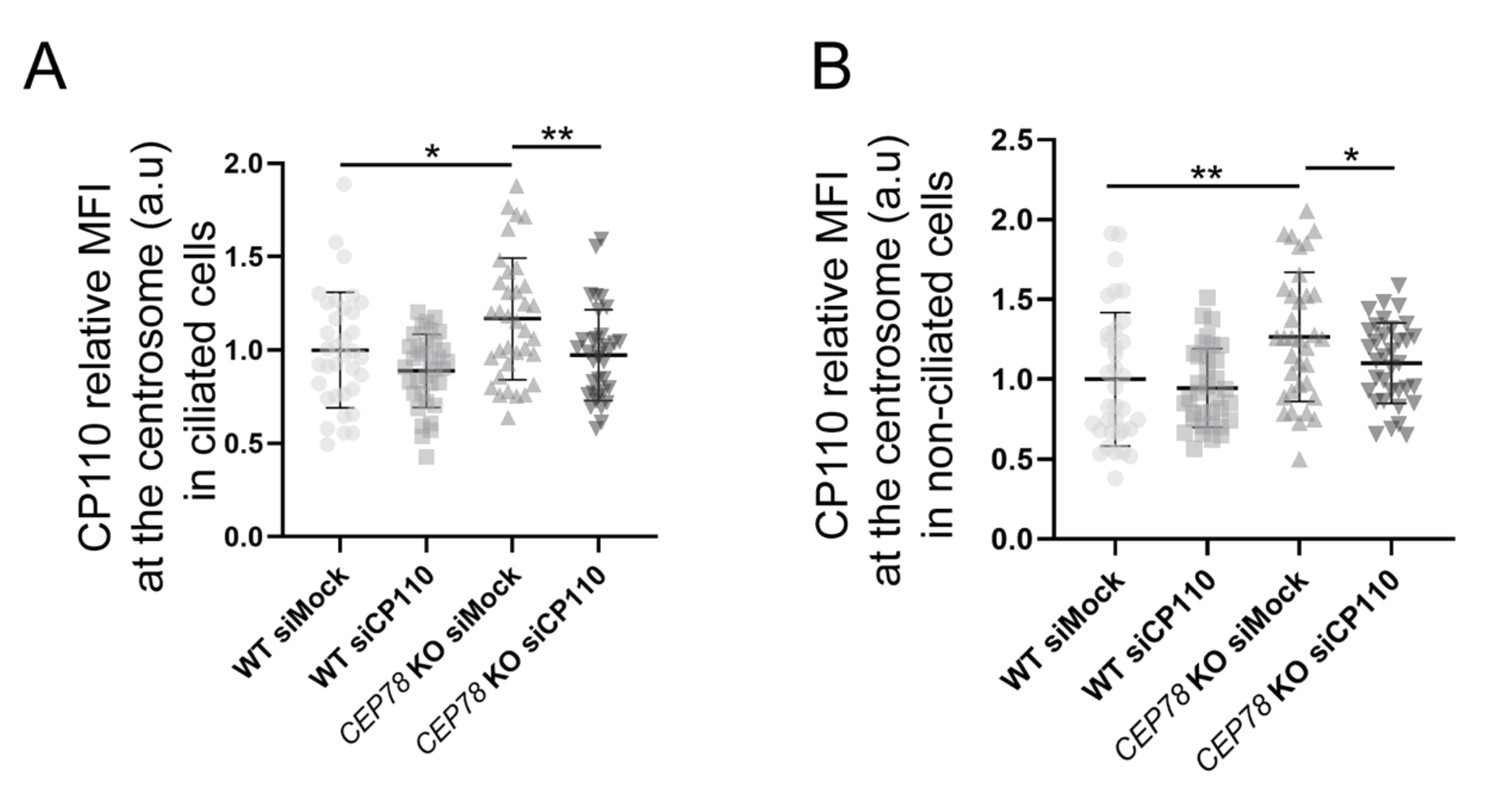
Validation of CP110 knockdown in RPE1 wildtype (WT) and CEP78 knockout (KO) cells by immunofluorescence microscopy (IFM).
(A, B) Quantification of CP110 centrosomal levels in ciliated and non-ciliated WT and CEP78 KO cells treated with control (siMock) or CP110-specific siRNA (siCP110). Both graphs are based on one biological experiment with 35 observations of ciliated and 35 observations of non-ciliated cells per condition. Statistical analysis was performed using an ordinary one-way ANOVA followed by a Dunnett's multiple comparison test amongst all groups in relation to WT siMock, designated as the control group. Differences between CEP78 KO cells treated with siMock or siCP110 were addressed by performing an unpaired and two-tailed Student's t-test. Bars are represented as mean ± SD. a.u., arbitrary units; *p<0.05; **p<0.01.
Tables
Appendix 1—key resources table
| Reagent type (species) or resource | Designation | Source or reference | Identifiers | Additional information |
|---|---|---|---|---|
| Cell line (Homo sapiens) | hTERT-RPE1 | ATCC | Cat# CRL-4000 | Derived from human retinal pigment epithelium |
| Cell line (H. sapiens) | Puromycin-sensitive hTERT-RPE1 | Francesc Garcia-Gonzalo, Autonomous University of Madrid, Madrid, Spain | N/A | |
| Cell line (H. sapiens) | hTERT-RPE1 CEP78 KO | Ascari et al., 2020 | Clone #73 | |
| Cell line (H. sapiens) | hTERT-RPE1 CEP78 KO | This study | Clone #44 | Generated as described in Ascari et al., 2020; contains px459-Cas9 plasmid inserted in exon 1 |
| Cell line (H. sapiens) | hTERT-RPE1 CEP78 KO | This study | Clone #52 | Generated as described in Ascari et al., 2020; contains homozygous frameshift mutation in exon 1 of CEP78 (single-nucleotide insertion in codon 10; GAC>GAAC) |
| Cell line (H. sapiens) | hTERT-RPE1 CEP78 KO | This study | Clone #2 | Generated as described in Ascari et al., 2020; homozygous frameshift mutation in exon 1 of CEP78 (single-nucleotide insertion in codon 10; GAC>GAAC) |
| Cell line (H. sapiens) | hTERT-RPE1 CEP78 KO/mNG-CEP78 | This study | N/A | Parental line is CEP78 KO clone #73 |
| Cell line (H. sapiens) | hTERT-RPE1 CEP78 KO/mNG-CEP78L150S | This study | N/A | Parental line is CEP78 KO clone #73 |
| Cell line (H. sapiens) | hTERT-RPE1 WT/mNG-CEP78 | This study | N/A | Parental line is puromycin-sensitive hTERT-RPE listed above |
| Cell line (H. sapiens) | hTERT-RPE1-BFP-Cas9/pMCB306 (pool) | Kanie et al., 2017 | N/A | Control cell line for CEP350 and FOP KO lines |
| Cell line (H. sapiens) | hTERT-RPE1- BFP-Cas9/CEP350 KO (pool) | Kanie et al., 2017 | N/A | |
| Cell line (H. sapiens) | hTERT-RPE1-BFP-Cas9/FOP KO (pool) | Kanie et al., 2017 | N/A | |
| Cell line (H. sapiens) | 293T | ATCC | Cat# CRL-3216 | Derived from human embryonic kidney |
| Cell line (H. sapiens) | Control skin fibroblasts | Nikopoulos et al., 2016 | N/A | Primary cells |
| Cell line (H. sapiens) | Compound heterozygous skin fibroblasts with twoCEP78 mutations: c.449T>C; p.Leu150Ser and c.1462–1G>T | Ascari et al., 2020 | F3: II:1 | Primary cells; these cells do not express detectable levels of CEP78 Ascari et al., 2020 |
| Cell line (H. sapiens) | Compound heterozygous skin fibroblasts with two CEP78 mutations: c.633delC; p.Trp212Glyfs*18 and c.499+5G>A; IVS + 5G>A | Nikopoulos et al., 2016 | 2702 r34, individual II-3 | Primary cells; these cells do not express detectable levels of CEP78 Nikopoulos et al., 2016 |
| Cell line (H. sapiens) | Homozygous substitution in the first invariant base of intron three splice donor site in CEP78: c.499+1G>T (IVS3+1G>T) | Nikopoulos et al., 2016 | KN10, individual II-1 | Primary cells; these cells express almost undetectable levels of CEP78 Nikopoulos et al., 2016 |
| Strain, strain background (Escherichia coli) | DH10B | Lab stock | N/A | |
| Antibody | Anti-acetylated-tubulin (mouse monoclonal) | Sigma-Aldrich | Cat# T7451 | IFM (1:2000) |
| Antibody | Anti-α-tubulin (mouse monoclonal) | Sigma-Aldrich | Cat# T5168 | WB (1:10,000) |
| Antibody | Anti-ARL13B (rabbit polyclonal) | Proteintech | Cat# 17711-1-AP | IFM (1:500) |
| Antibody | Anti-CEP78 (rabbit polyclonal) | Bethyl Laboratories | Cat# A301-799A-M | IFM (1:200) WB (1:500) |
| Antibody | Anti-CEP164 (rabbit polyclonal) | Sigma-Aldrich | Cat# HPA037606 | IFM (1:500) |
| Antibody | Anti-CEP350 (mouse monoclonal) | Abcam | Cat# Ab219831 (CL3423) | IFM (1:500) |
| Antibody | Anti-CEP350 (rabbit polyclonal) | Novus Biologicals | Cat# NB100-59811 | IFM (1:200) |
| Antibody | Anti-CP110 (rabbit polyclonal) | Proteintech | Cat# 12780-1-AP | IFM (1:200) WB (1:1500) |
| Antibody | Anti-DCTN1/P-150 (mouse monoclonal) | BD Biosciences | Cat# 610474 | IFM (1:500) |
| Antibody | Anti-EDD1 (rabbit polyclonal) | Bethyl Laboratories | Cat# A300-573A-M | IFM (1:100) |
| Antibody | Anti-FLAG (mouse monoclonal) | Sigma-Aldrich | Cat# F1804 | IFM (1:500) WB (1:1000) |
| Antibody | Anti-FLAG (rabbit polyclonal) | Sigma-Aldrich | Cat# F7425 | WB (1:1000) |
| Antibody | Anti-FGFR1OP/FOP (mouse monoclonal) | Novus Biologicals | Cat# H00011116- M01 | WB (1:500) |
| Antibody | Anti-GAPDH (rabbit polyclonal) | Cell Signaling Technology | Cat# 2118 | WB (1:1000) |
| Antibody | Anti-GFP (rabbit polyclonal) | Sigma-Aldrich | Cat# SAB4301138 | WB (1:500) |
| Antibody | Anti-GFP (rabbit polyclonal) | Santa Cruz Biotechnologies, Inc | Cat# sc-8834 | WB (1:500) |
| Antibody | Anti-Myc (mouse monoclonal, 9B11) | Cell Signaling Technology | Cat# 2276S | WB (1:1000) |
| Antibody | Anti-phospho Rb (S807/811) (mouse monoclonal) | Cell Signaling Technology | Cat# 9308 | WB (1:500) |
| Antibody | Anti-VPRBP (rabbit polyclonal) | Bethyl Laboratories | Cat# A301-877A-M | WB (1:200) |
| Antibody | Polyclonal Goat Anti-Mouse Immunoglobulins/Horseradish Peroxidase conjugated | Dako | Cat# P0447 | WB (1:10,000) |
| Antibody | Polyclonal Swine Anti-Rabbit Immunoglobulins/Horseradish Peroxidase conjugated | Dako | Cat# P0399 | WB (1:10,000) |
| Antibody | Donkey anti-Mouse IgG (H+L) Highly Cross-Adsorbed Secondary Antibody/Alexa Fluor 488-conjugated | Thermo Fisher Scientific | Cat# A21202 | IFM (1:500) |
| Antibody | Donkey anti-Mouse IgG (H+L) Highly Cross-Adsorbed Secondary Antibody/Alexa Fluor 568-conjugated | Thermo Fisher Scientific | Cat # A10037 | IFM (1:500) |
| Antibody | Donkey anti-Rabbit IgG (H+L) Highly Cross-Adsorbed Secondary Antibody/Alexa Fluor 488-conjugated | Thermo Fisher Scientific | Cat #A21206 | IFM (1:500) |
| Antibody | Donkey anti-Rabbit IgG (H+L) Highly Cross-Adsorbed Secondary Antibody/Alexa Fluor 568-conjugated | Thermo Fisher Scientific | Cat# A10042 | IFM (1:500) |
| Antibody | AffiniPure Donkey Anti-Mouse IgG (H+L)/Alexa Fluor 647-conjugated | Jackson ImmunoResearch | Cat# 715-605-150 | IFM (1:1000) |
| Antibody | Donkey Anti-Rabbit IgG H and L Secondary Antibodies/ Dylight 550-conjugated | Abcam | Cat# ab96892 | IFM (1:1000) |
| Enzyme | USER Enzyme | New England BioLabs | Cat# M5505L | |
| Enzyme | Phusion High-Fidelity DNA polymerase | New England BioLabs | Cat# M0530L | |
| Recombinant DNA reagent | H. sapiens Angiomotin p80 (Ap80)/pCMV-FLAG | Yi et al., 2013 | N/A | |
| Recombinant DNA reagent | H. sapiens CEP78 aa2–217/pEGFP-C1 | This study | CEP78 N-terminus (N) | PCR-amplified using primers h.CEP78.4f.kpn1 and hsEGFP-CEP78_Rv (651) |
| Recombinant DNA reagent | H. sapiens CEP78 aa203–403/pEGFP-C1 | This study | CEP78 middle (M) | PCR-amplified using primers hsEGFP-CEP78_Fwd (607) and hsEGFP-CEP78_Rv (1209) |
| Recombinant DNA reagent | H. sapiens CEP78 aa2–403/pEGFP-C1 | This study | CEP78 N-terminus plus middle (NM) | PCR-amplified using primers h.CEP78.4f.kpn1 and hsEGFP-CEP78_Rv (1209) |
| Recombinant DNA reagent | H. sapiens CEP78 aa395–722/pEGFP-C1 | This study | CEP78 C-terminus (C) | PCR-amplified using primers hsEGFP-CEP78_Fwd (1186) and hCEP78.rv_stop.bamh1 |
| Recombinant DNA reagent | H. sapiens CEP78/pEGFP-C1 | This study | N/A | PCR-amplified using primers h.CEP78.4f.kpn1 and hCEP78.rv_stop.bamh1 |
| Recombinant DNA reagent | H. sapiens CEP78/p3xFLAG-CMV/DEST | This study | p3xFLAG-CEP78 | |
| Recombinant DNA reagent | H. sapiens CEP78L150S/p p3xFLAG-CMV/DEST | This study | p3xFLAG-CEP78L150S | |
| Recombinant DNA reagent | Plasmid pEGFP-C1 (empty vector) | TaKaRa Bio | Cat# 6084-1 | |
| Recombinant DNA reagent | Gateway pDONR201 | Invitrogen/Thermo Fisher Scientific | Cat# 11798-014 | |
| Recombinant DNA reagent | p3xFLAG-CMV-10 | Sigma-Aldrich | Cat# E7658 | Cloning produces in-frame 3xFLAG tag in the N-terminus |
| Recombinant DNA reagent | p3xFLAG-CMV/DEST | Gift from Ronald Roepman lab, Radboud University Medical Center, Nijmegen, NL | pDEST306 | p3xFLAG-CMV-10 with Gateway Rf-B cassette inserted into the blunted HindIII/BamHI site |
| Recombinant DNA reagent | H. sapiens CEP350 aa1–983/pCS2+ with a 6xmyc tag | Eguether et al., 2014; Hoppeler-Lebel et al., 2007 | CAP N | |
| Recombinant DNA reagent | H. sapiens CEP350 aa2990–3117/pCS2+ with a 6xmyc tag | Eguether et al., 2014; Hoppeler-Lebel et al., 2007 | CAP C | |
| Recombinant DNA reagent | H. sapiens VPRBP/pCMV-Myc | Belzile et al., 2007 | Myc-VPRBP | Cloned in Sal1 and Not1 sites |
| Sequence-based reagent | H. sapiens CEP78 ORF/ GeneCopoiea pShuttleGateway PLUS ORF | GeneCopoiea | NCBI reference Sequence NM_001098802.3 | |
| Sequence-based reagent | H. sapiens CEP78 PCR primer | Sigma-Aldrich | attB forward | 5′-GGGACAAGTTGTACAAAAAACAGGCTTCATCGACTCCGTGAAGCTGC-3′ |
| Sequence-based reagent | H. sapiens CEP78 PCR primer | Sigma-Aldrich | attB reverse | 5-GGGGACCACTTTGTACAAGAAAGCTGGGTTTCAGGAATGCAGGTCCTTTCCAG-3′ |
| Sequence-based reagent | H. sapiens CEP78 PCR primer | Sigma-Aldrich | CEP78 mut_F | 5′-agagacaggtgcaccgaagaagccgatttattcaatc-3′ |
| Sequence-based reagent | H. sapiens CEP78 PCR primer | Sigma-Aldrich | CEP78 mut_R | 5′-gattgaataaatcggcttcttcggtgcacctgtctct-3′ |
| Sequence-based reagent | H. sapiens CEP78 PCR primer | Eurofins Genomics | hCEP78.4f.kpn1 | 5′-AAGGTACC ATCGACTCCGTGAAGCTGCG-3′ |
| Sequence-based reagent | H. sapiens CEP78 PCR primer | Eurofins Genomics | hsEGFP-CEP78_Rv (651) | 5′-AAGGATCCTTAGCGAAGACTCTCAGCCCAG-3′ |
| Sequence-based reagent | H. sapiens CEP78 PCR primer | Eurofins Genomics | hsEGFP-CEP78_Fwd (607) | 5′- GGGGTACC CAGACCATGAGAAGGCATGA -3′ |
| Sequence-based reagent | H. sapiens CEP78 PCR primer | Eurofins Genomics | hsEGFP-CEP78_Rv (1209) | 5′-GGGGATCC TTAACCCCTGTGTCTTTTTGCAC-3′ |
| Sequence-based reagent | H. sapiens CEP78 PCR primer | Eurofins Genomics | hsEGFP-CEP78_Fwd (1186) | 5′-GGGGTACC GCAGAACGTGCAAAAAGACA-3′ |
| Sequence-based reagent | H. sapiens CEP78 PCR primer | Eurofins Genomics | hCEP78.rv_stop.bamh1 | 5′-GAGGATCC ACAGGAATGCAGGTCCTTTC-3′ |
| Sequence-based reagent | Control siRNA | Eurofins Genomics | N/A | 5′-UAAUGUAUUGGAAGGCA-3′ |
| Sequence-based reagent | H. sapiens CP110 siRNA | Eurofins Genomics /Spektor et al., 2007 | N/A | 5′-GCAAAACCAGAAUACGAGATT-3′ |
| Chemical compound, drug | DAPI (4′, 6-diamidino-2-phenylindole) | Thermo Fisher Scientific | Cat# D1306 | Stored at −20°C as stock solution of 20 μg/ml in H2O |
| Chemical compound drug | FuGENE6 | Promega | Cat# E2692 | |
| Chemical compound, drug | DharmaFECT Duo Transfection reagent | Dharmacon | Cat# T-2010-03 | |
| Software, algorithm | cellSens Dimension | Olympus | Version 1.18 | |
| Software, algorithm | Zen Black 2012 | Zeiss | Version 2012 | |
| Software, algorithm | Adobe Photoshop | Adobe | Version 21.0.1 | |
| Software, algorithm | Adobe Illustrator | Adobe | Version 24.2.1 | |
| Software, algorithm | ImageJ | NIH | Mac OS X or Windows | |
| Software, algorithm | GraphPad Prism 6.0 | GraphPad Software Inc | Mac OS X or Windows | |
| Software, algorithm | MaxQuant | Cox and Mann, 2008 | Version 1.6.1.0 | |
| Other | Anti-FLAG M2 Affinity Gel | Sigma-Aldrich | Cat# A2220 | |
| Other | Anti-c-Myc Agarose Affinity Gel antibody produced in rabbit | Sigma-Aldrich | Cat# A7470-1 ml | |
| Other | GFP-Trap Agarose | ChromoTek GmbH | Cat# gta-20 | |
| Other | QuickChange Lightning Site-Directed Mutagenesis Kit | Agilent | Cat# 210518 | |
| Other | Direct-zol RNA Miniprep Kit | Zymo Research | Cat# R2051 | |
| Other | Agilent RNA Nano 6000 Assay Kit | Agilent | Cat# 5067-1511 | |
| Other | NEBNext Ultra RNA Library Prep Kit for Illumina | New England BioLabs | Cat# E7530L | |
| Other | Invitrogen Qubit RNA Assay Kit | Thermo Fisher Scientific | Cat# 32852 | |
| Other | AMPure XP system | Beckman Coulter Life Sciences | Cat# A63881 |
Additional files
Download links
A two-part list of links to download the article, or parts of the article, in various formats.
Downloads (link to download the article as PDF)
Open citations (links to open the citations from this article in various online reference manager services)
Cite this article (links to download the citations from this article in formats compatible with various reference manager tools)
CEP78 functions downstream of CEP350 to control biogenesis of primary cilia by negatively regulating CP110 levels
eLife 10:e63731.
https://doi.org/10.7554/eLife.63731


