Perinatal granulopoiesis and risk of pediatric asthma
- Department of Microbiology and Immunology, University of Illinois, United States
- Department of Medicine, Division of Pulmonary, Critical Care, Sleep, and Allergy, University of Illinois, United States
- Department of Women, Children and Family Health Science, College of Nursing, University of Illinois, United States
- Department of Medicine and Cancer Center, University of Illinois, United States
- Channing Division of Network Medicine, Department of Medicine, Brigham and Women's Hospital, Harvard Medical School, United States
- Department of Environmental Health, Harvard T.H. Chan School of Public Health, United States
- Division of Pulmonary Medicine, Department of Pediatrics, University of Rochester, United States
- Division of Chronic Disease Research Across the Life Course, Department of Population Medicine, Harvard Medical School and Harvard Pilgrim Health Care Institute, United States
- Department of Medicine, Division of Nephrology, University of Illinois, United States
- Department of Bioengineering, University of Illinois, United States
Figures
Figure 1
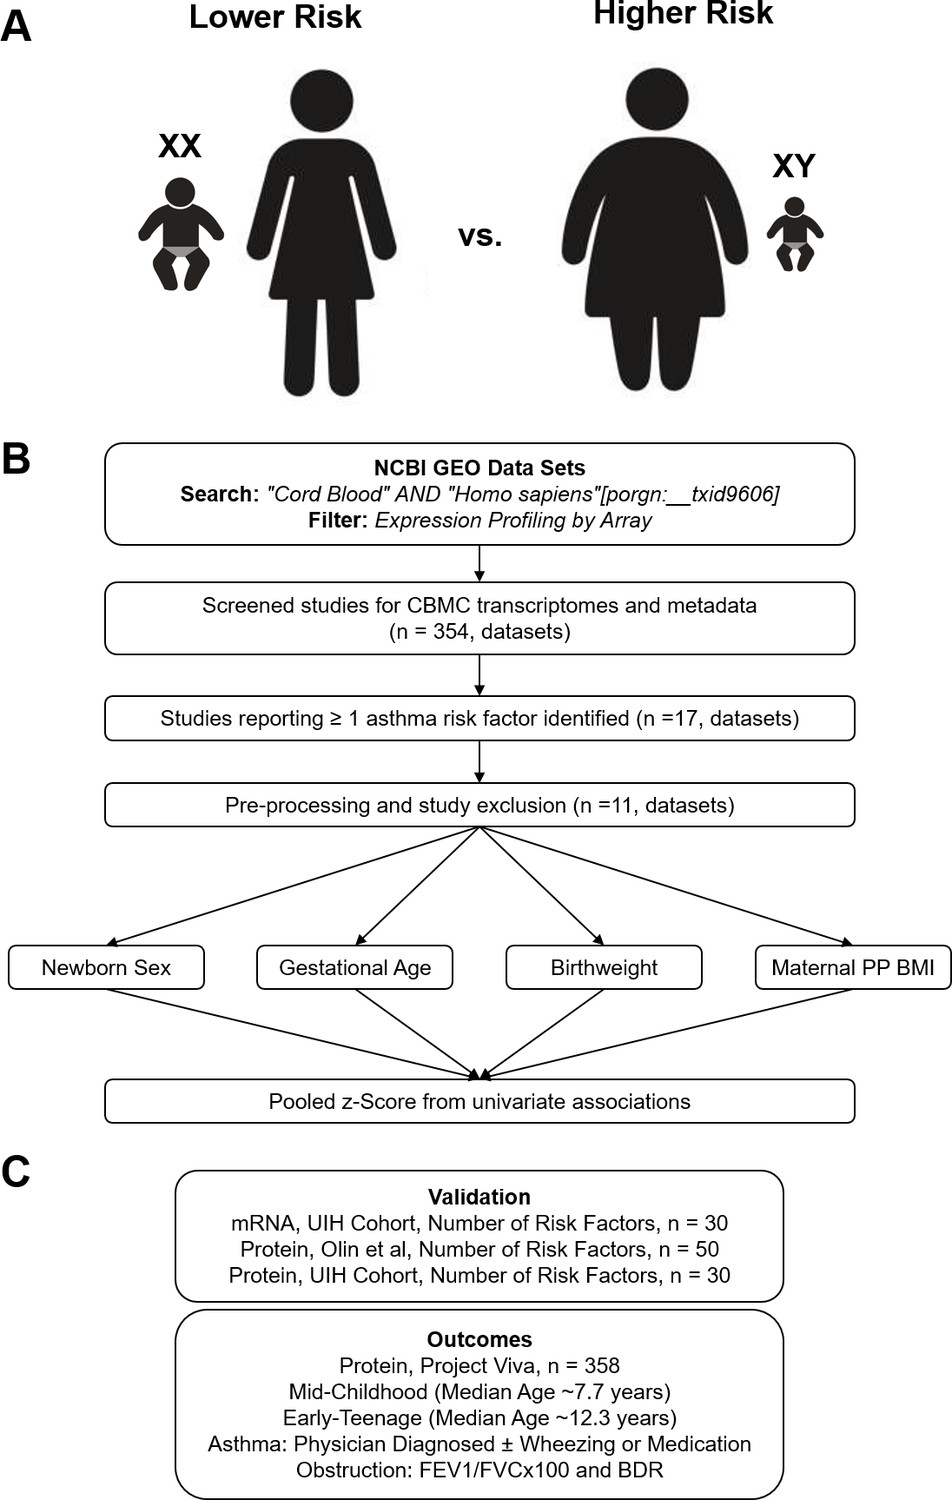
Overview of analytic approach used to identify biological risk for pediatric asthma.
(A) Previously described perinatal risk factors for development of pediatric asthma: preterm birth, low birthweight, male, and maternal obesity. (B) Flow diagram of search, inclusion, exclusion, and univariate testing for transcriptomic analysis. (C) Cohorts, types of biosamples, and outcomes used for validation.
Figure 2 with 1 supplement
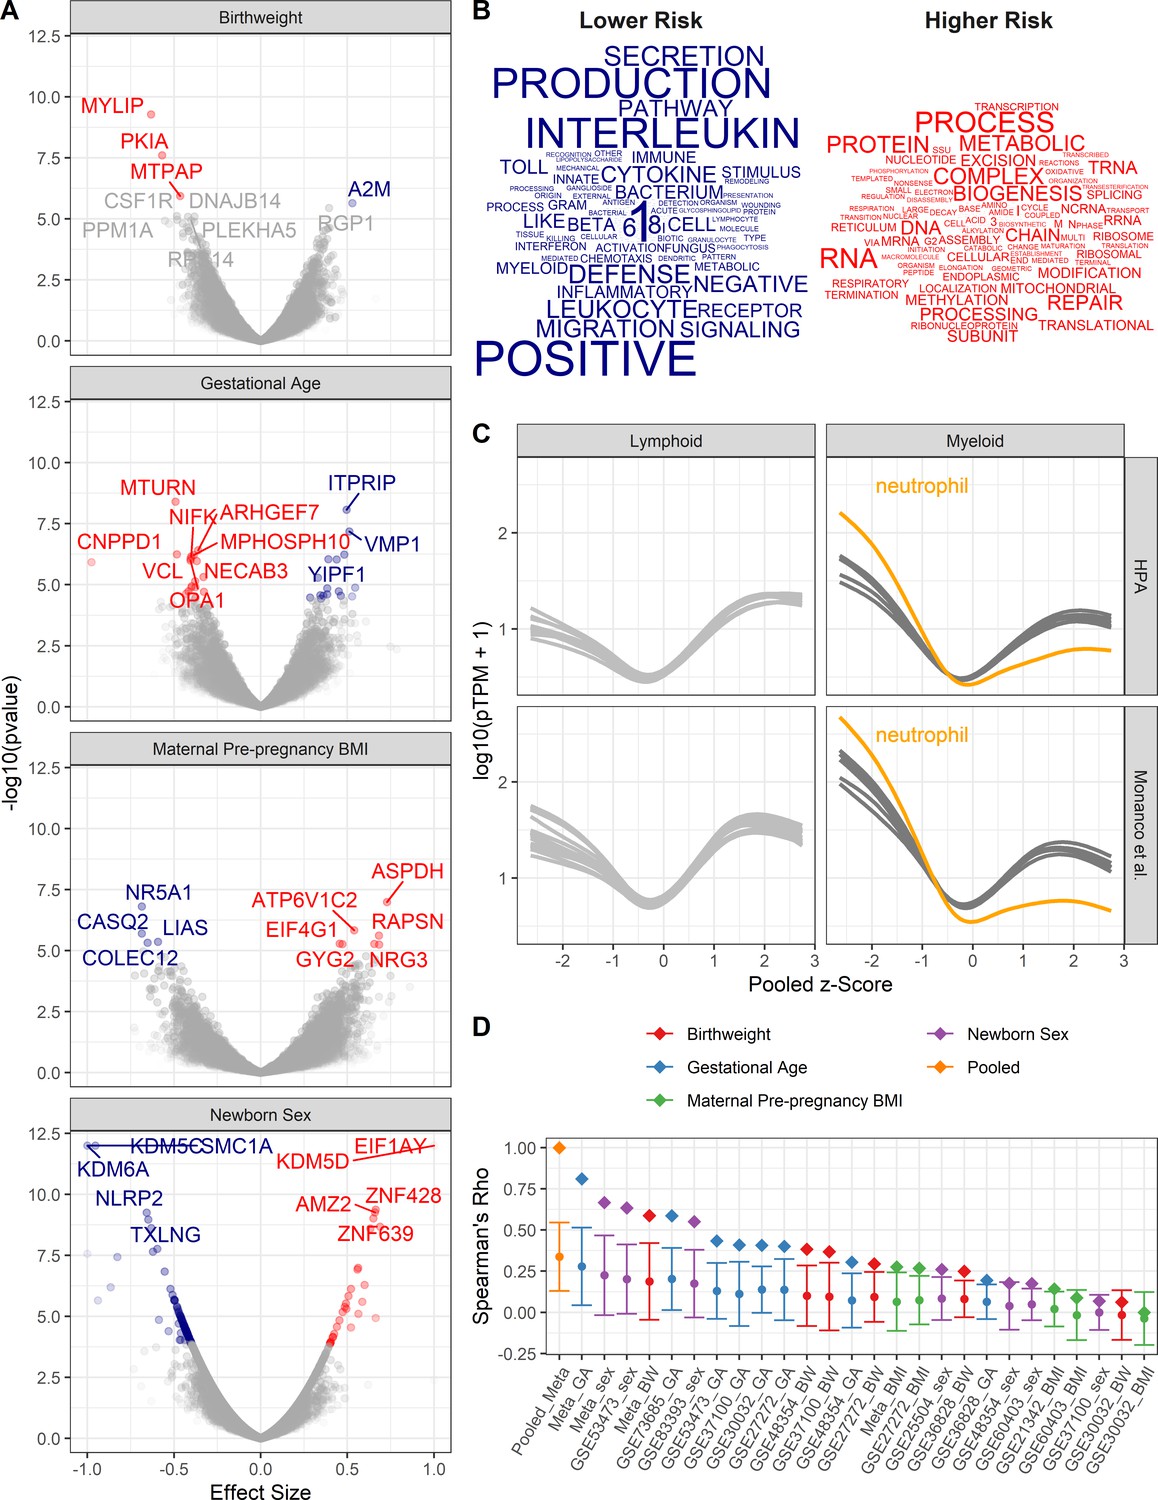
Pooled meta-analysis z-scores identify gene expression signatures related to asthma risk.
Significant (FDR < 1%) genes and gene sets are colored by their association with either higher (red) or lower (blue) risk. (A) Volcano plots of gene expression for univariate analyses. Top 10 most significant genes labeled. (B) Word clouds of GO terms significantly enriched (FDR < 1%) using the pooled z-score as pre-ranked list for GSEA. (C) Protein coding transcripts per million reads (pTPM) in peripheral blood cells (Human Protein Atlas and Monaco et al (Uhlen et al., 2010; Monaco et al., 2019) relative to pooled z-score. Each line represents one cell type; neutrophils highlighted in orange. (D) Spearman’s correlation between pooled z-statistic and individual analyses (diamonds). Average Spearman’s correlations between individual analyses and combination of all other analyses (circle), SD indicated by error bars.
Figure 2—figure supplement 1
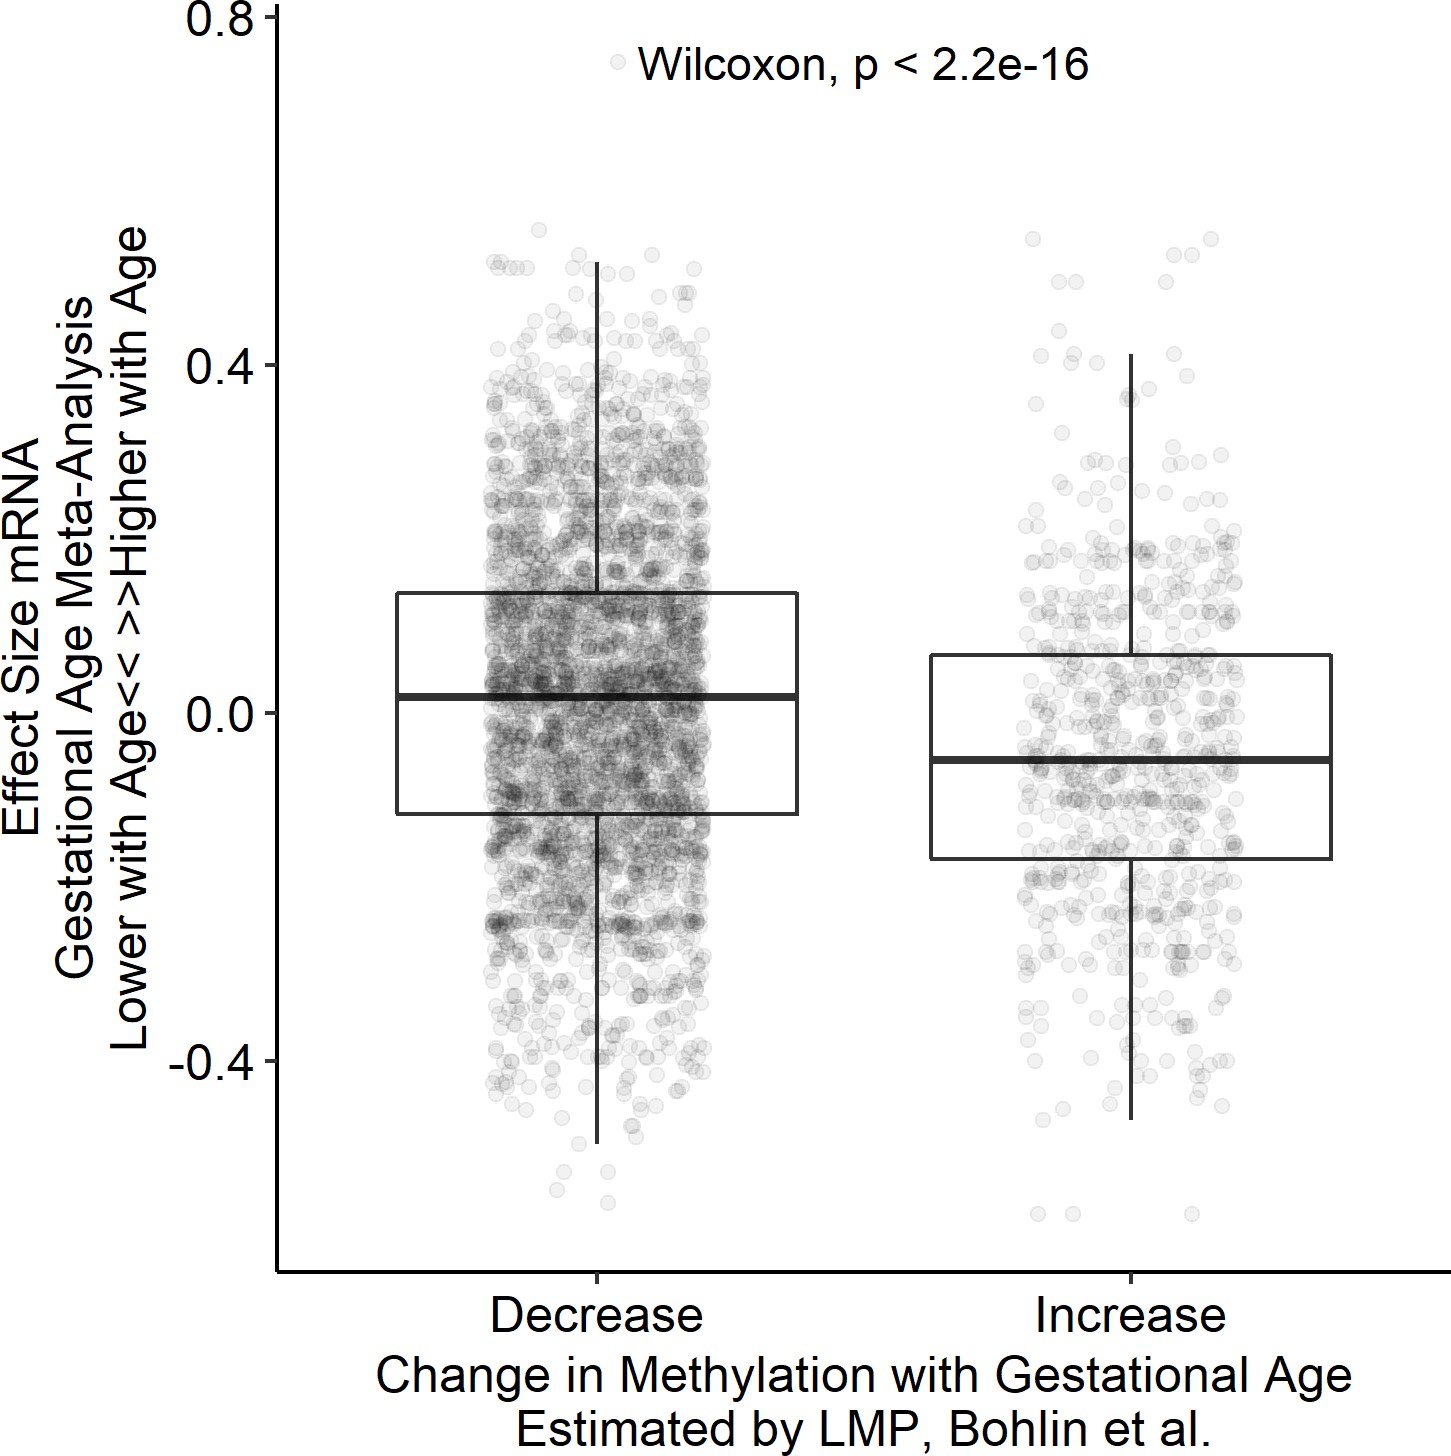
Association between differentially methylated genes and gene expression changes with gestational age.
Comparison of effect size associated with gestational age for genes that were reported as differentially methylated by Bohlin et al., 2016. Gene with increased methylation associated with gestational age demonstrate reduced expression with increasing gestational age.
Figure 3 with 2 supplements

Validation cohort identifies gene signature associated with pediatric asthma risk factors.
Color labeling indicating association with either higher (red) or lower (blue) risk of pediatric asthma development. (A) Dot-plot demonstrating validation between meta-analysis pooled z-score and UIH cohort mRNAseq z-score. Colored and labeled dots indicate those with non-parametric replication score greater than 3 and 4, respectively. (B,C) Association between number of risk factors or individual risk factors and eigenvalue of gene signature (validation score > 3), UIH cohort.
Figure 3—figure supplement 1
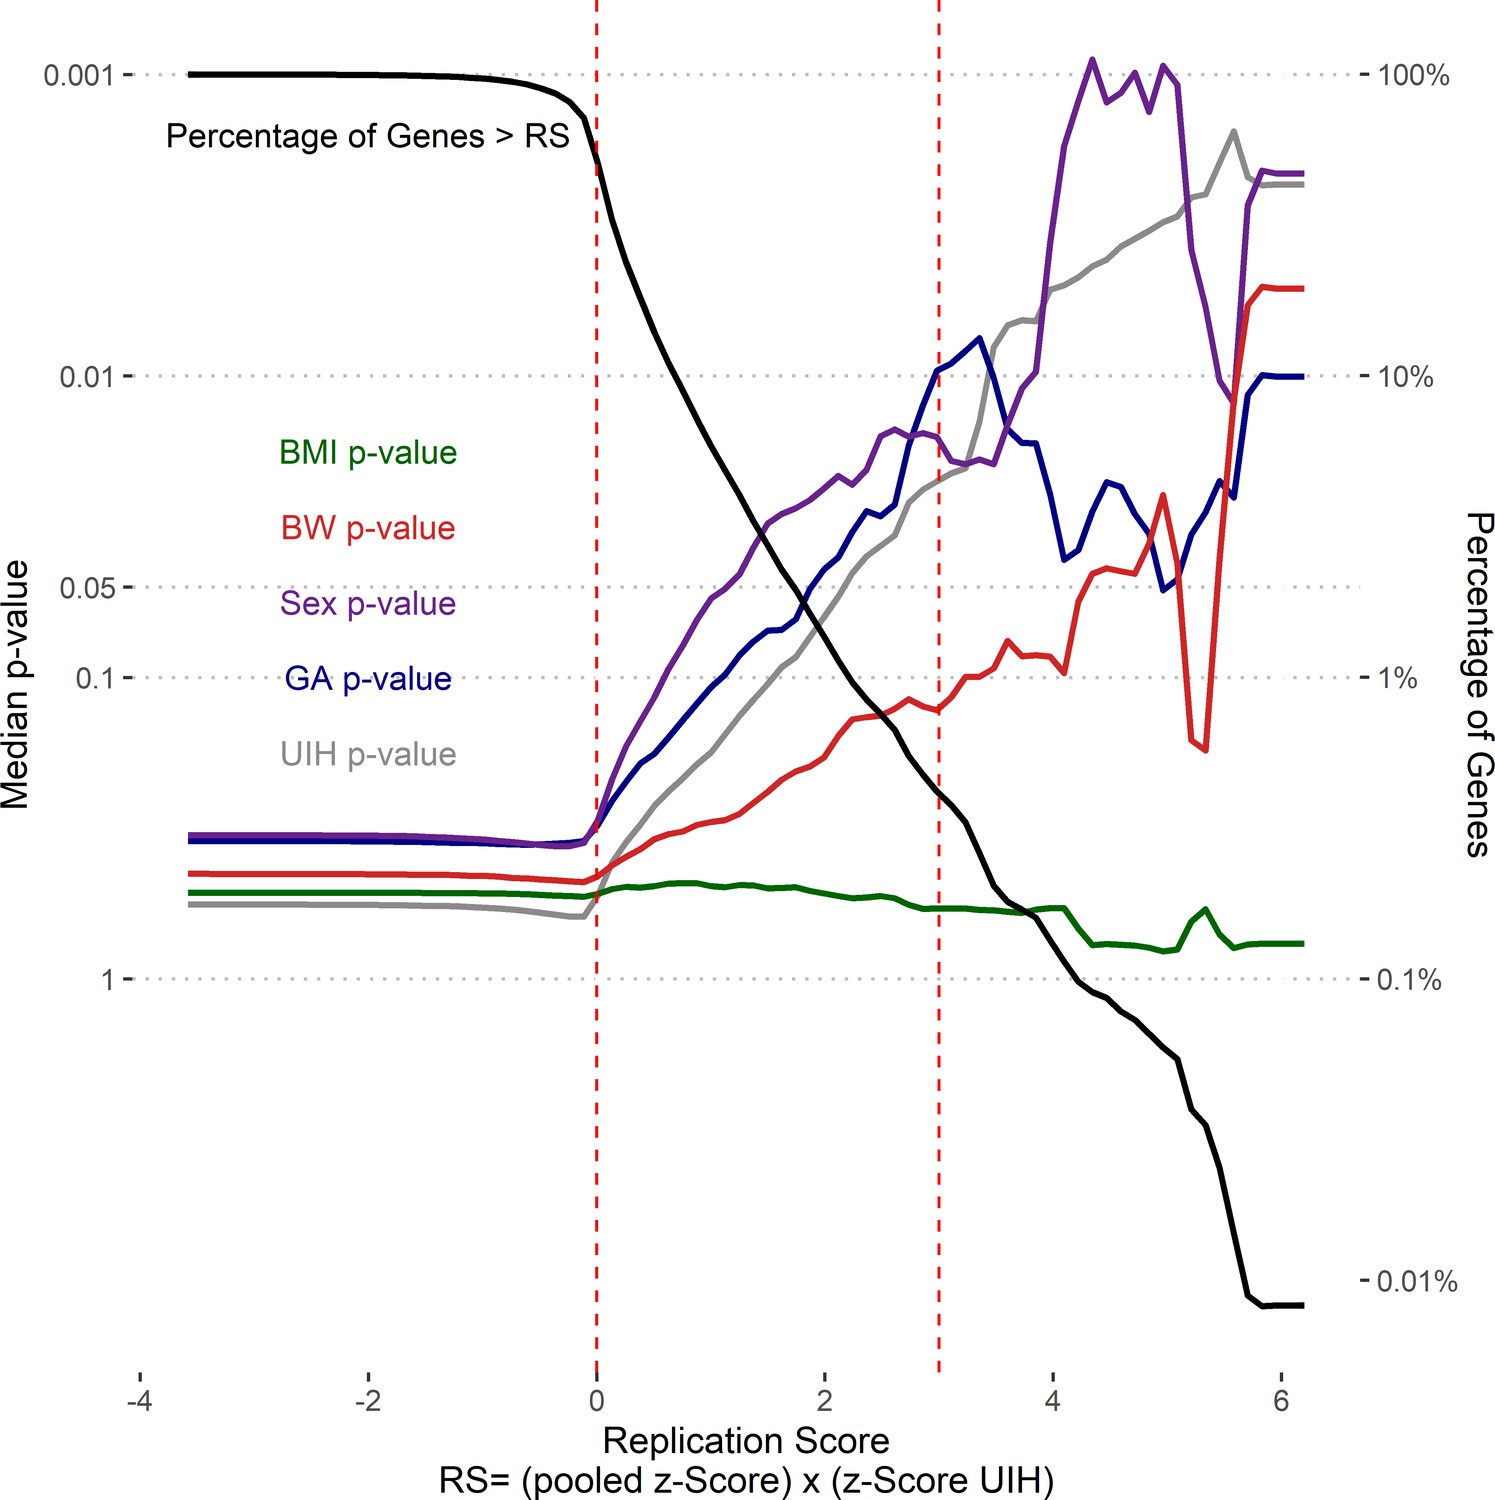
Replication score enriches for genes associated with multiple risk factors.
Splines (colored according to analysis) of median p-values (left y-axis) for genes with replication scores greater than corresponding cut-off (x-axis). Percentage of genes with replication score greater than corresponding cut-off. Vertical dashed lines two cutoffs: RS > 0 and RS > 3.
Figure 3—figure supplement 2
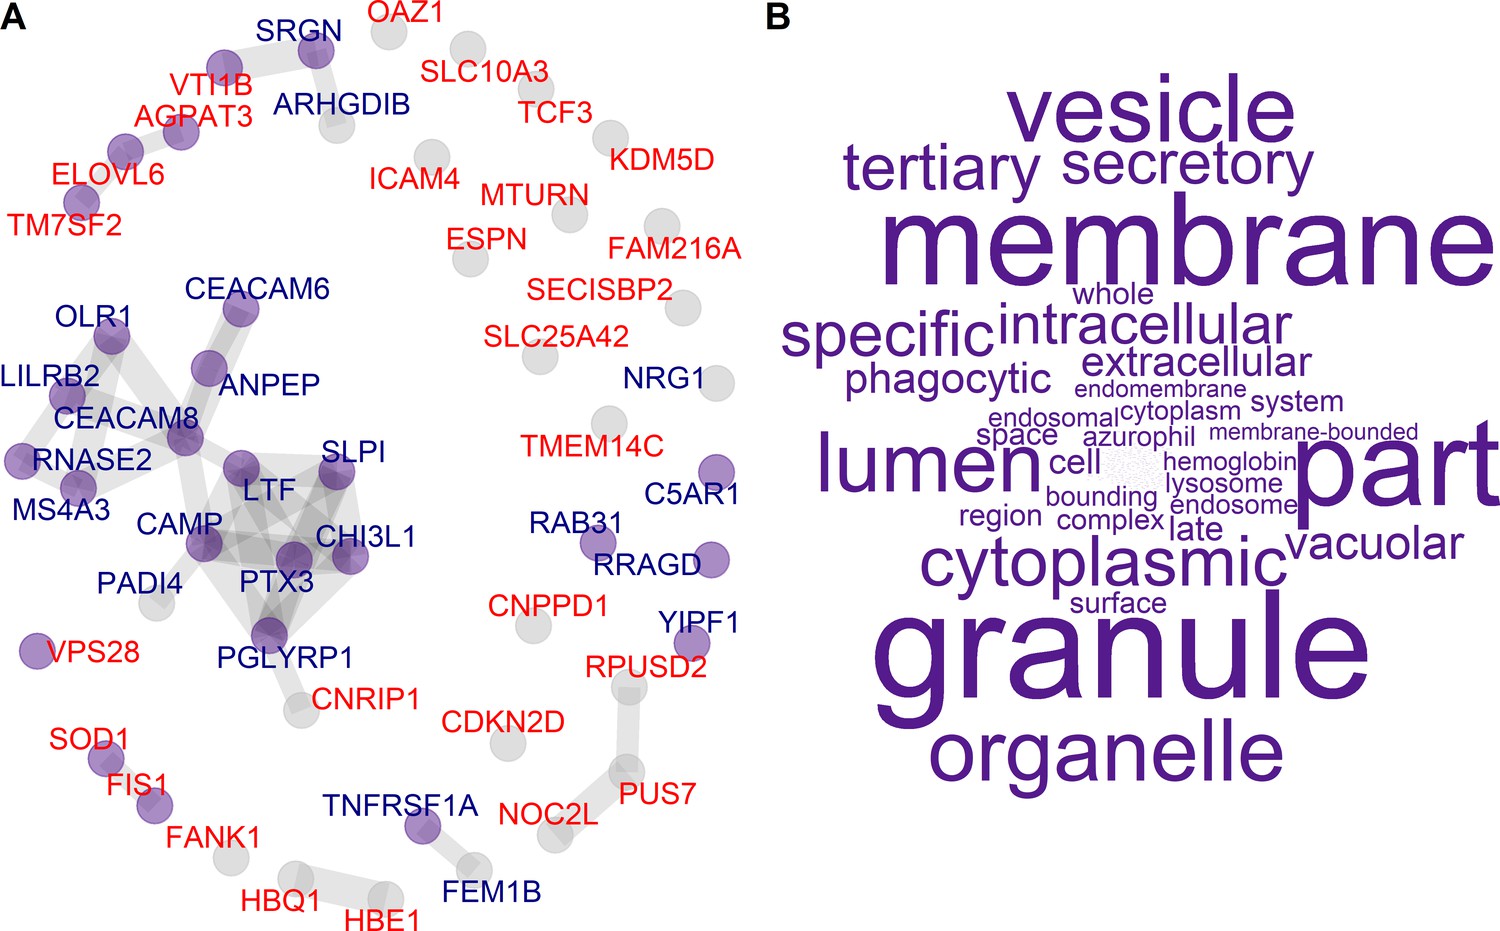
Protein–protein Interaction network of candidate genes.
(A) Protein–protein interaction network of candidate genes inferred from STRING (Szklarczyk et al., 2019). Nodes are labeled by risk association: low (blue) and high (red) risk candidate genes. Nodes are colored (purple) if they are associated with GO cellular component term enrichment. (B) Word clouds of GO terms significantly enriched in candidate genes.
Figure 4 with 1 supplement
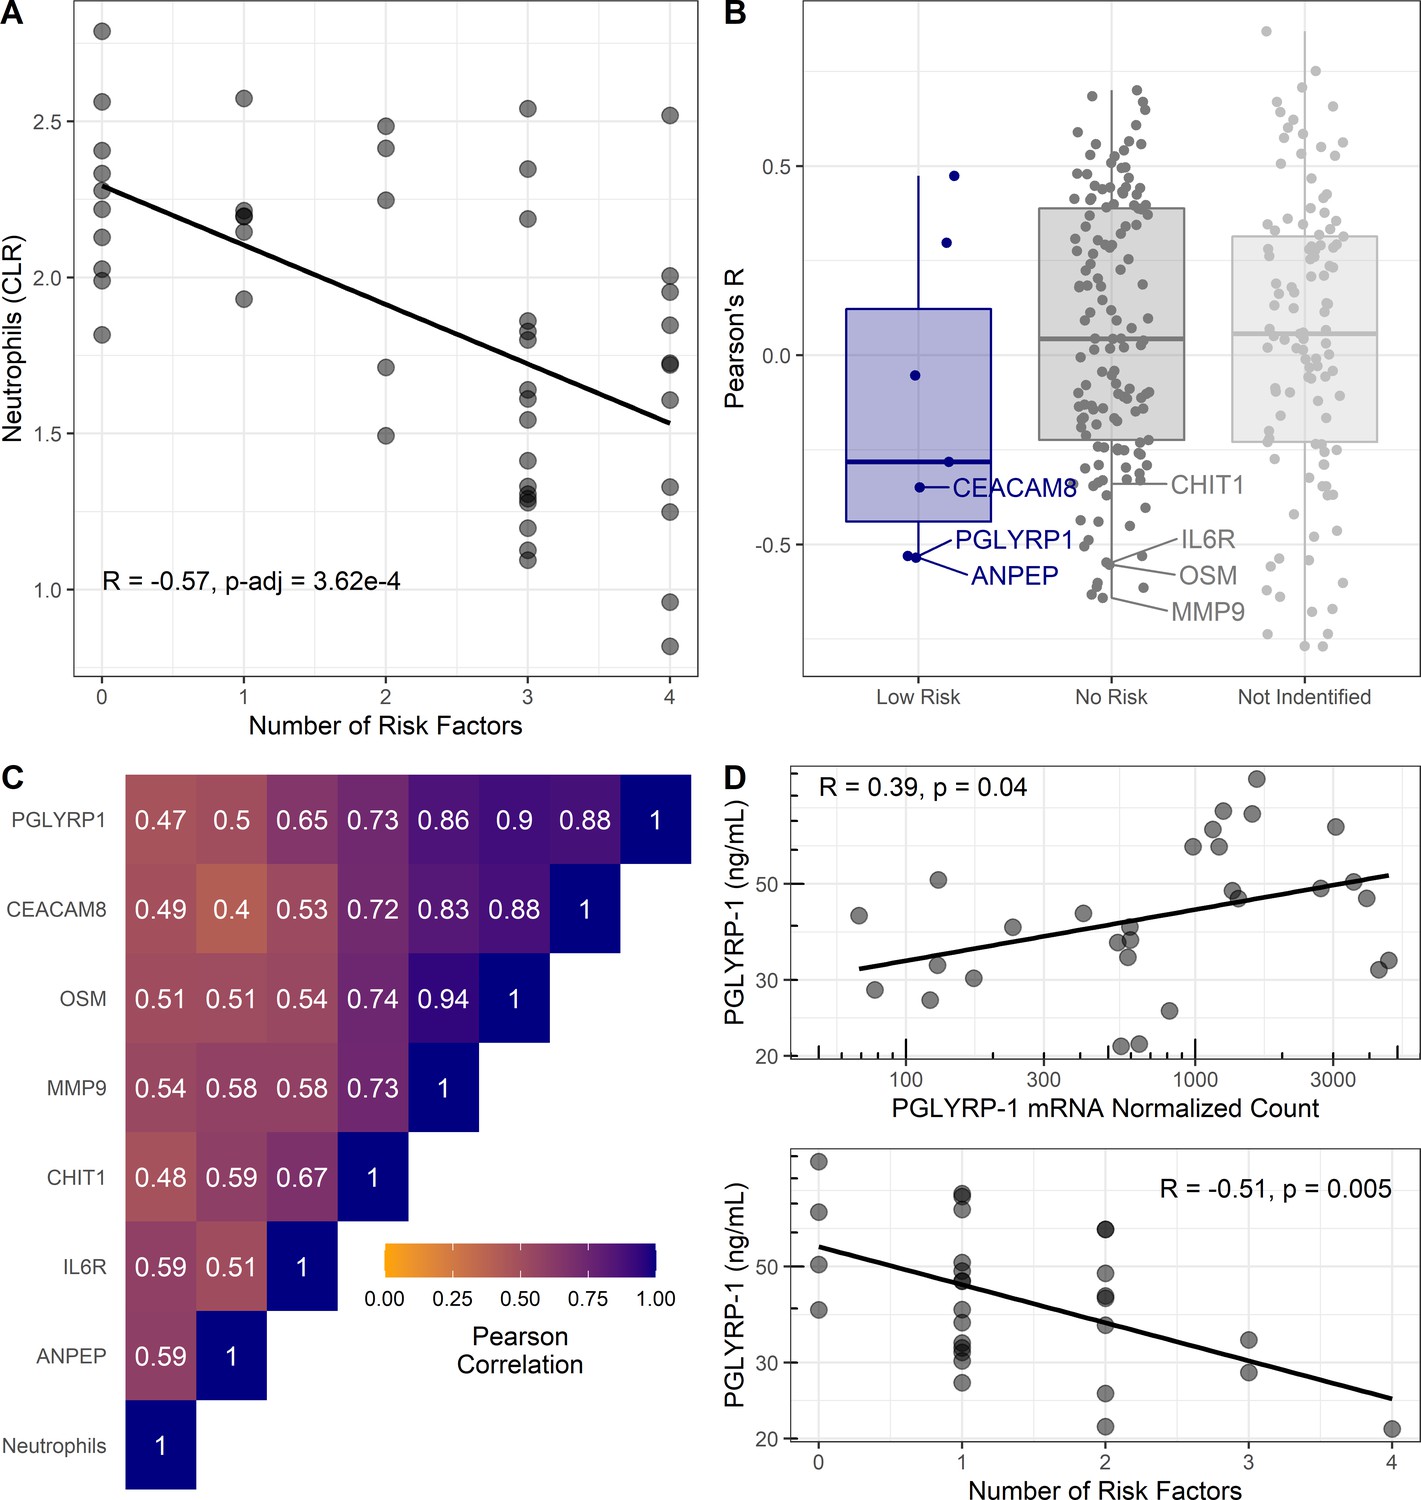
Cellular and proteomic differences associated with pediatric asthma risk factors.
(A–C) Re-analysis of publicly available data from Olin et al., 2018. (A) Percentage of neutrophils in cord blood (transformed using centered log-ratios, CLR) correlated with number of risk factors. Pearson’s correlation (R) and Bonferroni adjusted p-value reported. (B) Pearson’s correlation coefficients (R) for plasma-protein concentration and number of risk factors distributed based on risk association of proteins as per Figure 3. Corresponding mRNA from CBMCs were identified for low-risk associated proteins (blue) and no risk associated proteins (dark gray). Most significant negative protein correlations with neutrophil-enriched mRNA (Human Protein Atlas [Uhlen et al., 2010]) are notated. Proteins identified in previous analysis without corresponding mRNA shown light gray. (C) Heatmap of Pearson’s correlations between neutrophils and neutrophil-derived proteins identified in (B). (D) Association between PGLYRP-1 umbilical cord serum concentration, PGLYRP-1 CBMC mRNA, and number of risk factors in UIH cohort.
Figure 4—figure supplement 1

Association between PGLYRP-1 and sIL6Rα in UIH and Project Viva cohorts.
Scatter plot displaying association between PGLYRP-1 and sIL6Rα in UIH (blue) and Project Viva (yellow) cohorts. Univariate regression lines are shown for both cohorts. Distributions for PGLYRP-1 and sIL6Rα are shown in the margins for each cohort.
Figure 5 with 3 supplements
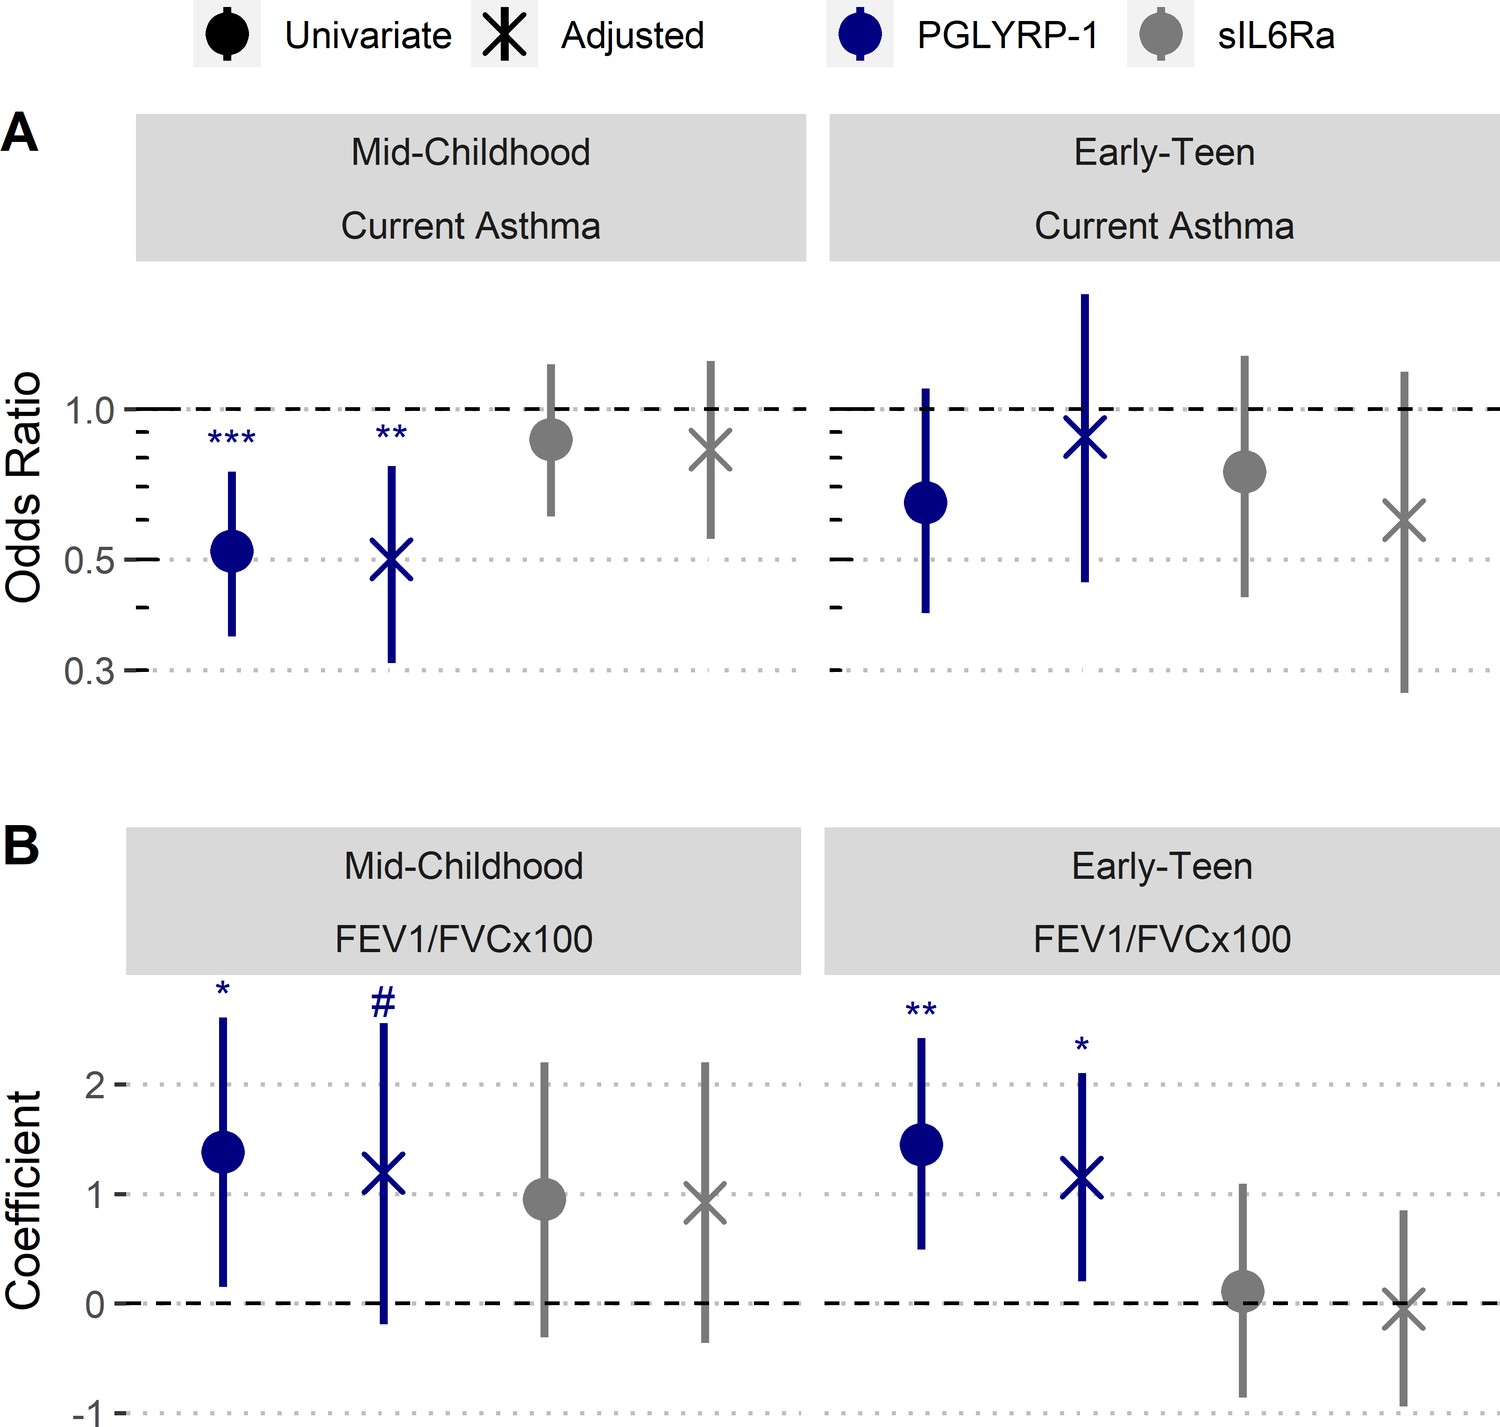
Increased umbilical cord blood serum PGLYRP-1 is associated with increased FEV1/FVC and reduced odds of pediatric asthma.
Samples and data derived from a subset of Project Viva (n=358). Odds ratio and coefficient estimates are based on 1 SD increase in serum proteins (PGLYRP-1, sIL6Rα). Error bars indicate 95% CI. Adjusted model co-variates: gestational age, birthweight adjusted for gestational age and sex, mode of delivery, child’s sex, child's race/ethnicity, maternal pre-pregnancy BMI, maternal level of education, maternal atopy, antibiotic exposure during pregnancy, and early-life smoke exposure. (A) PGLYRP-1 and sIL6Rα concentrations in umbilical cord blood serum association with current asthma at mid-childhood and early-teenage time points (determined by questionnaire responses). (B) PGLYRP-1 and sIL6Rα concentrations in umbilical cord blood serum association with FEV1/FVCx100 at mid-childhood and early-teenage follow ups. ***p<0.001, **p<0.01, *p<0.05, #p<0.1.
Figure 5—figure supplement 1
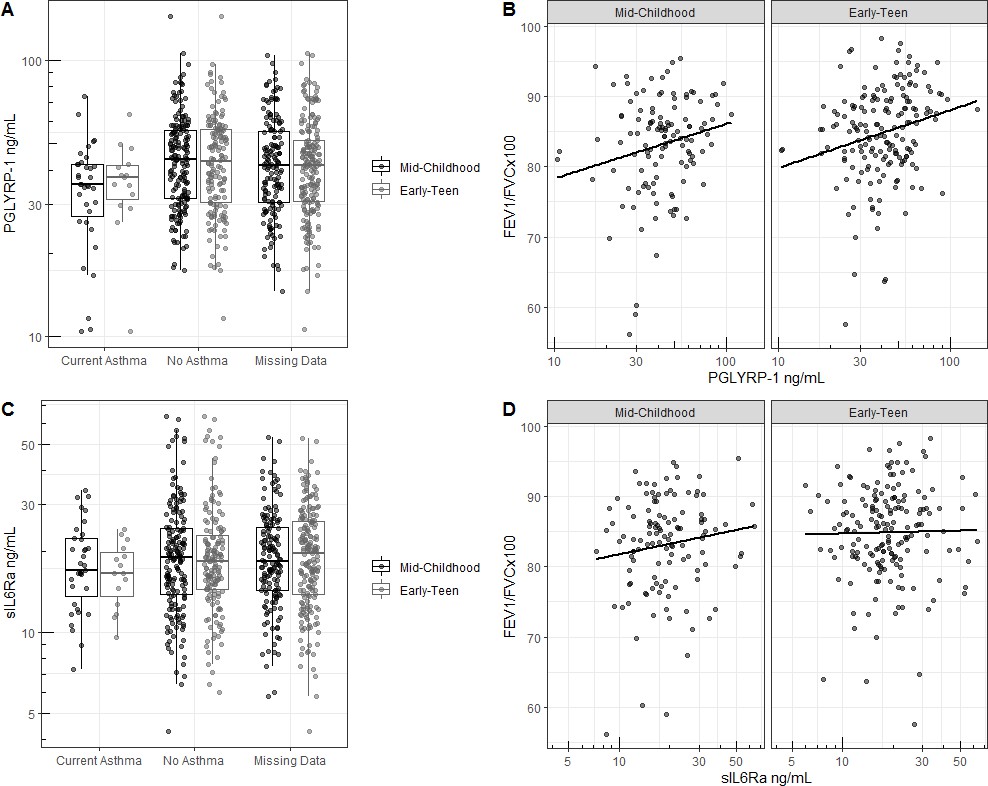
Cord blood serum proteins in relationship to outcomes.
(A) PGLYRP-1 concentration in umbilical cord blood serum in relationship to current asthma determined by questionnaire response and (B) FEV1/FVCx100 at mid-childhood and early-teenage follow ups. (C) sIL6Rα concentration in umbilical cord blood serum in relationship to current asthma determined by questionnaire response and (D) FEV1/FVCx100 at mid-childhood and early-teenage follow ups.
Figure 5—figure supplement 2
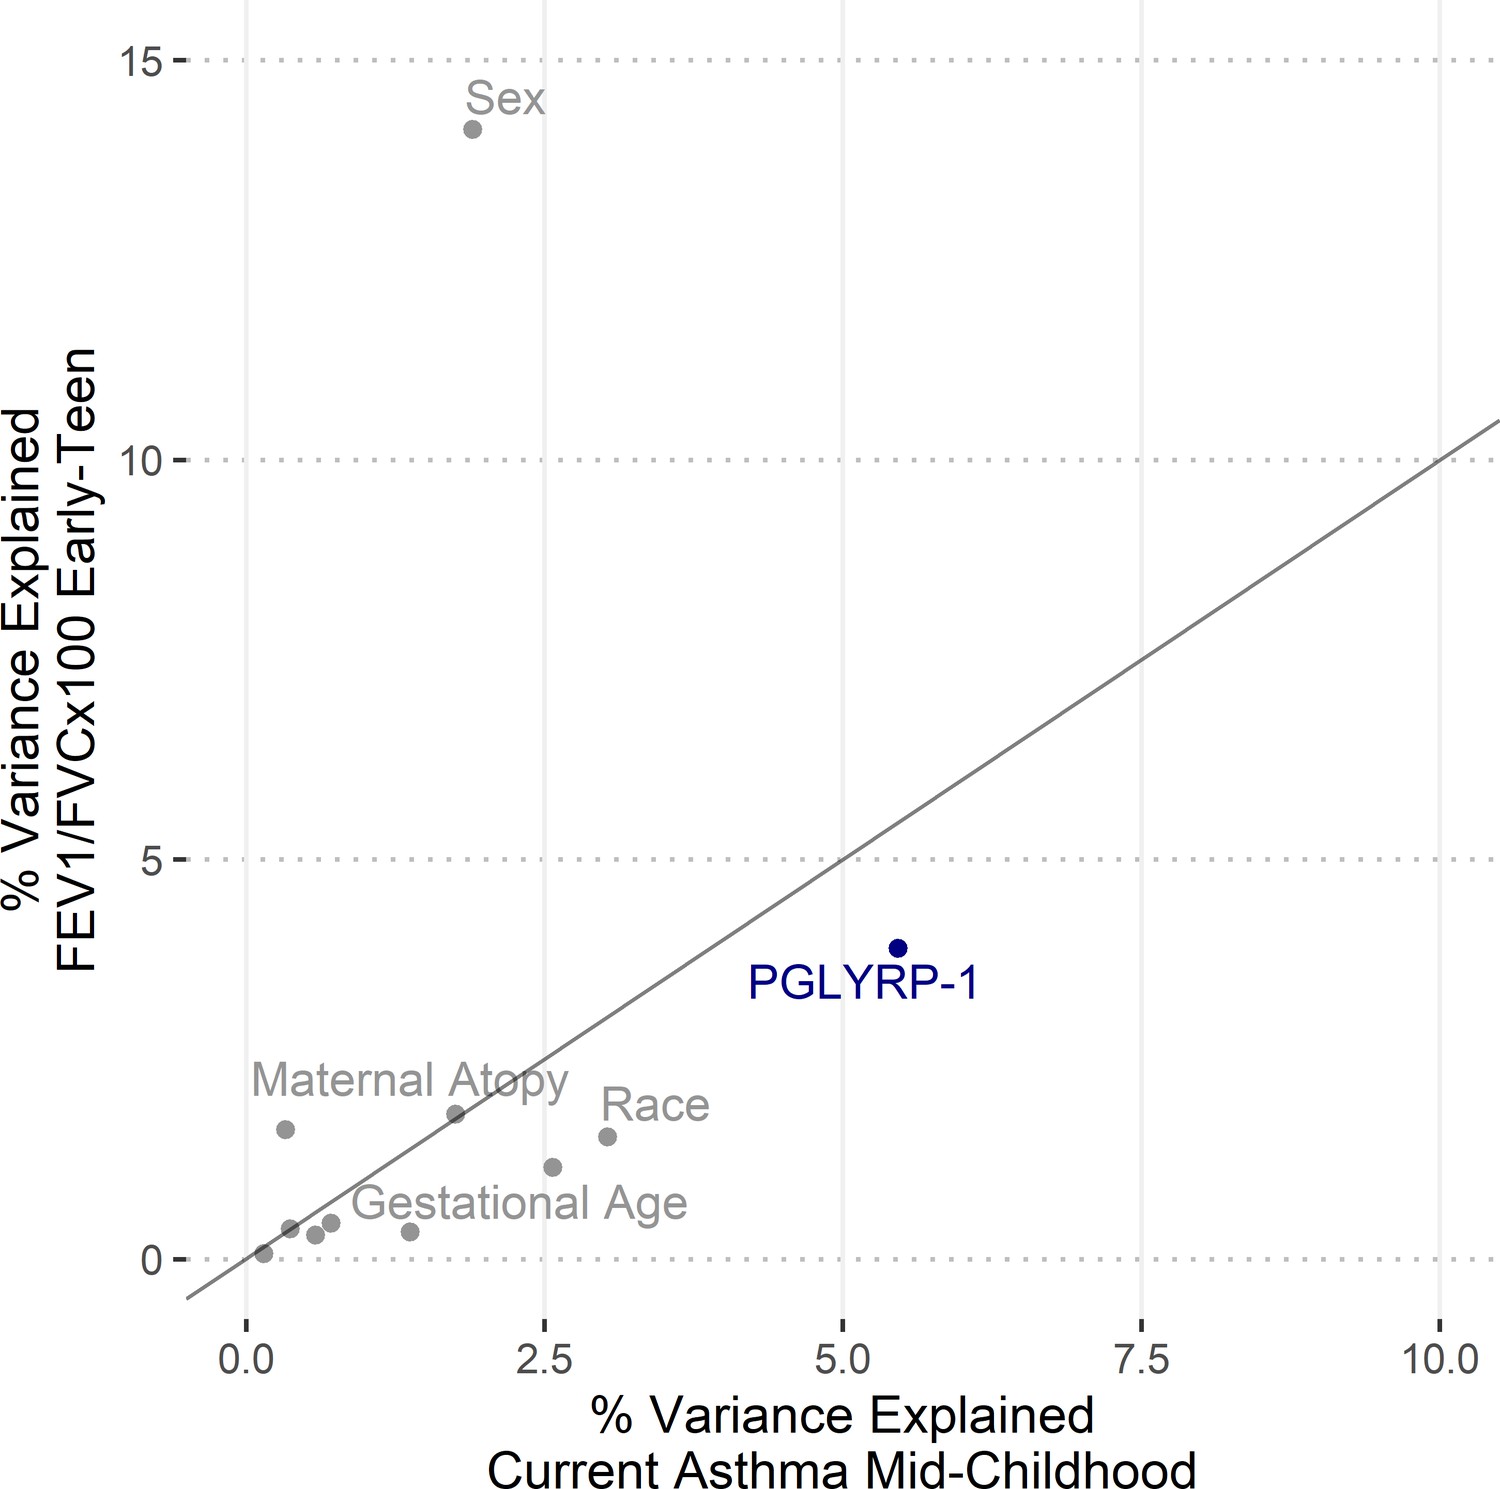
Relative importance of predictors for pediatric asthma and FEV1/FVC.
Relative importance, displayed as percent of variance explained, for variables used in regressions (Table 3, model 3) for current asthma at mid-childhood and FEV1/FVC in early-teen years. Variance estimated for logistic regression as Mcfadden’s pseudo-R (Jaakkola et al., 2006).
Figure 5—figure supplement 3
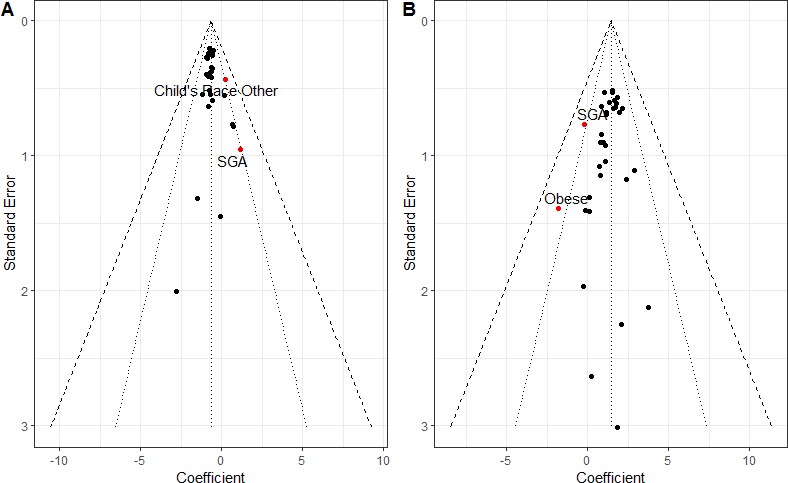
Subset analysis for all covariates used in regression models.
Funnel plot demonstrating relationship effect size estimates and measurement error for subset analyses for (A) current mid-childhood asthma and (B) FEV1/FVCx100 in early-teen years. 95% CI (botted lines) and 99% CI (dashed lines) displayed.
Tables
Table 1
GSE data sets used for meta-analyses.
| GSE | GPL | N | Newborn sex | Gestational age | Birthweight | Maternal pre-pregnancy BMI | Title |
|---|---|---|---|---|---|---|---|
| GSE21342 | GPL6947 | 37 | + | Maternal influences on the transmission of leukocyte gene expression profiles in population samples | |||
| GSE25504 | GPL570 | 20 | + | Whole blood mRNA expression profiling of host molecular networks in neonatal sepsis | |||
| GSE27272 | GPL6883 | 64 | + | + | + | Comprehensive study of tobacco smoke-related transcriptome alterations in maternal and fetal cells | |
| GSE30032 | GPL6883 | 47 | + | + | + | Deregulation of gene expression induced by environmental tobacco smoke exposure in pregnancy | |
| GSE36828 | GPL6947 | 48 | + | + | Genome-wide analysis of gene expression levels in placenta and cord blood samples from newborns babies | ||
| GSE37100 | GPL14550 | 38 | + | + | + | Transcriptome changes affecting hedgehog and cytokine signaling in the umbilical cord in late pregnancy: implications for disease risk | |
| GSE48354 | GPL16686 | 38 | + | + | + | Prenatal arsenic exposure and the epigenome: altered gene expression profiles in newborn cord blood | |
| GSE53473 | GPL13667 | 128 | + | + | Standard of hygiene and immune adaptation in newborn infants | ||
| GSE60403 | GPL570 | 16 | + | + | The obese fetal transcriptome | ||
| GSE73685 | GPL6244 | 23 | + | Unique inflammatory transcriptome profiles at the maternal fetal interface and onset of human preterm and term birth | |||
| GSE83393 | GPL17077 | 146 | + | Newborn sex-specific transcriptome signatures and gestational exposure to fine particles: findings from the ENVIRONAGE Birth Cohort | |||
| N | 605 | 386 | 386 | 235 | 164 |
Table 2
Univariate associations between demographics and serum proteins.
| UIH (n = 29) | Project viva (n = 358) | |||
|---|---|---|---|---|
| β (95% CI) | p-value | β (95% CI) | p-value | |
| PGLYRP-1 Z-score* | ||||
| Number of risk factors† | −0.54 (–0.88, –0.19) | 0.005 | −0.22 (–0.36, –0.07) | 0.003 |
| Maternal race: White (ref) | 0 (ref) | 0 (ref) | ||
| Maternal race: Black | 0.01 (–0.83, 0.86) | 0.97 | 0.15 (–0.16, 0.46) | 0.34 |
| Maternal race: Hispanic | 1.03 (0.05, 2.01) | 0.04 | 0.40 (–0.07, 0.86) | 0.10 |
| Maternal race: Other | 1.54 (–0.46, 3.54) | 0.12 | 0.10 (–0.25, 0.46) | 0.57 |
| Maternal atopy | −0.14 (–0.92, 0.64) | 0.72 | 0.06 (–0.16, 0.28) | 0.58 |
| Maternal pre-pregnancy BMI | −0.03 (–0.09, 0.02) | 0.25 | 0.01 (–0.01, 0.03) | 0.56 |
| Maternal smoking: never (ref) | 0 (ref) | 0 (ref) | ||
| Maternal smoking: former | 0.09 (–0.92, 1.12) | 0.84 | −0.16 (–0.44, 0.11) | 0.25 |
| Maternal smoking: during pregnancy | – | – | −0.12 (–0.47, 0.22) | 0.48 |
| Maternal college graduate | 0.07 (–0.80, 0.93) | 0.87 | −0.12 (–0.34, 0.10) | 0.27 |
| Any antibiotic use during pregnancy | – | – | 0.20 (-0.02, 0.43) | 0.08 |
| Gestational age weeks | 0.25 (–0.01, 0.51) | 0.06 | 0.12 (0.06, 0.19) | 0.0003 |
| Birthweight adj GA and Sex (Z-score) | 0.33 (–1.07, 1.74) | 0.63 | 0.03 (–0.09, 0.14) | 0.66 |
| Female | 0.39 (–0.37, 1.15) | 0.30 | 0.31 (0.11, 0.52) | 0.003 |
| C-section | −0.08 (–0.89, 0.74) | 0.85 | −0.29 (–0.55, –0.02) | 0.03 |
| Child’s race: White (ref) | – | – | 0 (ref) | |
| Child’s race: Black | – | – | 0.16 (–0.14, 0.46) | 0.31 |
| Child’s race: Hispanic | – | – | 0.18 (–0.31, 0.68) | 0.46 |
| Child’s race: Other | – | – | 0.06 (-0.27, 0.38) | 0.73 |
| sIL6Rα Z-score* | ||||
| Number of risk factors† | −0.14 (–0.54, –0.25) | 0.48 | 0.02 (–0.13, 0.16) | 0.81 |
| Maternal race: White (ref) | 0 (ref) | 0 (ref) | ||
| Maternal race: Black | −1.04 (–1.90, –0.19) | 0.02 | −0.29 (–0.60, 0.02) | 0.07 |
| Maternal race: Hispanic | −0.36 (–1.34, 0.62) | 0.45 | 0.34 (-0.12, 0.80) | 0.15 |
| Maternal race: Other | 0.4 (–1.61, 2.42) | 0.68 | −0.03 (–0.39, 0.32) | 0.85 |
| Maternal atopy | −0.23 (–1.01, 0.54) | 0.55 | −0.08 (–0.30, 0.14) | 0.47 |
| Maternal pre-pregnancy BMI | −0.04 (–0.10, 0.01) | 0.12 | 0.00 (–0.02, 0.02) | 0.72 |
| Maternal smoking: never (ref) | 0 (ref) | 0 (ref) | ||
| Maternal smoking: former | −0.90 (–1.86, 0.06) | 0.07 | −0.23 (–0.50, 0.05) | 0.10 |
| Maternal smoking: during pregnancy | – | – | −0.12 (–0.46, 0.22) | 0.48 |
| Maternal college graduate | 0.44 (–0.41, 1.29) | 0.29 | −0.02 (–0.24, 0.19) | 0.84 |
| Any antibiotic use during pregnancy | – | – | 0.04 (–0.19, 0.26) | 0.76 |
| Gestational age weeks | −0.11 (–0.39, 0.17) | 0.43 | −0.04 (–0.10, 0.03) | 0.29 |
| Birthweight adj GA and sex (Z-score) | −0.15 (–1.57, 1.26) | 0.82 | −0.07 (–0.18, 0.04) | 0.23 |
| Female | 0.48 (–0.28, 1.23) | 0.21 | 0.05 (–0.16, 0.26) | 0.63 |
| C-section | −0.60 (–1.38, 0.18) | 0.12 | −0.14 (–0.41, 0.12) | 0.29 |
| Child’s race: White (ref) | – | – | 0 (ref) | |
| Child’s race: Black | – | – | −0.24 (–0.54, 0.05) | 0.11 |
| Child’s race: Hispanic | – | – | 0.27 (–0.22, 0.76) | 0.28 |
| Child’s race: Other | – | – | 0.02 (–0.30, 0.34) | 0.90 |
-
*Serum protein concentrations for UIH and Project Viva were log10 transformed and converted into an internal Z-score.
†Number of risk factors determined by preterm birth, maternal BMI > 29.9, male, birthweight (z-score) < −1.
Table 3
Association between serum protein concentration and asthma outcomes.
| Mid-childhood | Early-teen | ||||
|---|---|---|---|---|---|
| Current asthma, OR (95% CI) | Ever asthma, OR (95% CI) | Current asthma, OR (95% CI) | Ever asthma, OR (95% CI) | ||
| PGLYRP-1 Z-score* | |||||
| Univariate | 0.52 (0.35, 0.75) | 0.52 (0.36, 0.74) | 0.65 (0.39, 1.10) | 0.64 (0.45, 0.89) | |
| Model 1† | 0.57 (0.37, 0.85) | 0.54 (0.36, 0.79) | 0.86 (0.48, 1.54) | 0.72 (0.50, 1.03) | |
| Model 2‡ | 0.57 (0.26, 0.65) | 0.41 (0.26, 0.61) | 0.62 (0.35, 1.09) | 0.61 (0.42, 0.87) | |
| Model 3# | 0.50 (0.31, 0.77) | 0.48 (0.31, 0.77) | 0.88 (0.45, 1.72) | 0.74 (0.51, 1.07) | |
| sIL6Rα Z-score* | |||||
| Univariate | 0.87 (0.61, 1.23) | 0.93 (0.67, 1.29) | 0.75 (0.42, 1.28) | 0.93 (0.66, 1.29) | |
| Model 1† | 0.83 (0.56, 1.23) | 0.89 (0.63, 1.30) | 0.68 (0.37, 1.21) | 0.90 (0.63, 1.27) | |
| Model 2‡ | 0.83 (0.57, 1.24) | 0.90 (0.63, 1.28) | 0.67 (0.33, 1.27) | 0.93 (0.65, 1.31) | |
| Model 3# | 0.83 (0.55, 1.25) | 0.90 (0.62, 1.30) | 0.60 (0.27, 1.19) | 0.88 (0.61, 1.27) | |
-
*Serum protein concentrations were log10 transformed and converted into an internal Z-score.
†Serum protein concentrations were log10 transformed and conver gestational age, birthweight adjusted for gestational age, mode of delivery, child’s sex, child’s race/ethnicity.
-
‡(Mother’s demographics): adjusted for maternal pre-pregnancy BMI, maternal race/ethnicity, maternal level of education, maternal atopy, antibiotic exposure during pregnancy, smoking during pregnancy, 6 months or 1 year.
#Model 3 (all demographics and birth characteristics): adjusted for all demographics and characteristics in models 1 and 2 except maternal race/ethnicity. This reported value in manuscript.
Table 4
Association between serum protein concentration and pulmonary function.
| Mid-childhood | Early-teen | ||||
|---|---|---|---|---|---|
| FEV1/FVCx100 β (95% CI) | BDR β (95% CI) | FEV1/FVCx100 β (95% CI) | BDR β (95% CI) | ||
| PGLYRP-1 Z-score* | |||||
| Univariate | 1.38 (0.15, 2.61) | 0.10 (−1.83, 2.03) | 1.45 (0.49, 2.42) | −0.68 (−1.54, 0.17) | |
| Model 1† | 1.12 (−0.18, 2.41) | 0.53 (−1.44, 2.51) | 1.05 (0.11, 1.98) | −0.49 (−1.40, 0.41) | |
| Model 2‡ | 1.38 (0.08, 2.69) | 0.61 (−1.40, 2.63) | 1.53 (0.54, 2.53) | −0.58 (−1.49, 0.34) | |
| Model 3# | 1.19 (−0.19, 2.56) | 1.00 (−1.04, 3.04) | 1.15 (0.20, 2.10) | −0.35 (−1.29, 0.59) | |
| sIL6Rα Z-score* | |||||
| Univariate | 0.95 (−0.31, 2.20) | −0.38 (−2.45, 1.69) | 0.11 (−0.86, 1.09) | 0.65 (−0.24, 1.54) | |
| Model 1† | 0.96 (−0.30, 2.21) | −0.37 (-2.41, 1.67) | 0.02 (−0.87, 0.92) | 0.71 (−0.19, 1.61) | |
| Model 2‡ | 0.88 (−0.40, 2.16) | −0.62 (−2.62, 1.39) | −0.02 (−1.00, 0.97) | 0.75 (−0.17, 1.66) | |
| Model 3# | 0.92 (−0.36, 2.20) | −0.11 (−0.96, 0.70) | −0.05 (−0.94, 0.85) | 0.79 (−0.12, 1.69) | |
-
*Serum protein concentrations were log10 transformed and converted into an internal Z-score.
†Serum protein concentrations were log10 transformed and converted into an internal Z-scoreupplemental Data\\Table 4_Association pulmonary outcomes.xlsx’ "Shed's race/ethnicity.
-
‡(Mother's demographics): adjusted for maternal pre-pregnancy BMI, maternal race/ethnicity, maternal level of education, maternal atopy, antibiotic exposure during pregnancy, smoking during pregnancy, 6 months or 1 year.
#Model 3 (all demographics and birth characteristics): adjusted for all demographics and characteristics in models 1 and 2 except maternal race/ethnicity. This the reported value in manuscript.
Key resources table
| Reagent type (species) or resource | Designation | Source or reference | Identifiers | Additional information |
|---|---|---|---|---|
| Gene (Homo sapiens) | Homo sapiens Genome Assembly | Ensembl | GRCh38.12 | |
| Biological sample (Homo sapiens) | Primary Cord Blood Mononuclear Cells | Volunteers | UIH Cohort | Demographics reported in Supplementary file 5 |
| Biological sample (Homo sapiens) | Cord Blood Serum | Volunteers | UIH Cohort Project Viva | Demographics reported in Supplementary files 5 and 7 |
| Commercial assay or kit | Human PGLYRP1/PGRP-S DuoSet ELISA | R and D Systems | DY2590 | |
| Commercial assay or kit | Human IL6Ra DuoSet ELISA | R and D Systems | DY227 | |
| Commercial assay or kit | RNeasy Mini Kit | Qiagen | 74104 | |
| Commercial assay or kit | RNA 6000 Nano Kit | Agilent | 5067–1511 | |
| Commercial assay or kit | Qubit RNA HS Assay Kit | Thermo Fisher Scientific | Q32852 | |
| Commercial assay or kit | TruSeq Stranded mRNA Library Prep Kit | Illumina | 20020594 | |
| Commercial assay or kit | HiSeq × Ten Reagent Kit v2.5 | Illumina | FC-501–2501 | |
| Software, algorithm | R | R | Version 3.6.3 | |
| Software, algorithm | geoquery | Bioconductor | Version: 2.36.0 | |
| Software, algorithm | GeneMeta | Bioconductor | Version: 1.54.0 | |
| Software, algorithm | tximport | Bioconductor | Version: 1.10.1 | |
| Software, algorithm | DESeq2 | Bioconductor | Version: 1.22.2 | |
| Software, algorithm | relaimpo | CRAN | Version: 2.2–3 | |
| Software, algorithm | salmon | Github | Version 0.12.00 | |
| Software, algorithm | GSEA | gsea-msigdb.org | Version 4.0 |
Additional files
-
Supplementary file 1
Meta-analysis of CBMC gene expression associated with newborn sex.
- https://cdn.elifesciences.org/articles/63745/elife-63745-supp1-v2.xlsx
-
Supplementary file 2
Meta-analysis of CBMC gene expression associated with gestational age.
- https://cdn.elifesciences.org/articles/63745/elife-63745-supp2-v2.xlsx
-
Supplementary file 3
Meta-analysis of CBMC gene expression associated with birthweight.
- https://cdn.elifesciences.org/articles/63745/elife-63745-supp3-v2.xlsx
-
Supplementary file 4
Meta-analysis of CBMC gene expression associated with maternal pre-pregnancy BMI.
- https://cdn.elifesciences.org/articles/63745/elife-63745-supp4-v2.xlsx
-
Supplementary file 5
UIH cohort demographics.
- https://cdn.elifesciences.org/articles/63745/elife-63745-supp5-v2.xlsx
-
Supplementary file 6
UIH cohort CBMC gene expression DESeq2 results.
- https://cdn.elifesciences.org/articles/63745/elife-63745-supp6-v2.xlsx
-
Supplementary file 7
Project viva demographics.
- https://cdn.elifesciences.org/articles/63745/elife-63745-supp7-v2.xlsx
-
Transparent reporting form
- https://cdn.elifesciences.org/articles/63745/elife-63745-transrepform-v2.pdf
Download links
A two-part list of links to download the article, or parts of the article, in various formats.
Downloads (link to download the article as PDF)
Open citations (links to open the citations from this article in various online reference manager services)
Cite this article (links to download the citations from this article in formats compatible with various reference manager tools)
Perinatal granulopoiesis and risk of pediatric asthma
eLife 10:e63745.
https://doi.org/10.7554/eLife.63745


