Mapping the functional landscape of the receptor binding domain of T7 bacteriophage by deep mutational scanning
- Department of Biochemistry, University of Wisconsin-Madison, United States
- Department of Bacteriology, University of Wisconsin-Madison, United States
- Department of Chemical and Biological Engineering, University of Wisconsin-Madison, United States
Figures
Figure 1 with 3 supplements
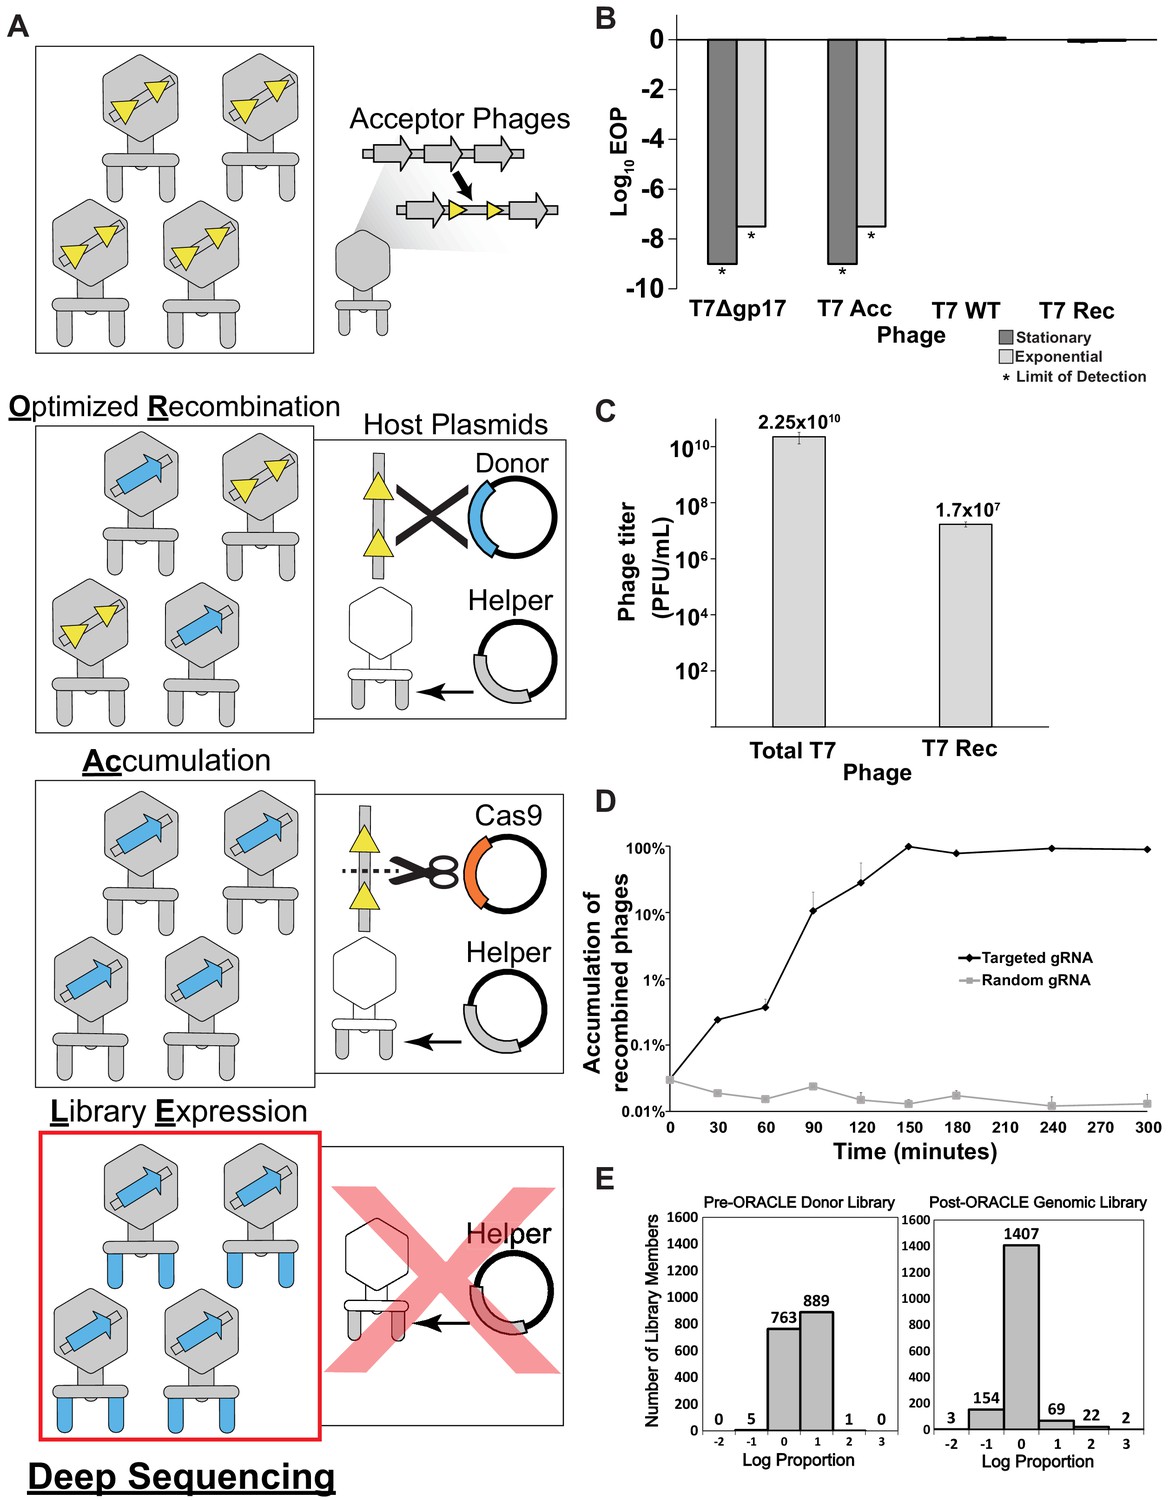
Optimized Recombination, Accumulation, and Library Expression (ORACLE) workflow for creating phage variant libraries.
(A) Schematic illustration of the four steps of ORACLE: creation of acceptor phage, inserting gene variants (Optimized Recombination), enriching recombined phages (Accumulation) and expressing library for selection (Library Expression). Color notations are as follows: yellow triangles – Cre recombinase sites, blue colored segments – gene variants, orange colored segment – Cas9, grey colored segments – wild type phage parts including the wildtype tail fiber from the helper plasmid (B) Ability of different versions of T7 to infect E. coli 10G in stationary (dark gray bar) and exponential (light gray bar) phases by Efficiency of Plating (EOP) using exponential 10G with gp17 tail fiber helper plasmid as reference host. T7 without tail fiber (T7Δgp17) and T7 Acceptor phages (T7 Acc) cannot visibly plaque, but wildtype T7 (T7 WT), and T7 with gp17 recombined into the acceptor locus (T7 Rec) plaque efficiently. (C) Concentration of total (Total T7) and recombined (T7 Rec) phages after a single passage on host containing Cre recombinase system. Recombination rate is estimated to be ~7.19x10⁻⁴. (D) Percentage of recombined phages in total phages when using gRNA targeting fixed sequence at acceptor site T7 Acc (Targeted) or randomized gRNA (Random). (E) Histogram of abundance of variants in the input plasmid library (left) and on the phage genome after ORACLE (right) binned using log proportion centered on equal representation. All data represented as mean ± SD of biological triplicate.
-
Figure 1—source data 1
Deep sequencing summary for phage variant expression library with and without DNAse treatment after Optimized Recombination, Accumulation, and Library Expression (ORACLE).
Related to Figure 1E and Figure 1—figure supplement 3.
- https://cdn.elifesciences.org/articles/63775/elife-63775-fig1-data1-v2.xlsx
-
Figure 1—source data 2
Percentage distribution of each variant in the expression library.
Related to Figure 1E and Figure 1—figure supplement 3.
- https://cdn.elifesciences.org/articles/63775/elife-63775-fig1-data2-v2.xlsx
Figure 1—figure supplement 1
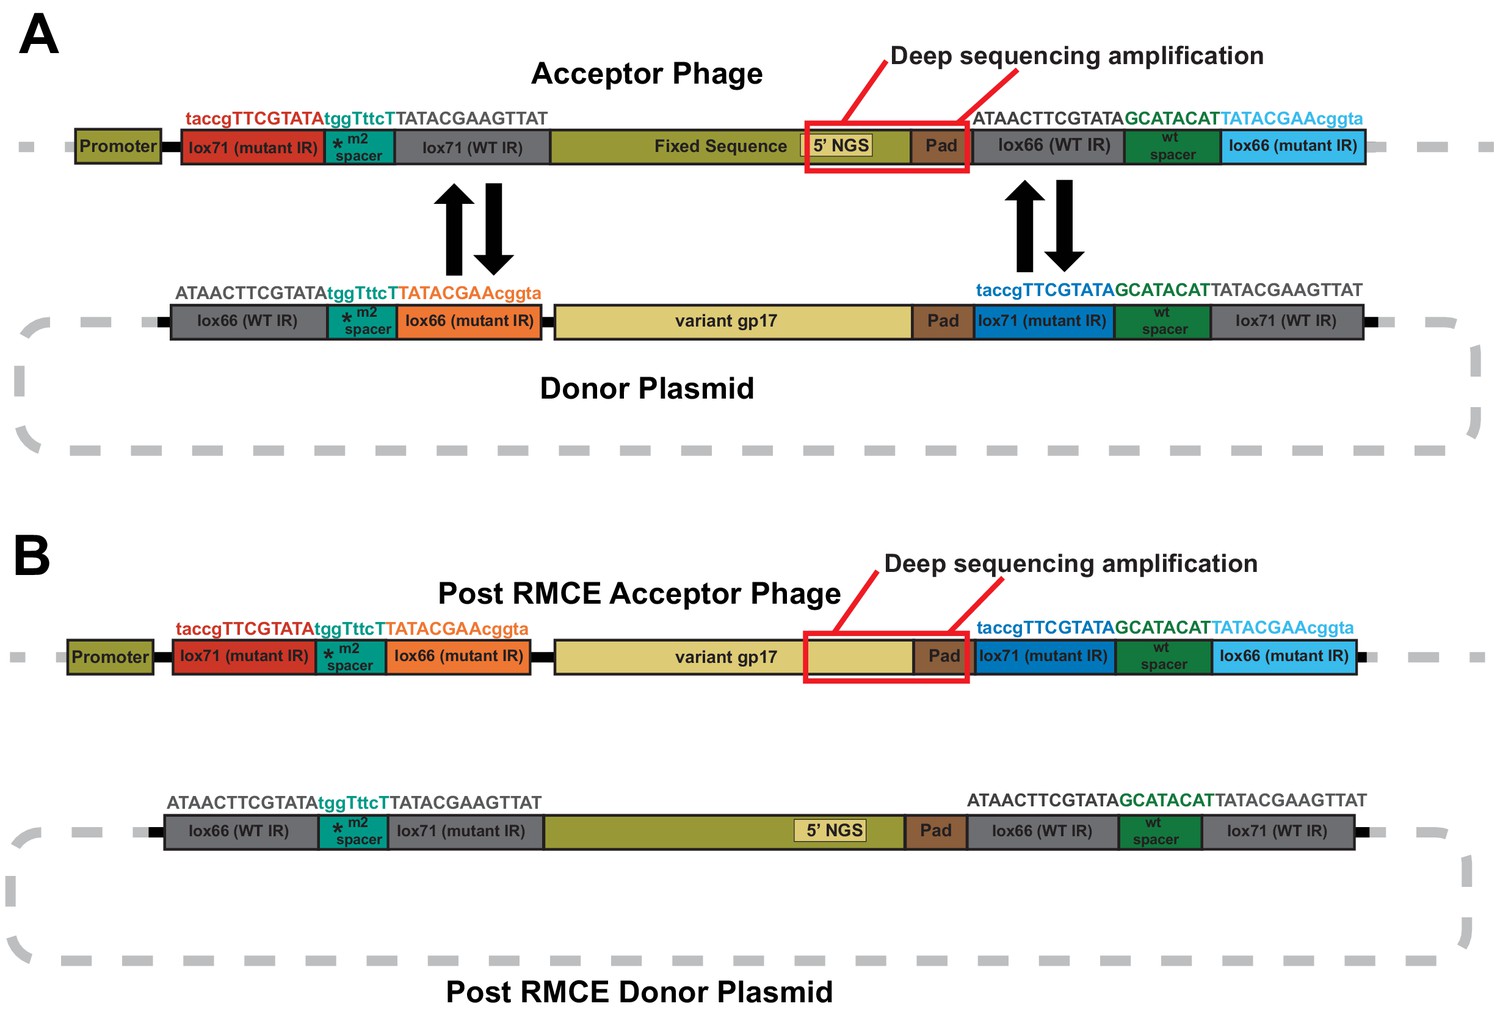
Sequence rearrangements before and after recombinase-mediated cassette exchange.
Schematic illustration of sequence rearrangements in acceptor phage and donor plasmid (A) before and (B) after recombinase-mediated cassette exchange (RMCE). Specific lox recombinase sites required for exchanging sequence cassettes (variant and fixed sequence) are shown. Lox sites have wild type (WT) or mutated inverted repeats (IR) and one-way RMCE can only occur if one IR is wild type, while the m2 spacer forces recombination in the correct orientation and prevents adverse recombination events (Langer et al., 2002). Deep sequencing targets the area boxed in red between the 5’ NGS region and 3’ pad on both acceptor phages and the variant library.
Figure 1—figure supplement 2
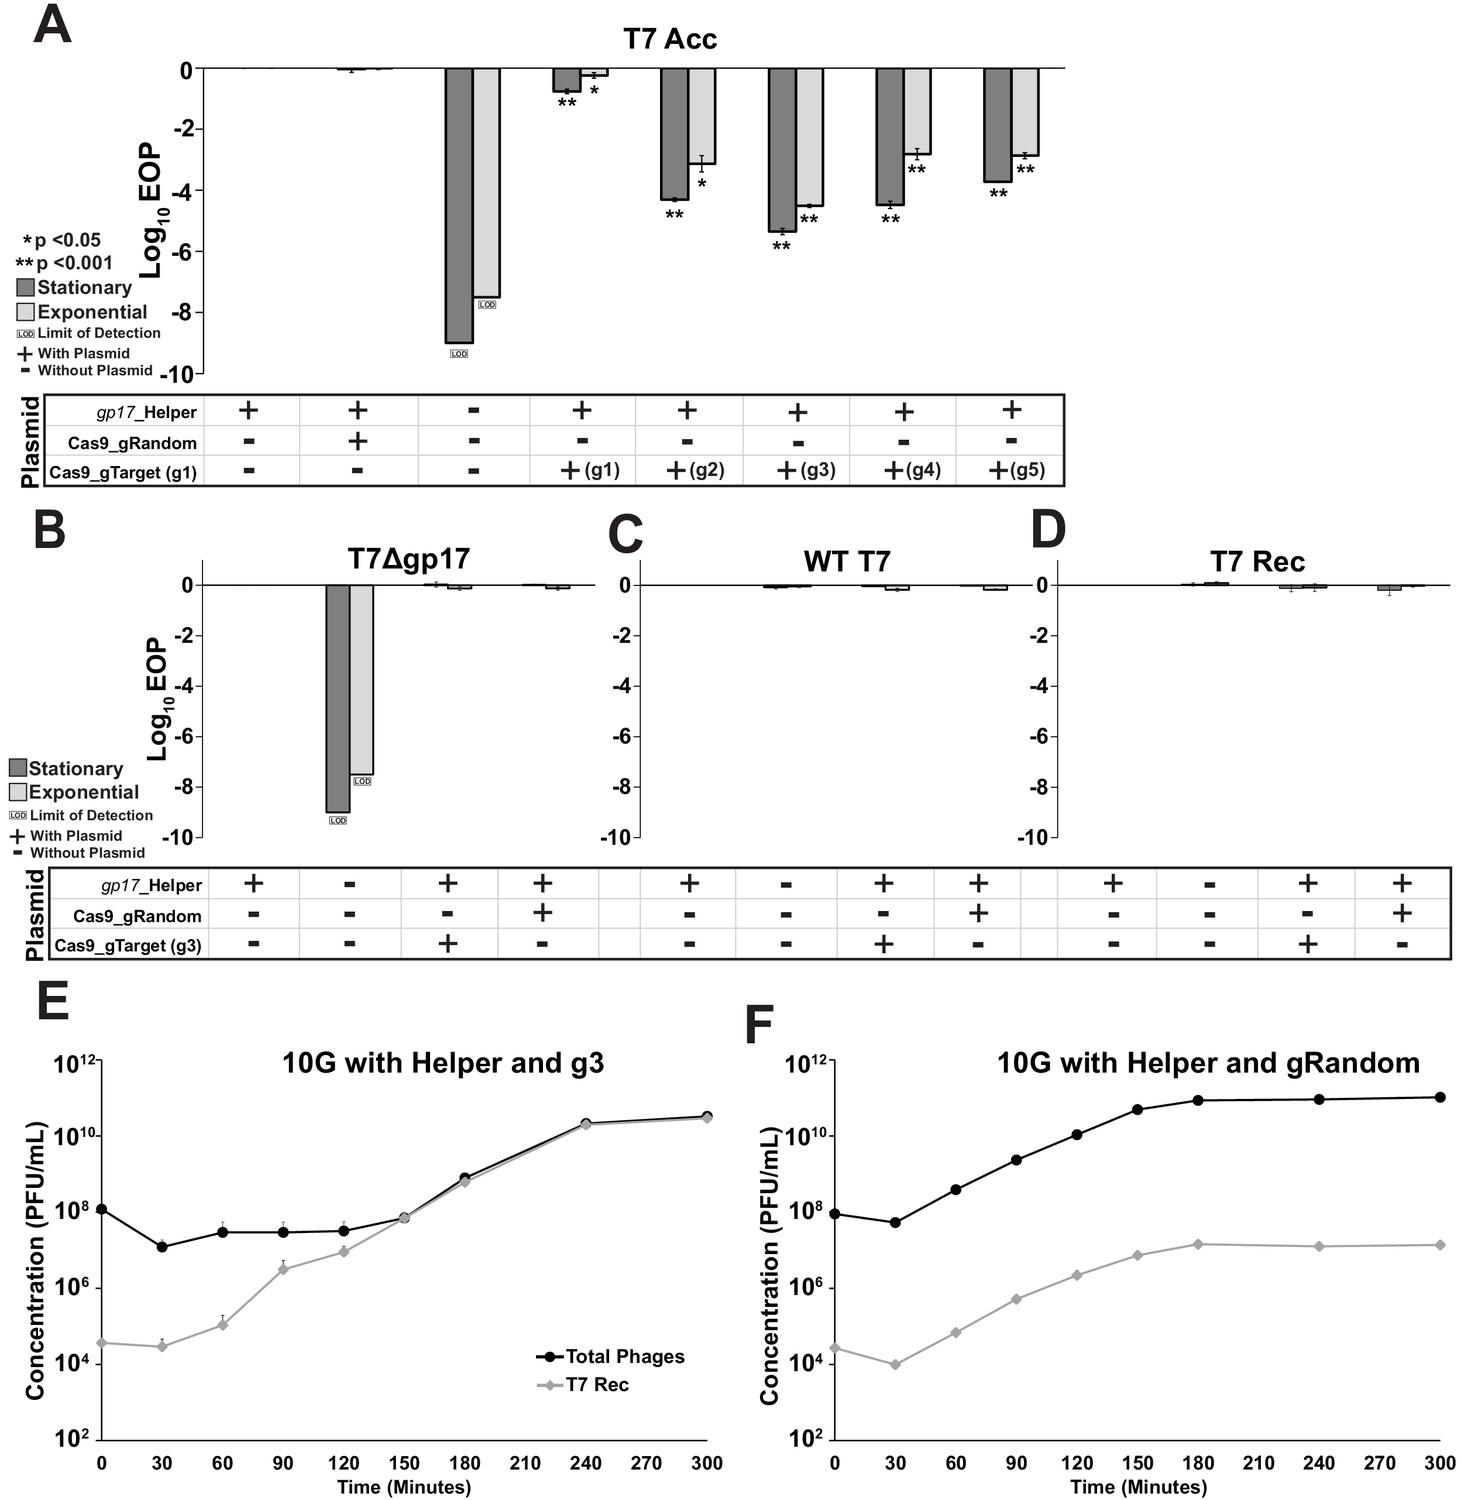
Effect of Cas9-gRNA system on acceptor and control phages.
(A) Efficiency of plating (EOP) measurements on E. coli 10G in stationary (dark grey bar) and exponential (light gray bar) phases for T7 acceptor phage (T7 Acc) with combinations of gp17 helper plasmid, Cas9-gRNA plasmid with a random guide (gRandom) or targeting guides 1 through 5 (gTarget, g1-g5). T7 acceptor phages cannot plaque without helper plasmid. Their plaquing is unaffected by Cas9-gRNA with a random guide (gRandom). Among five different gRNAs targeting fixed sequence, g3 shows highest targeting efficiency and was used for phage library construction with ORACLE. (B-D) The Cas9-gRNA system does not adversely affect the plaquing activity of untargeted phages. Efficiency of plating (EOP) measurements on E. coli 10G with combinations of gp17 helper plasmid, Cas9-gRNA plasmid with a random guide or targeting guide 3 (gTarget, g3) for (B) T7 phage without gp17 (T7Δgp17), (C) wildtype T7 (WT T7) and (D) acceptor T7 phage recombined with wildtype gp17 (T7 Rec). (E and F) Comparison of accumulation of recombined phages (T7 Rec) with respect to total phages using (E) 10G with gp17 helper plasmid and Cas9-gRNA (g3) and (F) 10G with gp17 helper plasmid and Cas9-gRNA (gRandom). All data shown is biological triplicates (mean + SD), all EOP data uses 10G with gp17 helper as a reference host.
Figure 1—figure supplement 3
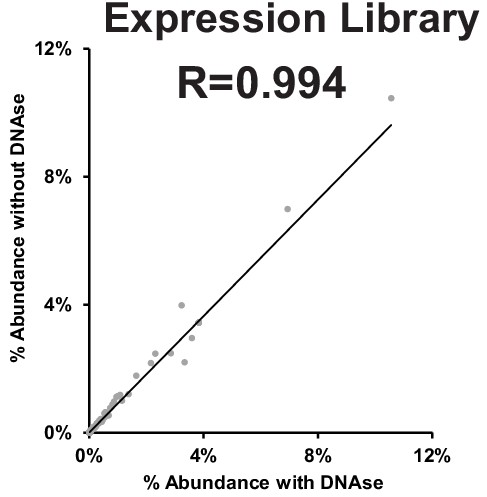
Correlation between expression library with and without DNAse treatment.
Figure 2 with 3 supplements
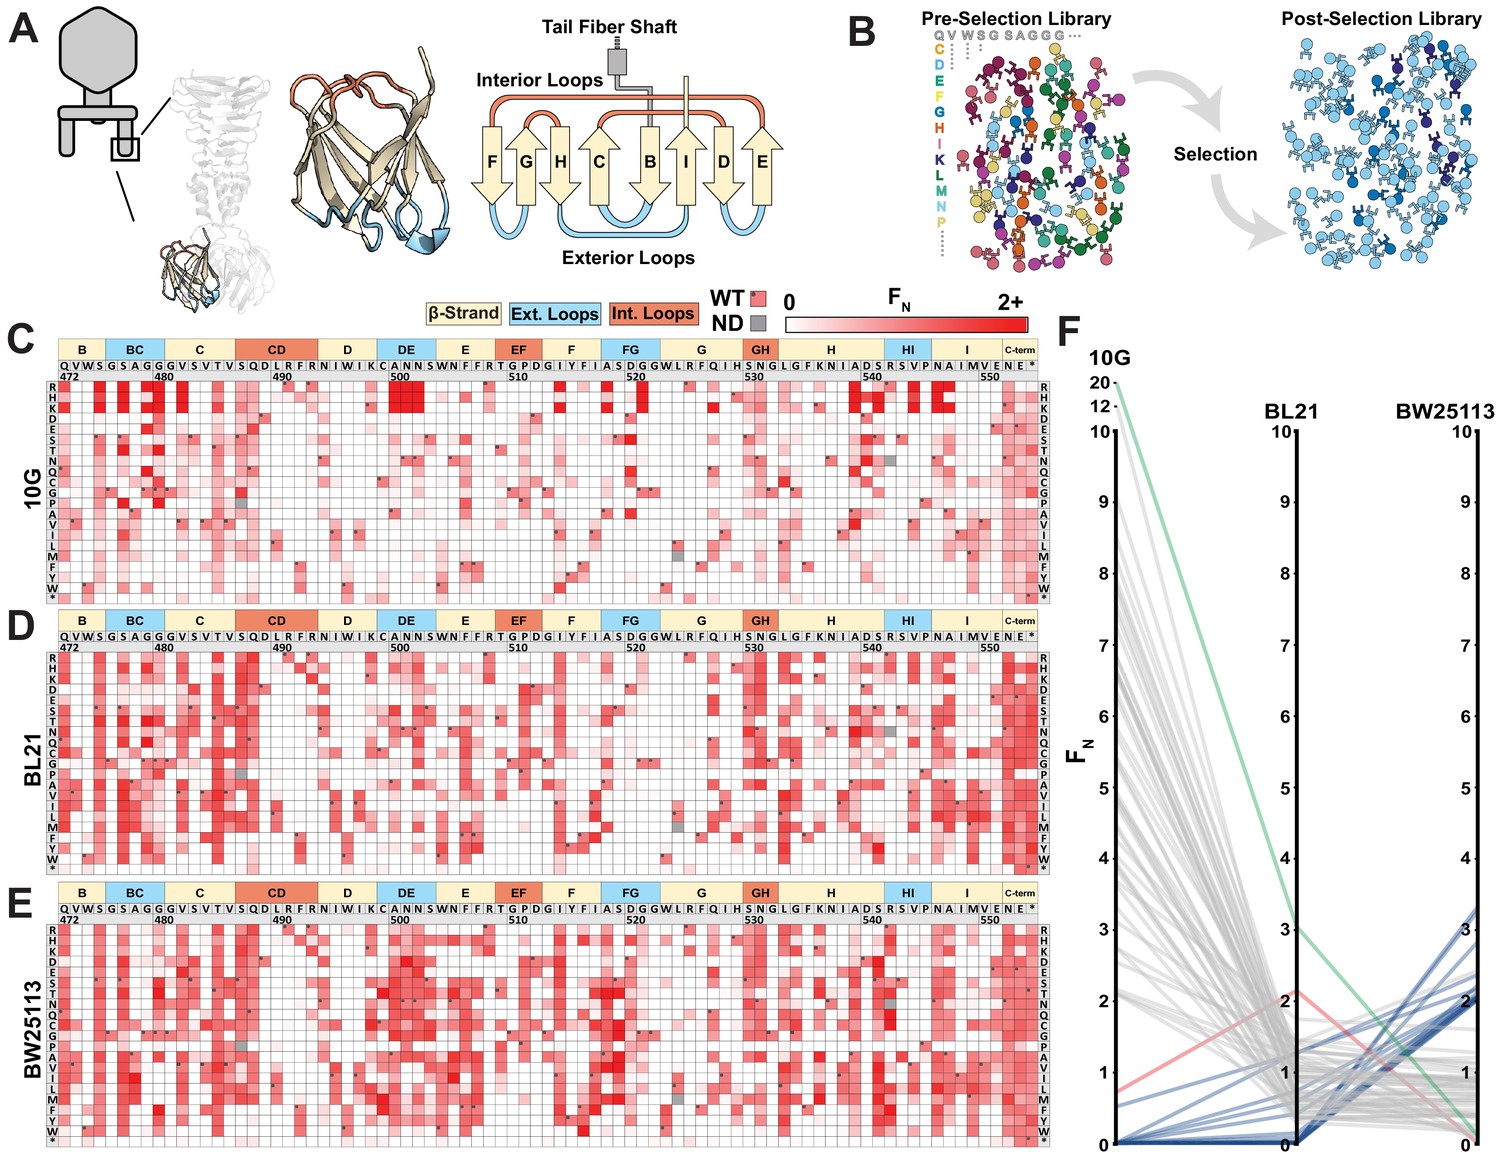
Deep mutational scanning of tip domain shows phage adaptation at molecular resolution.
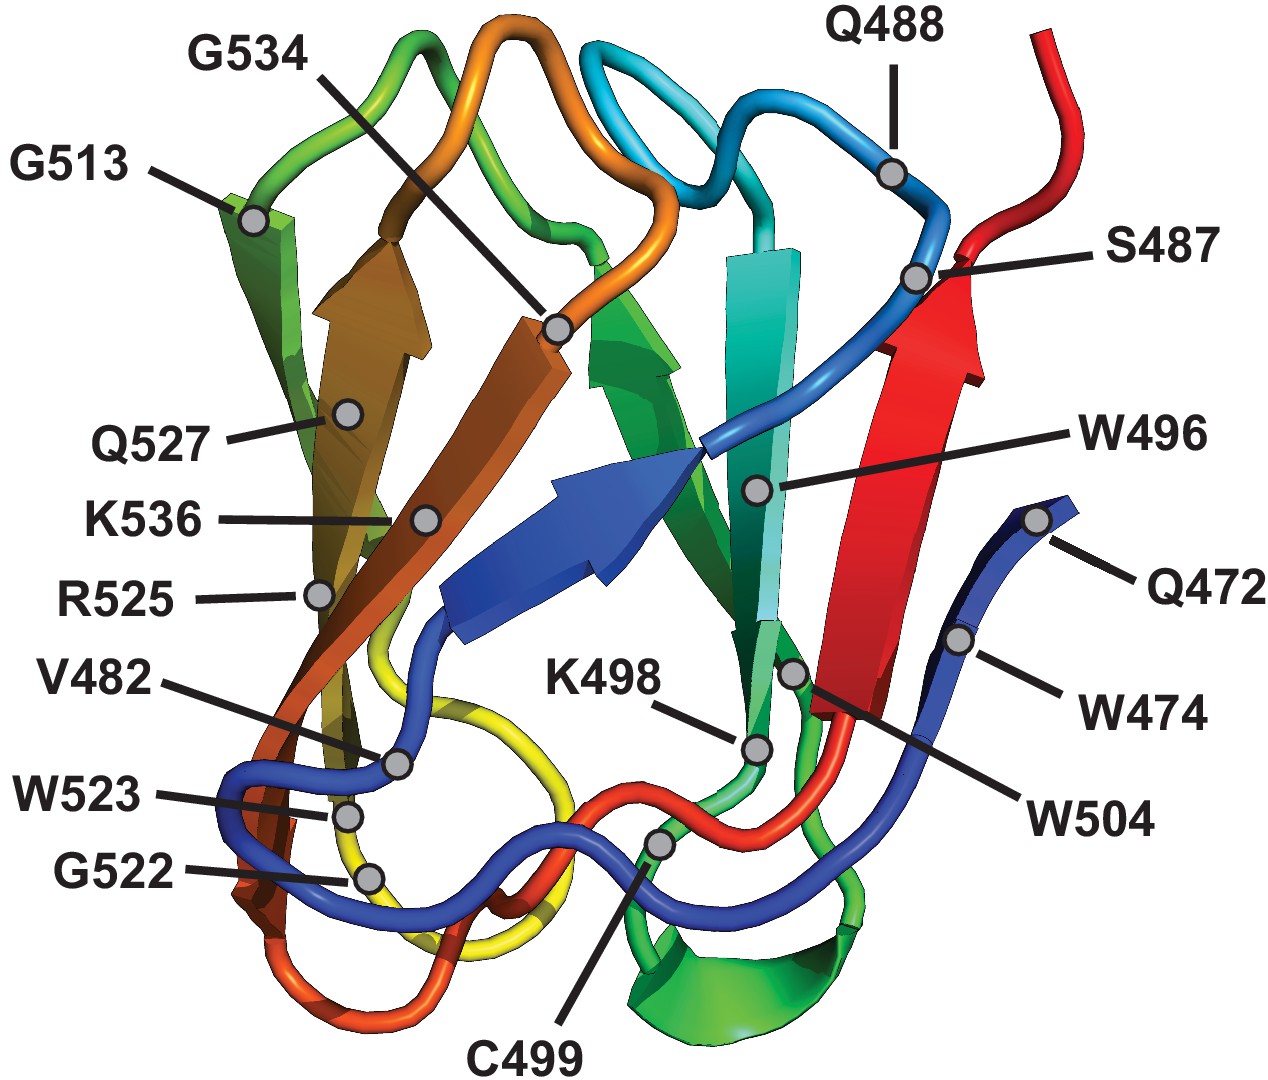
(A) Crystal structure and secondary structure topology of the tip domain color coded as interior loops (red), β-sheets (beige) and exterior loops (blue) (B) Functional analysis of variants by comparing their abundances pre- and post-selection on a host. (C-E) Heat maps showing normalized functional scores (FN) of all substitutions (red gradient) and wildtype amino acid (FN=1 and black dot upper left) at every position for E. coli 10G (C), BL21 (D) and BW25113 (E). Residue numbering (based on PDB 4A0T), wildtype amino acid and secondary structure topology are shown above left to right, substitutions listed top to bottom. (F) Parallel plot showing FN for enriched (FN≥2) variants on 10G, BL21, and BW25113. Coloring indicates enrichment only on 10G (grey), only on BL21 (red), only on BW25113 (blue) enriched on 10G and BL21 (green). Connecting lines indicate FN of the same variant on other hosts.
-
Figure 2—source data 1
Deep sequencing summary for the phage variant library after selection on different hosts.
Related to Figure 2C–E.
- https://cdn.elifesciences.org/articles/63775/elife-63775-fig2-data1-v2.xlsx
-
Figure 2—source data 2
Variant-specific FN for phage variants after selection on E. coli 10G, BL21 ,and BW25113 and physicochemical statistics.
Related to Figure 2C–F, Figure 2—figure supplement 2, and Figure 3.
- https://cdn.elifesciences.org/articles/63775/elife-63775-fig2-data2-v2.xlsx
Figure 2—figure supplement 1
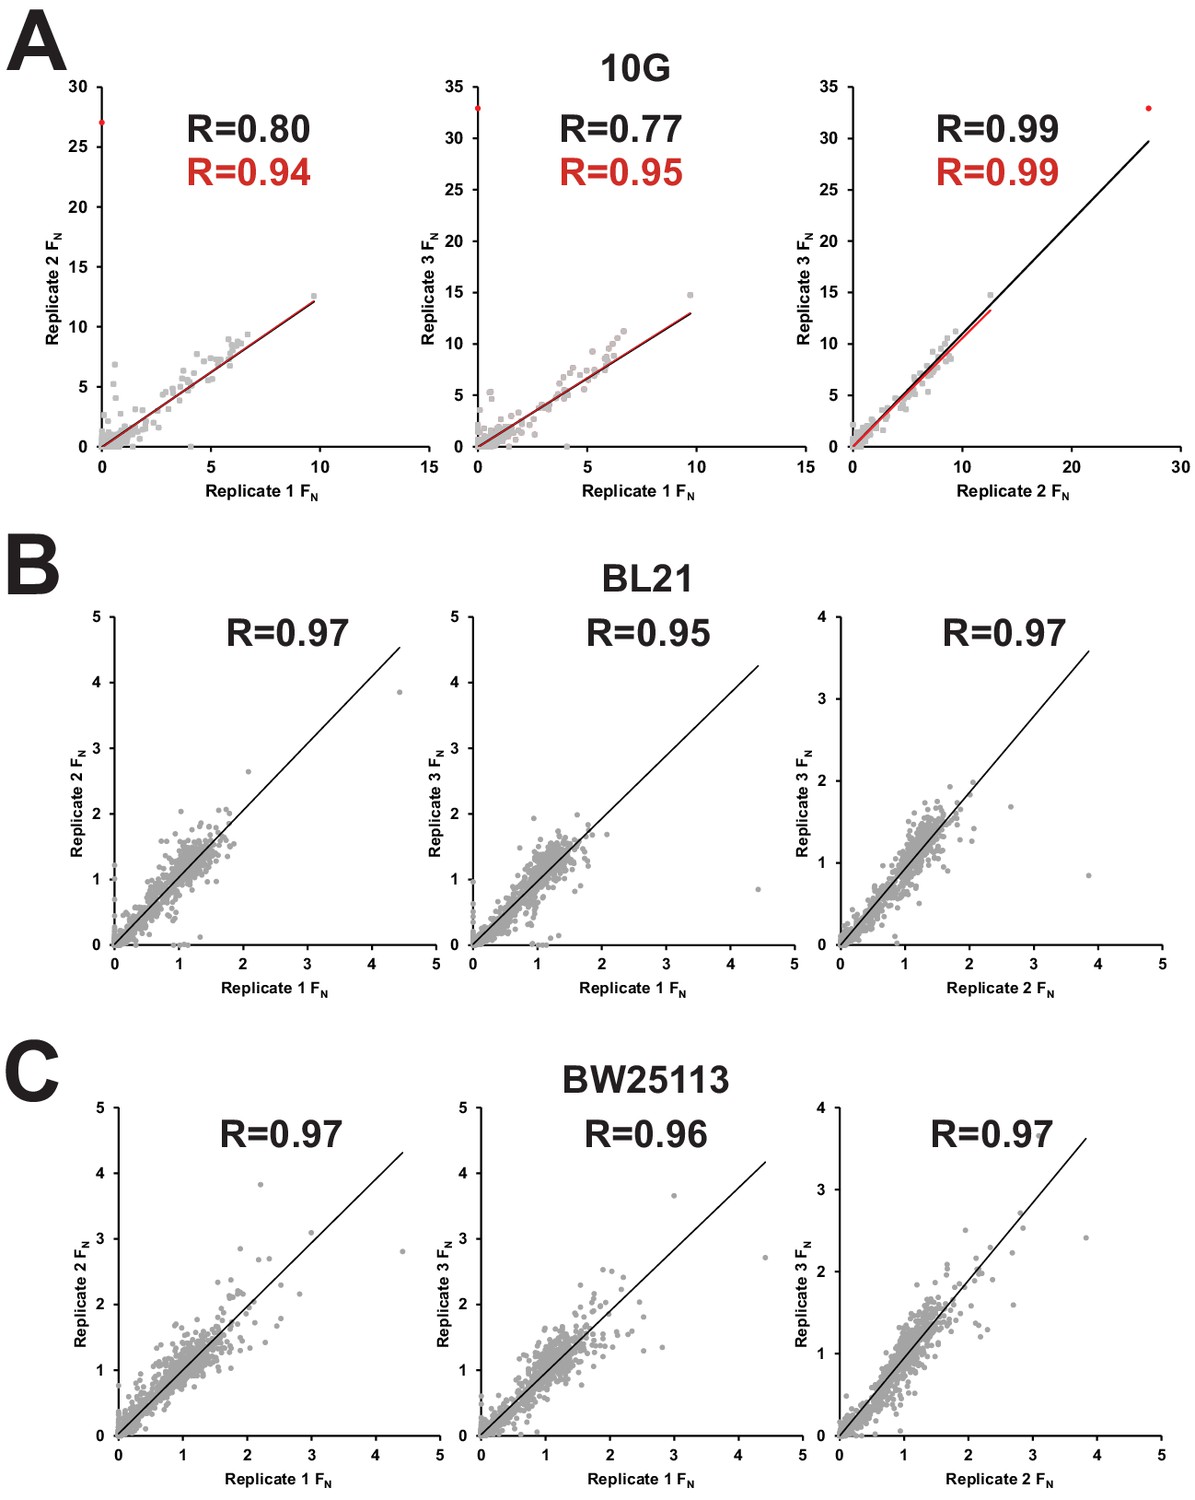
Correlation between biological replicates after selection of phage variant library on E. coli 10G, BL21, and BW25113.
Correlation of FN scores between biological replicates of phage variant library on multiple hosts including (A) E. coli 10G (B) BL21 and (C) BW25113. R values and trendlines are displayed for all variants (black line) and with outliers excluded (red line) for 10G with outlier points in red and all other points in grey.
Figure 2—figure supplement 2
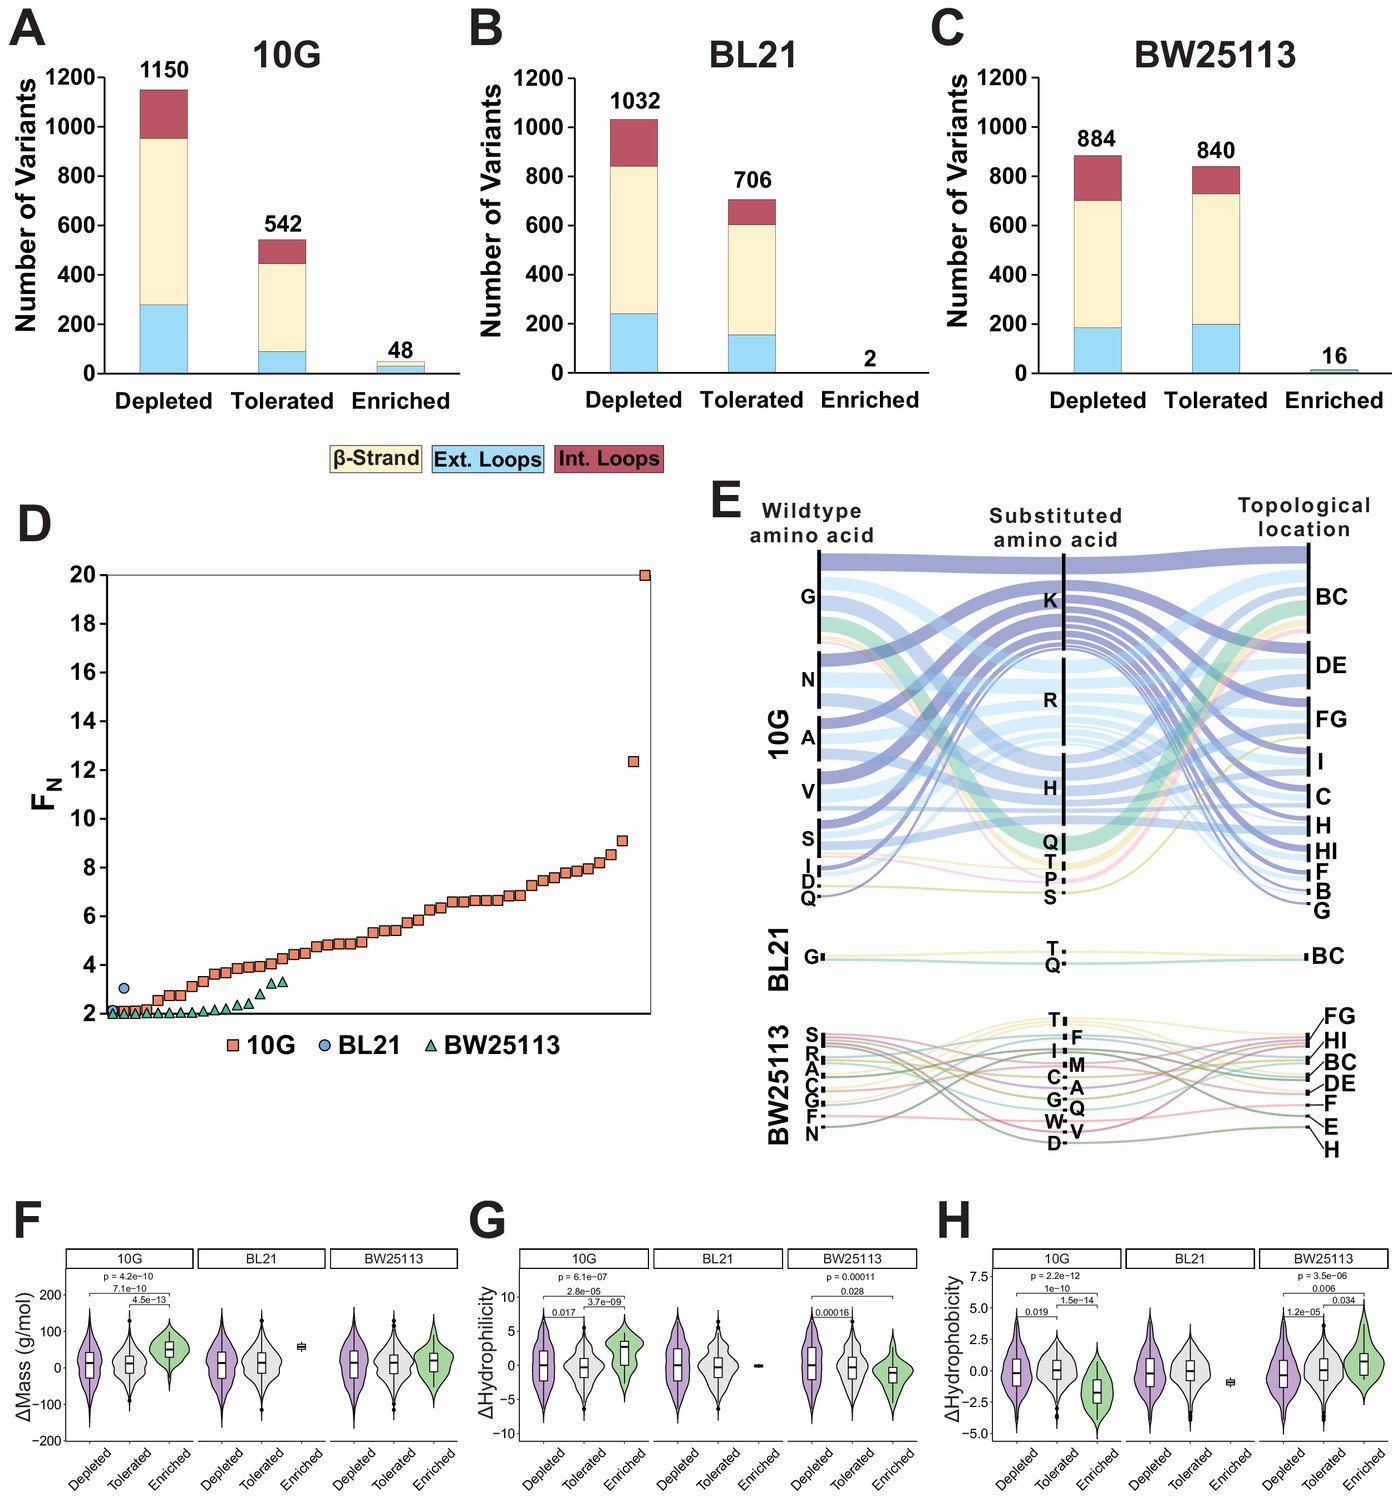
Distribution, enrichment profile, and physicochemical properties of variants after selection on E. coli 10G, BL21, and BW25113.
Number of variants that were depleted (FN ≤ 0.1) tolerated (FN >0.1 and <2) or enriched (FN ≥ 2) after selection on (A) E. coli 10G, (B), BL21, and (C) BW25113, separated by topology of the tip domain color coded as interior loops (red), β-sheets (beige) and exterior loops (blue). (D) Average FN of enriched variants (FN ≥ 2) for 10G (orange squares), BL21 (blue circles), and BW25113 (teal triangles) ordered left to right from lowest to highest FN. (E) Alluvial distribution of enriched variants (FN ≥ 2) on 10G (upper), BL21 (middle) and BW25113 (bottom), showing wild type amino acids (left), their substitution (middle) and topological location on the structure (right). Each alluvial is colored based on the substituted amino acid and scaled by FN across hosts. Violin plots comparing (F) change in mass, (G) change in hydrophilicity, and (H) change in hydrophobicity for grouped depleted (FN ≤ 0.1) tolerated (FN >0.1 and <2) or enriched (FN ≥ 2) substitutions on E. coli 10G, BL21 and BW25113. p-values are shown if only if <0.05, the upper p-value is the result of a Kruskal-Wallis test among all three groups while pairwise p-values from a Wilcoxon test are shown linking each group.
Figure 2—figure supplement 3
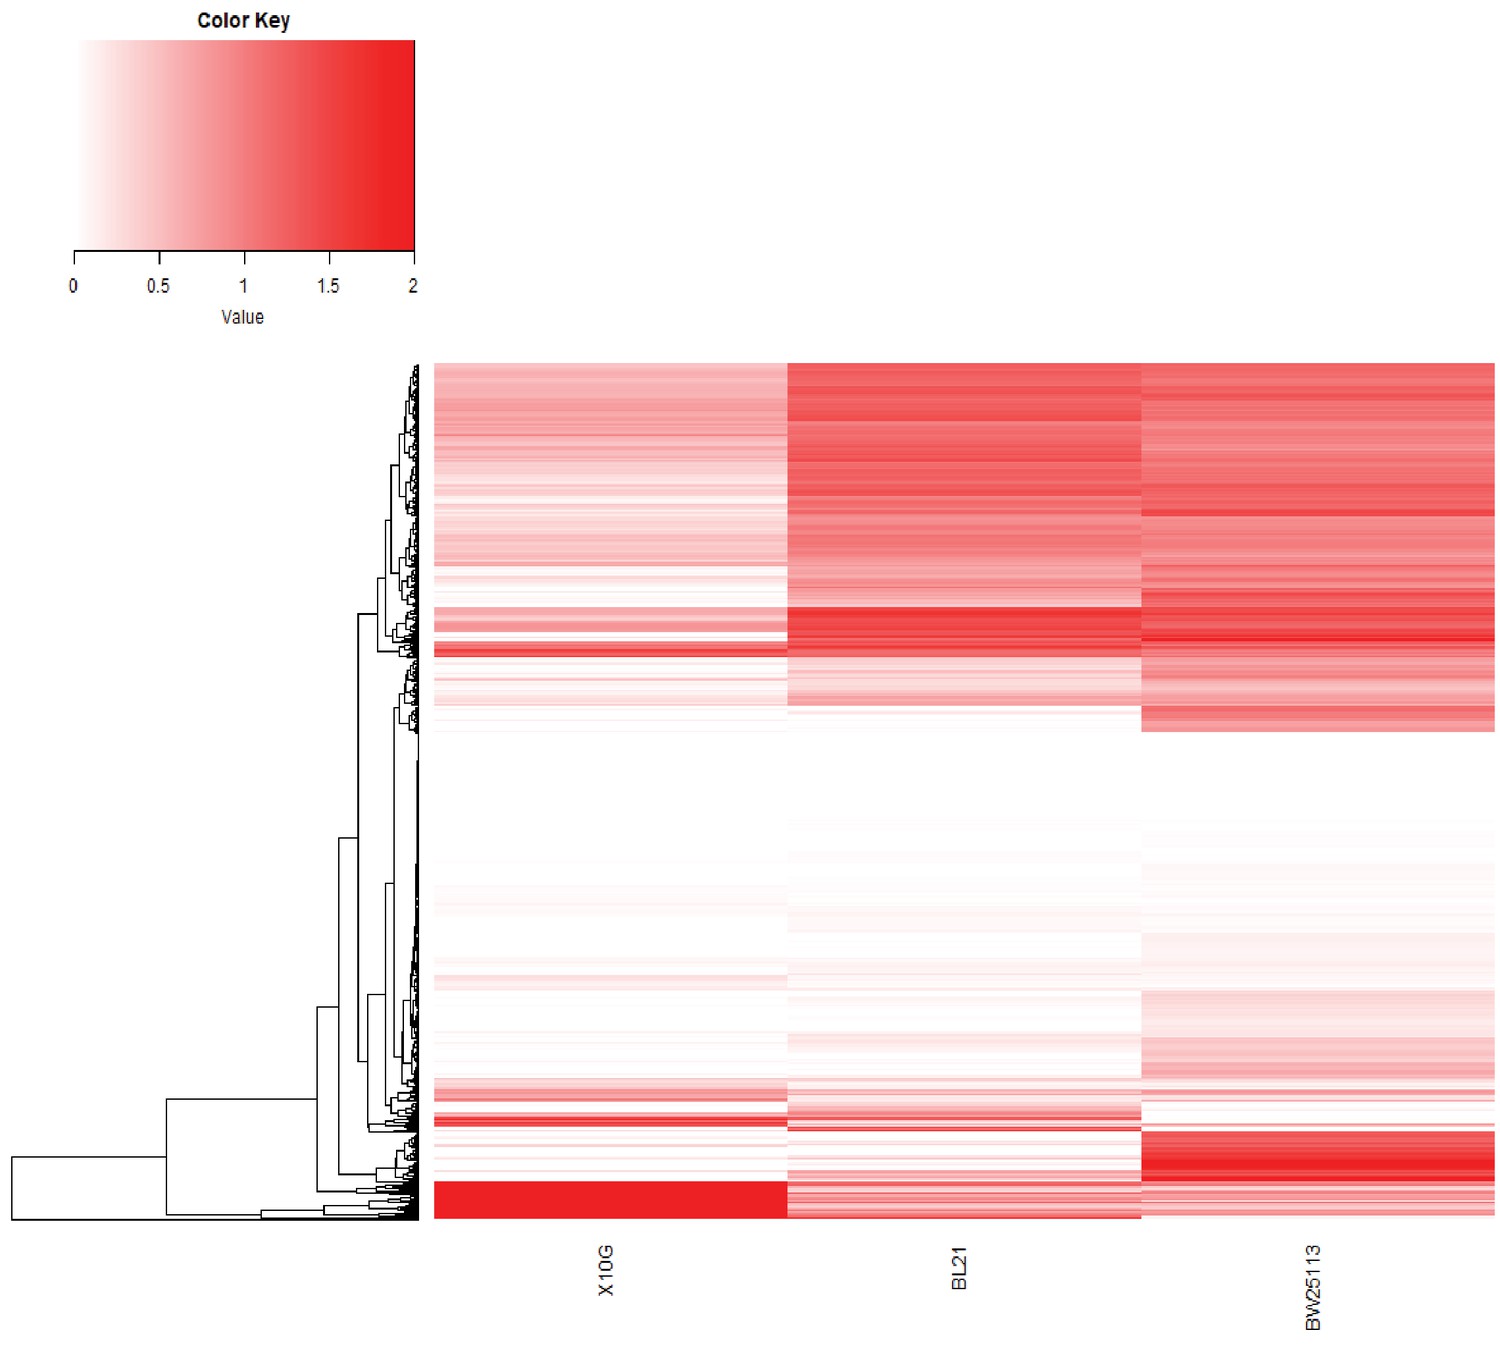
Hierarchical clustering of phage variants based on FN score.
Hierarchical clustering of phage variants based on their FN score across E. coli 10G, BL21 and BW25113. Variants are shaded in white (FN = 0) to red (FN = 2+). Only variants with an FN above the limit of detection on at least one host are included.
Figure 3 with 3 supplements
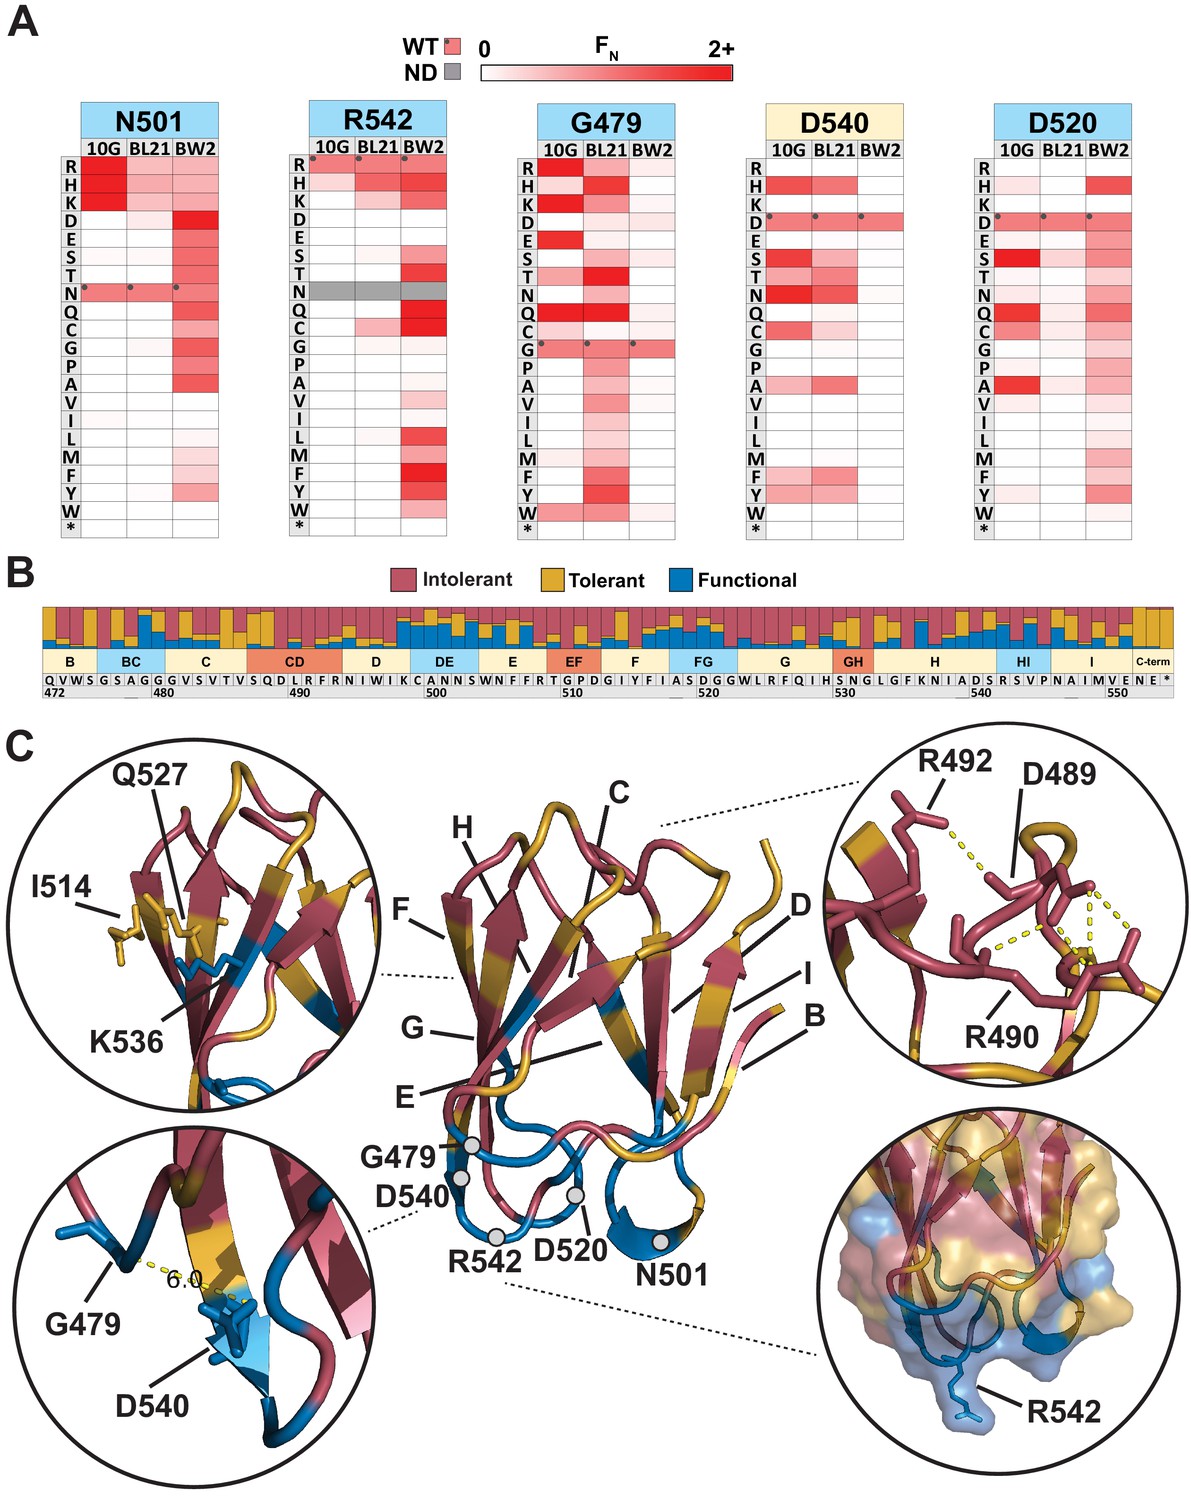
Comparison across hosts reveals regions of functional importance.
(A) Host-specific differences in substitution patterns at five positions in the tip domain recapitulated from Figure 2. (B) Role of each position determined by aggregating scores of all substitutions in all hosts at that position. Substitutions are classified as intolerant (FN < 0.1 in all hosts), tolerant (FN ≥ 0.1 in all hosts), or functional (FN < 0.1 in one host, FN ≥ 0.1 in another host) and bar plots are shown as proportion of classified variants at that position. (C) Crystal structure of the tip domain (center) with each residue colored as intolerant, tolerant, or functional based on the dominant effect at that position, β-sheets and residues listed in (A) are labeled. Key interactions defining function and orientation are highlighted in peripheral panels.
-
Figure 3—source data 1
Functional comparison for each variant on susceptible hosts.
Related to Figure 3B, C.
- https://cdn.elifesciences.org/articles/63775/elife-63775-fig3-data1-v2.xlsx
Figure 3—figure supplement 1
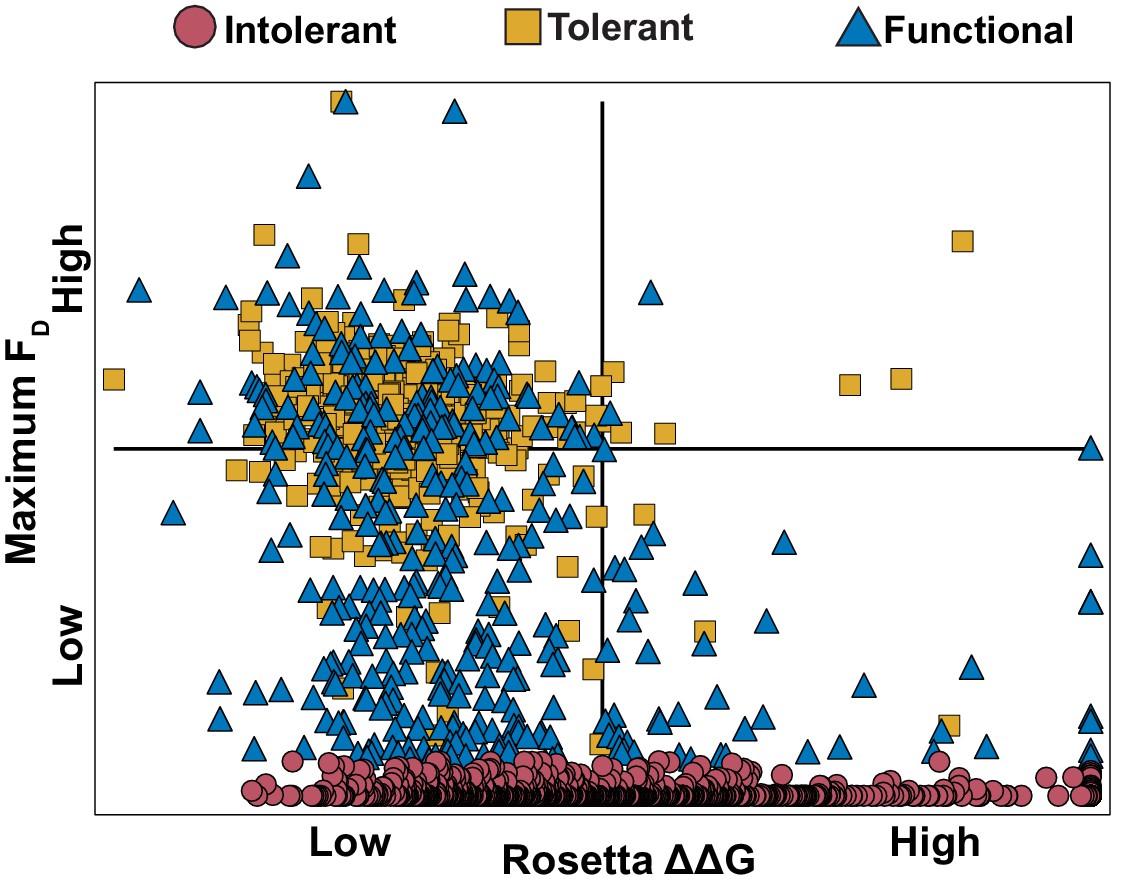
Comparing FD to computationally predicted stability of variant ΔΔG.
Comparison of maximum FD values between E. coli 10G, BL21 and BW25113 to computationally predicted change in stability (ΔΔG, see methods) for each intolerant (red circles), tolerant (yellow squares) and functional (blue triangles) in the variant library.
-
Figure 3—figure supplement 1—source data 1
ΔΔG and FD conversion for all variants.
Related to Figure 3—figure supplement 1.
- https://cdn.elifesciences.org/articles/63775/elife-63775-fig3-figsupp1-data1-v2.xlsx
Figure 3—figure supplement 2
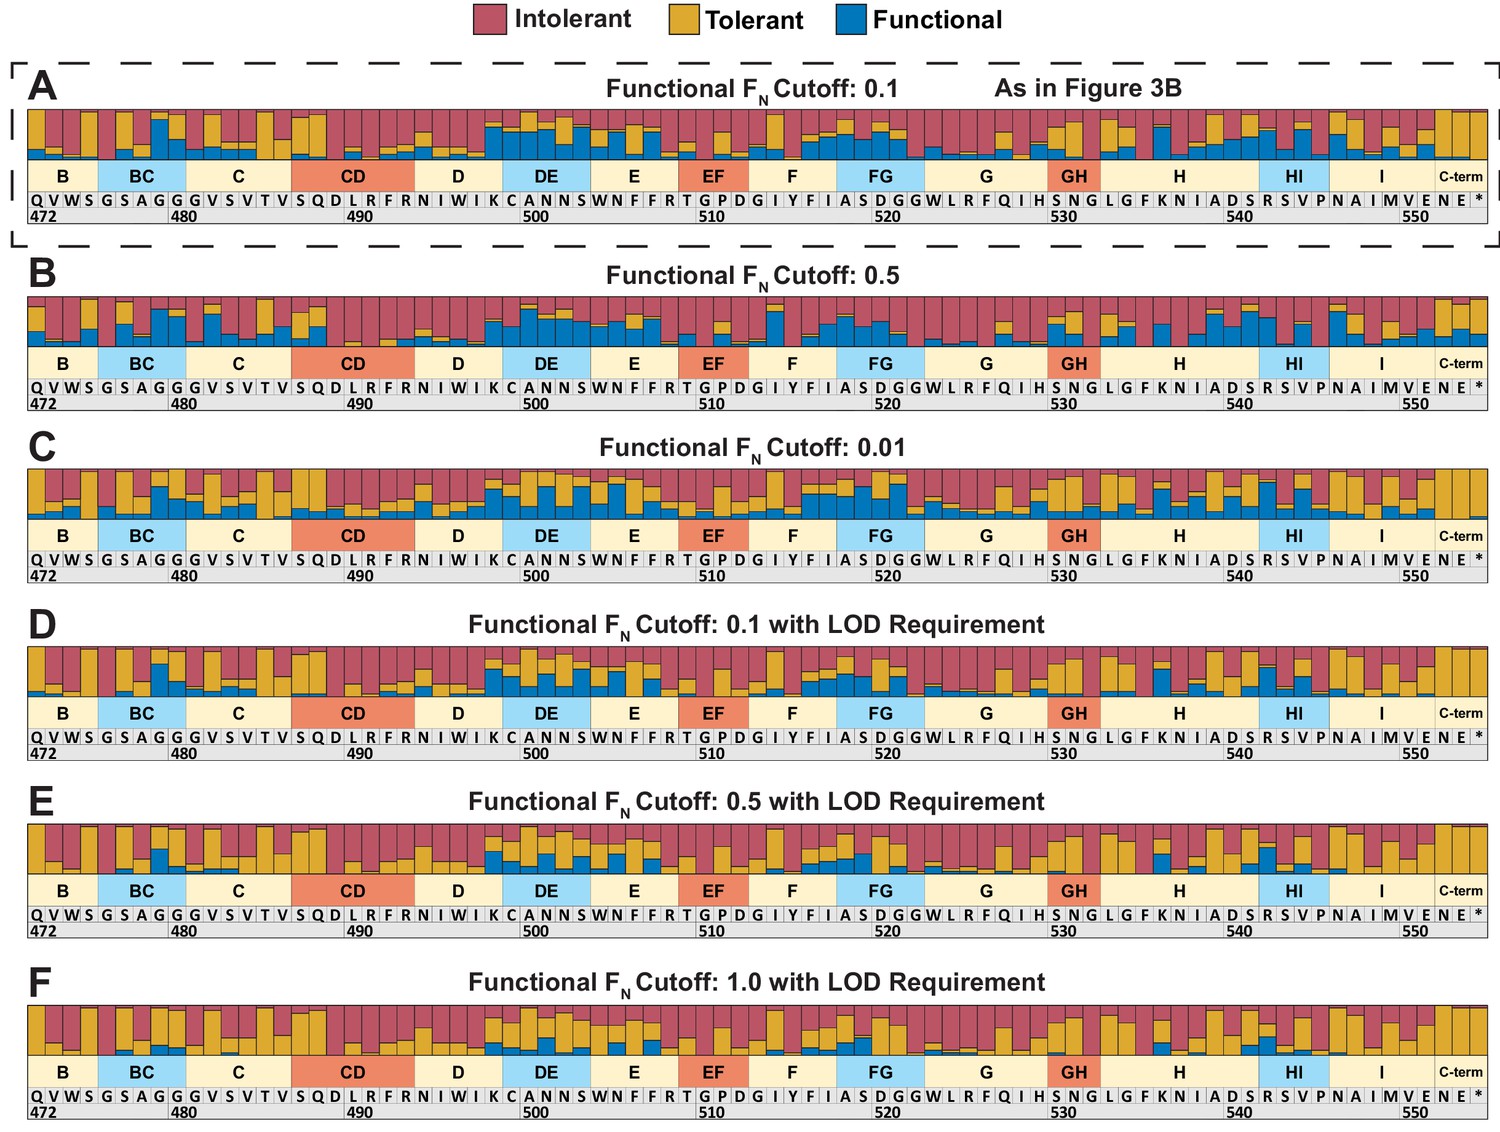
Classification of tolerant, intolerant, and functional regions based on different cutoff conditions.
Phenotypic classification of each position is determined by aggregating scores of all substitutions in all hosts at that position. (A) Substitutions are classified using an FN cutoff of 0.1 as intolerant (FN < 0.1 in all hosts), tolerant (FN ≥ 0.1 in all hosts), or functional (FN < 0.1 in one host, FN ≥ 0.1 in another host) as seen in Figure 3B. Variations of this cutoff (B) using an FN cutoff of 0.5 or (C) using an FN cutoff of 0.01. An alternative, more conservative approach to classifying a functional substitution requires an FN below the limit of detection (LOD) in one host and a higher FN of (D) 0.1, (E) 0.5, or (F) 1.0 in another host. All cutoff conditions broadly result in similar overall trends.
Figure 3—figure supplement 3
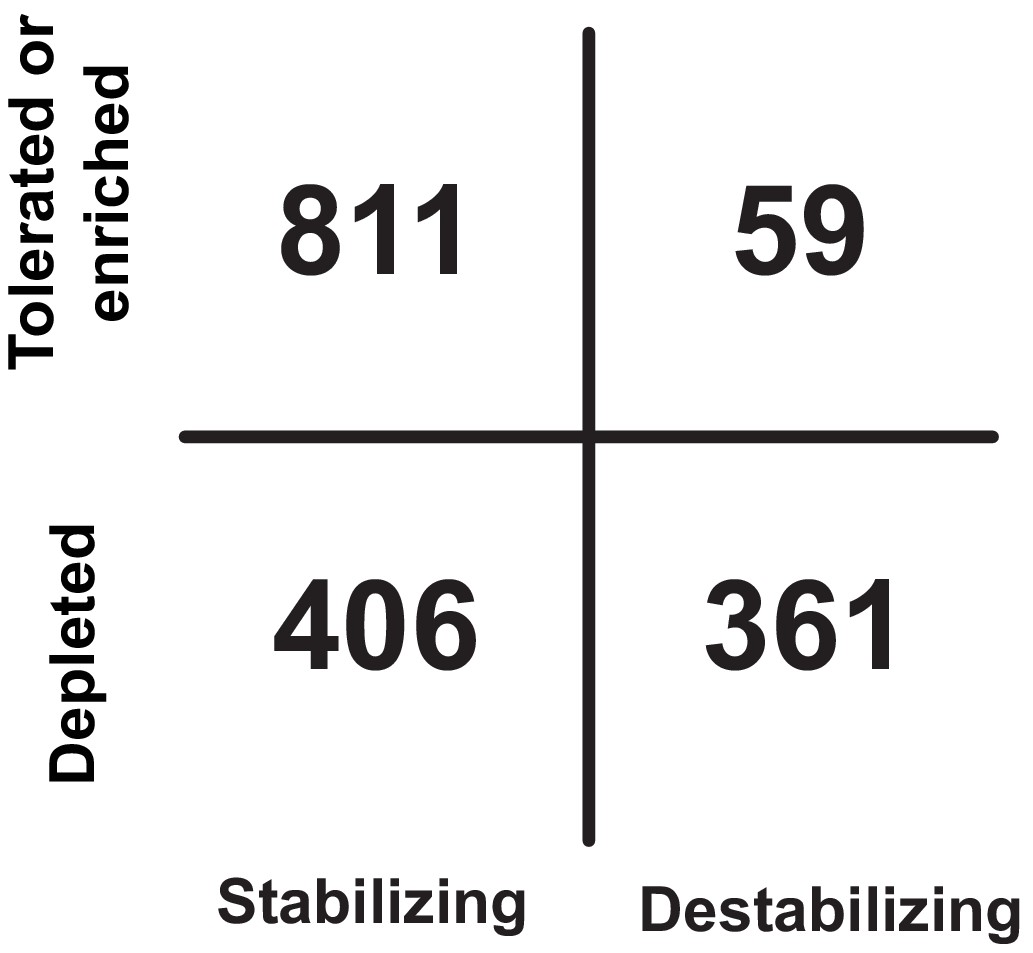
Truth table comparing functional results to predicted stability.
Comparison of functional results to computationally predicted change in stability (ΔΔG, see methods). Substitutions are binned as tolerated or enriched if maximum FD > 0.1 and depleted if FD < 0.1 across any strain. Substitutions are considered stabilizing if predicted ΔΔG was <10 and destabilizing if >10.
Figure 4 with 5 supplements
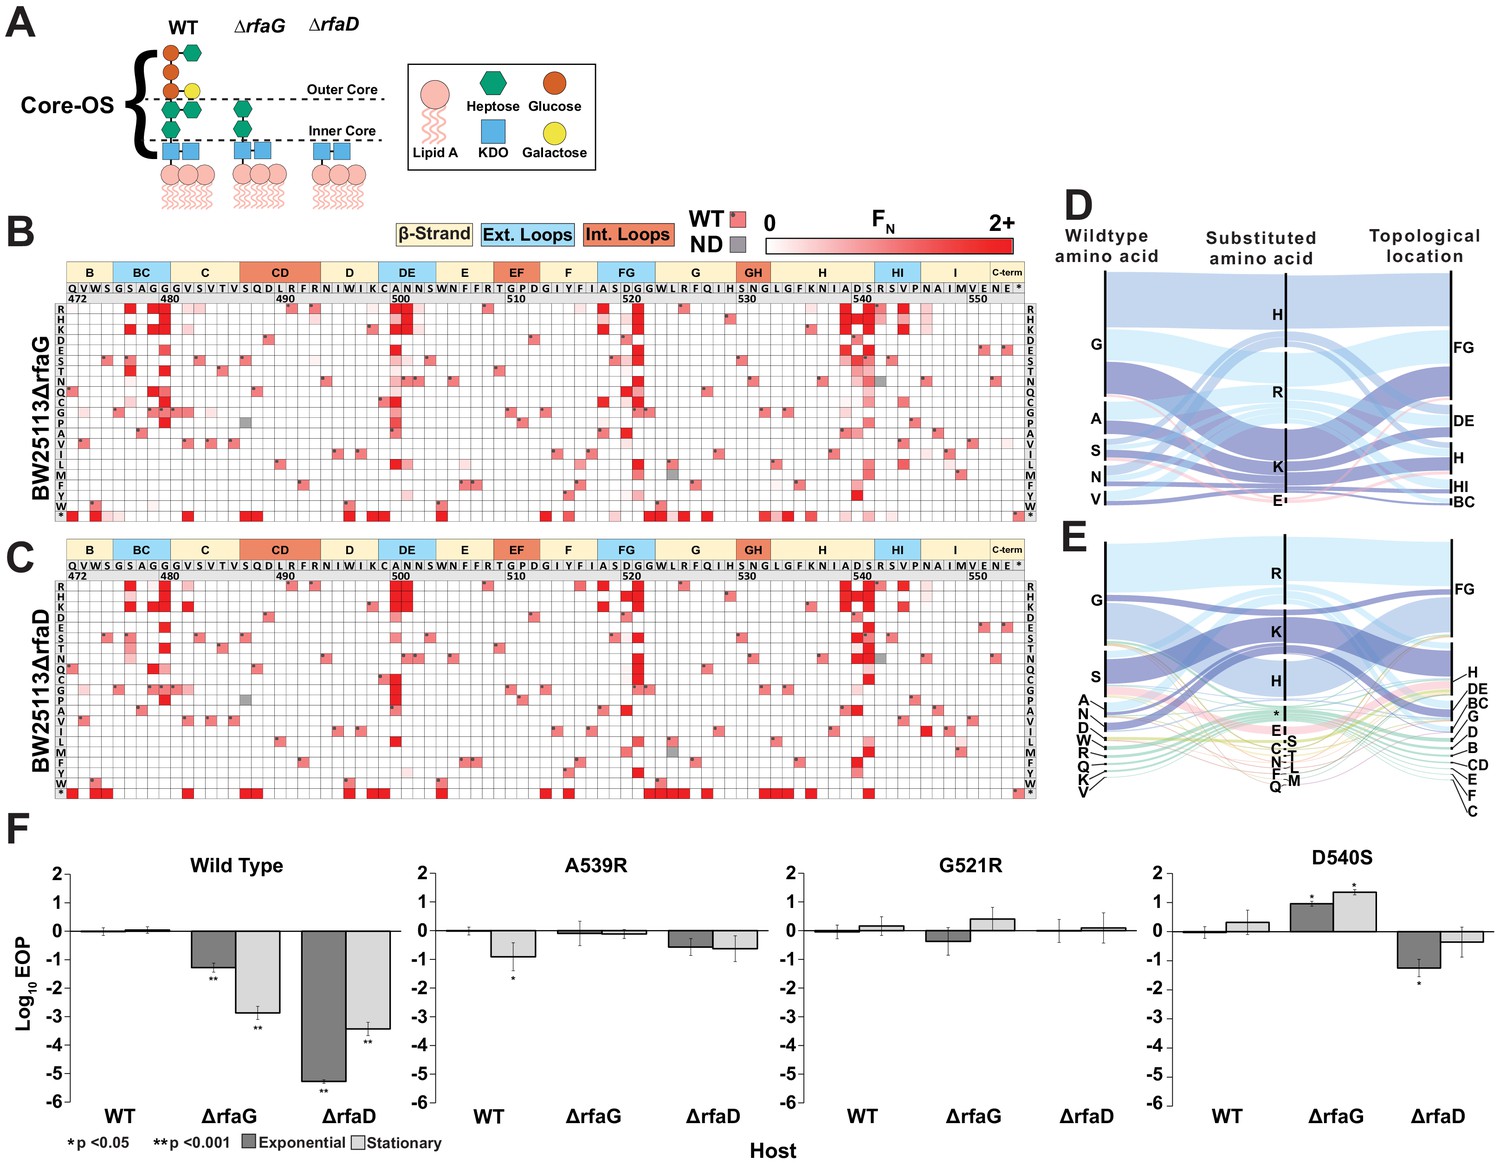
Discovery of gain-of-function variants against resistant hosts.
(A) Schematic view of the LPS on wildtype BW25113, BW25113ΔrfaG and BW25113ΔrfaD. (B-C) Heat maps showing normalized functional scores (FN) of all substitutions (red gradient) and wildtype amino acid (FN=1 and black dot upper left) at every position for BW25113ΔrfaG (B) and BW25113ΔrfaD (C). (D-E) Among highly enriched variants (FN ≥ 10), targeted amino acids (left), their substitutions (middle) and topological location on the structure (right) on BW25113ΔrfaG (D) and BW25113ΔrfaD (E), with each alluvial colored based on the substituted amino acid and scaled by FN. (F) EOP (mean ± SD, biological triplicates) for wildtype phage and select variants on BW25113 (Wild Type), BW25113ΔrfaG and BW25113ΔrfaD in exponential (dark gray) and stationary phases (light gray) using BW25113 as a reference host.
-
Figure 4—source data 1
Deep sequencing summary for phage variant library after selection on different hosts.
Related to Figure 4B, C.
- https://cdn.elifesciences.org/articles/63775/elife-63775-fig4-data1-v2.xlsx
-
Figure 4—source data 2
Variant-specific FN for phage variants after selection on E. coli BW25113ΔrfaG and BW25113ΔrfaD and physicochemical statistics.
Related to Figure 4B, C and Figure 4—figure supplement 4.
- https://cdn.elifesciences.org/articles/63775/elife-63775-fig4-data2-v2.xlsx
Figure 4—figure supplement 1
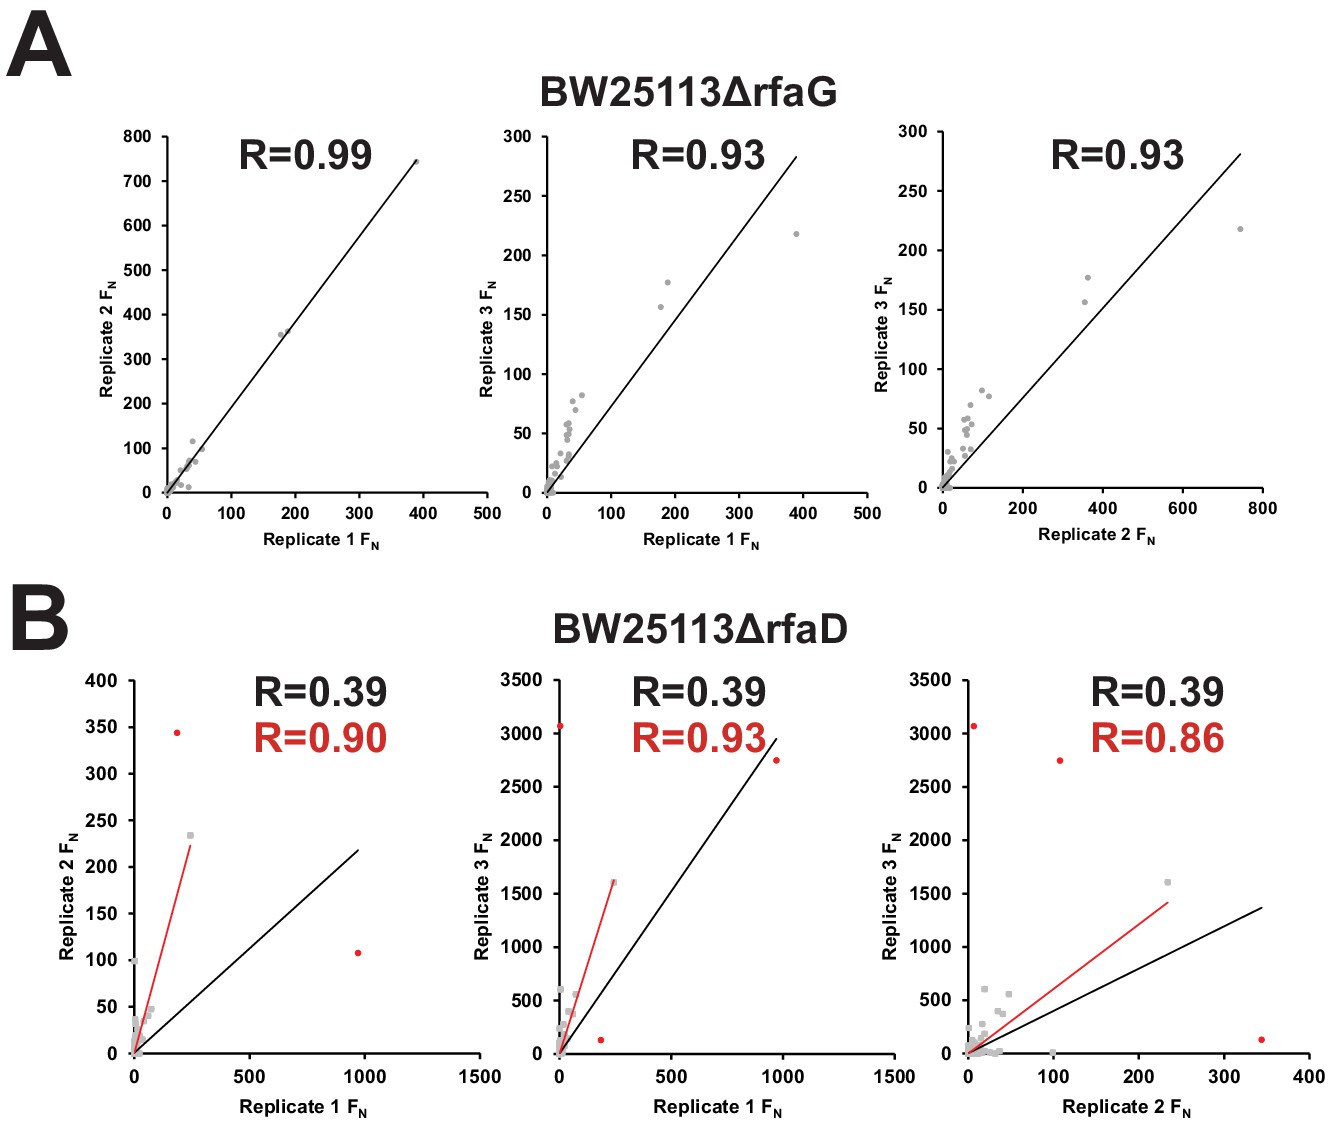
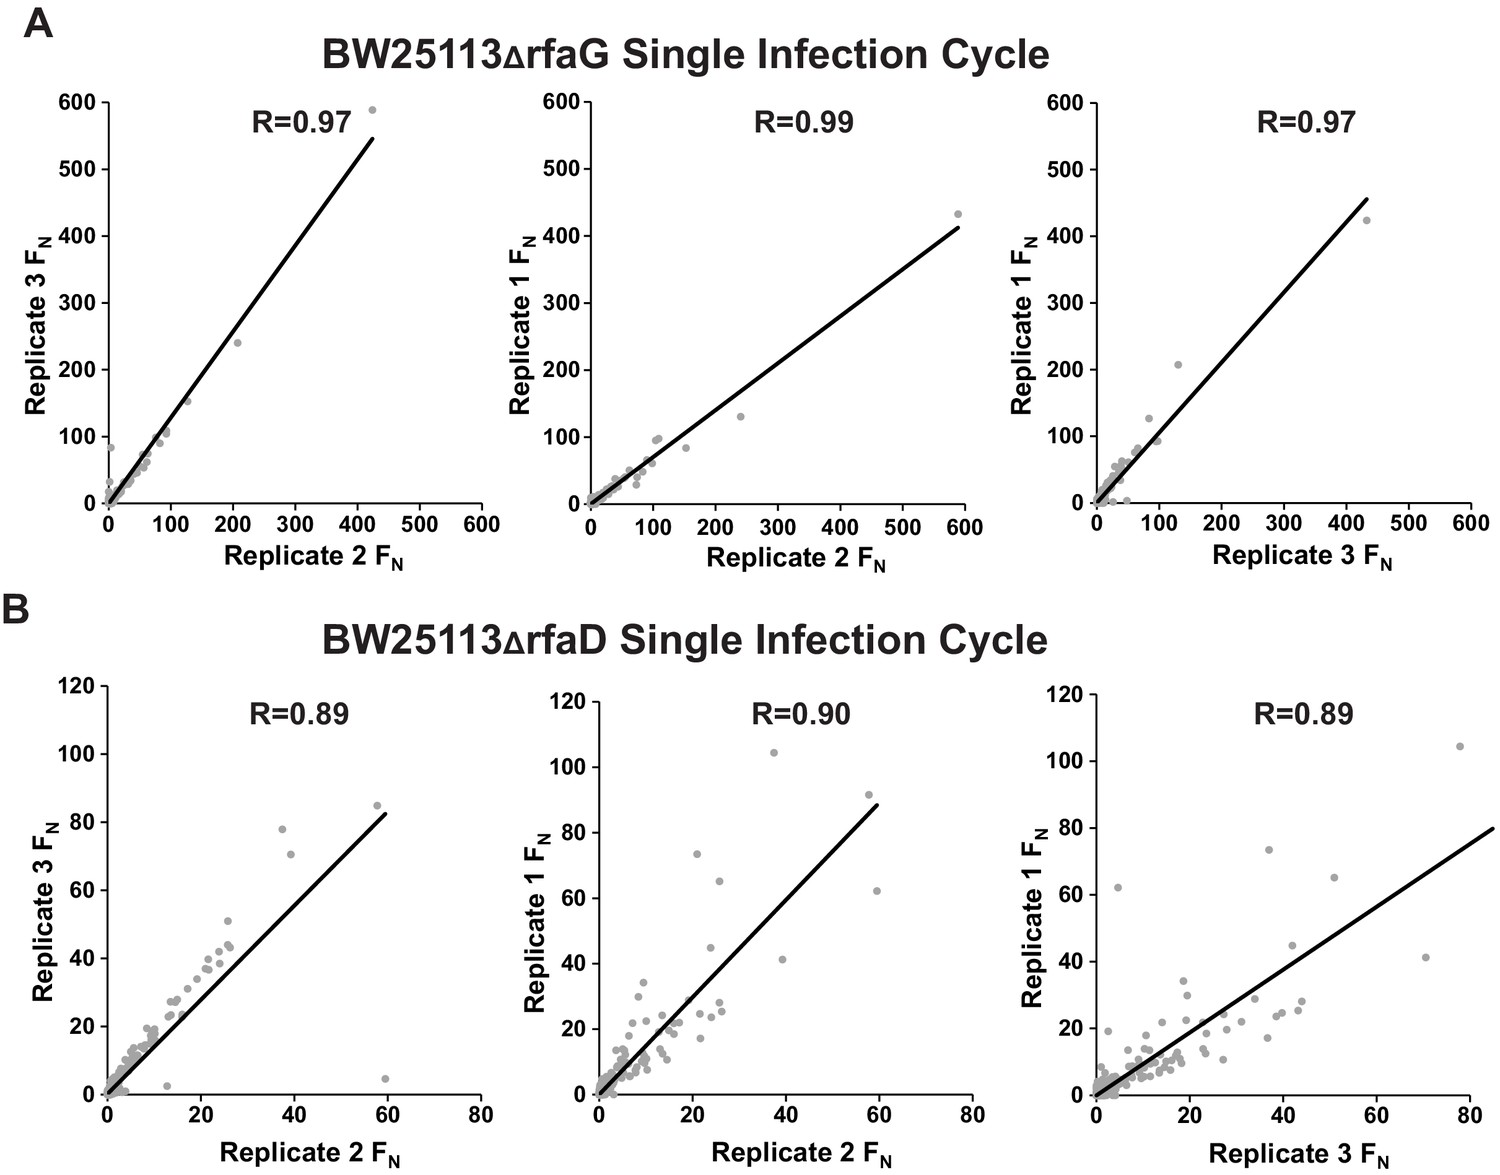
Correlation between biological replicates after selection of phage variant library on E. coli BW25113ΔrfaG and BW25113ΔrfaD.
Correlation of FN scores between biological replicates of the phage variant library on (A) E. coli BW25113ΔrfaG and (B) BW25113ΔrfaD. R values and trendlines are displayed for all variants (black line) and with outliers excluded (red line) for BW25113ΔrfaD with outlier points in red and all other points in grey.
Figure 4—figure supplement 2
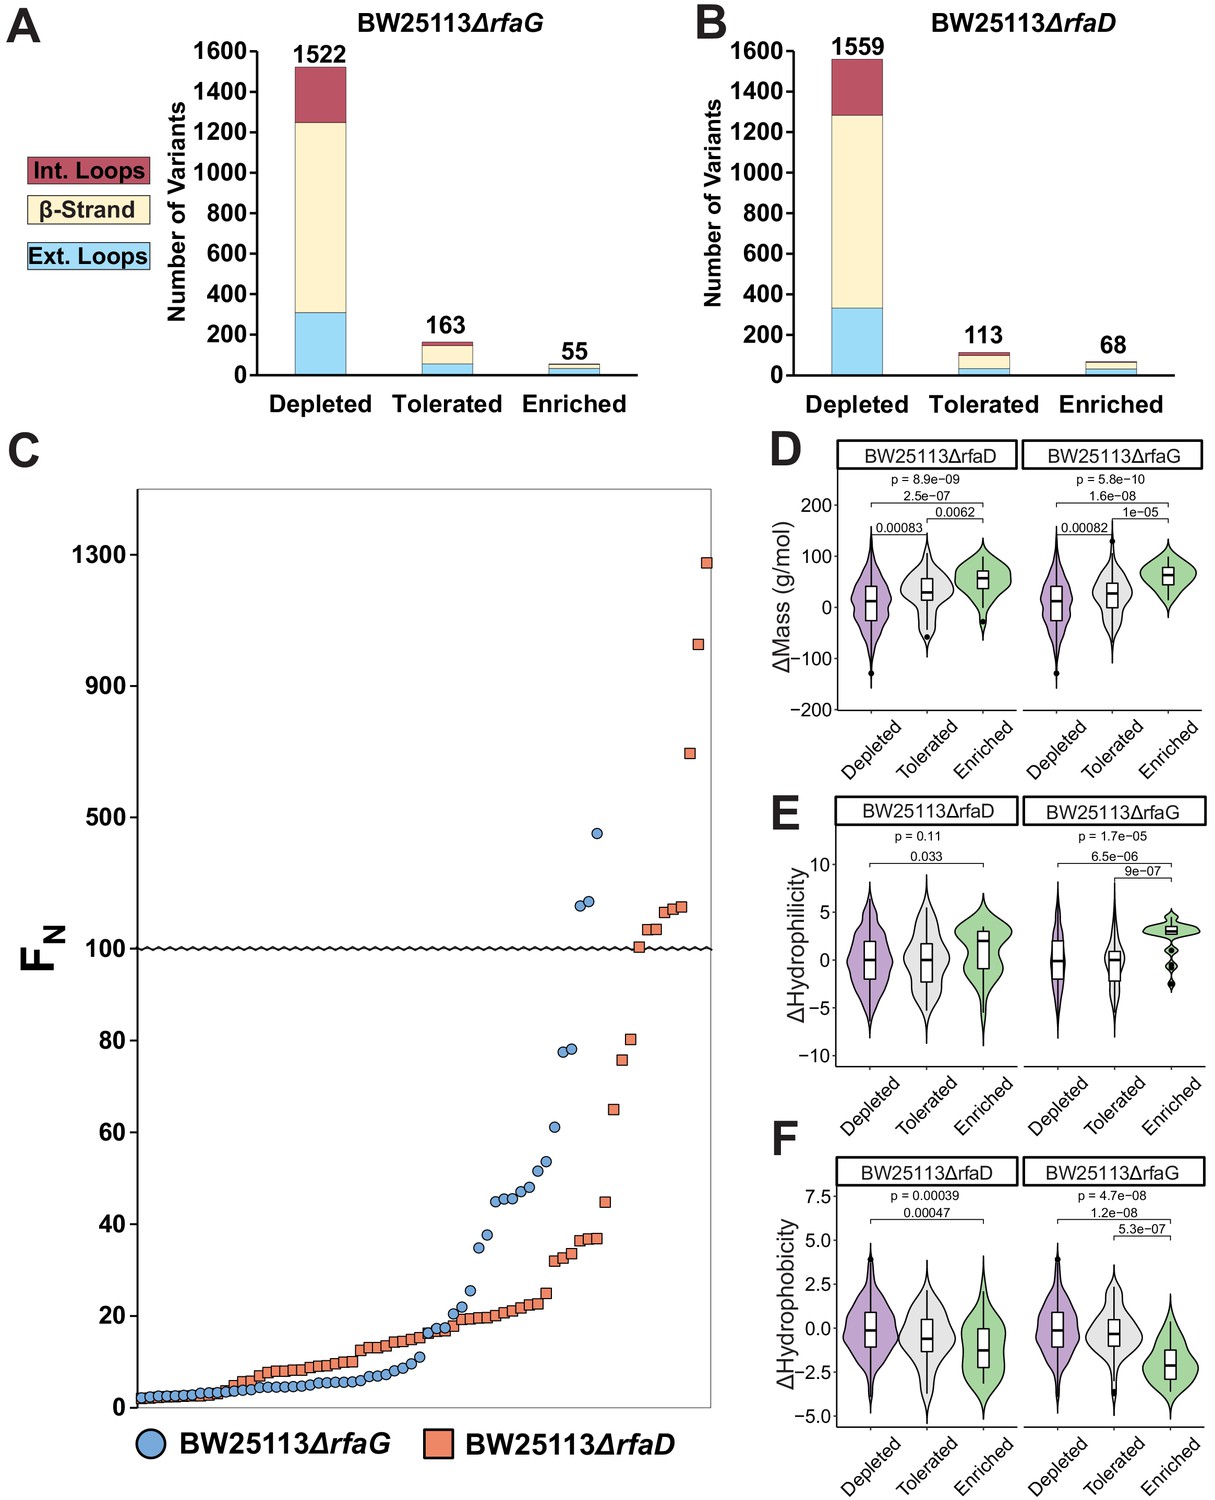
Distribution, enrichment profile, and physicochemical properties of variants after selection on E. coli BW25113ΔrfaG and BW25113ΔrfaD.
Number of variants that were depleted (FN ≤ 0.1) tolerated (FN >0.1 and <2) or enriched (FN ≥ 2) after selection on (A) BW25113ΔrfaG or (B) BW25113ΔrfaD, separated by topology of the tip domain color coded as interior loops (red), β-sheets (beige) and exterior loops (blue). (C) Average FN of enriched variants (FN ≥ 2) for BW25113ΔrfaD (orange squares) and BW25113ΔrfaG (blue circles) ordered left to right from lowest to highest FN. Violin plots comparing (D) change in mass, (E) change in hydrophilicity, and (F) change in hydrophobicity for grouped depleted (FN ≤ 0.1) generally tolerated (FN >0.1 and <10) or well enriched (FN ≥ 10) substitutions on E. coli BW25113ΔrfaD and BW25113ΔrfaG. The upper p-value is the result of a Kruskal-Wallis test among all three groups while pairwise p-values from a Wilcoxon test are shown linking each group; p-values are shown if only if <0.05.
Figure 4—figure supplement 3
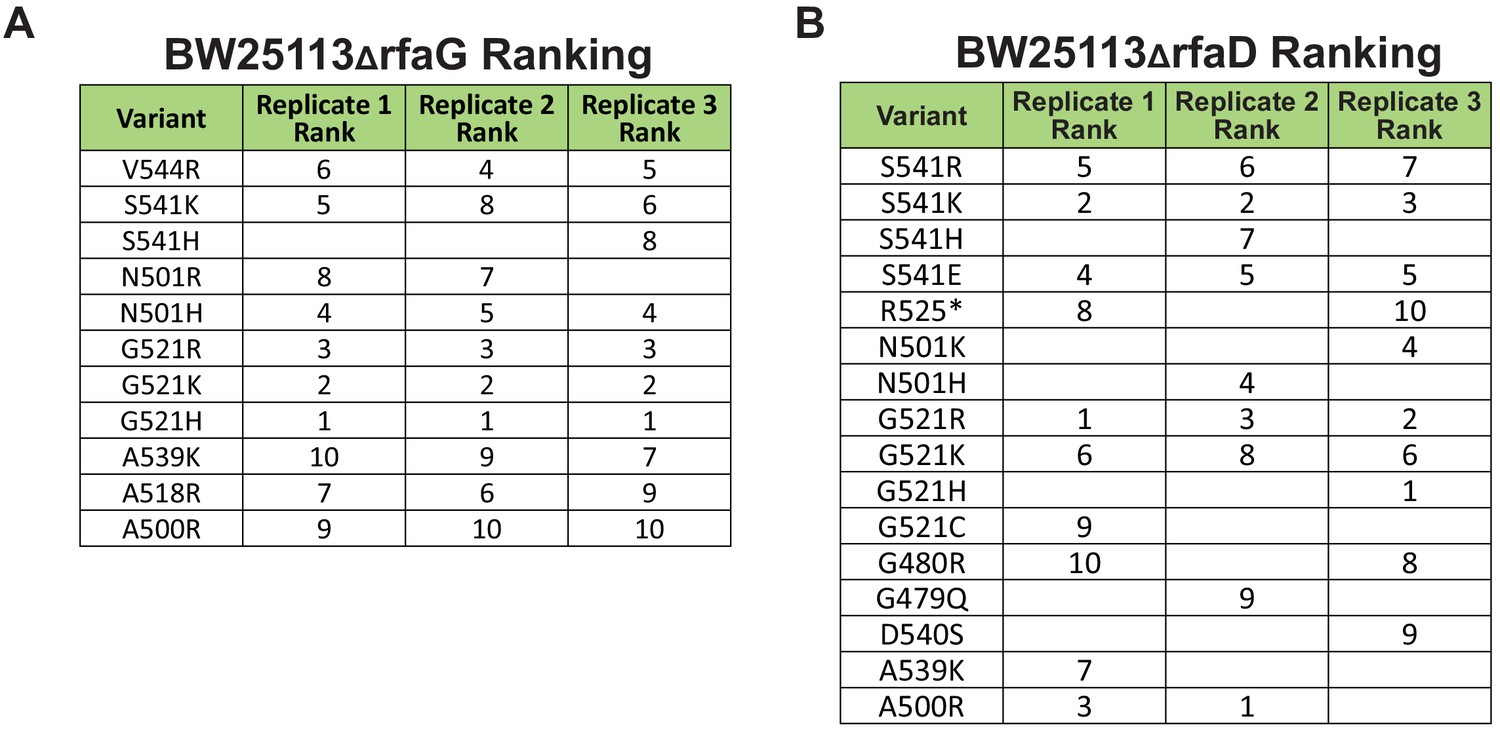
Ranking FN of the 10 most enriched variants in each biological replicate for (A) E. coli BW25113ΔrfaG and (B) BW25113ΔrfaD.
Figure 4—figure supplement 4
Correlation between biological replicates for selection of phage variant library after one infection cycle on (A) E. coli BW25113ΔrfaG and (B) BW25113ΔrfaD.
Figure 4—figure supplement 5
Location of truncations in the tip domain enriched after selection.
Location (black circles) of truncations in the tip domain with an FN>10 on BW25113ΔrfaD. The tip domain is colored in a rainbow gradient from N (blue) to C (red) terminus.
Figure 5
Targeting pathogenic E. coli causing UTIs using T7 variants.
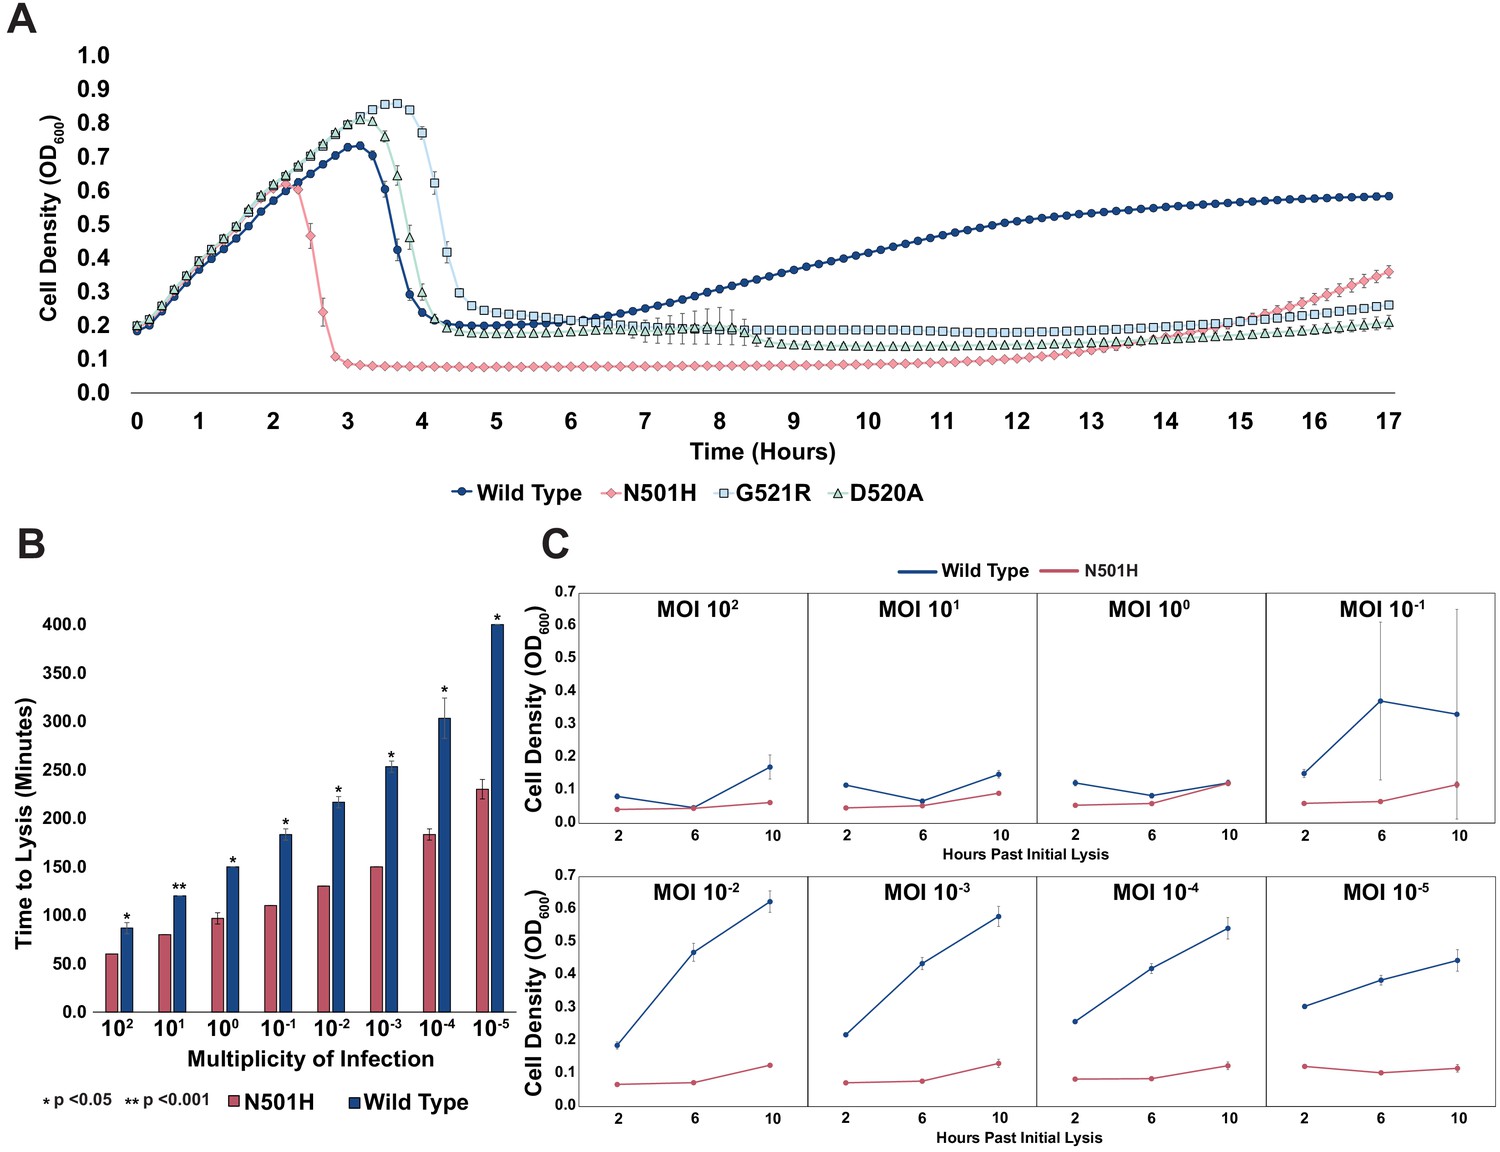
(A) Growth time course of UTI473 strain subject to wildtype T7 and select variants. Phages were applied after an hour at an MOI of ~10-2. (B) Estimated time to lysis of UTI473 strain incubated with wildtype T7 and N501H variant over a range of MOIs, derived from time course experiments. (C) Cell density (OD600) of UTI473 strain when incubated with wildtype T7 and N501H variant at select timepoints after initial lysis. All data represented as mean ± SD of biological triplicate.
Figure 6
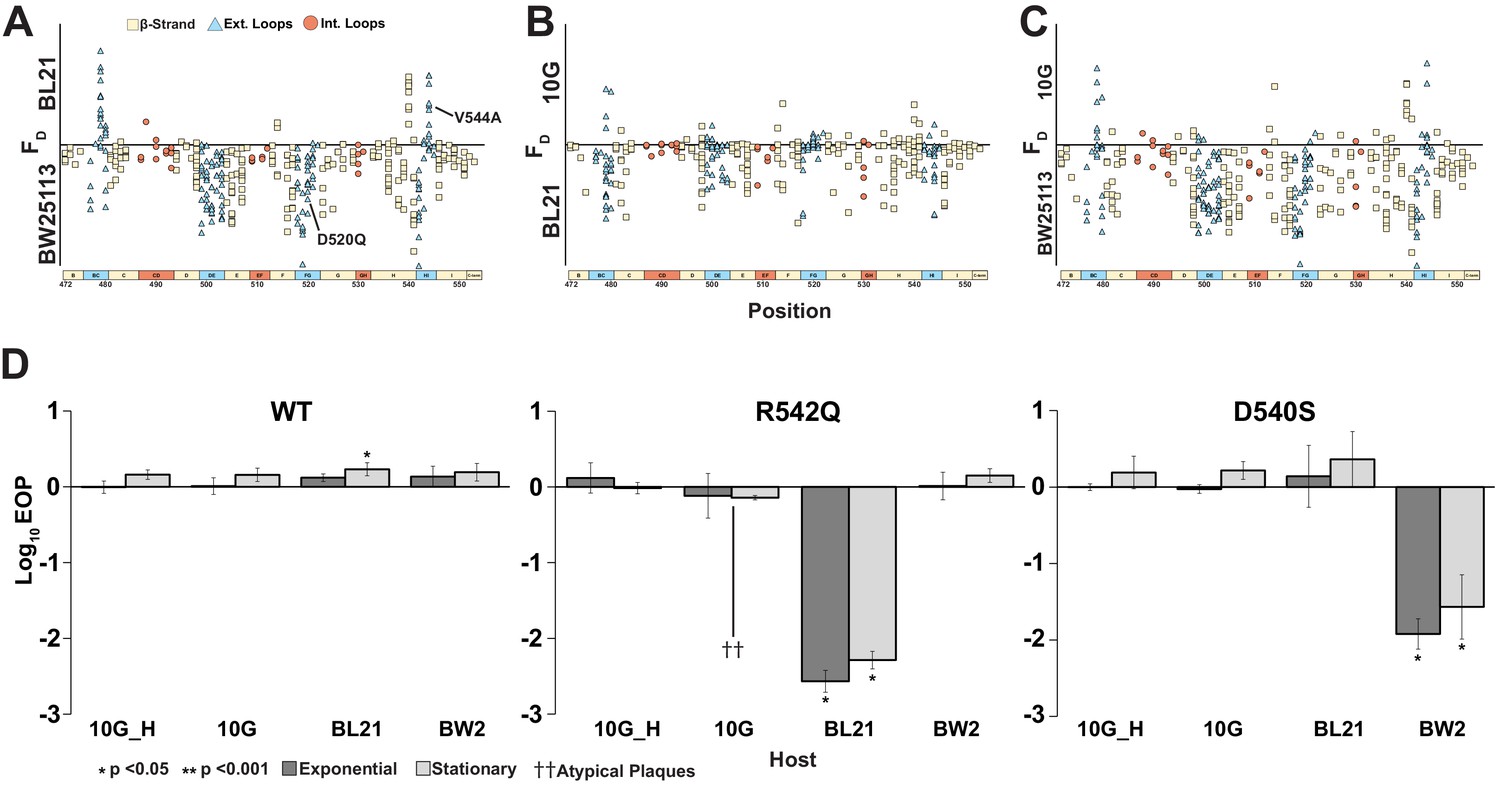
Host range constriction emerges from global comparison across variants.
(A-C) Pairwise comparison of differences in functional scores of variants between hosts (see Methods). Variants above the line favor lysis of host noted above the line, and vice versa for variants below the line. (D) EOP (mean ± SD, biological triplicates) for wildtype T7 and select variants on BW25113, 10G and BL21 in exponential (dark gray) and stationary phases (light gray) using exponential 10G with gp17 tail fiber helper plasmid (10G_H) as a reference host. R542Q plaques are atypically small until EOP ~10-2.
-
Figure 6—source data 1
ΔΔG and FD conversion for all variants.
- https://cdn.elifesciences.org/articles/63775/elife-63775-fig6-data1-v2.xlsx
Tables
Key resources table
| Reagent type (species) or resource | Designation | Source or reference | Identifiers | Additional information |
|---|---|---|---|---|
| Strain, strain background (Escherichia coli) | E. coli 10G | Lucigen | Lucigen:60107-1 | |
| Strain, strain background (Escherichia coli) | E. coli BL21 | ATCC | ATCC:BAA-1025 | |
| Strain, strain background (Escherichia coli) | E. coli 10-beta | NEB | NEB:C3020 | |
| Strain, strain background (Escherichia coli) | E. coli BW25113 | Baba et al., 2006 | BW25113 | |
| Strain, strain background (Escherichia coli) | E. coli BW25113ΔrfaG | Baba et al., 2006 | BW25113ΔrfaG | |
| Strain, strain background (Escherichia coli) | E. coli BW25113 ΔrfaD | Baba et al., 2006 | BW25113 ΔrfaD | |
| Strain, strain background (Escherichia coli) | E. coli UTI473 | Arthur et al., 1990 | UTI473 | |
| Strain, strain background (T7 bacteriophage) | T7 bacteriophage | ATCC | ATCC:BAA-1025-B2 | |
| Strain, strain background (T7 bacteriophage) | T7 bacteriophage variants | This paper | Available on request | DMS variants, available from the Raman lab. |
| Commercial assay or kit | KAPA HiFi PCR Kit | Roche | Roche:KK2101 | |
| Commercial assay or kit | KAPA2G Robust PCR Kit with dNTPS | Roche | Roche:KK5005 | |
| Commercial assay or kit | Golden Gate Assembly Kit (BsaI-HFv2) | NEB | NEB:E1601L | |
| Recombinant DNA reagent | pHT7Helper1 (plasmid) | This paper | Helper with T7 gp17. See Materials and methods for full details. | |
| Recombinant DNA reagent | pHRec1 and derivatives (plasmids) | This paper | Recombination plasmid. See Materials and methods for details. | |
| Recombinant DNA reagent | pHCas9 and derivatives (plasmids) | This paper | Plasmid with Cas9 targeting acceptor phage. See Materials and methods for full details. | |
| Software, algorithm | R scripts for DMS analysis | This paper | N/A | Available here https://github.com/raman-lab/oracle; Huss, 2021; copy archived at swh:1:rev:657e8eef12e4ee886f5d188b745ff0b38f94f479 |
| Software, algorithm | R scripts for physicochemical comparisons | This paper | N/A | Available here https://github.com/raman-lab/oracle. |
| Software, algorithm | R scripts for Rosetta ΔΔG calculations | This paper | N/A | Available here https://github.com/raman-lab/oracle. |
Additional files
-
Supplementary file 1
List of primers used for experimentation.
- https://cdn.elifesciences.org/articles/63775/elife-63775-supp1-v2.xlsx
-
Transparent reporting form
- https://cdn.elifesciences.org/articles/63775/elife-63775-transrepform-v2.docx
Download links
A two-part list of links to download the article, or parts of the article, in various formats.
Downloads (link to download the article as PDF)
Open citations (links to open the citations from this article in various online reference manager services)
Cite this article (links to download the citations from this article in formats compatible with various reference manager tools)
Mapping the functional landscape of the receptor binding domain of T7 bacteriophage by deep mutational scanning
eLife 10:e63775.
https://doi.org/10.7554/eLife.63775


