Intravital deep-tumor single-beam 3-photon, 4-photon, and harmonic microscopy
- Department of Cell Biology, Radboud Institute for Molecular Life Sciences, Radboud University Medical Centre, Netherlands
- Laboratory for Optics & Biosciences École Polytechnique, CNRS, INSERM, France
- LaVision BioTec GmbH, a Miltenyi Biotec company, Germany
- APE Angewandte Physik & Elektronik GmbH, Germany
- Cancer Genomics Centre, Netherlands
- David H. Koch Center for Applied Genitourinary Cancers, The University of Texas MD Anderson Cancer Center, United States
Figures
Figure 1 with 5 supplements
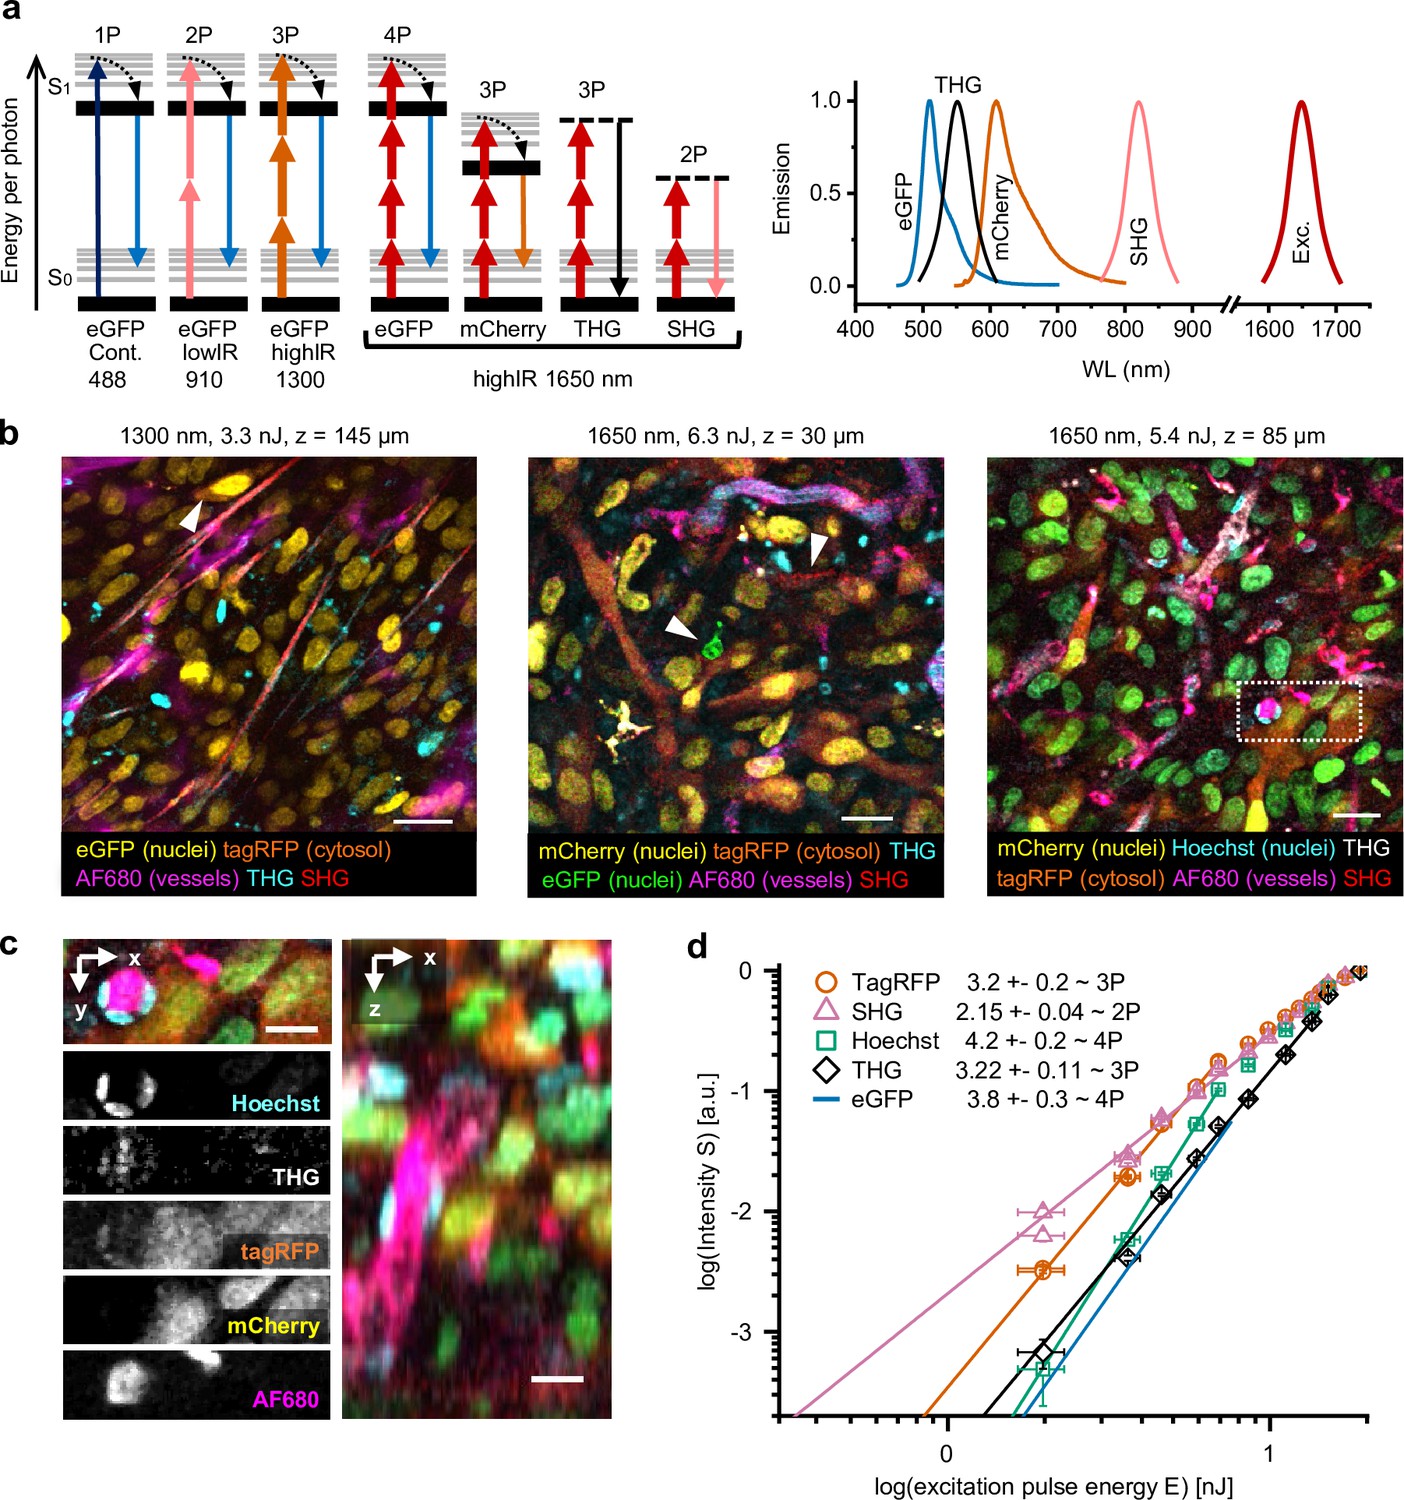
Multimodal microscopy of fluorescent skin tumor xenografts in vivo showing up to four fluorescent and two label-free tissue morphology channels, simultaneously excited with a single highIR wavelength.
(a) Jablonski diagrams (left) and scaled excitation/emission spectra (right) of 1-, 2-, 3-, and 4P-excited fluorescence and higher harmonic generation. Diagram 1–3 (left to right): 1- up to 3P excitation of eGFP with 488 nm continuous, 910 nm lowIR, and 1300 nm highIR, respectively. Diagram 4–7: excitation with 1650 nm results in signals of a distinct emission wavelength, including 4P-excited eGFP. S0 and S1, ground level and first-excited electron state, respectively, with vibrational levels (thin lines). Dashed lines, virtual states. Thin–thick upward arrows: low–high photon density required for excitation. Downward arrows: emission. (b) Five-channel 1300 nm excited (left) and six-channel 1650 nm excited (middle and right) images were taken in the center of fluorescent tumors through a dermis imaging window. Images were selected from median-filtered (one-pixel) z-stacks. The excitation wavelength, calculated pulse energy at the sample surface, and imaging depth z are indicated (top). Cell nuclei containing a mixture of mCherry and Hoechst appear as green (right). Details from images left to right: day-10, day-13, and day-14 tumor; 9.2, 4.5, and 4.4 s image acquisition time; 24, 12, and 12 µs pixel integration time; 0.36, 0.46, and 0.46 µm pixel size. (c) Zoomed xy-plane with individual channels (left) and orthogonal (xz-) projection (right) from (b), dotted rectangle. (d) Relation between measured emissions and excitation energy reveals the order of the excitation processes. Normalized emission intensity () as a function of pulse excitation energy (), for TagRFP, SHG, Hoechst, third harmonic generation (THG), and eGFP recorded with an excitation wavelength of 1650 nm. Data was fitted with S(E) = A⋅En, with the proportional factor and the order of the excitation process (indicated as numbers in the figure). For curve fitting, excitation intensities at the sample surface below the threshold of physical damage (14 nJ) for SHG and THG and up to their saturation limit (7.6 nJ, eGFP; 6.9 nJ, TagRFP and Hoechst) for fluorophores were used. Images were acquired at the same position as panel (a, right), except for the fit line of eGFP, which was retrieved from a different dataset (Figure 1—figure supplement 4). Bars, 25 µm (b); 12.5 µm (c). Source data files: Figure 1—source data 1 and Figure 1-source data 2.
-
Figure 1—source data 1
Numerical data, calculations and templates used to generate graph panels.
- https://cdn.elifesciences.org/articles/63776/elife-63776-fig1-data1-v1.zip
Figure 1—figure supplement 1
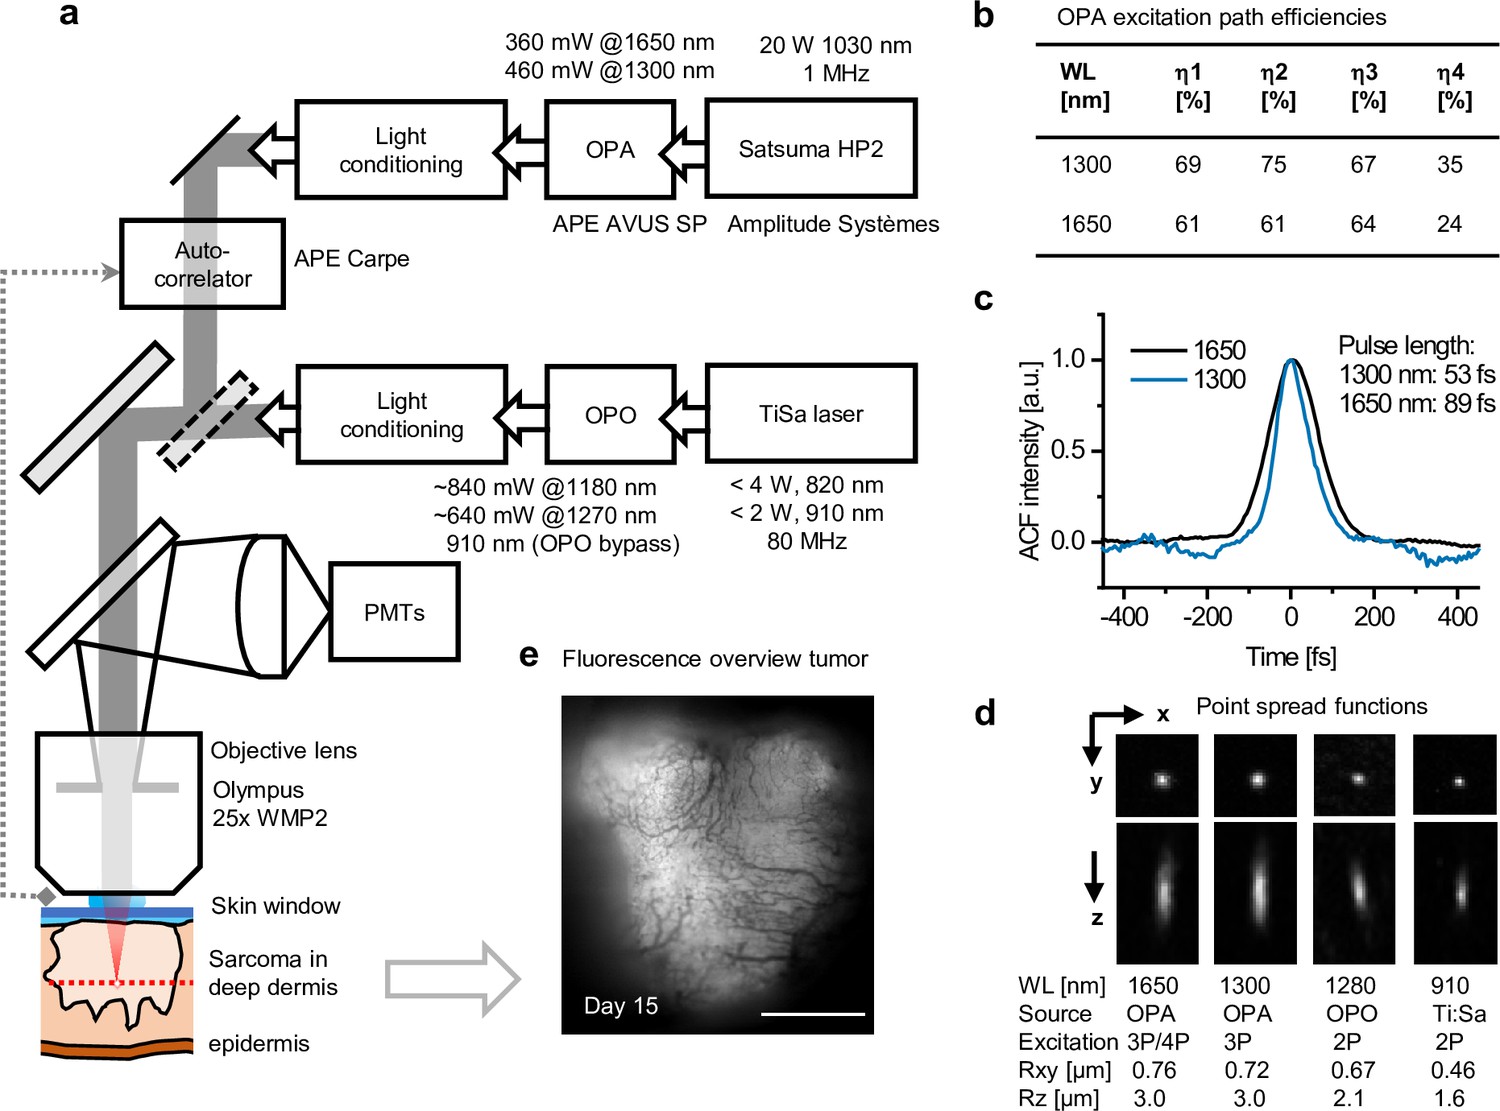
Microscope setup and excitation parameters.
(a) Simplified schematics of the setup. Main stages in the excitation path (boxes right to left) including pump laser, optical parametric amplifier (OPA) or optical parametric oscillator (OPO), and light conditioning elements. A switchable mirror for selecting OPA or OPO excitation (diagonal dotted box), scanhead (diagonal light gray box), autocorrelator with external detector (dotted line), emission path, detectors (PMTs), objective lens, and sample are shown. Light conditioning: pulse compression, attenuation, and beam expansion for overfilling of the objective. (b) OPA excitation path efficiencies at 1300 and 1650 nm: η1, light conditioning; η2, scanhead; η3, objective lens; η4, complete path. (c) Autocorrelation plots of OPA excitation pulses measured under the objective. Pulse lengths were estimated assuming a Sech2 intensity profile. (d) Orthogonal and lateral point spread function images of multicolor fluorescent beads acquired with lowIR and highIR excitations. The order of the excitation process was predicted from the fluorescence absorption and emission spectrum of the bead in comparison to the 2- and 3-photon absorption spectra of other, known fluorophores (Hontani et al., 2021; Drobizhev et al., 2011). Average lateral (Rxy) and axial (Rz) resolution values and errors were derived over 13, 51, 7, and 67 beads, respectively. (e) Epi fluorescence overview image of the tumor, made prior to multiphoton measurements used for Figure 3. Fluorescence: TagRFP and eGFP; contrast: blood vessels. Bar: 1 mm. Source data files: Figure 1—source data 2.
Figure 1—figure supplement 2
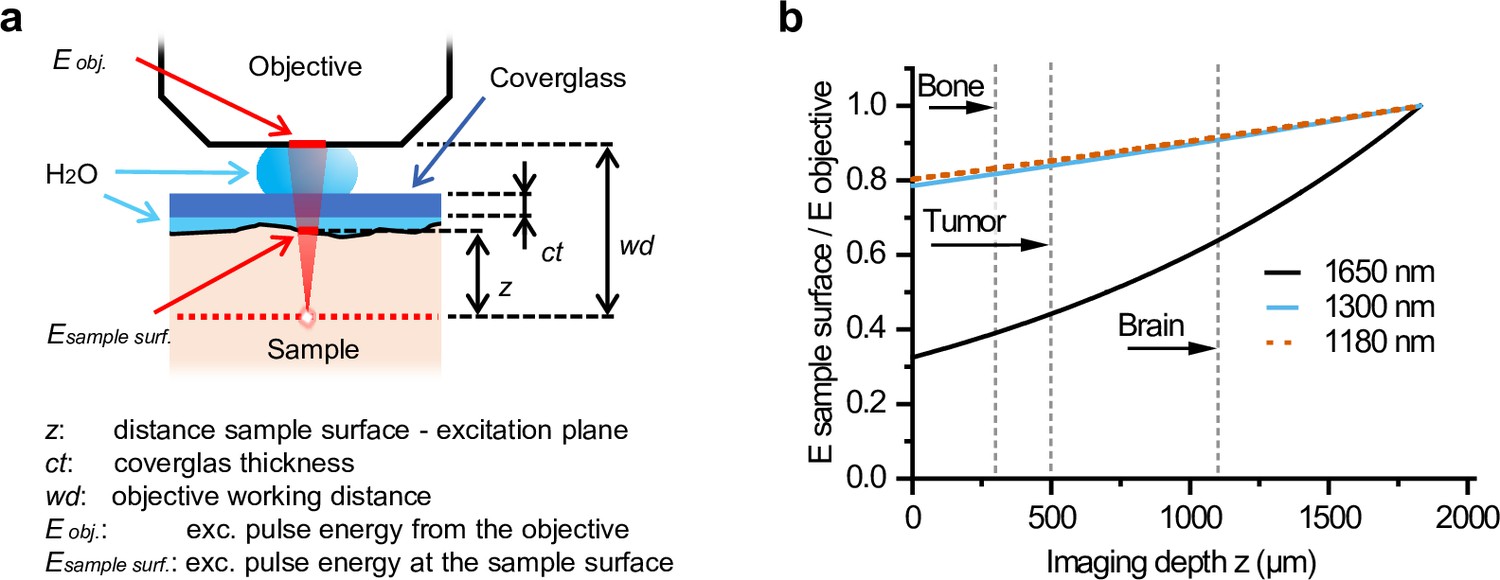
Attenuation of excitation energy at the sample surface by water immersion.
(a) The relation between Esample surface /Eobjective and z is given by Esample surface /Eobjective (z) = e α(z – ct + wd), where α is the water absorption at the given wavelength, which was 6.14, 1.32, 1.2, and 0.07 cm–1 at 1650, 1300, 1200, and 900 nm, respectively (Qiu et al., 2017; Wang et al., 2016; Nachabé et al., 2010). (b) Relative attenuation of excitation light of different wavelengths by water immersion in between the sample and the objective (Esample surface/Eobjective) as a function of imaging depth (z). Maximum imaging depth is indicated for bone, tumor, and brain tissue (dashed lines). Source data files: Figure 1—source data 1.
Figure 1—figure supplement 3
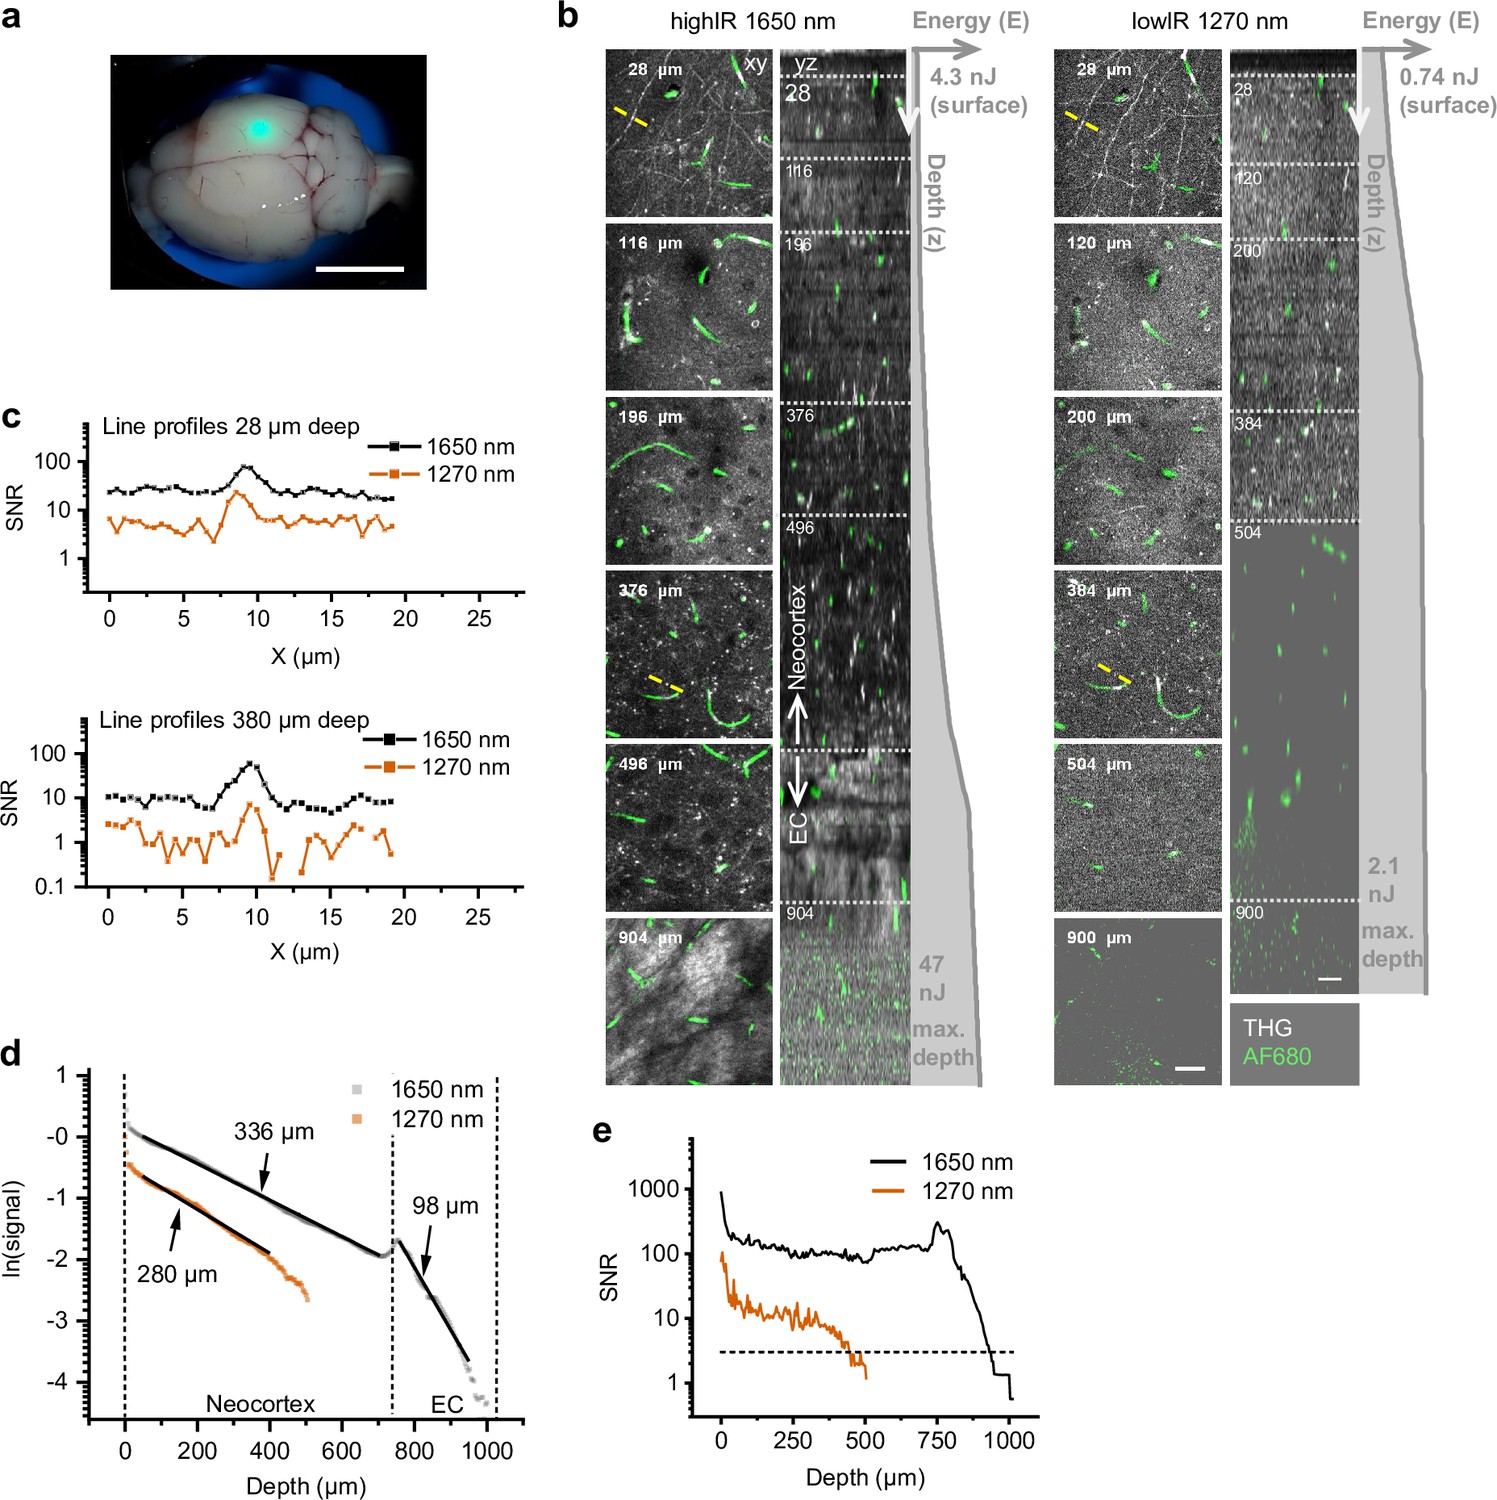
Third harmonic generation (THG) and 3-photon-excited fluorescence (3PE) microscopy of the mouse neocortex and external capsule (EC), excited with highIR and lowIR excitation, ex vivo.
Bar: 5 mm. (a) Brain with coverglass and immersion liquid for multiphoton imaging. Green spot (focused epi-excitation): position of the multiphoton imaging area, above the hippocampus. (b) Orthogonal (yz-) views of THG and fluorescently labeled vessels (AlexaFluor680-dextran) excited with 1650 nm highIR (left) or 1270 nm lowIR (right). Gray profiles indicate pulse energy E at the sample surface as a function of imaging depth z. Left, representative contrast enhanced xy-images at different depths, represented by the dotted horizontal lines in the yz-views. Specifications: 12–71 µs pixel integration time, 2–12 s/frame, 0.50 µm pixel size, 4 µm z-step size. Detailed imaging settings: Supplementary file 1c. Bar: 25 µm. (c) Signal-to-noise ratio (SNR) derived from THG intensity line profiles drawn over myelinated neuronal features at different depths (panel (b), yellow lines). (d) Signal attenuation as a function of imaging depth for applied excitation wavelengths. The THG intensities derived from (b) were normalized for representation (see Materials and methods). Effective attenuation lengths le (indicated as numbers) were derived for neocortex and external capsule (EC) layers (black lines). (e) SNR as a function of imaging depth, derived from the image data shown in panel (b). Horizontal dotted line: detection limit (SNR = 3). Vertical dotted lines: SNR-derived depth limit. Source data files: Figure 1—source data 1 and Figure 1—source data 2.
Figure 1—figure supplement 4
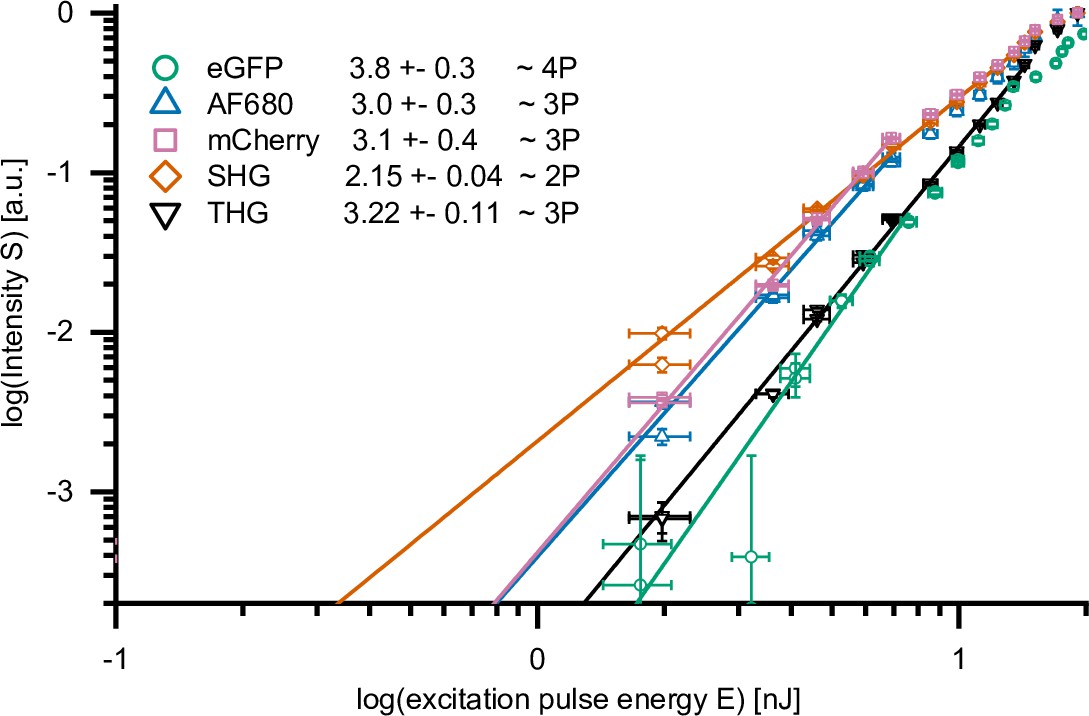
Two-, 3-, and 4-photon processes excited by 1650 nm highIR excitation.
Normalized emission intensity (S)as a function of excitation energy at the sample surface (E), for eGFP, AF680, mCherry, second harmonic generation (SHG), and third harmonic generation (THG), recorded with an excitation wavelength of 1650 nm. Data was fitted with S(E) = A⋅E n, with A the proportional factor and n the order of the excitation process. Maximum excitation pulse energy E used for fitting of SHG and THG was below the threshold of physical damage (14 nJ) and up to the saturation limit for fluorophores (7.6 nJ, eGFP; 6.9 nJ, AF680 and mCherry). AF680, mCherry, SHG, and THG were acquired during the measurement described in Figure 1c. For eGFP, S(E) was derived from 30 images, retrieved from live imaging of human fibrosarcoma spheroids in rattail collagen. Source data files: Figure 1—source data 1, Figure 1—source data 2, Source data 1 and Source data 2.
Figure 1—video 1
Single-beam 3-photon, 4-photon, and harmonic microscopy of fluorescent tumor xenograft in vivo, excited with 1650 nm.
Rotation of 3D image stack corresponding to Figure 1c. Stack size: 198 × 198 × 133 µm3. Source data files: Figure 1—source data 2.
Figure 2 with 4 supplements
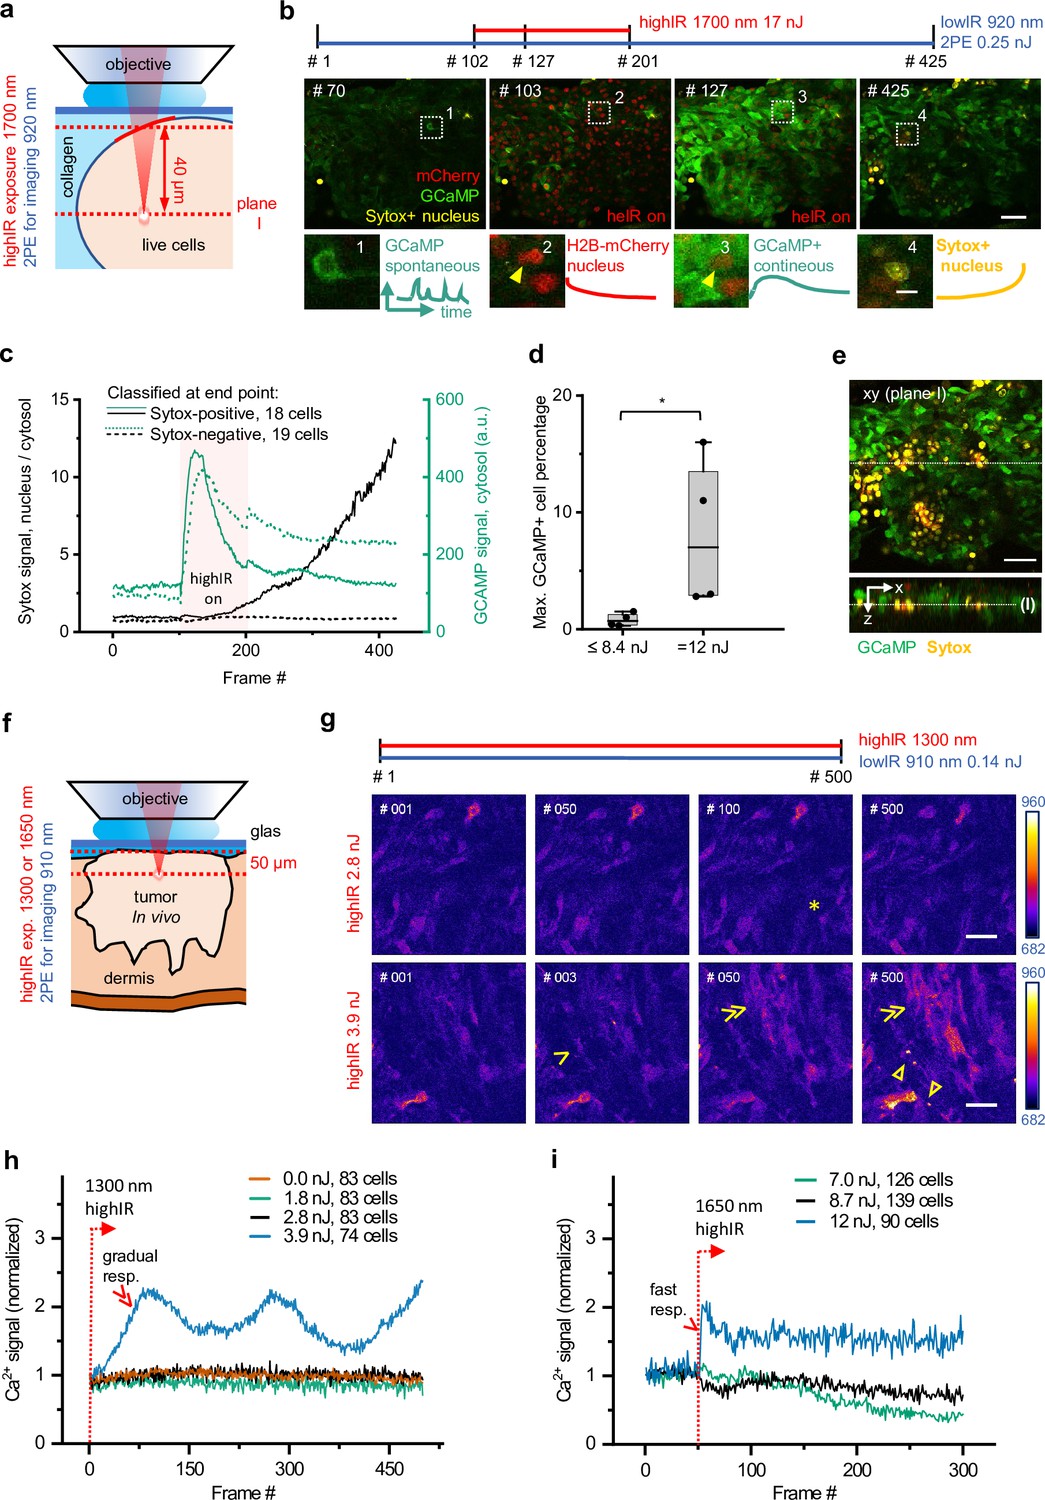
Phototoxicity and interference with biological function induced by continuous scanning with highIR excitation.
(a) Experimental approach for cell viability detection in vitro. B16F10/GCaMP6/H2B.mCherry (Chen et al., 2013) melanoma tumoroid embedded in 3D collagen was monitored through a coverglass. Sytox Green was supplemented to the medium. Both GCaMP and Sytox signals were continuously monitored (3.3 s/frame, 6 µs pixel integration time) at ~40 µm penetration depth using low pulse-energy excitation (920 nm). During part of the measurement, the sample was simultaneously exposed to 1700 nm highIR excitation, approximately at the same focal plane (I). ( b) Representative frames from continuous scanning with the indicated excitation pulse energy and detection of emitted signals. Details from dotted squares: (1) spontaneous reversible Ca2+ activity (green); (2) highIR-excited fading mCherry signal from the nuclei (red); (3) strong highIR-induced Ca2+ response in the majority of the cells and bleached, decreasing mCherry signal; and (4) Sytox-positive nucleus (yellow). (c) Intensity curves of Sytox (black, left y-axis) and GCaMP (turquoise, right y-axis) signals in cells developing Sytox-positive nuclei (solid lines) or not (dashed lines), classified at the endpoint by eye (frame #425). Data show the mean intensity of single-cell intensities. For technical details, see Figure 2—figure supplement 1a and b. (d) Predictive power of GCaMP positivity for photodamage. The highIR-induced percentage of GCaMP-positive cells was quantified over time for moderate- (≤8.4 nJ; ~1220 cells from n = 4 measurements) and high-exposure (12 nJ; ~720 cells from n = 4 measurements) conditions. *, p = 0.03, Mann-Whitney test. Data indicate the median (line), 25/75 percentile (box) and 5/95 percentile (whiskers). (e) Spatial restriction of GCaMP and Sytox positivity to excitation plane (I). A z-stack of 80 µm depth (5 µm step size) was taken 15 min after the endpoint of highIR exposure shown in (b). Above: xy-image at the highIR exposure plane I. Below: xz-sideview positioned at the line in the xy-image. Line in sideview: excitation plane I. (f) Detection of phototoxicity of highIR in vivo. Intradermal tumor imaged after 6 (1650 nm) or 11 days (1300 nm) of growth. GCaMP signal was continuously monitored (~1.5 s/frame, 6 µs pixel integration time) in an ~50 µm deep focal plane using lowIR excitation (910 nm). The sample was simultaneously exposed to highIR excitation at the same focal plane. (g) Ca2+ signaling in individual cells. Representative frames from the 1300 nm highIR exposure time-series at pulse energies at the sample surface below (2.8 nJ), or above (3.9 nJ) the toxicity threshold. Asterisk, spontaneous, reversible Ca2+ signal in single cell, as seen in ~10 of 83 cells in the field of view. Arrowhead, persistent Ca2+ signal starting at frame #2, as seen in 8 of 74 cells. Double arrowheads, multiple cells developing increasing Ca2+ signal, present in 45 of 74 cells. Closed arrowheads, burning marks. The frame number is indicated. (h, i) Ca2+ signal as a function of time for increasing highIR pulse energies at the sample surface, recorded with an excitation wavelength of 1300 nm (h) or 1650 nm (i). Single and double arrowheads: steep and gradual Ca2+ rise, respectively, related to cell populations as described in (g). Emission signal was retrieved after averaging over the image area, background subtraction and normalization to the first highIR-excited frame (#1, 1300 nm and #50, 1650 nm, dotted lines). The number of cells per field is indicated. Bars: 50 µm, 10 µm (details). Source data files: Figure 2—source data 1 and Figure 2-source data 2.
-
Figure 2—source code 1
Conversion of fiji manual tracking data into intensity-time traces.
- https://cdn.elifesciences.org/articles/63776/elife-63776-fig2-code1-v1.zip
-
Figure 2—source code 2
Raw microscopy image files, intermediate and analysis results.
- https://cdn.elifesciences.org/articles/63776/elife-63776-fig2-code2-v1.zip
-
Figure 2—source code 3
Retrieve cell fraction responding upon highIR exposure as a function of time.
- https://cdn.elifesciences.org/articles/63776/elife-63776-fig2-code3-v1.zip
-
Figure 2—source code 4
Retrieve cell fraction responding upon highIR exposure as a function of imaging depth.
- https://cdn.elifesciences.org/articles/63776/elife-63776-fig2-code4-v1.zip
-
Figure 2—source data 1
Numerical data, calculations and templates used to generate graph panels.
- https://cdn.elifesciences.org/articles/63776/elife-63776-fig2-data1-v1.zip
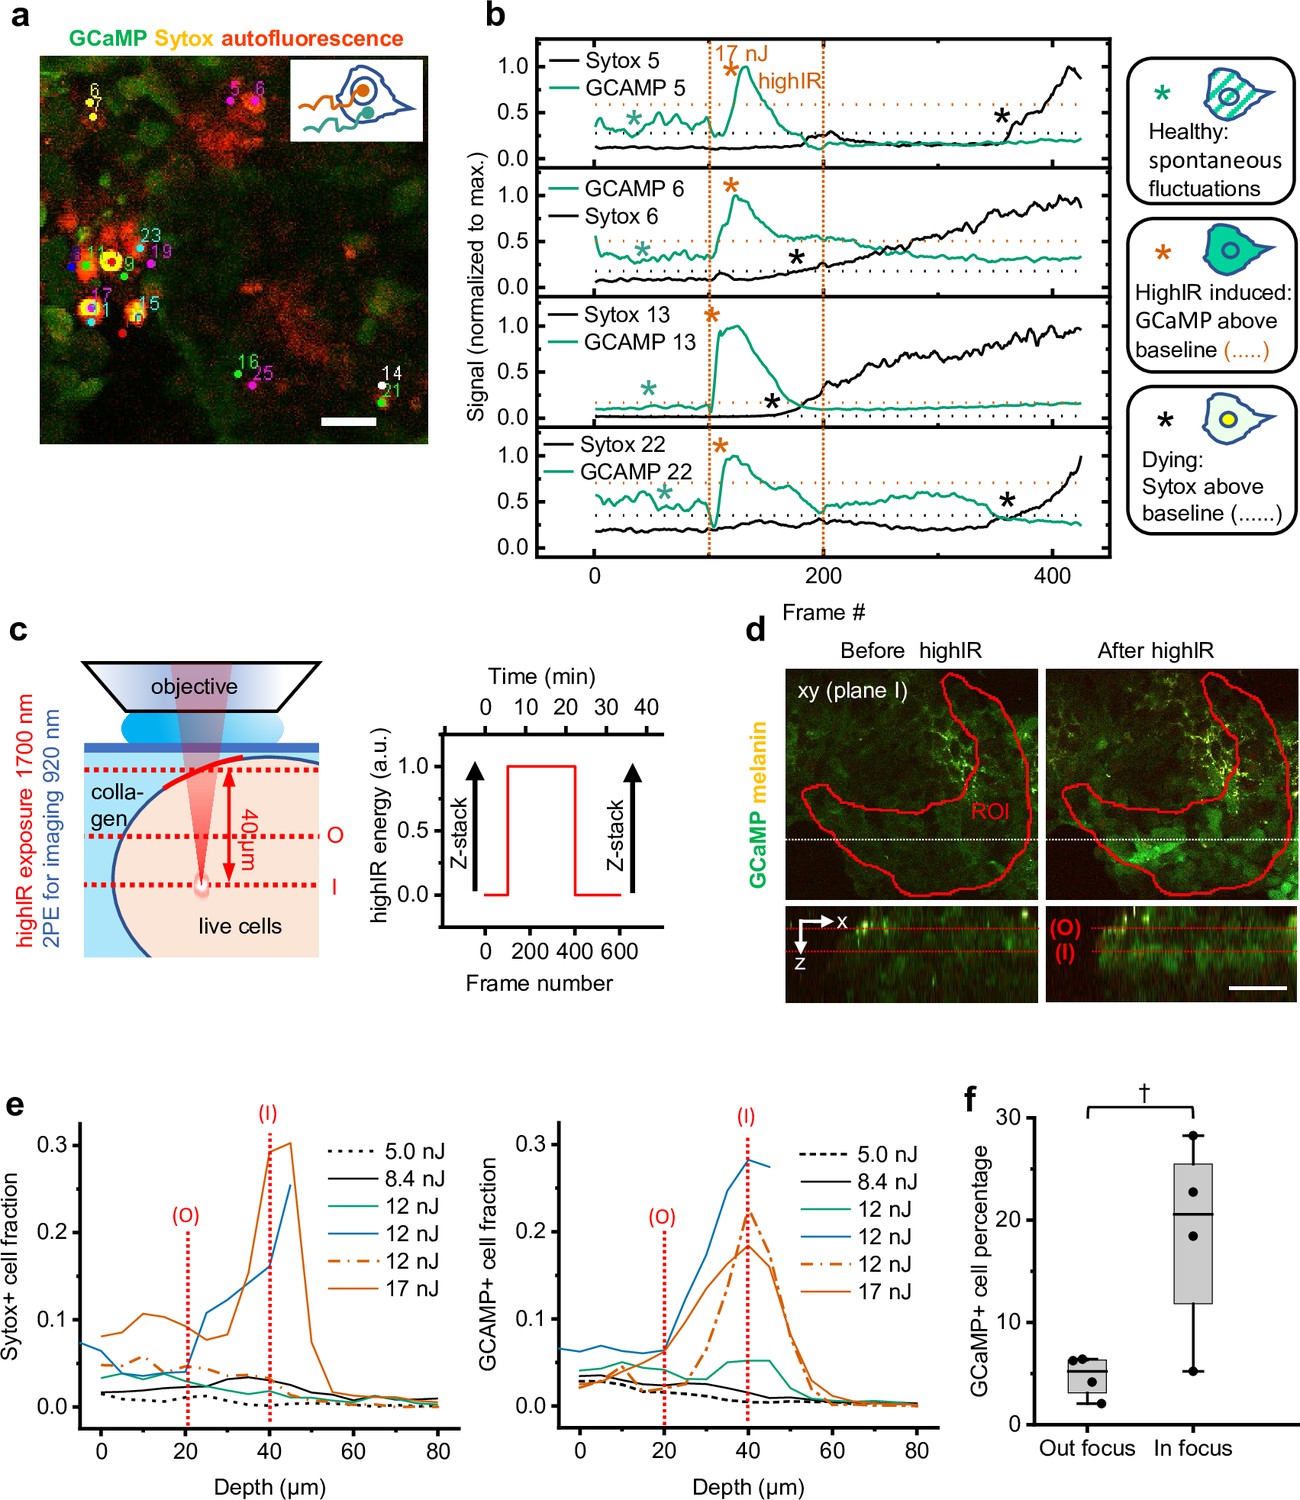
Figure 2—figure supplement 1
Methodological strategy of cell viability measurements in vitro.
(a) Image area with Sytox-positive cells selected for manual tracking. Individual Sytox-positive cells determined by visual inspection at the endpoint (frame #425; Figure 2b) were tracked manually to obtain intensity-time traces from the nucleus (combination of Sytox and GCaMP) and cytosol (GCaMP). The nucleus signal was divided by the cytosol signal to obtain ratiometric Sytox intensity-time traces. (b) Typical single-cell Ca2+ (GCaMP) and Sytox responses upon highIR exposure with a strongly toxic pulse energy (17 nJ). Horizontal dotted lines: thresholds to define the moment of onset from which cells are classified as Sytox-positive (red star) or GCaMP-positive (black star) (p = 0.001, one-tailed z-test). Green star: spontaneous reversible Ca2+ fluctuations. Vertical dotted lines: highIR exposure window. (c) Experimental approach to study the spatial and temporal dependency of highIR-induced responses of cell viability reporters. Image quantification was performed within the red marked region of interest on the tumoroid (ROI), where the highIR exposure focal depth in the tumoroid was 40±10 µm (left). Z-stacks of 80 µm depth and 5 µm step size were recorded before and 15 min after the endpoint of highIR exposure, at the same position as the time-lapse recordings (right). Dotted lines: highIR exposure and time-lapse recording focal plane (I); 20 µm higher highIR exposure out-of-focus plane (O). ( d) Spatial restriction of highIR-induced GCaMP positivity to cells in plane I (as defined in c). Xy-images at plane I (above) and xz-sideviews (below) from stacks taken before (left) and after highIR exposure (right). Xz-sideviews were taken at the position of the dotted line in the xy-image. Lines in sideview: planes I and O (as defined in c). ROI: according to definition in (c). (e) HighIR-induced Sytox (left) and GCaMP (right) responses show spatial restriction and highIR-energy dependence. The highIR-induced fractions of positive cells as a function of imaging depth were quantified from z-stacks before (except for 17 nJ measurement) and after highIR exposure within the ROI as defined in (c). Vertical dotted lines: imaging planes O and I (as defined in c). (f) Comparison of GCaMP responses at imaging planes I and O shown in (e) indicate spatial restriction of highIR-induced GCaMP positivity to the highIR focal plane (~1600 cells from n = 4 paired measurements at both planes, 12–17 nJ highIR exposure). †, p = 0.05, Wilcoxon signed rank test. Data indicate the median (line), 25/75 percentile (box), and 5/95 percentile (whiskers). Source data files: Figure 2—source data 1 and Figure 2—source data 2.
Figure 2—figure supplement 2
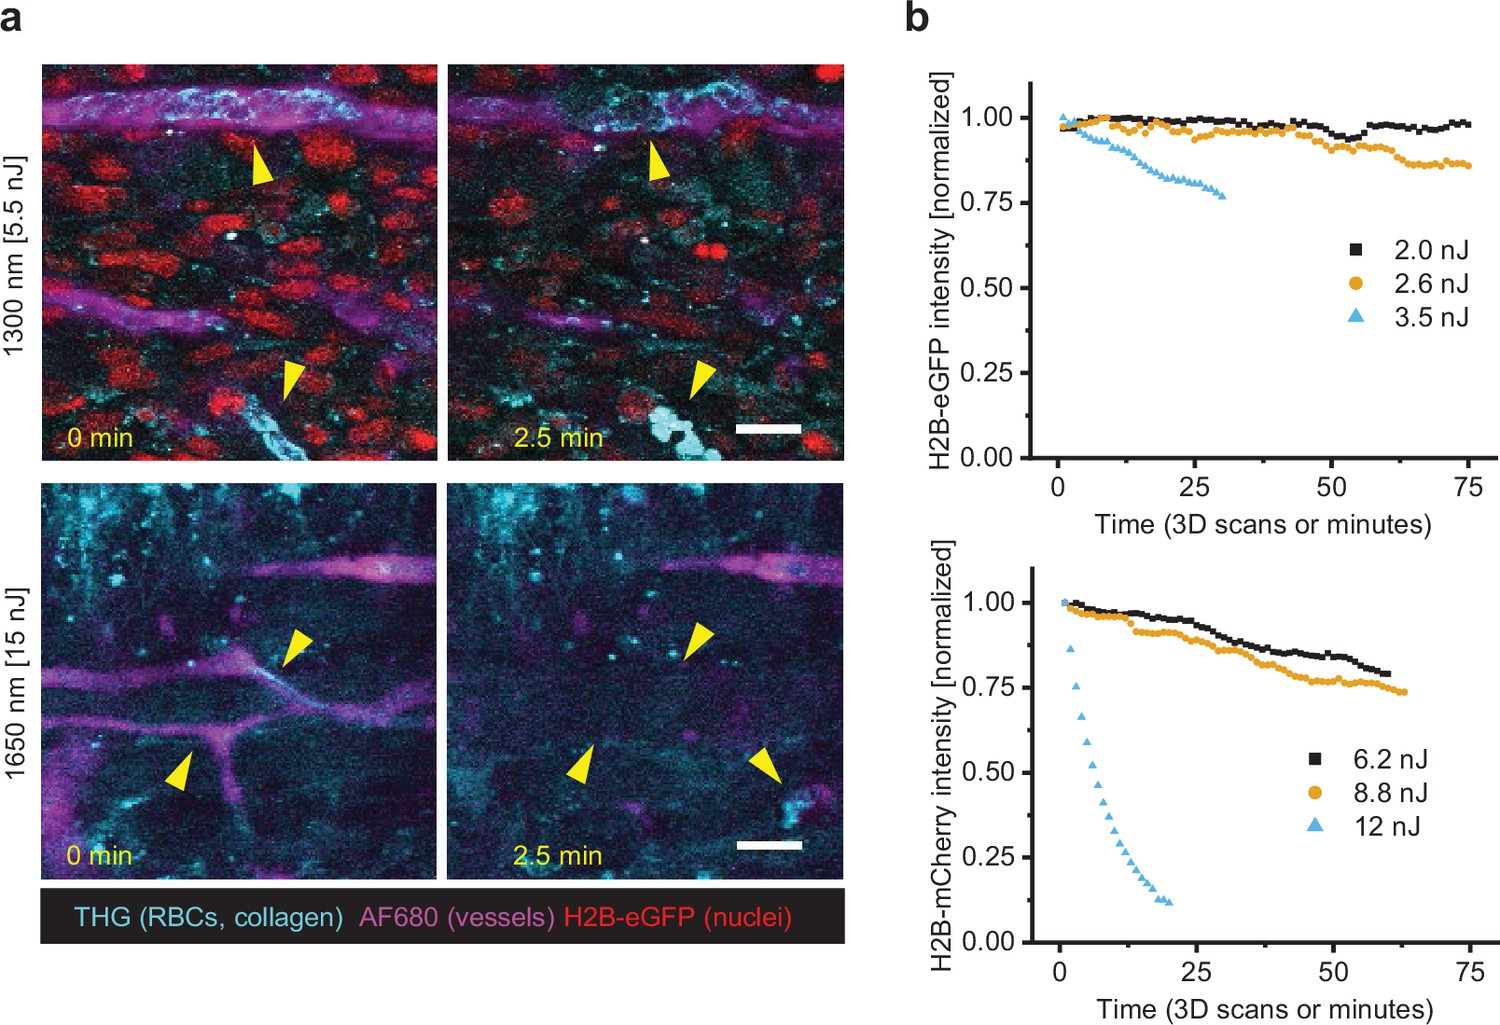
Scanning-induced fluorophore bleaching and stasis of vascular perfusion.
(a) Stasis of blood flow in tumor vessels upon 2.5 min of continuous highIR imaging above the functional toxicity threshold. Arrowheads left (0 min): flowing erythrocytes in vessels (third harmonic generation [THG], stripes and diagonal features), blood vessel labeling (AF680). Arrowheads right (2.5 min): arrested or absent erythrocytes in vessels (THG, round features), blood vessel labeling disappeared. First signs of stasis were observed after 51 or 42 s (respectively 1300 or 1650 nm, not shown). Specifications: 2 µs pixel integration time, 0.82 µm pixel size, 0.182 s/frame. Fibrosarcoma after 10 days of growth (upper images), melanoma after 6 days of growth (lower images). Bar: 25 µm. (b) Bleaching curves of H2B-eGFP (above, 1300 nm excitation) and H2B-mCherry (below, 1650 nm excitation), retrieved from 3D live-cell imaging of human fibrosarcoma spheroids in rattail collagen. Specifications: 0.53 µm pixel size, 5 µm z-step size, 6 µs pixel integration time, 2.3 s per frame, and 1 min per stack (11–16 images). Bar: 25 µm. Source data files: Figure 2—source data 1 and Figure 2—source data 2.
Figure 2—video 1
Phototoxicity and interference with biological function induced by 1300 nm highIR excitation, in vivo.
The experimental setup, time-course of 500 frames, and dose increase correspond to Figure 2f–h. Time-lapse recordings were interrupted upon onset of severe tissue damage, which occurred at the highest highIR doses (5.1 and 5.9 nJ). Arrowheads, onset of Ca2+ signaling; closed arrowheads, burning marks. Please note that the signal reflecting the cellular calcium intensity under baseline conditions varied with altered position and excitation conditions. Therefore, for data analysis, changes of calcium intensity were normalized to the signal of the first frame. Bar: 50 µm. Source data file: Figure 2-source data 2.
Figure 2—video 2
Phototoxicity and interference with biological function induced by 1650 nm highIR excitation, in vivo.
The experimental setup, time-course of 300 frames, and dose increase corresponds to Figure 2f and i. Arrowheads, onset of Ca2+ signaling; closed arrowhead, burning marks. Please note that the signal reflecting the cellular calcium intensity under baseline conditions varied with altered position and excitation conditions. Therefore, for data analysis, changes of calcium intensity were normalized to the signal of the first highIR-excited frame. Bar: 50 µm. Source data file: Figure 2-source data 2.
Figure 3

Tissue penetration of 2- (2P), 3- (3P), and 4-photon (4P) microscopy in tumors in vivo.
After 15 days growth, an intradermal HT-1080 sarcoma tumor expressing eGFP and TagRFP was repetitively imaged with highIR and lowIR excitation to compare tissue penetration of the respective excitation modalities. (a) Orthogonal (yz-) views of fluorescent tumor excited at 1650 nm (3PE and 4PE), 1300 nm (3PE), and 1180 nm (2PE). Z-stacks were recorded with increasing excitation pulse energy E at the sample surface with increasing imaging depth z (gray profiles right from orthogonal views). Left, representative (contrast enhanced xy-) images at different depths, represented by the dotted horizontal lines in the yz-views. Details from images: 2.2 s frame time, 20 µs pixel integration time. Numbers: depth in µm. Bar: 25 µm. (b) HighIR excitation enables simultaneous multiparameter microscopy up to 350 µm depth, in contrast to lowIR multiparameter microscopy. Images were processed (median filtered, 1 pixel). Bar: 25 µm. (c) Signal-to-noise ratio (SNR) of highIR- versus lowIR-excited fluorescent signals as a function of imaging depth, derived from the images shown in (a). Horizontal dotted line: detection limit (SNR = 3). (d) Axial resolution of the fluorescence signals derived for three depth ranges of the images in panel (a). The steepness of the transition between the normalized intensity of a fluorescent feature and its nonfluorescent surrounding along the z-direction ((δI/δz)max) was taken as a measure for resolution. For each depth range, the median and standard deviation were calculated over 11–17 fluorescent features per channel. (e) Attenuation of fluorescence signals for applied excitation wavelengths. The 3P-excited fluorescence intensities derived from (a) were normalized to the cubic of the calculated laser power at the sample surface and to the order of the excitation process to obtain normalized signal S, and plotted as a function of imaging depth (see Materials and methods). For 3PE, the effective attenuation length le of the tissue was defined as the depth at which fluorescence intensities attenuate by 1/e3, where e is Euler’s number (Wang et al., 2018b). le (indicated as numbers) were derived from single exponential decay functions (black lines) fitted to the normalized data. Source data files: Figure 3—source data 1 and Figure 3—source data 2.
-
Figure 3—source code 1
Derive relative resolution based on fiji intensity-z-profiles.
- https://cdn.elifesciences.org/articles/63776/elife-63776-fig3-code1-v1.zip
-
Figure 3—source data 1
Numerical data, calculations and templates used to generate graph panels.
- https://cdn.elifesciences.org/articles/63776/elife-63776-fig3-data1-v1.zip
Figure 4

Tissue penetration of highIR- and lowIR-excited third harmonic generation (THG) microscopy in tumor and bone.
(a) THG microscopy in the tumor. THG images were registered simultaneously with the modalities presented in Figure 3a. The xy-images represent the intersections in the yz-images (dotted lines). Arrowheads: collagen fibers (top xy-images), tumor cell nuclei (1300 nm xy-images). Numbers: depth in µm. Bar: 25 µm. (b) Signal-to-noise ratio (SNR) as a function of imaging depth, derived from the data shown in panel (a). Horizontal dotted line: detection limit (SNR = 3). Vertical dotted lines: SNR-derived depth limit. (c) THG microscopy of ex vivo bone scaffold. Arrowheads: canaliculi (105 µm), channels (165 µm), and sheets of trabecular bone (220 µm). Excitation pulse energy, increasing from sample surface with imaging depth to the maximum: 4.6–32 nJ (left, 1650 nm highIR), 1.3–30 nJ (middle, 1300 nm highIR), and 1.1–1.9 nJ (right, 1270 nm lowIR). Details from images: 2.3 s frame time, 6 µs pixel integration time, 5 µm z-step size. Bars: 25 µm. (d) SNR as a function of imaging depth, derived from the image data shown in panel (c). Horizontal dotted line: detection limit (SNR = 3). Vertical dotted lines: SNR-derived depth limit. (e) Attenuation of THG signals from the bone as a function of imaging depth. The signals derived from (c) were normalized (see Materials and methods) and effective attenuation lengths le (indicated as numbers) were derived for cortical and trabecular bone layers (black lines). Source data files: Figure 4—source data 1 and Figure 4—source data 2.
-
Figure 4—source data 1
Numerical data, calculations and templates used to generate graph panels.
- https://cdn.elifesciences.org/articles/63776/elife-63776-fig4-data1-v1.zip
Figure 5
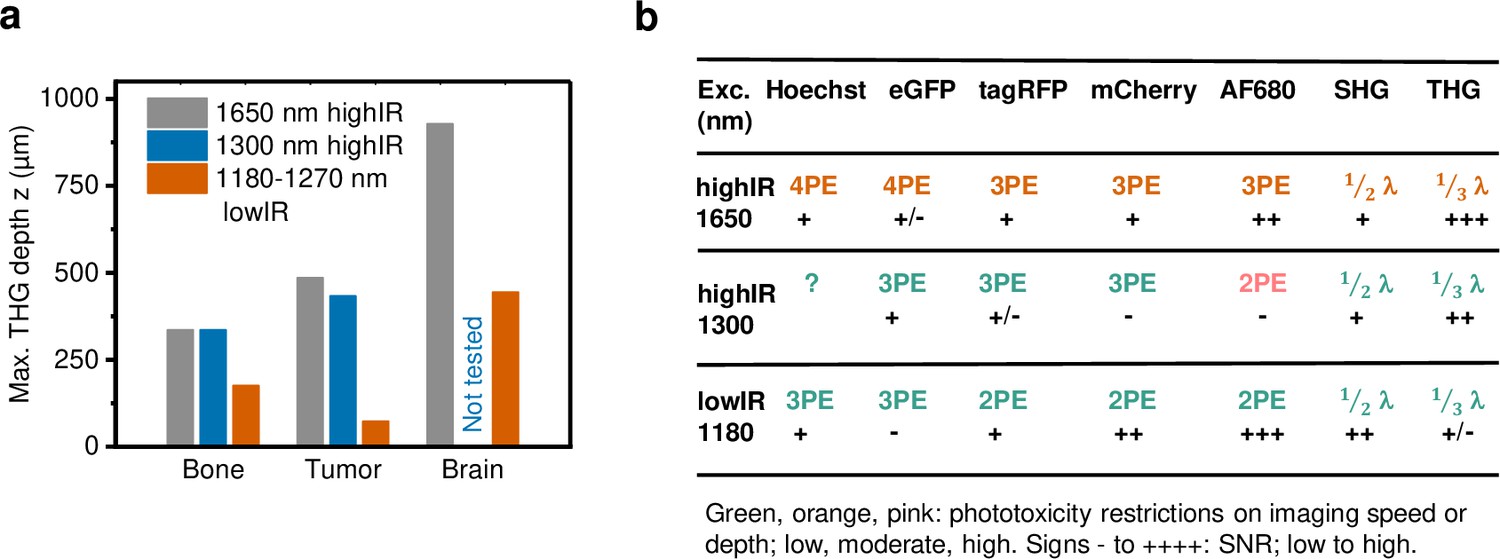
Performance comparison of 2P, 3P, and 4P processes excited by highIR versus lowIR.
(a) Third harmonic generation (THG) imaging depth limit in hard to soft tissues based on the signal-to-noise ratio (SNR) detection limit. Maximum imaging depth was derived from the SNR curves presented in Figures 3c, 4b and d and Figure 1—figure supplement 3d. (b) Summary of applicability of 2PE, 3PE, and 4PE of different fluorophores, based on signal strength and the required restrictions on imaging parameters to avoid phototoxicity. For each fluorophore multiphoton process (2-, 3-, or 4PE), the SNR performance and the severity of restrictions on imaging parameters to avoid phototoxicity are indicated. For THG and SHG, the emission wavelength (fraction of excitation wavelength λ) and the amount of signal are indicated. Source data files: Figure 3—source data 1 and Figure 4—source data 1.
Tables
Key resources table
| Reagent type (species) or resource | Designation | Source or reference | Identifiers | Additional information |
|---|---|---|---|---|
| Strain, strain background (murine, male) | C57Bl/6J WT | Charles River, Germany | C57Bl/6J WT | 8 to 24 weeks of age |
| Strain, strain background (murine, male) | BALB/c CAnN.Cg-Foxn1nu | Charles River, Germany | BALB/c CAnN.Cg-Foxn1nu | 8 to 24 weeks of age |
| Cell line (murine) | B16F10 | ATCC, VA | RRID:CVCL_0159 | |
| Cell line (Homo sapiens) | HT1080 | DSMZ, Braunschweig, Germany | RRID:CVCL_0317, ACC315 | |
| Transfected construct (Rattus norvegicus) | GCaMP6s | https://doi.org/10.1038/nature12354 | RRID:Addgene_40753 | Chen et al., 2013 |
| Biological sample (Rattus) | Collagen I solution | Corning, NY | REF 354249 | Final concentration 4 mg/ml |
| Chemical compound, drug | Dextran70-AlexaFluor680 | Invitrogen, CA | C29808 | 20–100 µl, 20 mg/ml in saline |
| Chemical compound, drug | Hoechst 33342 | Sigma-Aldrich | 14533 | 1.1 mg in milliQ |
| Chemical compound, drug | Sytox Green | Thermo Fisher, Waltham, MA | S7020 | 5 mM |
| Software, algorithm | Origin 2019 | OriginLab Corporation, MA | RRID:SCR_002815 | https://www.originlab.com/viewer/ |
| Software, algorithm | Fiji/ImageJ | https://doi.org/10.1038/nmeth.2019 | version 1.52n | https://imagej.net/software/fiji/ Schindelin et al., 2012 |
| Software, algorithm | Matlab | Mathworks | R2017b | https://www.mathworks.com |
| Other | 25 × 1.05 NA water immersion objective lens | Olympus, Tokyo, Japan | XLPLN25XWMP2 | |
| Other | 0.2 µm multicolor beads | Polysciences Inc, PA | Cat. 24050 | FluoresBrite 0.2 µm |
Additional files
-
Supplementary file 1
Supplementary tables.
(a) Comparison of parameters related to linear, lowIR, and highIR excitation modalities.The listed parameters are derived from experiments described in this paper, unless stated otherwise. Peak power focus is defined as the maximum excitation power in the focus during the laser pulse. Power surface is defined as the average excitation power at the sample surface calculated from the power under the objective and the water absorption (Figure 1—figure supplement 2). Emission I(E): dependence of emission intensity on excitation energy. Attenuation of light, confocal: very high, both excitation and detected emission (only ballistic photons from the focus pass the pinhole in the emission path) are strongly attenuated by the relatively short effective attenuation length for visible-range excitation (Helmchen and Denk, 2005; Benninger and Piston, 2013). LowIR: less attenuation as compared to visible excitation wavelengths; non-de-scanned detection improves emission detection (Centonze and White, 1998). HighIR: equal to less attenuation as compared to lowIR excitation. Water absorption: contribution of water absorption to the attenuation of excitation light (Qiu et al., 2017; Nachabé et al., 2010; Wang et al., 2016). (b) Order of the excitation processes (n) from emission intensity as a function of excitation energy (related to Figure 1). Data were derived from datasets described in Figure 1 and Figure 1—figure supplement 4. Additional independent measurements obtained by live imaging of multicellular HT1080 spheroids in rattail collagen included 1300 nm highIR excitation of eGFP, TagRFP, SHG, and THG and 1650 nm highIR excitation of TagRFP and mCherry at 0.5 and 1 MHz repetition rates. For fitting of data with 1300 nm excitation, the threshold for physical damage was 16 nJ and the saturation limit was 3.1 nJ for eGFP and TagRFP. Source data files: Figure 1—source data 1, Figure 1—source data 2, Source data 1 and Source data 2. (c) Experimental parameters for brain measurements optimized for THG and/or AF680 emission. Data were obtained for 1650 highIR or 1270 nm lowIR excitation and different depth ranges. Line averaging (Line av.), two- or four-channel emission port (Port), dichroic mirror to split off emission (DM), emission bandpass filter (BP), detector type (PMT), and immersion liquid (Imm.). Rows in the table with the same sequence number (Seq.) were acquired simultaneously.
- https://cdn.elifesciences.org/articles/63776/elife-63776-supp1-v1.docx
-
Transparent reporting form
- https://cdn.elifesciences.org/articles/63776/elife-63776-transrepform1-v1.docx
-
Source data 1
Raw microscopy image files, intermediate and analysis results.
- https://cdn.elifesciences.org/articles/63776/elife-63776-data1-v1.zip
Download links
A two-part list of links to download the article, or parts of the article, in various formats.
Downloads (link to download the article as PDF)
Open citations (links to open the citations from this article in various online reference manager services)
Cite this article (links to download the citations from this article in formats compatible with various reference manager tools)
Intravital deep-tumor single-beam 3-photon, 4-photon, and harmonic microscopy
eLife 11:e63776.
https://doi.org/10.7554/eLife.63776


