RAL GTPases mediate EGFR-driven intestinal stem cell proliferation and tumourigenesis
- Wolfson Wohl Cancer Research Centre, United Kingdom
- Institute of Cancer Sciences, University of Glasgow, United Kingdom
- Cancer Research UK Beatson Institute, United Kingdom
Figures
Figure 1 with 1 supplement
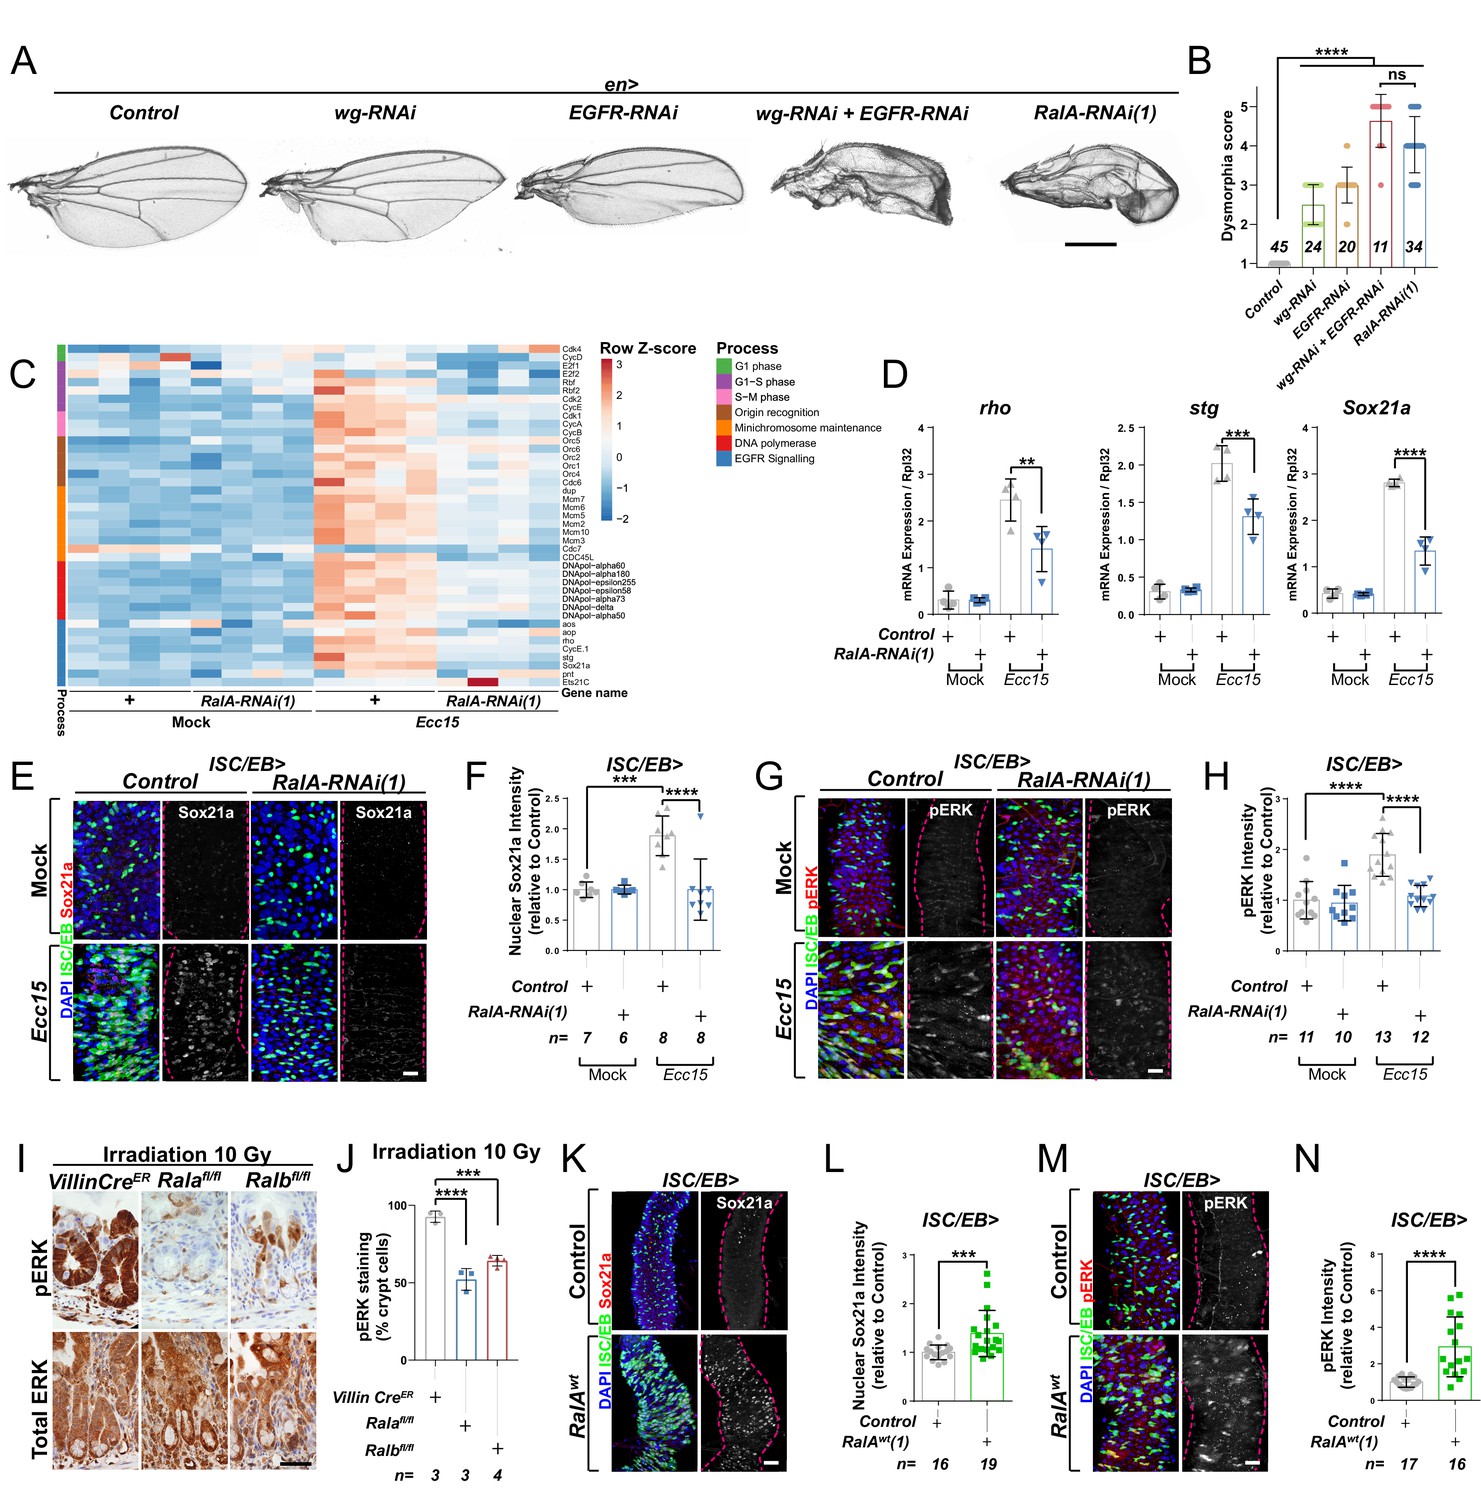
Ral GTPases are necessary and sufficient to induce EGFR/MAPK signalling in intestinal stem cells (ISCs).
(A) Adult Drosophila wings from control animals and with posterior compartment knockdown of wg (wg-RNAi), Egfr (Egfr-RNAi), or RalA using one of two previously validated RNAi lines (RalA-RNAi(1)) or combined wg and Egfr knockdown (wg-RNAi+Egfr RNAi). Scale bar = 500 µm. (B) Blind scoring of wing dysmorphia on a scale of 1–5. Numbers inside bars represent the total number of wings scored. Kruskal–Wallis test followed by Dunn’s multiple comparisons test. (C) Heat map from transcriptomic analysis of adult whole midguts from mock-treated and Ecc15-infected control animals (+) or following adult-restricted knockdown of RalA (RalA-RNAi(1)) using the escargot-gal4, UAS-gfp driver (ISC/EB>). RNA was extracted from >25 whole midguts per replicate, and four biological replicates per genotype/per condition were processed for sequencing. (D) RT-qPCR confirmation of genes associated with EGFR/MAPK signalling in whole midguts from genotypes and conditions as in (C) expressed relative to rpl32 levels. n (number of biological replicates) = 4, each dot represents an independent RNA sample from >25 midguts per sample. Two-way ANOVA followed by Sidak’s multiple comparisons test. (E) Representative confocal images of Sox21a immunofluorescence staining (red/grey) of adult posterior midguts from Mock-treated or Ecc15-infected wild-type control animals or following knockdown of RalA (RalA-RNAi(1)) in stem/progenitor cells using escargot-gal4, UAS-gfp (ISC/EB>; green). (F) Quantification of average Sox21a staining intensity within the nuclear compartment (DAPI positive) in midguts as in (E). Two-way ANOVA followed by Sidak’s multiple comparisons test; n = number of z-stack confocal images quantified, each from an independent posterior midgut. (G) Representative confocal images of pERK immunofluorescence staining (red/grey) of adult posterior midguts from Mock-treated or Ecc15-infected control animals or following knockdown of RalA (RalA-RNAi(1)) within stem/progenitor cells (ISC/EB>; green). (H) Quantification of average pERK staining intensity within the ISC/EB compartment (GFP positive) of midguts as in (G). Two-way ANOVA followed by Sidak’s multiple comparisons test; n = number of z-stack confocal images quantified, each from an independent posterior midgut. (I) Immunohistochemistry images of total (bottom panels) and pERK (top panels) in small intestinal regenerating crypts 3 days after whole-body irradiation of control mice (left panels) or mice following conditional intestinal epithelial knockout of Rala or Ralb. Scale bar = 50 µm. (J) Quantification of the percentage of cells with pERK staining in regenerating small intestinal crypts as in (I). n = number of mice, with >12 crypts quantified per animal, each dot represents the average percentage from a given mouse. One-way ANOVA followed by Tukey’s multiple comparisons test. (K) Representative confocal images of Sox21a immunofluorescence staining (red/grey) of adult posterior midguts from control animals or animals overexpressing wild-type Rala within stem/progenitor cells (ISC/EB>; green). Scale bar = 50 µm. (L) Quantification of average Sox21a staining intensity within the nuclear compartment (DAPI positive; blue) of midguts as in (K). Student’s t-test; n = number of z-stack confocal images quantified, each from an independent posterior midgut. (M) Representative confocal images of pERK immunofluorescence staining (red/grey) in control animals or animals overexpressing wild-type Rala within stem/progenitor cells (ISC/EB>; green). (N) Quantification of average pERK staining intensity within the ISC/EB compartment (GFP positive) of midguts as in (M). Student’s t-test; n = number of z-stack confocal images quantified, each from an independent posterior midgut. Where indicated: *p<0.05, **p<0.01, ***p<0.001, ****p<0.0001, ns: not significant. All error bars represent SD. Scale bars = 20 µm, unless otherwise stated.
-
Figure 1—source data 1
Ral GTPases are necessary and sufficient to induce EGFR/MAPK signalling in intestinal stem cells.
- https://cdn.elifesciences.org/articles/63807/elife-63807-fig1-data1-v2.xlsx
Figure 1—figure supplement 1
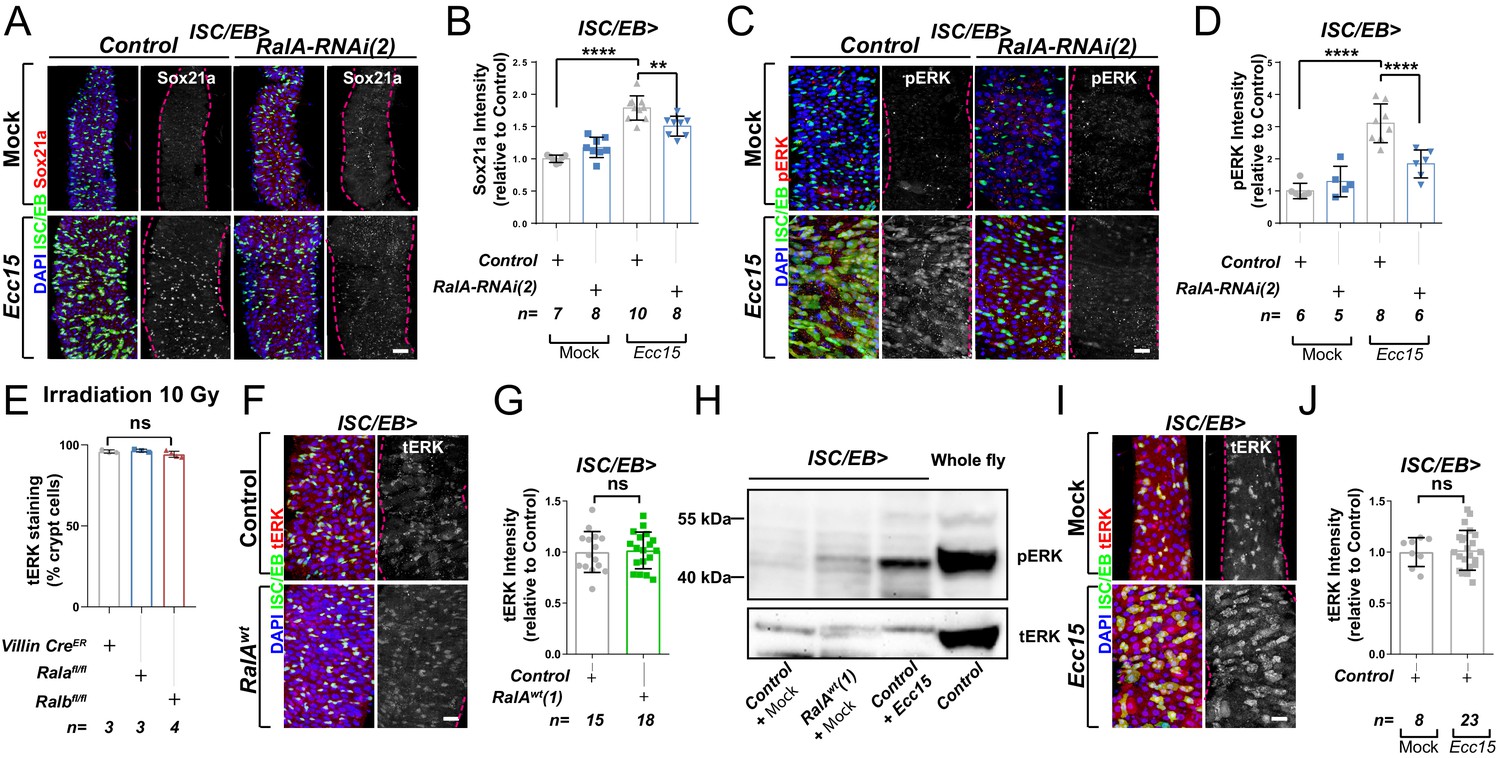
Ral GTPases are necessary and sufficient to induce EGFR/MAPK signalling in intestinal stem cells (ISCs).
(A) Representative confocal images of Sox21a immunofluorescence staining (red/grey) of adult posterior midguts from Mock-treated or Ecc15-infected control animals or following knockdown of RalA using an independent RNAi line from that in Figure 1 (RalA-RNAi(2)) in stem/progenitor cells using escargot-gal4, UAS-gfp (ISC/EB>; green). Scale bar = 50 µm. (B) Quantification of average Sox21a staining intensity within the nuclear compartment (DAPI positive; blue) in midguts as in (A). Two-way ANOVA followed by Sidak’s multiple comparisons test; n = number of z-stack confocal images quantified, each from an independent posterior midgut. (C) Representative confocal images of pERK immunofluorescence staining (red/grey) of adult posterior midguts from Mock-treated or Ecc15-infected control animals or following knockdown of RalA using an independent RNAi line from that in Figure 1 (RalA-RNAi(2)) within stem/progenitor cells (ISC/EB>; green). (D) Quantification of average pERK staining intensity within the ISC/EB compartment (GFP positive) of midguts as in (C). Two-way ANOVA followed by Sidak’s multiple comparisons test; n = number of z-stack confocal images quantified, each from an independent posterior midgut. (E) Quantification of the percentage of cells with total ERK staining (tERK) in regenerating small intestinal crypts as in Figure 1I. n = number of mice, with >12 crypts quantified per animal, each dot represents the average percentage from a given mouse. One-way ANOVA followed by Tukey’s multiple comparisons test. (F) Representative confocal images of tERK immunofluorescence staining (red/grey) in control animals or animals overexpressing wild-type Rala within stem/progenitor cells (ISC/EB>; green). (G) Quantification of average tERK staining intensity within the ISC/EB compartment (GFP positive) of midguts as in (F). Student’s t-test; n = number of z-stack confocal images quantified, each from an independent posterior midgut. (H) Western blot of pERK and tERK from Control (Mock treated), wild-type Rala overexpressing (Mock treated) and Ecc15-infected midguts and whole fly lysates. (I) Representative confocal images of tERK immunofluorescence staining (red/grey) in mock-treated wild-type control animals or animals infected with Ecc15. (J) Quantification of average tERK staining intensity within the ISC/EB compartment (GFP positive) of midguts as in (I). Student’s t-test; n = number of z-stack confocal images quantified, each from an independent posterior midgut. Where indicated: *p<0.05, **p<0.01, ***p<0.001, ****p<0.0001, ns: not significant. All error bars represent SD. Scale bars = 20 µm, unless otherwise stated.
-
Figure 1—figure supplement 1—source data 1
Ral GTPases are necessary and sufficient to induce EGFR/MAPK signalling in intestinal stem cells.
- https://cdn.elifesciences.org/articles/63807/elife-63807-fig1-figsupp1-data1-v2.xlsx
Figure 2
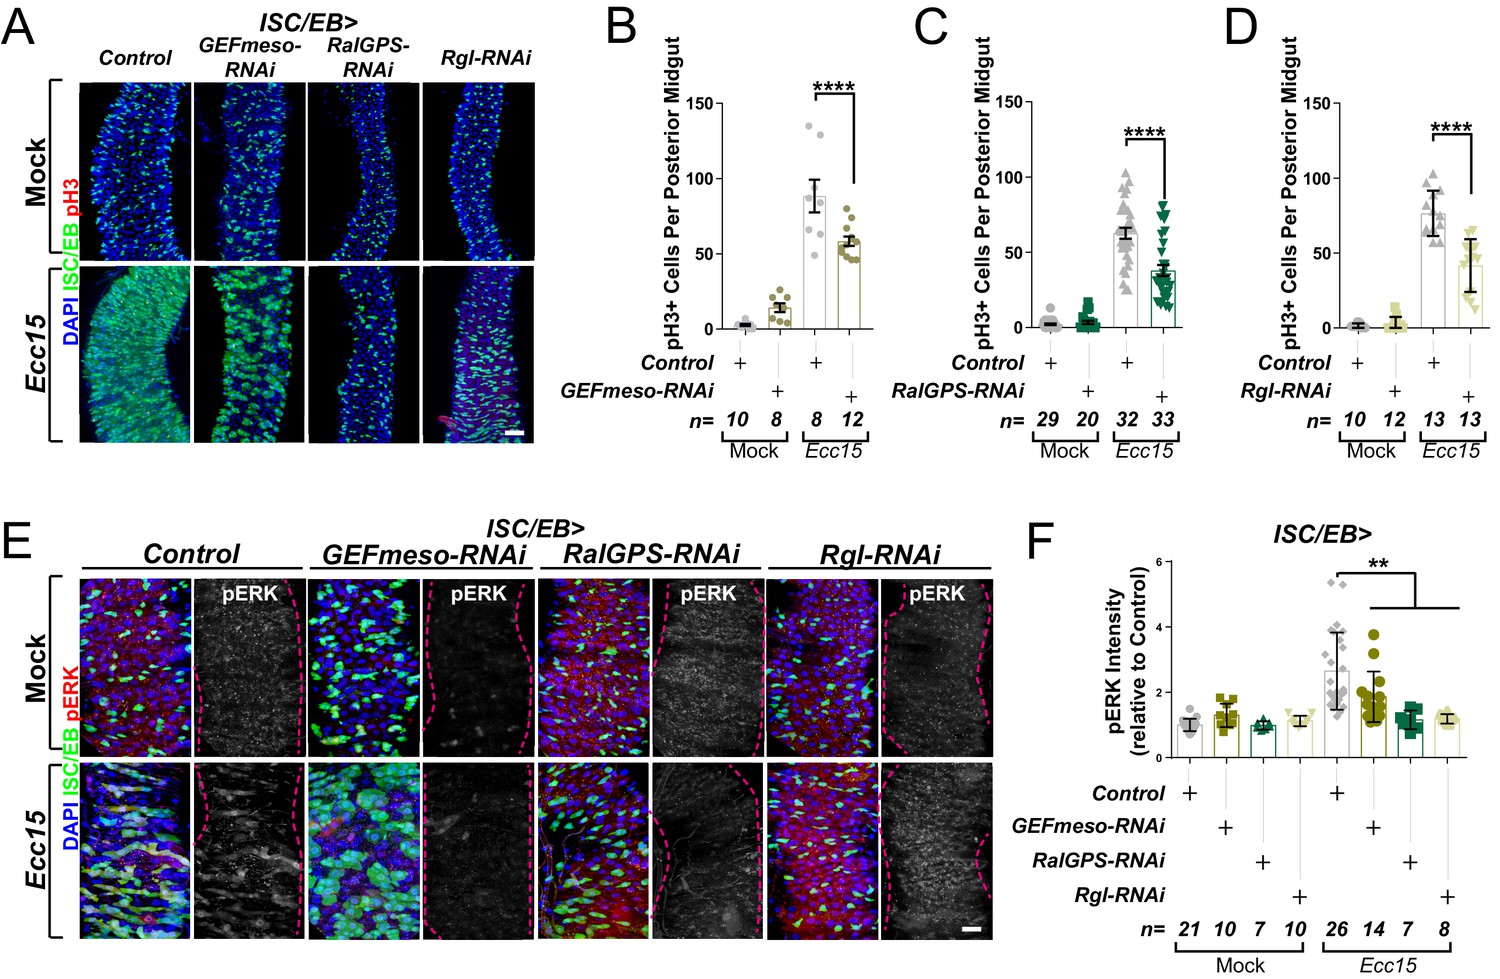
Ral GTPase activation is necessary for EGFR/MAPK signalling in regenerating intestinal stem cells/enteroblasts (ISCs/EBs).
(A) Representative confocal images of pH3 staining (red) within the ISC/EB compartment (green) in mock-treated or regenerating posterior midguts. Scale bar = 50 µm. (B) Quantification of pH3-positive nuclei in control or GEFmeso-RNAi posterior midguts as in (A). Two-way ANOVA followed by Sidak’s multiple comparisons test. n = number of midguts. (C) Quantification of pH3-positive nuclei in control or RalGPS-RNAi posterior midguts as in (A). Two-way ANOVA followed by Sidak’s multiple comparisons test. n = number of midguts. (D) Quantification of pH3-positive nuclei in control or Rgl-RNAi posterior midguts as in (A). Two-way ANOVA followed by Sidak’s multiple comparisons test. n = number of midguts. (E) Representative confocal images of pERK staining (red/grey) in mock-treated or regenerating control animals or animals with knockdown of GEFmeso, RalGPS, or Rgl within the ISC/EB compartment (green). Scale bar = 20 µm. (F) Quantification of average pERK staining intensity within the ISC/EB compartment (GFP positive) as in (E). Two-way ANOVA followed by Sidak’s multiple comparisons test; n = number of z-stack confocal images quantified, each from an independent posterior midgut. Where indicated: *p<0.05, **p<0.01, ***p<0.001, ****p<0.0001, ns: not significant. All error bars represent SD. Scale bars = 20 µm, unless otherwise stated.
-
Figure 2—source data 1
Ral GTPase activation is necessary for EGFR/MAPK signalling in regenerating ISCs/EBs.
- https://cdn.elifesciences.org/articles/63807/elife-63807-fig2-data1-v2.xlsx
Figure 3 with 1 supplement
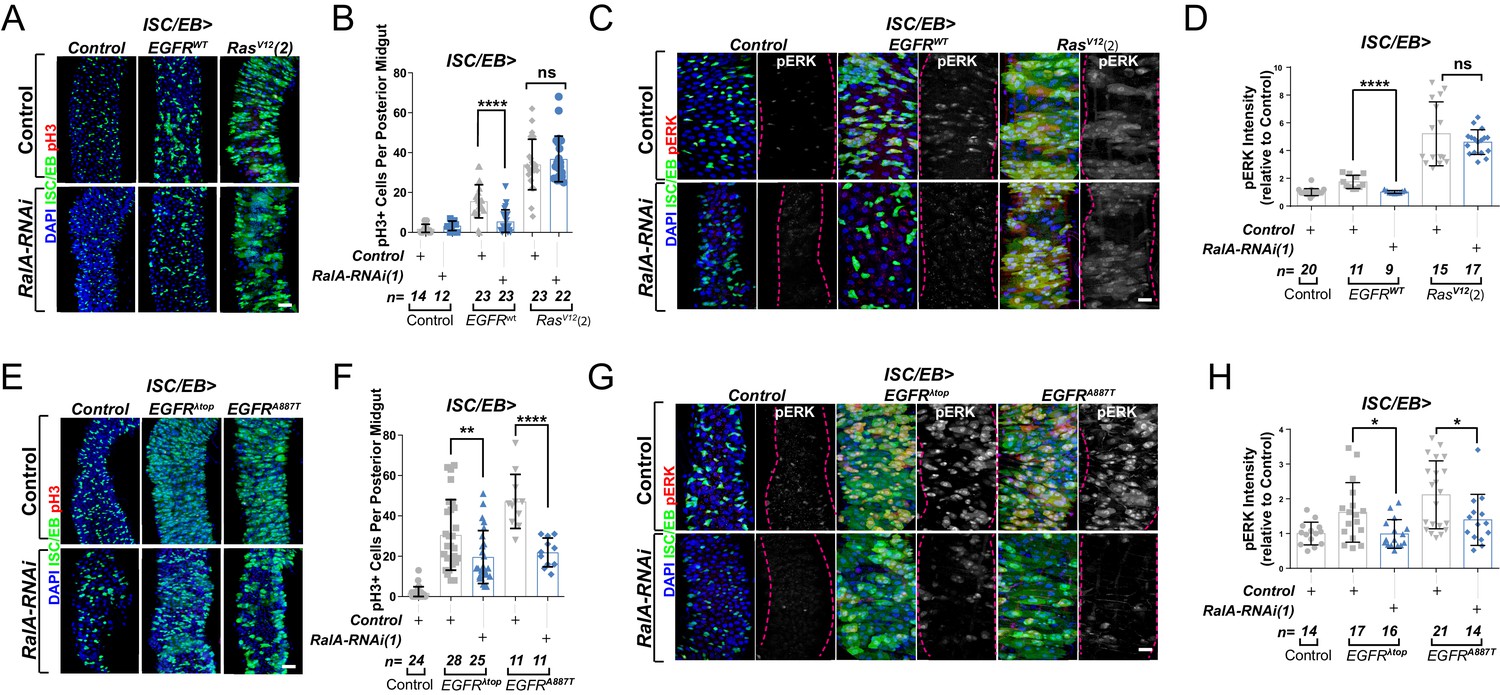
Ral GTPases are required for EGFR/MAPK signalling upstream of Ras.
(A) Representative confocal images of pH3 staining (red) within the intestinal stem cell/enteroblast (ISC/EB) compartment (green) of control animals or animals overexpressing wild-type Egfr (EGFRWT) or one of two constitutive Ras constructs used in this paper (RasV12(2)) with or without RalA knockdown within stem/progenitor cells (ISC/EB>; green). Scale bar = 50 µm. (B) Quantification of pH3-positive nuclei in posterior midguts as in (A). Two-way ANOVA followed by Sidak’s multiple comparisons test. n = number of midguts. (C) Representative confocal images of pERK staining (red/grey) of control animals or animals overexpressing wild-type Egfr (EGFRWT) or one of two constitutive Ras constructs used in this paper (RasV12(2)) with or without RalA knockdown within stem/progenitor cells (ISC/EB>; green). (D) Quantification of average pERK staining intensity as seen in (C) within the ISC/EB compartment (GFP positive). Two-way ANOVA followed by Sidak’s multiple comparisons test; n = number of z-stack confocal images quantified, each from an independent posterior midgut. (E) Representative confocal images of pH3 staining (red) within the ISC/EB compartment (green) of control animals or animals overexpressing two types of constitutively active Egfr constructs (EGFRλtop or EGFRA887T) with or without RalA knockdown within stem/progenitor cells (ISC/EB>; green). Scale bar = 50 µm. (F) Quantification of pH3-positive nuclei in posterior midguts as in (E). Two-way ANOVA followed by Sidak’s multiple comparisons test. Error bars represent SEM. n = number of midguts. (G) Representative confocal images of pERK staining (red/grey) within the ISC/EB compartment (green) of control animals or animals overexpressing two types of constitutively active Egfr constructs (EGFRλtop or EGFRA887T) with or without RalA knockdown within stem/progenitor cells (ISC/EB>; green). (H) Quantification of average pERK staining intensity as in (G) within the ISC/EB compartment (GFP positive). Two-way ANOVA followed by Sidak’s multiple comparisons test; n = number of z-stack confocal images quantified, each from an independent posterior midgut. Where indicated: *p<0.05, **p<0.01, ***p<0.001, ****p<0.0001, ns: not significant. All error bars represent SD. Scale bars = 20 µm, unless otherwise stated.
-
Figure 3—source data 1
Ral GTPases are required for EGFR/MAPK signalling upstream of Ras.
- https://cdn.elifesciences.org/articles/63807/elife-63807-fig3-data1-v2.xlsx
Figure 3—figure supplement 1
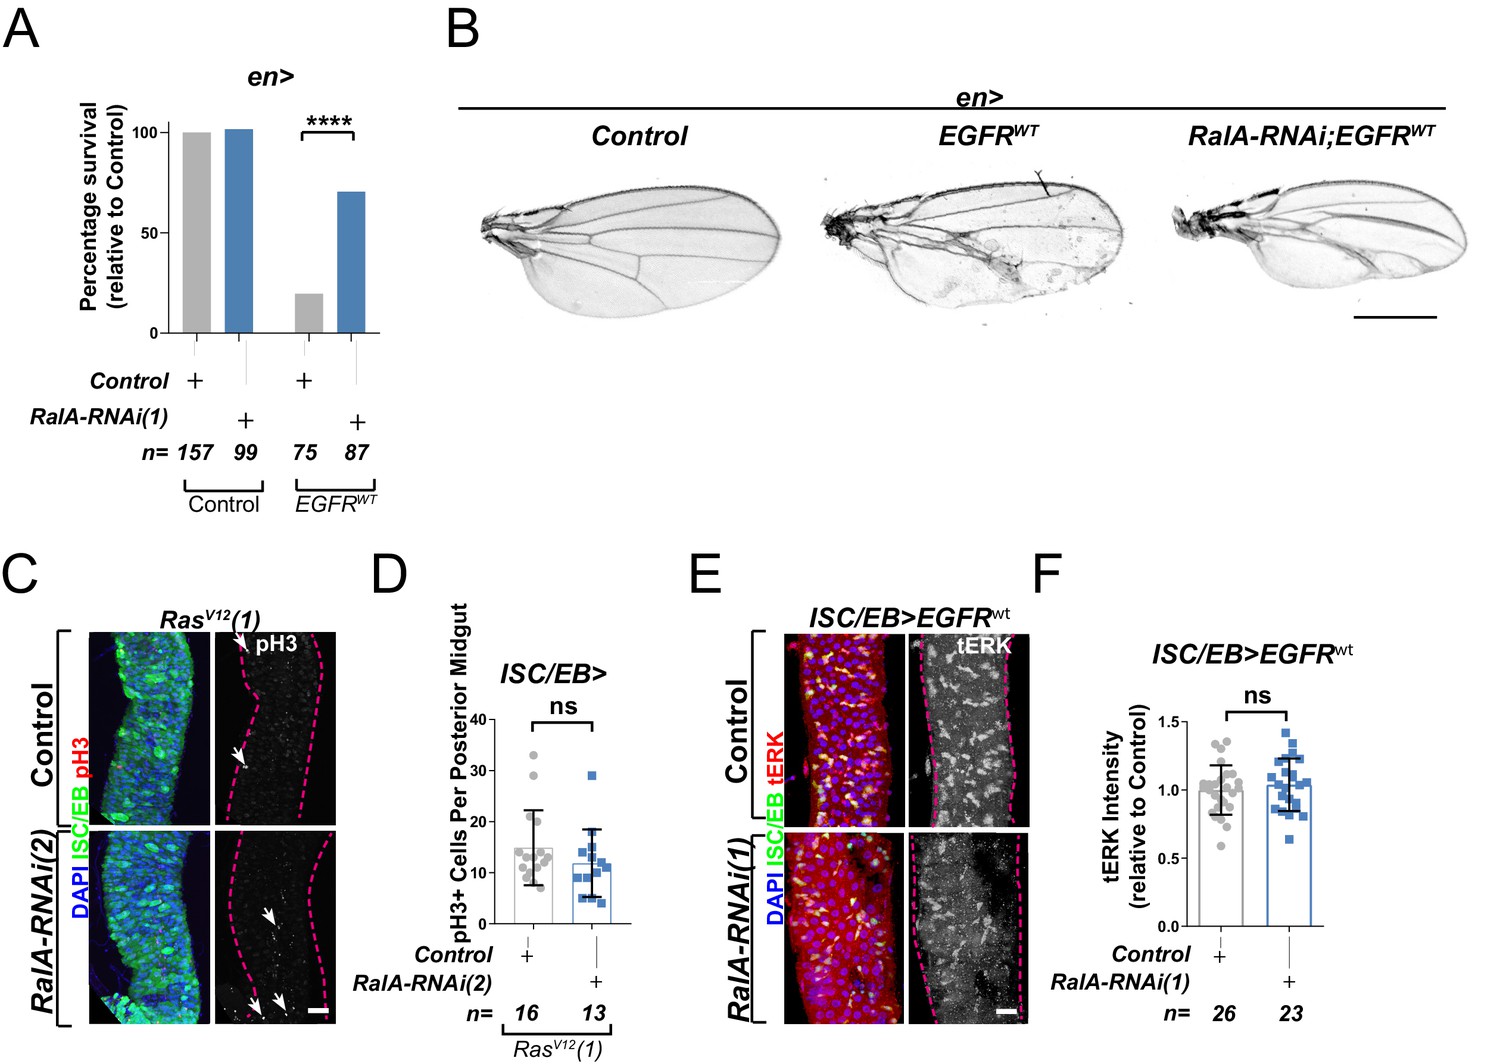
Ral GTPases are required for EGFR/MAPK signalling upstream of Ras.
(A) Percentage survival of adult flies enclosing with the desired experimental genotype. Fisher’s exact test. (B) Adult Drosophila wings from control animals and with posterior compartment overexpression of wild-type Egfr (EGFRWT) with or without knockdown of RalA (RalA-RNAi(1)). Scale bar = 500 µm. (C) Representative confocal images of pH3 staining (red/grey; white arrows) within the intestinal stem cell/enteroblast (ISC/EB) compartment (green) in animals overexpressing a constitutively active Ras transgene independent from that in Figure 3 (RasV12(1)) with or without RalA knockdown (RalA-RNAi(2)) within stem/progenitor cells (ISC/EB>; green). Scale bar = 50 µm. (D) Quantification of pH3-positive nuclei in posterior midguts as in (C). Data were analysed by Student’s t-test. n = number of midguts. (E) Representative confocal images of tERK staining (red/grey) in animals overexpressing wild-type Egfr (EGFRWT) with or without RalA knockdown within stem/progenitor cells (ISC/EB>; green). Scale bar = 20 µm. (F) Quantification of average tERK staining intensity within the ISC/EB compartment (GFP positive) of midguts as in (E). Student’s t-test. n = number of z-stack confocal images quantified, each from an independent posterior midgut. Where indicated: ****p<0.0001, ns: not significant. All error bars represent SD.
-
Figure 3—figure supplement 1—source data 1
Ral GTPases are required for EGFR/MAPK signalling upstream of Ras.
- https://cdn.elifesciences.org/articles/63807/elife-63807-fig3-figsupp1-data1-v2.xlsx
Figure 4 with 3 supplements
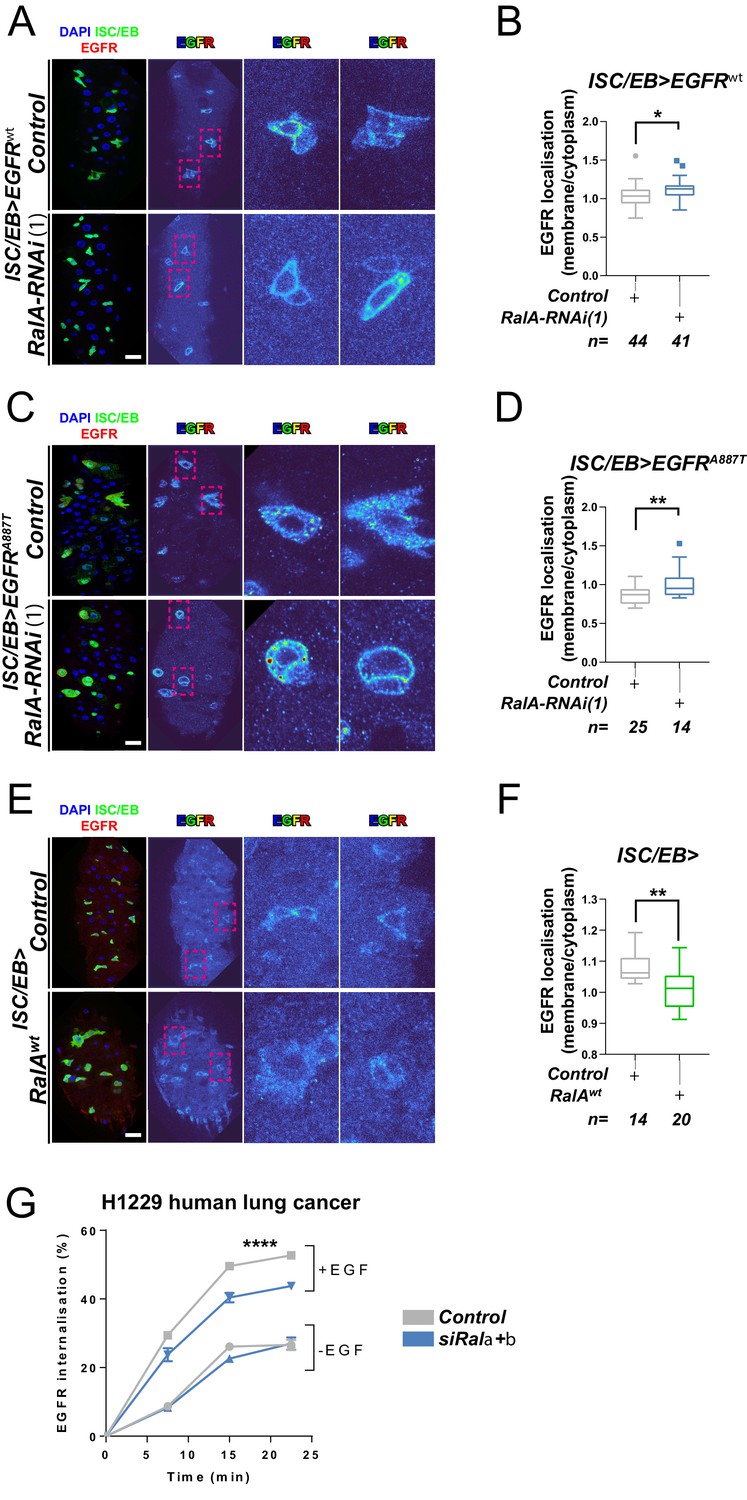
Ral GTPases are required for EGFR internalisation.
(A) Representative images of wild-type EGFR staining (red/turbo colour map) in adult Drosophila midgut stem/progenitor cells (intestinal stem cell/enteroblast [ISC/EB>]; green) without (Control) or with RalA knockdown (RalA-RNAi). (B) Quantification of EGFR plasma membrane staining localisation in midguts as in (A) relative to the cytoplasm. Data is presented as Tukey's box and whiskers plot. Data were analysed by Student’s t-test. n = number of z-stack confocal images quantified, each from an independent posterior midgut. (C) Representative images of EGFRA887T staining (red/turbo colour map) in adult Drosophila midgut stem/progenitor cells (ISC/EB>; green) without (Control) or with RalA knockdown (RalA-RNAi). (D) Quantification of EGFRA887Tplasma membrane staining localisation as in (C) relative to the cytoplasm presented as Tukey's box and whiskers plot. Student’s t-test. n = number of z-stack confocal images quantified, each from an independent posterior midgut. (E) Representative images of EGFR staining in (red/turbo colour map) in adult Drosophila midgut stem/progenitor cells (ISC/EB>; green) without (Control) or with wild-type RalA overexpression (RalAwt). (F) Quantification of EGFR plasma membrane staining localisation in midguts as in (E) relative to the cytoplasm. Data is presented as Tukey's box and whiskers plot. Student’s t-test. n = number of z-stack confocal images quantified, each from an independent posterior midgut. (G) Internalisation of EGFR over time determined by a surface biotinylation ELISA-based assay in H1299 human non-small cell lung cancer cells transfected with a non-targeting (Control) or combined Rala and Ralb knockdown constructs (siRala +b) and incubated in the presence or absence of EGF ligand. Data from one experiment with three technical replicates and representative of three independently performed experiments is presented. Two-way ANOVA followed by Bonferroni's multiple comparisons test. Error bars represent SEM. Where indicated: *p<0.05, **p<0.01, ***p<0.001, ****p<0.0001. All error bars represent SD. Scale bars = 20 µm.
-
Figure 4—source data 1
Ral GTPases are required for EGFR internalisation.
- https://cdn.elifesciences.org/articles/63807/elife-63807-fig4-data1-v2.xlsx
Figure 4—figure supplement 1
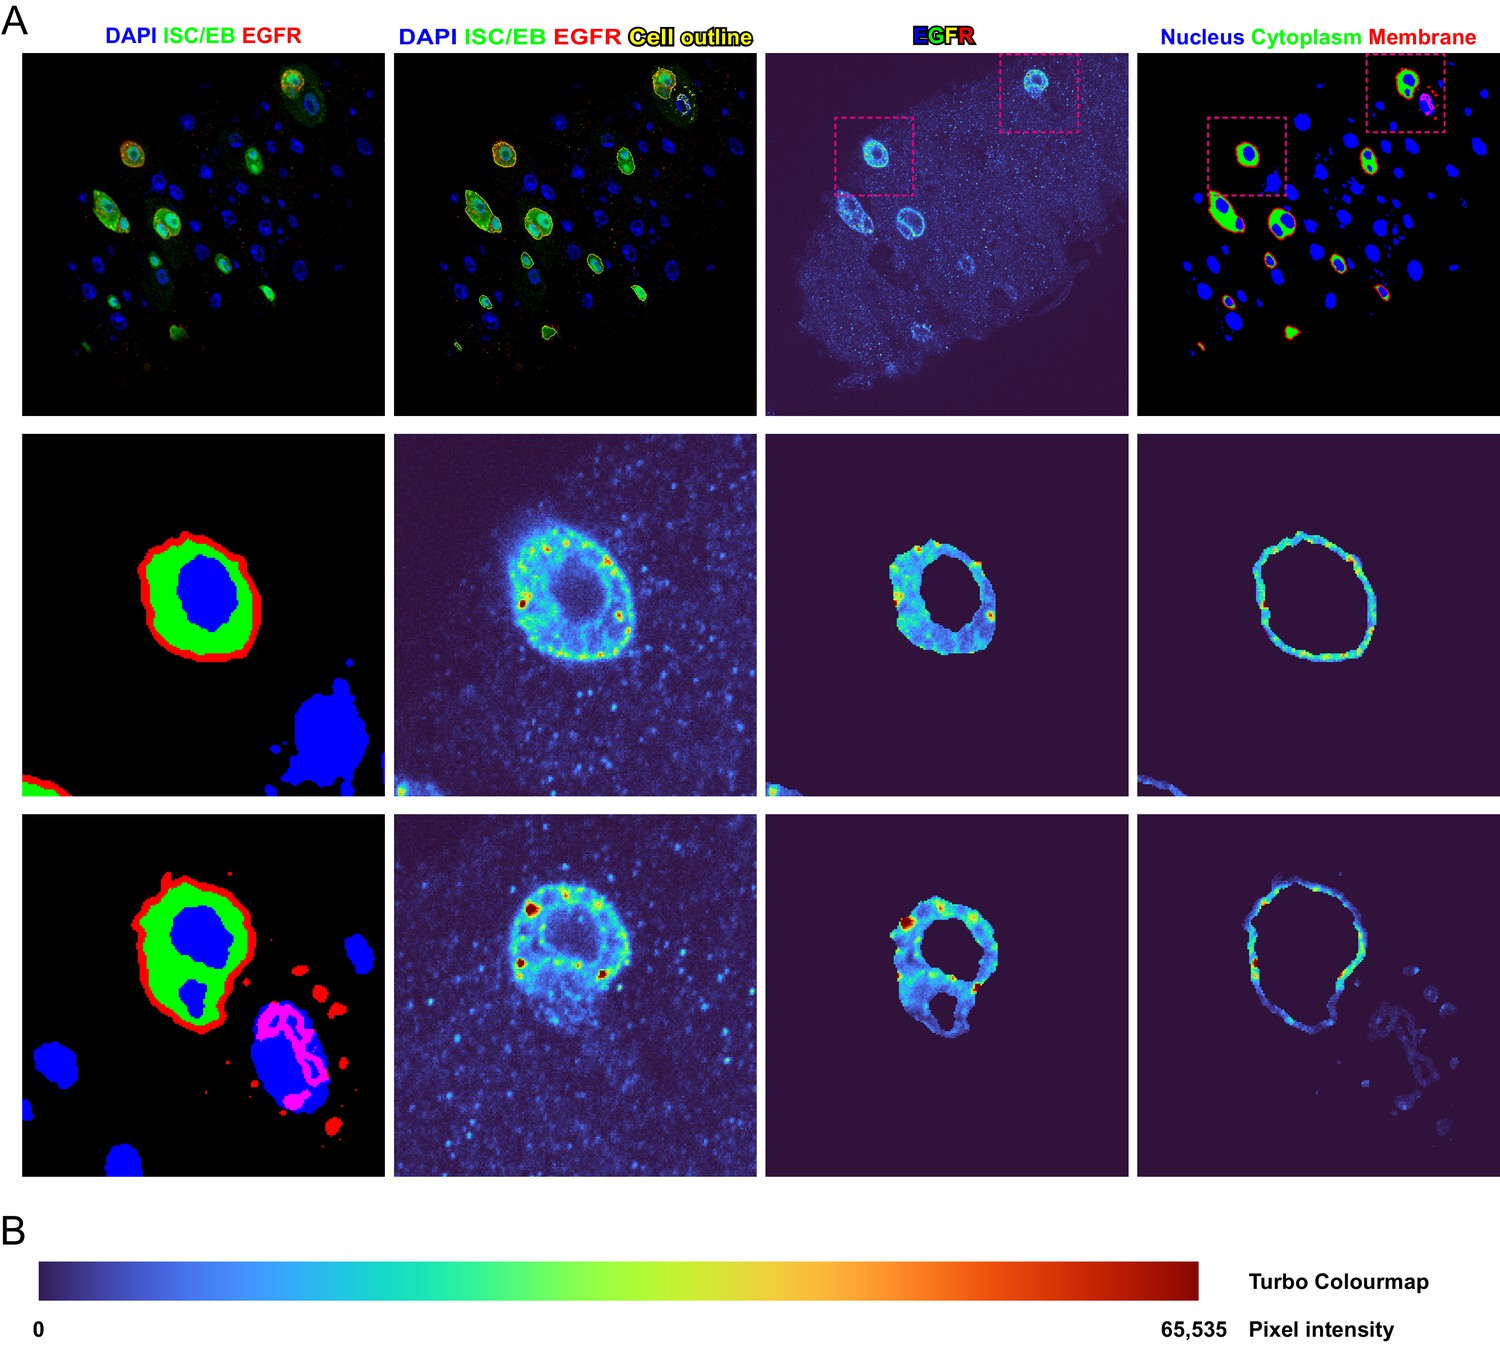
Demonstration of method used to quantify EGFR cellular localisation.
(A) Example of a single confocal plane from a z-stack confocal image used for the quantification of EGFR localisation. Stem/progenitor cells are identified using escargot-gal4, UAS-gfp (ISC/EB>; green), nuclei are highlighted by DAPI staining (blue). These layers are converted to binary masks based on the triangle method to determine the threshold value and subjected to morphological operations to yield masks for the quantification of EGFR intensity in the various subcellular locations. The membrane compartment (red) is defined as the dilated outline of the intestinal stem cell/enteroblast (ISC/EB) compartment. The cytoplasmic compartment (green) is defined as the ISC/EB compartment minus the membrane and nuclear (blue) compartments. (B) Coloured bar representing the colour of pixels with a given 16-bit intensity in the turbo colour map.
Figure 4—figure supplement 2
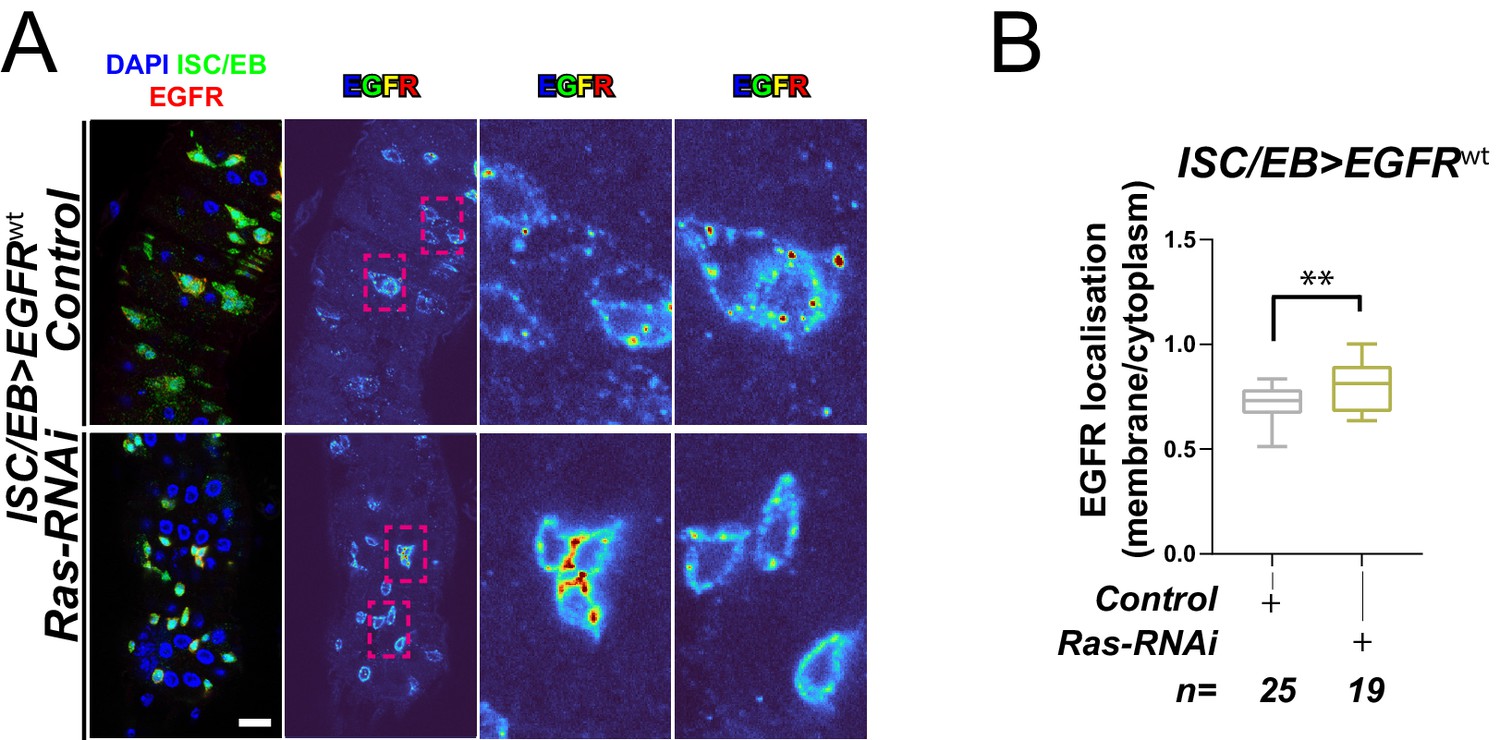
Ras is required for EGFR internalisation.
(A) Representative images of wild-type EGFR staining (red/turbo colour map) in adult Drosophila midgut stem/progenitor cells (intestinal stem cell/enteroblast [ISC/EB>]; green) without (Control) or with Ras knockdown (Ras-RNAi). (B) Quantification of EGFR plasma membrane staining localisation in midguts as in (A) relative to the cytoplasm. Data is presented as Tukey's box and whiskers plot. Student’s t-test. n = number of z-stack confocal images quantified, each from an independent posterior midgut. Where indicated: *p<0.05, **p<0.01, ***p<0.001, ****p<0.0001. All scale bars = 20 µm.
-
Figure 4—figure supplement 2—source data 1
Rasis required for EGFR internalisation.
- https://cdn.elifesciences.org/articles/63807/elife-63807-fig4-figsupp2-data1-v2.xlsx
Figure 4—figure supplement 3
RAL GTPases are required for EGFR internalisation.
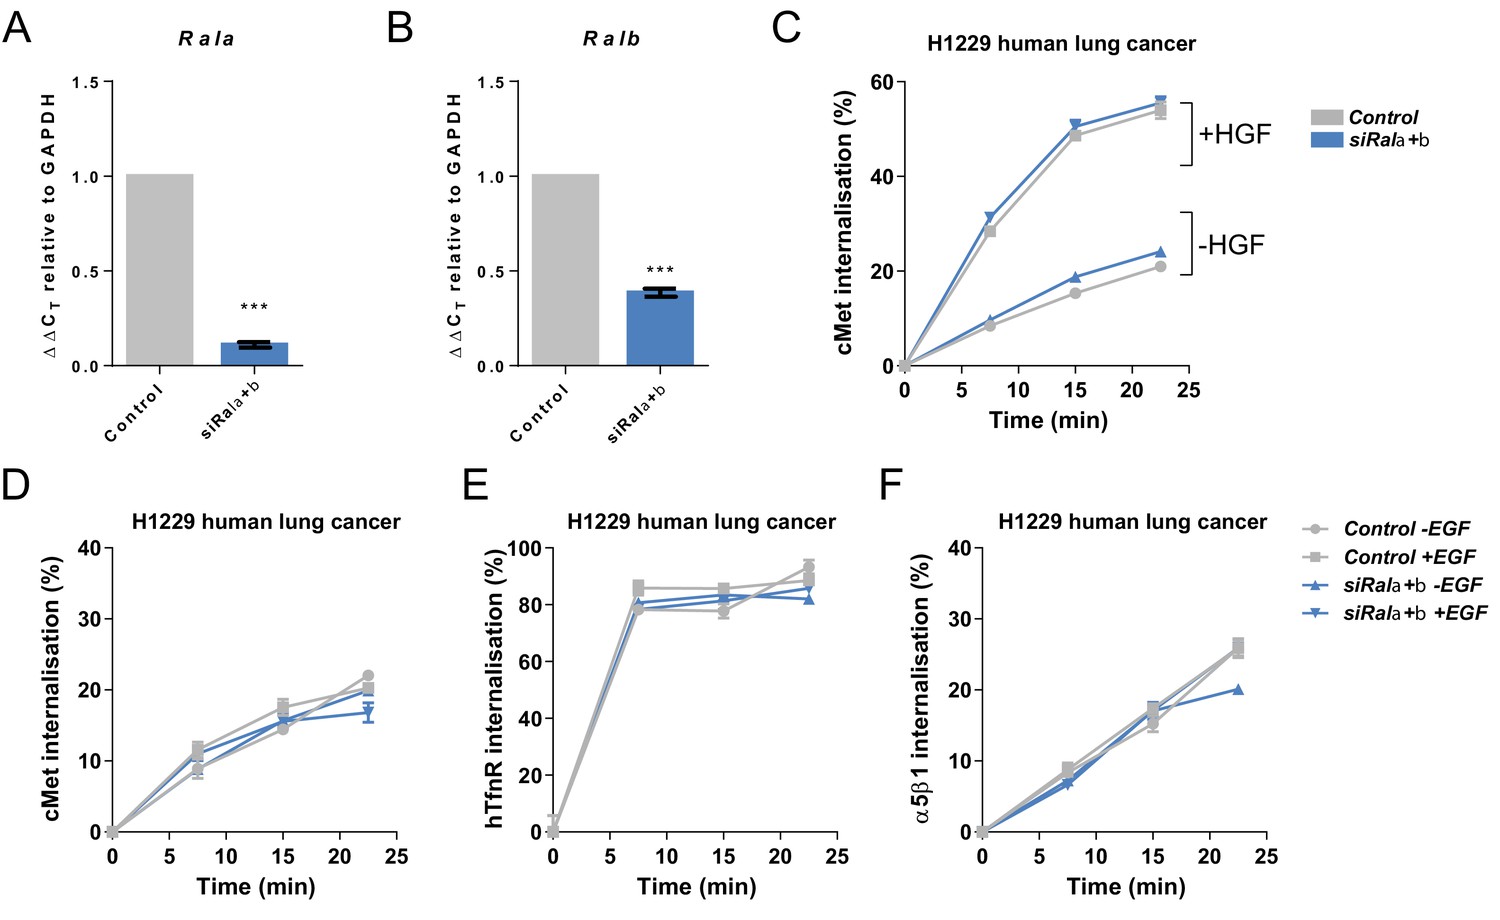
(A) Confirmation of knockdown of Rala in H1299 human non-small cell lung cancer cells transfected with a non-targeting (Control) or combined Rala and Ralb knockdown constructs (siRala+b). Data expressed as Delta CT using GAPDH as a reference. n = 3 repeat knockdown cultures. Student's t-test. Error bars represent SEM. (B) Confirmation of knockdown of Ralb in H1299 human non-small cell lung cancer cells transfected with a non-targeting (Control) or combined Rala and Ralb knockdown constructs (siRala+b). Data expressed as Delta CT using GAPDH as a reference. n = 3 repeat knockdown cultures. Student's t-test. Error bars represent SEM. (C) Internalisation of cMet over time as determined by a surface biotinylation ELISA-based assay in H1299 human non-small cell lung cancer cells transfected with a non-targeting (Control) or combined Rala and Ralb knockdown constructs (siRala+b) and incubated in the presence or absence of HGF ligand. Data from one representative experiment is shown with three technical replicates. Experiment was repeated three times. Two-way ANOVA followed by Bonferroni's multiple comparisons test. Error bars represent SEM. (D) Internalisation of cMet over time as determined by a surface biotinylation ELISA-based assay in H1299 human non-small cell lung cancer cells transfected with a non-targeting (Control) or combined Rala and Ralb knockdown constructs (siRala+b) and incubated in the presence or absence of EGF ligand. Data from one representative experiment is shown with three technical replicates. Experiment was repeated three times. Two-way ANOVA followed by Bonferroni's multiple comparisons test. Error bars represent SEM. (E) Internalisation of human Transferrin receptor (hTfnR) over time as determined by a surface biotinylation ELISA-based assay in H1299 human non-small cell lung cancer cells transfected with a non-targeting (Control) or combined Rala and Ralb knockdown constructs (siRala+b) and incubated in the presence or absence of EGF ligand. Data from one representative experiment is shown with three technical replicates. Experiment was repeated three times. Two-way ANOVA followed by Bonferroni's multiple comparisons test. Error bars represent SEM. (F) Internalisation of α5β1 integrin over time as determined by a surface biotinylation ELISA-based assay in H1299 human non-small cell lung cancer cells transfected with a non-targeting (Control) or combined Rala and Ralb knockdown constructs (siRala+b) and incubated in the presence or absence of EGF ligand. Data from one representative experiment is shown with three technical replicates. Experiment was repeated three times. Two-way ANOVA followed by Bonferroni's multiple comparisons test. Error bars represent SEM. Where indicated: ***p<0.001.
-
Figure 4—figure supplement 3—source data 1
RAL GTPases are required for EGFR internalisation.
- https://cdn.elifesciences.org/articles/63807/elife-63807-fig4-figsupp3-data1-v2.xlsx
Figure 5 with 1 supplement
Ral GTPases mediate malignant transformation of the intestinal and mammary epithelium.
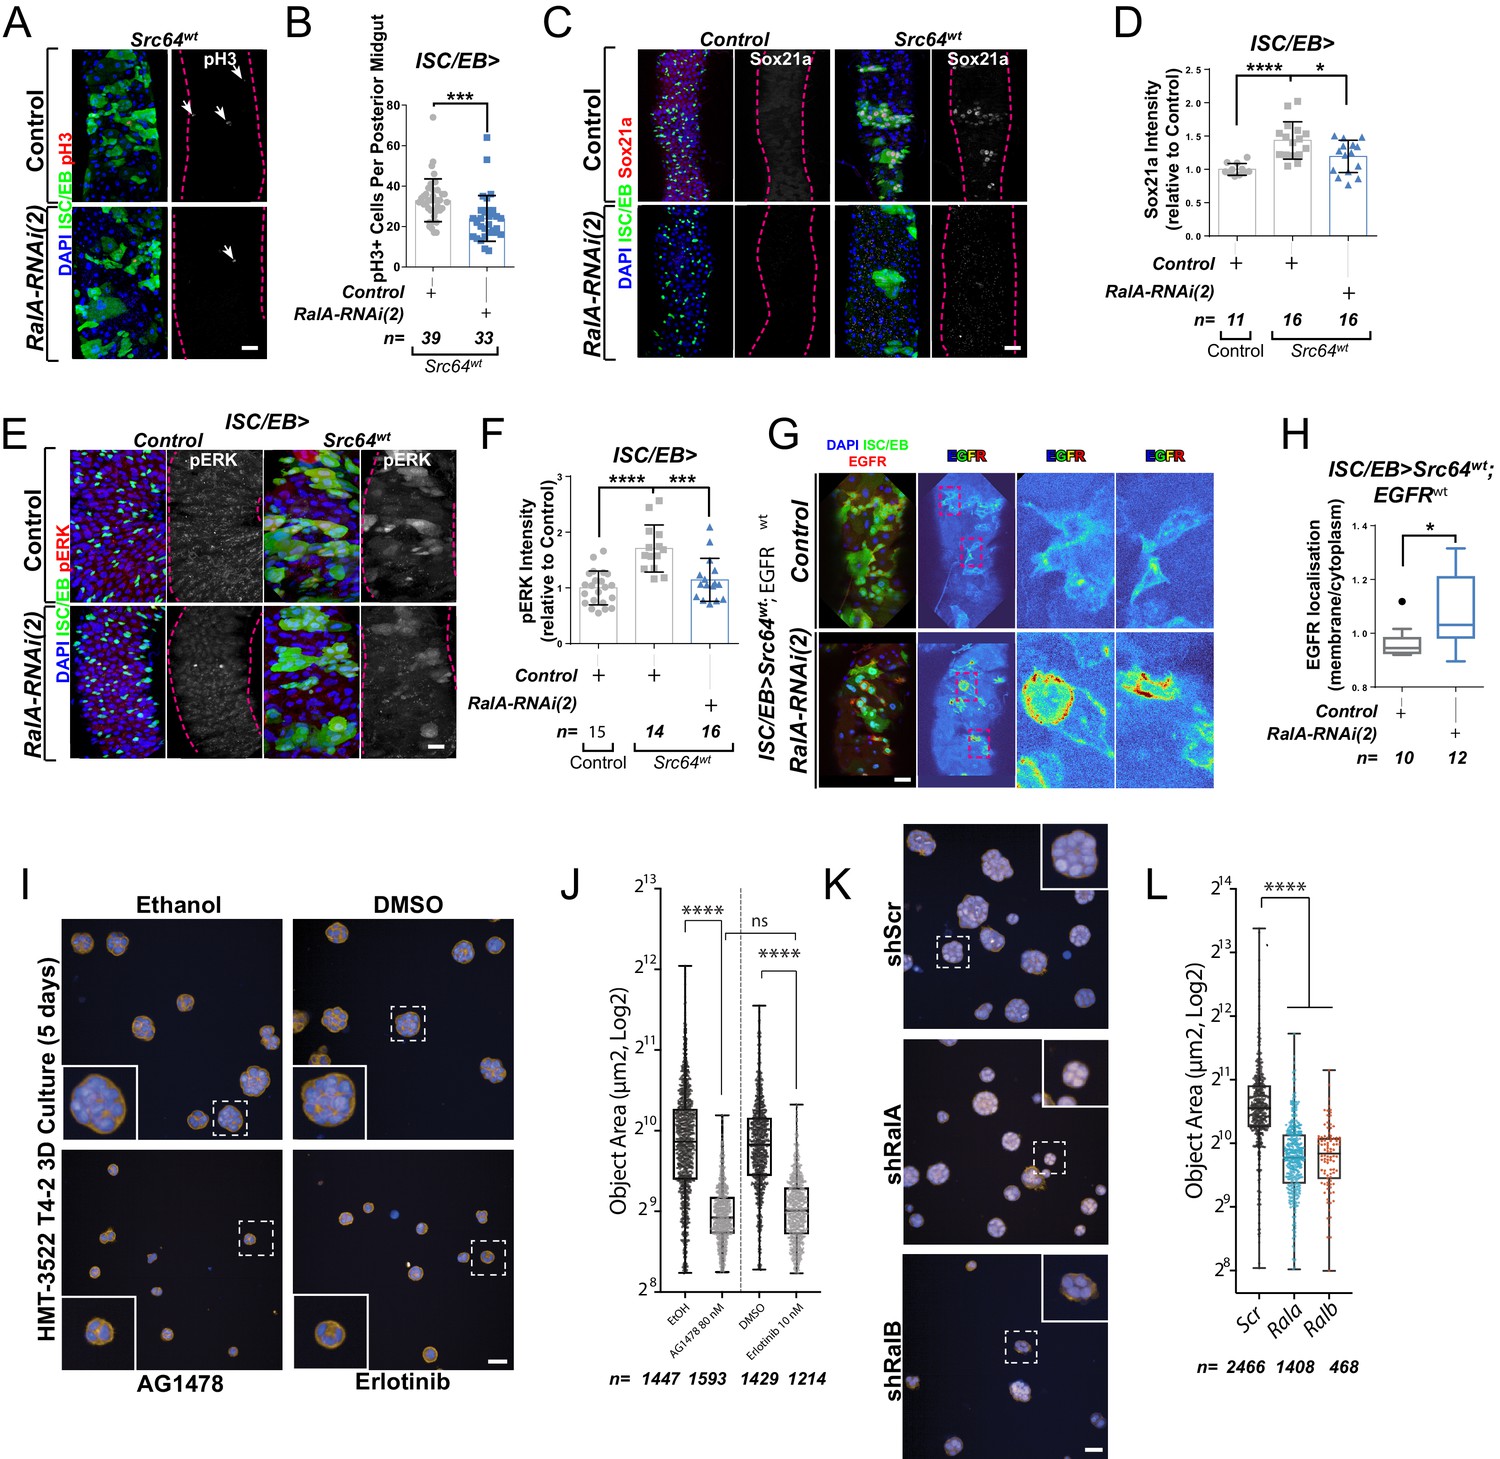
(A) Representative confocal images of pH3 staining (red/grey) in midguts overexpressing Src-kinase (Src64wt) with or without Rala knockdown (RalA-RNAi(2)) in stem/progenitor cells (intestinal stem cell/enteroblast [ISC/EB>]; green). White arrows indicate pH3-positive nuclei. (B) Quantification of pH3-positive nuclei in posterior midguts as in (A). Data were analysed by Student’s t-test. n = number of midguts. (C) Representative confocal images of Sox21a staining (red/grey) in midguts overexpressing Src-kinase (Src64wt) with or without Rala knockdown (RalA-RNAi(2)) in stem/progenitor cells (ISC/EB>; green). Scale bar = 50 µm. (D) Quantification of average Sox21a staining intensity within the nuclear compartment (DAPI positive) as in (C). Two-way ANOVA followed by Sidak’s multiple comparisons test; n = number of z-stack confocal images quantified, each from an independent posterior midgut. (E) Representative confocal images of pERK staining (red/grey) in midguts overexpressing Src-kinase (Src64wt) with or without Rala knockdown (RalA-RNAi(2)) in stem/progenitor cells (ISC/EB>; green). (F) Quantification of average pERK staining intensity within the ISC/EB compartment (GFP positive) as in (E). Two-way ANOVA followed by Sidak’s multiple comparisons test; n = number of z-stack confocal images quantified, each from an independent posterior midgut. Error bars represent SD. (G) Representative images of EGFR staining (red/grey) in midguts overexpressing Src-kinase (Src64wt) and EGFRwt with or without Rala knockdown (RalA-RNAi(2)) in stem/progenitor cells (ISC/EB>; green). (H) Quantification of EGFR plasma membrane staining localisation relative to the cytoplasm as in (G) presented as Tukey's box and whiskers plot. Data were analysed by Student’s t-test. n = number of z-stack confocal images quantified, each from an independent posterior midgut. (I) Confocal fluorescence microscopy images of HMT3522 T4-2 3D cultures, treated with EGFR inhibitors (tyrphostin AG1478 and erlotinib) or corresponding vehicle controls (ethanol and DMSO, respectively) followed by fixation after 5 days and staining for F-actin (yellow) and nuclei (blue, Hoechst). Scale bar = 40 µm. (J) Quantification of area of 5 days T4-2 cysts treated as in (I). n ≥ 1214 cysts assessed from four wells/condition/experiment, two independent experiments. One-way ANOVA, Tukey’s multiple comparisons test. (K) Confocal fluorescence microscopy images of HMT3522 T4-2 cysts of 5 days expressing either scramble, RalA or RalB shRNA. Cysts were fixed and stained for F-actin (yellow) and nuclei (blue, Hoechst). Scale bar = 40 µm. (L) Quantification of 5 days T4-2 cysts as in (K). n ≥ 468 cysts assessed from four wells/condition/experiment, three independent experiments. One-way ANOVA, Tukey’s multiple comparisons test. Where indicated: *p<0.05, **p<0.01, ***p<0.001, ****p<0.0001, ns: not significant. All error bars represent SD. Scale bars = 20 µm, unless otherwise stated.
-
Figure 5—source data 1
Ral GTPases mediate malignant transformation of the intestinal and mammary epithelium.
- https://cdn.elifesciences.org/articles/63807/elife-63807-fig5-data1-v2.xlsx
Figure 5—figure supplement 1
Ral knockdown in human mammary cell lines.
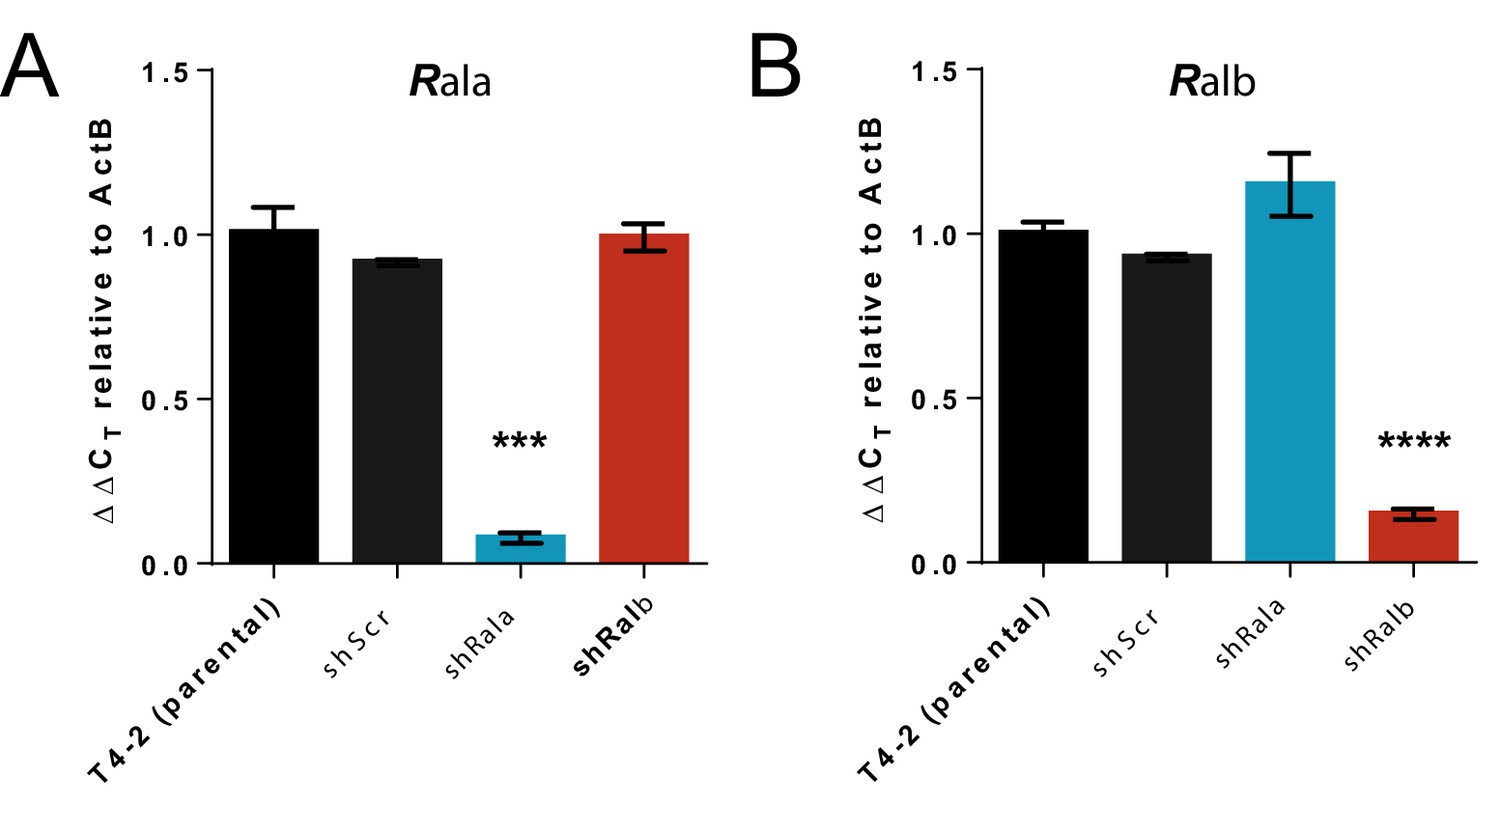
(A) Confirmation of knockdown of Rala in HMT3522 T4-2 3D cultures in parental lines or following shScr, shRala, and shRalb transfection. Data expressed as Delta CT using ACTB as a reference. n = 3 independent samples, Error bars represent SEM. Data were analysed using one-way ANOVA followed by Tukey's multiple comparisons test. (B) Confirmation of knockdown of Ralb in HMT3522 T4-2 3D cultures in parental lines or following shScr, shRala, and shRalb transfection. Data expressed as Delta CT using ACTB as a reference. n = 3 independent samples, error bars represent SEM. Data were analysed using one-way ANOVA followed by Tukey's multiple comparisons test. Where indicated: ***p<0.001, ****p<0.0001.
-
Figure 5—figure supplement 1—source data 1
Ralknockdown in human mammary cell lines.
- https://cdn.elifesciences.org/articles/63807/elife-63807-fig5-figsupp1-data1-v2.xlsx
Figure 6
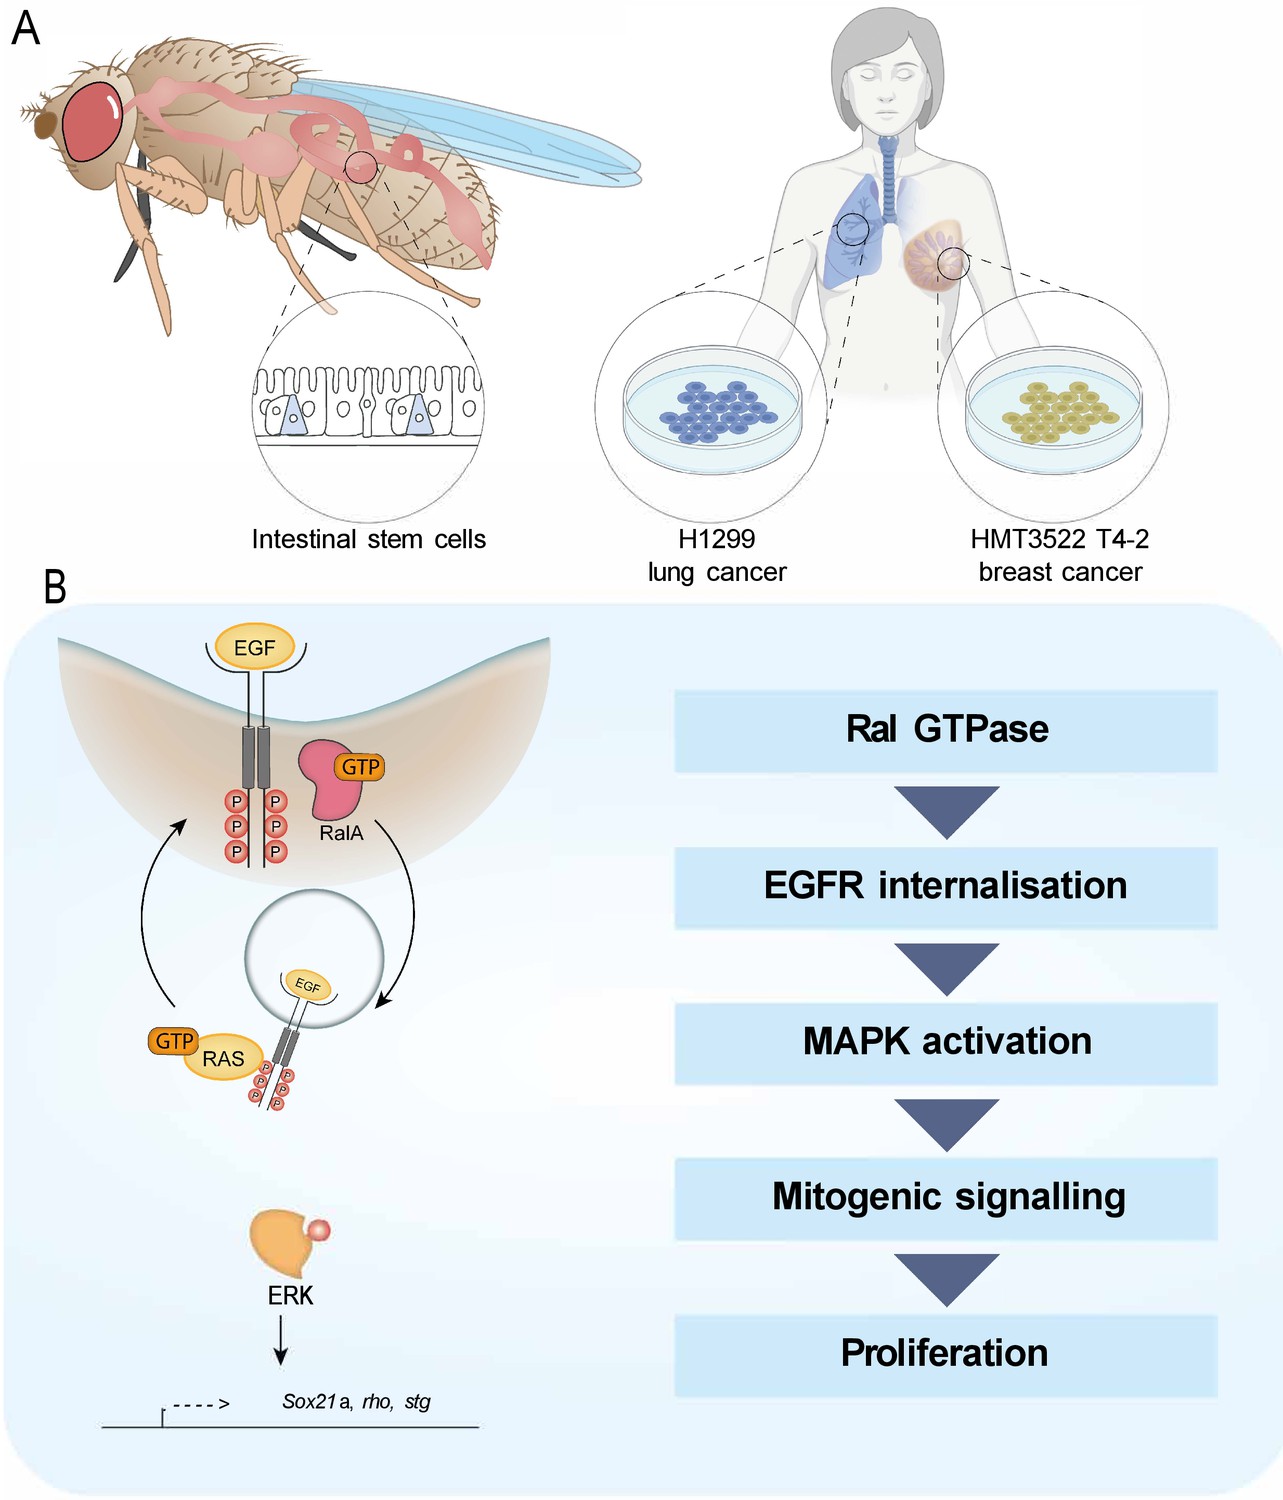
Working model depicting the role of RAL GTPases in EGFR/MAPK signalling.
(A) Experimental contexts used. Most results were acquired from Drosophila intestinal epithelial stem progenitor cells. Key findings were confirmed using mammalian intestine and human lung and breast cancer cell lines. (B) RalA is necessary for EGFR internalisation and MAPK activation, leading to mitogenic signalling.
Author response image 1
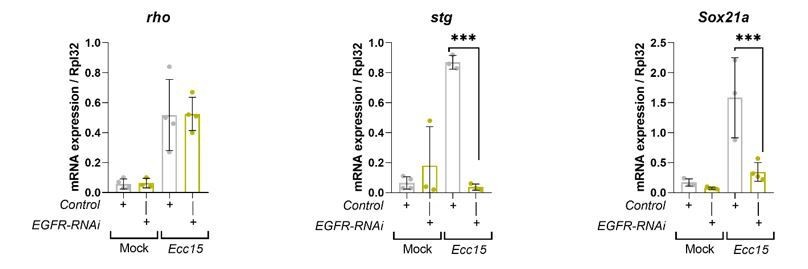
Transcriptional readouts of EGFR/MAPK pathway activation.
RT-qPCR confirmation of transcriptional targets of EGFR/MAPK signalling in whole midguts from wild-type control and EGFR knockdown in stem/progenitor cells using escargot-gal4, UAS-gfp. Results are presented relative to rpl32 levels. n (number of biological replicates) = 4 or 3, each dot represents an independent RNA sample from >10 midguts per sample. Where indicated: *p<0.05, **p<0.01, ***p<0.001, ****p<0.0001; Two-way ANOVA followed by Sidak’s multiple comparisons test. All error bars represent SD.
Author response image 2
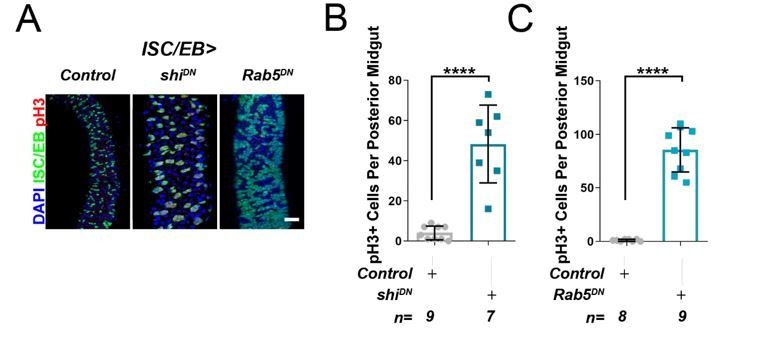
Inhibition of cell membrane internalisation induces hyperproliferation.
Representative confocal images of adult posterior midguts from wild-type control animals, or following the overexpression of temperature sensitive dominant negative dynamin (shiDN), or dominant negative Rab5 (Rab5DN) in stem/progenitor cells using escargot-gal4, UAS-gfp (ISC/EB>; green). Scale bar = 50 µ. Quantification of pH3 counts, as in A, in guts expressing dominant negative dynamin. Quantification of pH3 counts, as in A, in guts expressing dominant negative Rab5. Where indicated: *p<0.05, **p<0.01, ***p<0.001, ****p<0.0001; Student’s t-test. All error bars represent SD.
Tables
Appendix 1—key resources table
| Reagent type (species) or resource | Designation | Source or reference | Identifiers | Additional information |
|---|---|---|---|---|
| Strain, strain background (Mus musculus) | VillinCreER | el Marjou et al., 200410.1002/gene.20042 | NA | |
| Strain, strain background (Mus musculus) | Ralafl/fl | Peschard et al., 2012 10.1016/j.cub.2012.09.013 | RRID:MGI:5505291 | |
| Strain, strain background (Mus musculus) | Ralbfl/fl | Peschard et al., 201210.1016/j.cub.2012.09.013 | RRID:MGI:5505291 | |
| Strain, strain background (Erwinia carotovora carotovora 15) | Ecc15 | B. Lemaitre; (Basset et al., 2000)10.1073/pnas.97.7.3376 | NA | |
| Genetic reagent (Drosophila melanogaster) | en> | BDSC | RRID:BDSC_30564 | y1 w*; P{w+mW.hs=en2.4 GAL4}e16E |
| Genetic reagent (Drosophila melanogaster) | ISC/EB> | S. Hayashi; Goto and Hayashi, 1999 PMID:10393119 | NA | yw;esg-Gal4NP5130,UAS-GFP,UAS-GFPnLacZ/Cyo;tub-Gal80ts/Tm6B |
| Genetic reagent (Drosophila melanogaster) | Control | R. Cagan | NA | w[1118] |
| Genetic reagent (Drosophila melanogaster) | RalA-RNAi(1) | VDRC | RRID:FlyBase_FBst0477124 | P{KK108989}VIE-260B |
| Genetic reagent (Drosophila melanogaster) | RalA-RNAi(2) | BDSC | RRID:BDSC_29580 | y1 v1; P{y+t7.7v+t1.8=TRiP.JF03259}attP2 |
| Genetic reagent (Drosophila melanogaster) | wg-RNAi | VDRC | RRID:FlyBase_FBst0476437 | P{KK108857}VIE-260B |
| Genetic reagent (Drosophila melanogaster) | wg-RNAi | VDRC | RRID:FlyBase_FBst0450965 | P{GD5007}v13351 |
| Genetic reagent (Drosophila melanogaster) | EGFR-RNAi | VDRC | RRID:FlyBase_FBst0478953 | P{KK100051}VIE-260B |
| Genetic reagent (Drosophila melanogaster) | RalAwt | G. Hasan; (Richhariya et al., 2017); 10.1038/srep42586 | NA | P{UAS-RalA}3 |
| Genetic reagent (Drosophila melanogaster) | GEFmeso-RNAi | BDSC | RRID:BDSC_42545 | y1 v1; P{y[+t7.7] v[+t1.8]=TRiP.HMJ02116}attP40 |
| Genetic reagent (Drosophila melanogaster) | RalGPS-RNAi | VDRC | RRID:FlyBase_FBst0463650 | w[1118]; P{GD11683}v40596/TM3 |
| Genetic reagent (Drosophila melanogaster) | Rgl-RNAi | BDSC | RRID:BDSC_28938 | y1 v1; P{y[+t7.7] v[+t1.8]=TRiP.HM05149}attP2 |
| Genetic reagent (Drosophila melanogaster) | EGFRwt | BDSC | RRID:BDSC_5368 | y1 w[*]; P{w[+mc]=UAS Egfr.B}32-26-1 |
| Genetic reagent (Drosophila melanogaster) | EGFRA887T | BDSC | RRID:BDSC_9533 | w[*]; P{w[+mC]=Egfr0.2.A887T.UAS}8-2 |
| Genetic reagent (Drosophila melanogaster) | EGFRλtop | BDSC | RRID:BDSC_59843 | w[*]; P{w[+mC]=UAS Egfr.lambdatop}3/TM6C, Sb1 |
| Genetic reagent (Drosophila melanogaster) | RasV12(1) | BDSC | RRID:BDSC_64196 | w[*]; P{w[+mC]=UAS-Ras85D.V12}2 |
| Genetic reagent (Drosophila melanogaster) | RasV12(2) | BDSC | RRID:BDSC_64195 | w[*]; P{w[+mC]=UAS-Ras85D.V12}TL1 |
| Genetic reagent (Drosophila melanogaster) | Ras-RNAi | VDRC | RRID:FlyBase_FBst0478466 | P{KK108029}VIE-260B |
| Genetic reagent (Drosophila melanogaster) | Src64wt | BDSC | RRID:BDSC_8477 | w[*]; P{w[+mC]=UAS-Src64B.C}2 |
| Cell line (Homo sapiens) | H1299 | ATCC CRL-5803 | RRID:CVCL_0060 | Authenticated through STR profiling Mycoplasma negative |
| Cell line (Homo sapiens) | HMT3522 T4-2 | V. Weaver, UCSF | RRID:CVCL_2501 | Authenticated through STR profiling Mycoplasma negative |
| Cell line (Homo sapiens) | HEK293-FT | Thermo Fisher Scientific | RRID:CVCL_6911 | Authenticated through STR profiling Mycoplasma negative |
| Antibody | Anti-GFP (Chicken polyclonal) | Abcam | RRID:AB_300798 | Drosophila IF (1:2000) |
| Antibody | Anti-Sox21a (Rabbit polyclonal) | B. Biteau; (Meng and Biteau, 2015) 10.1016/j.celrep.2015.09.061 | NA | Drosophila IF (1:2000) |
| Antibody | Anti-pERK (Rabbit polyclonal) | Cell Signalling Technology | RRID:AB_331646 | Drosophila IF (1:100); mouse IHC (1:400); western blot (1:1000) |
| Antibody | Anti-ERK (Rabbit polyclonal) | Cell Signalling Technology | RRID:AB_390779 | Drosophila IF (1:100); western blot (1:1000) |
| Antibody | Anti-ERK (Rabbit polyclonal) | Cell Signalling Technology | RRID:AB_330744 | Mouse IHC (1:40) |
| Antibody | Anti-rabbit IgG HRP-linked antibody (Goat polyclonal) | Cell Signalling Technology | RRID:AB_2099233 | Western blot (1:10,000) |
| Antibody | Anti-Phospho-Histone 3 Ser 10 (Rabbit polyclonal) | Cell Signalling Technology | RRID:AB_331535 | Drosophila IF (1:100) |
| Antibody | Anti-EGFR extracellular domain (Mouse monoclonal) | Sigma-Aldrich | RRID:AB_609900 | Drosophila IF (1:50) |
| Antibody | Anti-EGFR1 (Mouse monoclonal) | BDPharmingen | RRID:AB_2096589 | Capture-ELISA (5 µg/mL) |
| Antibody | Anti-c-MET (Goat polyclonal) | R&D Systems | RRID:AB_355289 | Capture-ELISA anti-HGFR (5 µg/mL) |
| Antibody | Anti-Alpha5 beta1 integrin (Mouse monoclonal, Clone V5) | BDPharmingen | RRID:AB_396007 | Capture-ELISA Anti-CD49e (5 µg/mL) |
| Antibody | Anti-Transferrin receptor (Human monoclonal) | BDPharmingen | RRID:AB_395918 | Capture-ELISA CD71 antibody (5 µg/mL) |
| Antibody | Alexa Fluor 488 anti-chicken-IgY (H + L) (Goat polyclonal secondary antibody) | Invitrogen | Cat#A-11039 RRID:AB_142924 | Drosophila IF (1:100) |
| Antibody | Alexa Fluor 594 anti-rabbit-IgG (H + L) (Goat polyclonal secondary antibody) | Invitrogen | Cat#A-11037 RRID:AB_2534095 | Drosophila IF (1:100) |
| Antibody | Alexa Fluor 594 anti-mouse-IgG (H + L) (Goat polyclonal secondary antibody) | Molecular Probes | RRID:AB_141672 | Drosophila IF (1:100) |
| Antibody | Alexa Fluor 594 anti-mouse-IgG (H + L) (Goat polyclonal secondary antibody) | Invitrogen | RRID:AB_2534091 | Drosophila IF (1:100) |
| Recombinant DNA reagent | pLKO.1-puromycin | Moffat et al. Cell. 2006 Mar 24. 124(6):1283–98 | RRID:Addgene_10878 | |
| Recombinant DNA reagent | VSVG | Trono lab, unpublished, donated to Addgene | RRID:Addgene_12259 | |
| Recombinant DNA reagent | SPAX2 | Trono lab, unpublished, donated to Addgene | RRID:Addgene_12260 | |
| Sequence-based reagent | Rho_Fwd | This paper | NA | TTGTCATCTTTGTCTCCTGCGA |
| Sequence-based reagent | Rho_Rev | This paper | NA | GTCAGGTGGGCAATGTACGA |
| Sequence-based reagent | Stg_Fwd | This paper | NA | CAGTAATAACACCAGCAGTTCGAG |
| Sequence-based reagent | Stg_Rev | This paper | NA | GTAGAACGACAGCTCCTCCT |
| Sequence-based reagent | Sox21a_Fwd | This paper | NA | AGACAATTAATACAGAGCTCGAGG |
| Sequence-based reagent | Sox21a_Rev | This paper | NA | GAGATGCTCGTCATGATGCC |
| Sequence-based reagent | Rpl32_Fwd | This paper | NA | AGGCCCAAGATCGTGAAGAA |
| Sequence-based reagent | Rpl32_Rev | This paper | NA | TGTGCACCAGGAACTTCTTGAA |
| Sequence-based reagent | Rala_Fwd | PrimerBank | ID#324072795 c2 | GCAGACAGCTATCGGAAGAAG |
| Sequence-based reagent | Rala_Rev | PrimerBank | ID#324072795 c2 | TCTCTAATTGCAGCGTAGTCCT |
| Sequence-based reagent | Ralb_Fwd | PrimerBank | ID#48762927 c1 | AGCCCTGACGCTTCAGTTC |
| Sequence-based reagent | Ralb_Rev | PrimerBank | ID#48762927 c1 | AGCGGTGTCCAGAATATCTATCT |
| Sequence-based reagent | ActB_Fwd | Liu et al., 201510.1371/journal.pone.0117058 | NA | TGACGTGGACATCCGCAAAG |
| Sequence-based reagent | ActB_Rev | Liu et al., 2015 10.1371/journal.pone.0117058 | NA | CTGGAAGGTGGACAGCGAGG |
| Sequence-based reagent | shScr | This paper | NA | CCGCAGGTATGCACGCGT |
| Sequence-based reagent | shRala | This paper | NA | GGAGGAAGTCCAGATCGATAT |
| Sequence-based reagent | shRalb | This paper | NA | CAAGGTGTTCTTTGACCTAAT |
| Sequence-based reagent | siRNA Rala (human) | Dharmacon | ONTARGETplus – Cat# L-009235-00-0005 | |
| Sequence-based reagent | siRNA Ralb (human) | Dharmacon | ONTARGETplus – Cat# L-008403-00-0005 | |
| Peptide, recombinant protein | EGF | Sigma | Cat# 11376454001 | |
| Peptide, recombinant protein | HGF | Sigma | Cat# H9661 | |
| Commercial assay or kit | High Capacity cDNA Reverse Transcription Kit | Applied Biosystems | Cat# 4368813 | |
| Commercial assay or kit | PerfeCTa SYBR Green FastMix (Low ROX) | Quanta Bio | Cat# 95074–012 | |
| Commercial assay or kit | VECTASHIELD Mounting Medium with DAPI | Vector Laboratories, Inc | RRID:AB_2336790 | |
| Commercial assay or kit | SuperSignal West Pico Chemiluminescent Substrate | Thermo Fisher Scientific | Cat# 34077 | |
| Commercial assay or kit | RNAeasy Mini Kit (50) | QIAGEN | Cat# 74104 | |
| Commercial assay or kit | Growth Factor Reduced Matrigel | BD Biosciences | 354230 | |
| Commercial assay or kit | Lipofectamine 2000 | Thermo Fisher Scientific | Cat# 11668027 | |
| Commercial assay or kit | Lenti-X Concentrator | Clontech | ||
| Chemical compound, drug | Glutamine | Thermo Fisher Scientific | 25030081 | |
| Chemical compound, drug | DMEM | Thermo Fisher Scientific | 12491015 | |
| Chemical compound, drug | FBS | Thermo Fisher Scientific | 26140079 | |
| Chemical compound, drug | L-Glutamine | Thermo Fisher Scientific | 25030081 | |
| Chemical compound, drug | Non-essential amino acids | Thermo Fisher Scientific | 11140050 | |
| Chemical compound, drug | Insulin | Sigma-Aldrich | I0516 | Insulin solution from bovine pancreas, 10 mg/mL insulin in25 mm HEPES, pH 8.2, BioReagent, sterile-filtered, suitable for cell culture |
| Chemical compound, drug | Transferrin | Sigma-Aldrich | T2252 | |
| Chemical compound, drug | Sodium selenite | Sigma-Aldrich | S5261 | |
| Chemical compound, drug | β-Estradiol | Sigma-Aldrich | E2758 | |
| Chemical compound, drug | Hydrocortisone | Sigma-Aldrich | H0888 | |
| Chemical compound, drug | Prolactin | Miltenyi Biotech | 130-093-985 | |
| Chemical compound, drug | Tyrphostin-AG1478 | Sigma-Aldrich | T4182 | |
| Chemical compound, drug | Erlotinib, HCL | Sigma-Aldrich | SML2156 | |
| Chemical compound, drug | Puromycin | Thermo Fisher Scientific | A1113803 | |
| Chemical compound, drug | Phalloidin | Invitrogen | A12380, A22287 | |
| Chemical compound, drug | Hoechst | H21486 | ||
| Chemical compound, drug | RIPA buffer | Sigma | R0278 | |
| Chemical compound, drug | Bradford reagent | Abcam | AB119216 | |
| Chemical compound, drug | NuPAGE 10% Bis-Tris gel | Thermo Fisher Scientific | NP0301BOX | |
| Chemical compound, drug | NuPAGE MOPS SDS running buffer | |||
| Chemical compound, drug | Trans-Blot Turbo PVDF membrane | Bio-Rad | 1704157 | |
| Chemical compound, drug | BSA | Sigma | A3294 | |
| Chemical compound, drug | Super Signal West Pico Chemiluminescent Substrate | Thermo Fisher Scientific | 34077 | |
| Software, algorithm | Fiji | NIH | 1.51n; https://fiji.sc/ | |
| Software, algorithm | GraphPad Prism 6 | GraphPad | RRID:SCR_002798 | |
| Software, algorithm | ZEN 2 lite | ZEISS | RRID:SCR_013672 | |
| Software, algorithm | 7500 Real-Time PCR Software | Applied Biosystems | RRID:SCR_014596 | |
| Software, algorithm | Harmony | PerkinElmer | ||
| Software, algorithm | BatchQuantify | (Johansson et al., 2019) 10.1016/j.stem.2019.02.002 | NA | https://github.com/emltwc/2018-Cell-Stem-Cell |
| Software, algorithm | EGFR_quant | This paper | NA | https://github.com/emltwc/EGFRProject |
| Software, algorithm | Blind scoring | (Perochon et al., 2021)https://doi.org/10.1038/s41556-021-00676-z | NA | https://github.com/emltwc/TracheaProject/blob/master/Blind_scoring.ijm |
| Other | Axio Observer | ZEISS | ||
| Other | LSM780 microscope | ZEISS | ||
| Other | BX51 microscope | Olympus | ||
| Other | Opera Phenix Z9501 | PerkinElmer | ||
| Other | 7500 Fast Real-Time PCR System | Applied Biosystems | ||
| Other | Trans-Blot Turbo system | Bio-Rad | 1704150 | |
| Other | HiSeq 2000 | Illumina | ||
| Other | ImageLock plate | Essen Biosciences |
Additional files
-
Supplementary file 1
Full genotype list.
Table containing a list of all Drosophila genotypes used in the paper.
- https://cdn.elifesciences.org/articles/63807/elife-63807-supp1-v2.xlsx
-
Transparent reporting form
- https://cdn.elifesciences.org/articles/63807/elife-63807-transrepform-v2.docx
Download links
A two-part list of links to download the article, or parts of the article, in various formats.
Downloads (link to download the article as PDF)
Open citations (links to open the citations from this article in various online reference manager services)
Cite this article (links to download the citations from this article in formats compatible with various reference manager tools)
RAL GTPases mediate EGFR-driven intestinal stem cell proliferation and tumourigenesis
eLife 10:e63807.
https://doi.org/10.7554/eLife.63807


