The mammalian rod synaptic ribbon is essential for Cav channel facilitation and ultrafast synaptic vesicle fusion
- Institute for Auditory Neuroscience and InnerEarLab, University Medical Center Göttingen, Germany
- Synaptic Nanophysiology Group, Max Planck Institute of Biophysical Chemistry, Germany
- Collaborative Research Center 1286 'Quantitative Synaptology', University of Göttingen, Germany
- Multiscale Bioimaging Cluster of Excellence (MBExC), University of Göttingen, Germany
Abstract
Rod photoreceptors (PRs) use ribbon synapses to transmit visual information. To signal ‘no light detected’ they release glutamate continually to activate post-synaptic receptors. When light is detected glutamate release pauses. How a rod’s individual ribbon enables this process was studied here by recording evoked changes in whole-cell membrane capacitance from wild-type and ribbonless (Ribeye-ko) mice. Wild-type rods filled with high (10 mM) or low (0.5 mM) concentrations of the Ca2+-buffer EGTA created a readily releasable pool (RRP) of 87 synaptic vesicles (SVs) that emptied as a single kinetic phase with a τ<0.4 ms. The lower concentration of EGTA accelerated Cav channel opening and facilitated release kinetics. In contrast, ribbonless rods created a much smaller RRP of 22 SVs, and they lacked Cav channel facilitation; however, Ca2+ channel-release coupling remained tight. These release deficits caused a sharp attenuation of rod-driven scotopic light responses. We conclude that the synaptic ribbon facilitates Ca2+-influx and establishes a large RRP of SVs.
Introduction
Animals use their sensory systems to interact with and navigate through their environment, and sensory maps are created for this purpose. This is especially true for vision, where perception of a real-world scene invariably asserts the location of objects in space. The building blocks for visual percepts originate from a visual field that is often in motion, and can vary greatly in luminance. Therefore, vertebrates have evolved complex processes that stabilize the eyes on the visual field (Straka and Baker, 2013), focus images on the back of the eye, and transform light of varying intensities into neural signals (Rivlin-Etzion et al., 2018).
The mammalian neural retina lines the concaved inner surface of the eye, and it forms a thin, multi-layered network. The outermost layer is a dense lawn of photoreceptors (PRs) (PR>1×105 mm−2). Each PR has a photosensitive outer segment, and at its opposite pole a single synaptic terminal forms in the first synaptic layer of the retina, the outer plexiform layer (OPL). There are two classes of PRs in the outer retina: rods and cones, which differ in several ways (for review, Grünert and Martin, 2020). For example, rods are ~103-fold more sensitive to light than cones (Cao et al., 2014), they only express rhodopsin while cones express one of the multiple types of opsin (Fain et al., 2010), and they outnumber cones at a ratio of 30:1 (Grünert and Martin, 2020). These features allow the outer retina to begin sorting light properties into neural signals. A variety of bipolar cell types carry PR signals to the inner retina (Light et al., 2012; Behrens et al., 2016; Tsukamoto and Omi, 2016), whereupon a plethora of chemical and electrical synapses are assembled into circuits (Demb and Singer, 2015) that serve in visual behaviors like night vision, color perception, and motion detection (Sterling, 2013).
PRs and bipolar cells form ‘ribbon synapses’ that are named after the electron-dense plate that projects from the presynaptic AZ into the cytoplasm. A subset of vertebrate sensory neurons express the protein ribeye, which is localized to ribbons (reviews: Lagnado and Schmitz, 2015; Moser et al., 2020). Deletion of the Ribeye gene eliminates synaptic ribbons (Maxeiner et al., 2016), but a unifying role for ribbons in synaptic transmission has not been identified. For instance, paired recordings between ribbonless rod bipolar cells (rbcs) and AII amacrine cells showed that synaptic transmission was greatly reduced without altering Ca2+ currents. The release deficit was reasoned to result from an uncoupling of Cav channels from SVs (Maxeiner et al., 2016). In contrast, ribbonless hair cells showed a milder impairment in exocytosis (Becker et al., 2018; Jean et al., 2018), and they produced well-defined substitute AZs that were largely capable of compensating for the loss of ribbon AZs (Jean et al., 2018).
More recent investigations into Ribeye-ko mice have used functional assays to probe how the ribbonless retinal circuitry behaves. First, recordings from on-α-ganglion cells showed that on-responses to increments in light were robust in the absence of ribbons; however, significant alterations were also documented (Okawa et al., 2019). Interpreting the results was challenged by the complexity of the retinal circuitry; in particular the overlap in rod and cone pathways (for review, Seilheimer et al., 2020). In a subsequent study based on electroretinograms Fairless et al., 2020 assigned the deficits in ribbonless circuitry to the rod pathway; however, the defects in the pathway were not identified. Therefore, in the current study, we examined how the ribbon influenced transmitter release from mouse PRs, which has not been tested directly; and in addition, studied the biophysics of exocytosis from mammalian PRs about which relatively little is known.
Mammalian rods express a single, large horseshoe-shaped ribbon that surrounds one or two rod bipolar dendrites that are on average ~250 nm away from the ribbon (for mouse; Hagiwara et al., 2018). In the dark, rods are maximally depolarized to produce a steady influx of Ca2+ that drives the continual turnover of SVs. This keeps synaptic glutamate high enough to activate the postsynaptic inhibitory mGluR6→TRPM1 pathway in rbc dendrites (Koike et al., 2010), which equates to the ‘dark signal.’ A weak flux of photons is sufficient to hyperpolarize the rod and momentarily slow exocytosis to create a ‘light signal’ (for review, Field and Sampath, 2017). Mathematical models have predicted that a rod ribbon needs to achieve a release rate ≥40 SVs-s−1 for the rbc mGluR6 pathway to activate and create a dark signal (Rao-Mirotznik et al., 1998; Hasegawa et al., 2006).
In the current study, high-resolution measurements of evoked SV exocytosis were made directly from mouse rods. The results demonstrated that the mouse rod ribbon creates multiple, uniformly primed sites for the release of 87 SVs. Their Cav1.4 channels activated rapidly (~200 µs) and exhibited unique forms of facilitation that influenced ultrafast release. These features were dependent on the ribbon, as ribbonless rods formed a much smaller readily releasable pool (RRP), and lacked Cav channel facilitation. The study provides experimental results that support longstanding proposals on the function of the rod ribbon synapse, and we discuss how synaptic ribbons contribute to retinal signaling.
Results
Super-resolution readout of SV turnover at an individual rod ribbon
The majority of rod somata reside in the outer nuclear layer (ONL) and send a spindly axon to their singular presynaptic terminal in the OPL, which contains an individual synaptic ribbon (Figure 1A and B). The minority of rod somata that lack an axon are positioned in the OPL, and they contain the synaptic ribbon within the soma compartment (Figure 1A). These axonless rods have been described before at the EM level (Li et al., 2016). We have previously reported making whole-cell, voltage-clamp recordings of Ca2+-currents from them (referred to as the rod ‘soma-ribbon’ configuration) in an attempt to better control the membrane potential about the ribbon AZ (Hagiwara et al., 2018). This point is illustrated here by assessing the membrane time constant for the soma-ribbon configuration. A −10 mV voltage step from a holding potential of −70 mV relative to the AgCl2 reference electrode, generated a rapidly decaying membrane current with a τ<30 µs (Figure 1C). Furthermore, the RC time constant calculated from the average access resistance (Ra ~30 MΩ) and whole-cell membrane capacitance (Cm ~1 pF; Supplementary file 1) produces a τRC ~ 30 µs.
Figure 1
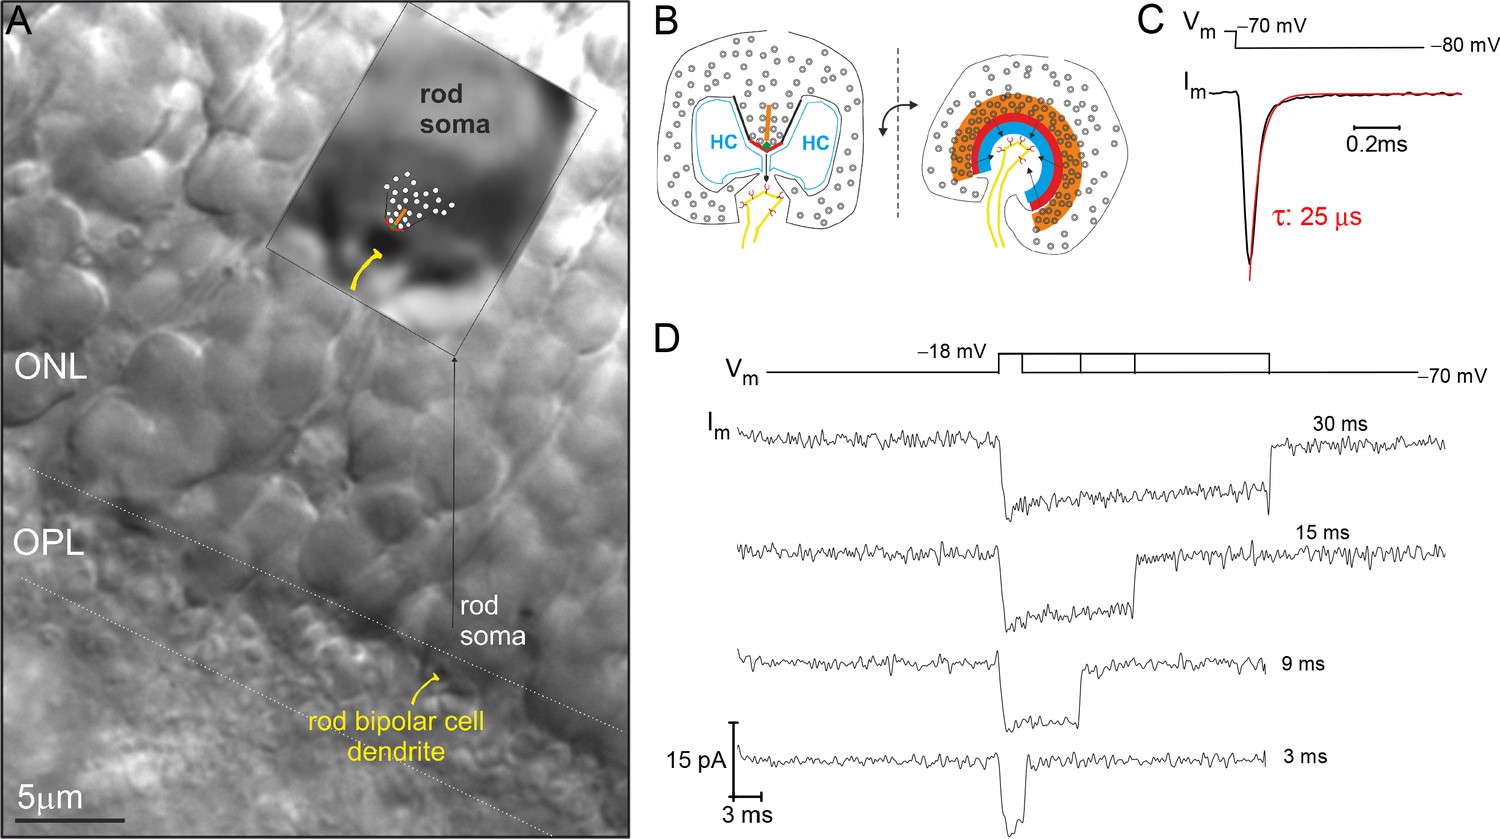
Example recording from a rod photoreceptor (PR) that lacks an axon.
(A) Image of a retinal slice centered on PR terminals in the outer plexiform layer (OPL) and somata in the outer nuclear layer (ONL). The inset shows a zoomed in view of an axonless rod soma-ribbon in the OPL, to which the synaptic ribbon synapse has been drawn into the image for reference. (B) Illustration of the major components of the rod ribbon synapse. The two images are rotated by 90° relative to the plane of the ribbon. Legend: ribbon (orange), active zone (thick red line), arciform density (green diamond), ribbon flanked by synaptic ridges (thick black lines), horizontal cells (HC, in blue), and rod bipolar cell dendrite (yellow) with mGluR6 receptors (red). (C) The membrane current (Im) transient measured from a rod soma-ribbon in response to a brief hyperpolarizing voltage step. Current trace taken prior to compensating whole-cell membrane capacitance (Cm). (D) Series of Ca2+-currents measured from an individual rod in response to voltage steps for the indicated durations. See Figure 2 for the corresponding evoked release from this rod.
Being able to control and monitor membrane voltage with high temporal precision makes it possible to quantitatively study voltage-dependent Ca2+-channels (Cav) and Ca2+-triggered fusion of SVs. A series of voltage-dependent Ca2+-current (ICa) traces, generated with depolarizing voltage steps (Vstep) to −18 mV for different durations, highlights the tight voltage control of ICa (Figure 1D; 10 mM EGTA in the whole-cell pipette). Next, to assess the extent of Ca2+-triggered SV fusion associated with each depolarization, the sine wave-based, lock-in amplifier method was implemented to measure changes in whole-cell Cm (Lindau and Neher, 1988). A depolarization evoked increase in Cm can be attributed to the incorporation of SV membrane, as long as there are no corresponding changes in conductance that can interfere with the estimation of Cm (see Materials and methods for details). The examples in Figure 2A and B illustrate these points. First, the response to a 9 ms step depolarization generated a robust increase in Cm, which remained elevated at a fixed level for the 0.5 s post-stimulation period captured in Figure 2A. Second, a sequence of evoked responses presented over a longer time span showed a pronounced jump in Cm following each stimulation, while Gm and Gs were not noticeably changed by the stimulations (Figure 2B). This presentation also shows that subsequent to the evoked ΔCm, the membrane was endocytosed in the following ways: linearly, exponentially, and/or as abrupt downward steps (Figure 2B). Rarely were large (>2 fF) downward steps in Cm observed, such as the one between the 3 and 9 ms stimulations in Figure 2B (downward arrow). Given the diversity of endocytotic responses, they were not quantified further in the current study.
Figure 2
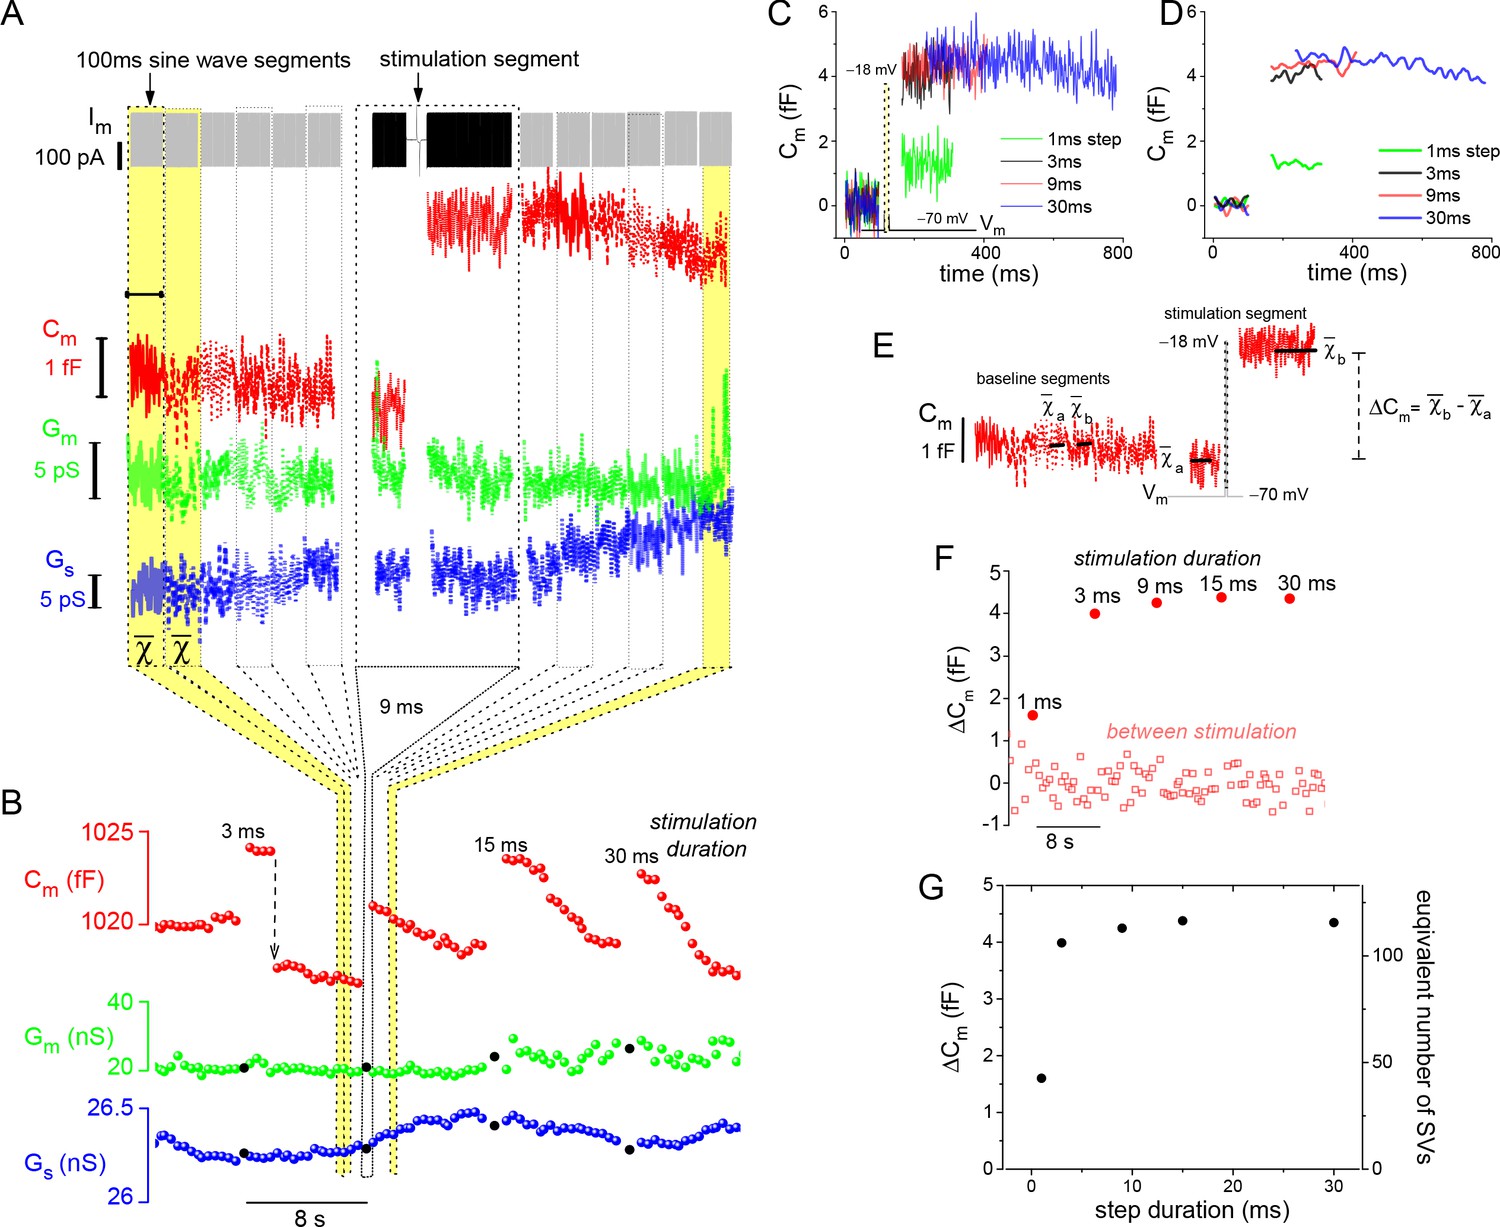
Resolution and analysis of evoked ΔCm.
(A) The Im presented at the top of the figure is dominated by the sine-wave voltage protocol used to derive the lock-in amplifier outputs: Cm, Gm, and Gs. The protocol consisted of a series of 100 ms sine-wave segments presented in gray, which bracket the stimulation segment depicted in black (arrow points to the 9 ms depolarizing voltage step). (B) Responses to a series of step depolarizations for the indicated durations are presented. The approach used to bin the data in (A) and create the plot in (B) are illustrated schematically. The Gm and Gs data points that are filled in black mark the stimulation segments. The dashed, downward pointing arrow following the 3 ms stimulation highlights an unusually large endocytotic, downward step in Cm (see text). (C, D) Plot the individual Cm traces for each evoked response. Traces in (D) were low-pass filtered to a corner frequency (fc) of 20 Hz, and in (C) a fc of 200 Hz was used. (E) Illustrates how ΔCm was quantified over both baseline (between stimulation) and stimulation segments (see Materials and methods). (F) Chronological plot of ΔCm during baseline and stimulation segments. (G) Summary plot with two y-axes: ‘ΔCm’ and ‘equivalent number of SVs,’ versus step duration (x-axis). The conversion factor for calculating the number of SVs is described in Materials and methods. The ICa traces measured from this cell are presented in Figure 1C. SV, synaptic vesicle.
In contrast to membrane endocytosis, the analysis of evoked membrane exocytosis was straightforward. An overlay of individual Cm traces shows that the magnitude of the evoked ΔCm responses were similar for step durations >1 ms (Figure 2C and D). To quantify stimulated and baseline changes in Cm, ΔCm was estimated as indicated in Figure 2E, and then plotted in sequence over the course of the experiment (Figure 2F). Finally, the evoked ΔCm was plotted per stimulation (pulse duration). In addition, the number of SVs corresponding to each ΔCm was plotted on the opposite axis (Figure 2G), which was calculated by dividing ΔCm by the Cm of a single SV: 37.6 aF (1 aF=10–18 F; see Materials and methods for estimates of SV Cm); hence, a ΔCm ~4 fF is equivalent to the fusion of 106 SVs.
Cav channels activate rapidly and exhibit moderate inactivation
The type of voltage-gated calcium channel that supports exocytosis from rod ribbons is the L-type, Cav1.4 channel. A feature that sets Cav1.4 channels apart from other L-type channels is that their expression is limited to PR terminals (for review, McRory et al., 2004; Pangrsic et al., 2018). By comparison, other L-type channels, such as Cav1.2 and 1.3, are expressed throughout the nervous system, and additionally in cardiac, endocrine, and neuroendocrine cells, and such prevalence has led to significantly more insight into their biophysical properties (Dolphin and Lee, 2020). Therefore, some of the basic biophysical properties of mouse rod Cav1.4 channels, which have not been described to our knowledge, are reported next.
The voltage-dependence of Ca2+-current activation was examined over a range of voltage steps when the rods were filled with 10 mM EGTA to minimize Ca2+-activated Cl−-currents (Bader et al., 1982). The depolarization stimulated ICa showed a steep dependence on voltage (Figure 3A), and this was quantified by measuring peak-ICa amplitude (Figure 3B) and calcium tail-current (ICa-tail) amplitude (Figure 3C). Specifically, a depolarizing Vstep to −40 mV produced a peak-ICa: −0.89±0.34 pA, and by −10 mV the maximal peak-ICa was reached: −14.15±0.75 pA (9 cells; Figure 3D) (the liquid junction potential: Elj=8.9 mV was not subtracted from Vstep; see Materials and methods). Fitting the peak-ICa versus Vstep curve with a Boltzmann equation from −60 to −10 mV (point of maximal ICa) gave a half-maximal peak-ICa at a voltage of −28.7±0.4 mV (Supplementary file 3). Next, to better estimate the point when half of the available Cav channels opened (V1/2), a modified Boltzmann I-V equation was used, one that accounted for Vrev and Gmax (see Materials and methods). This approach gave a V1/2=−23.4±1.0 mV (fit presented in Figure 3D; see Supplementary file 3 for additional statistics). Finally, ICa-tail amplitudes were measured to determine the fraction of channels that opened at each Vstep, and this gave a half-maximal amplitude at approximately −30 mV (dashed line in Figure 3E). However, fitting the curve with a sigmoidal equation to estimate V1/2 was not possible, because the ICa-tail amplitudes appeared to decrease at Vstep values positive to −10 mV (Figure 3E). This behavior may indicate a degree of Cav channel inactivation within the 10 ms voltage step (see below). Therefore, the best estimate for half-maximal channel activation was derived from the modified Boltzmann I-V equation, and after subtracting Elj, the V1/2 is estimated to be ~ −33 mV.
Figure 3
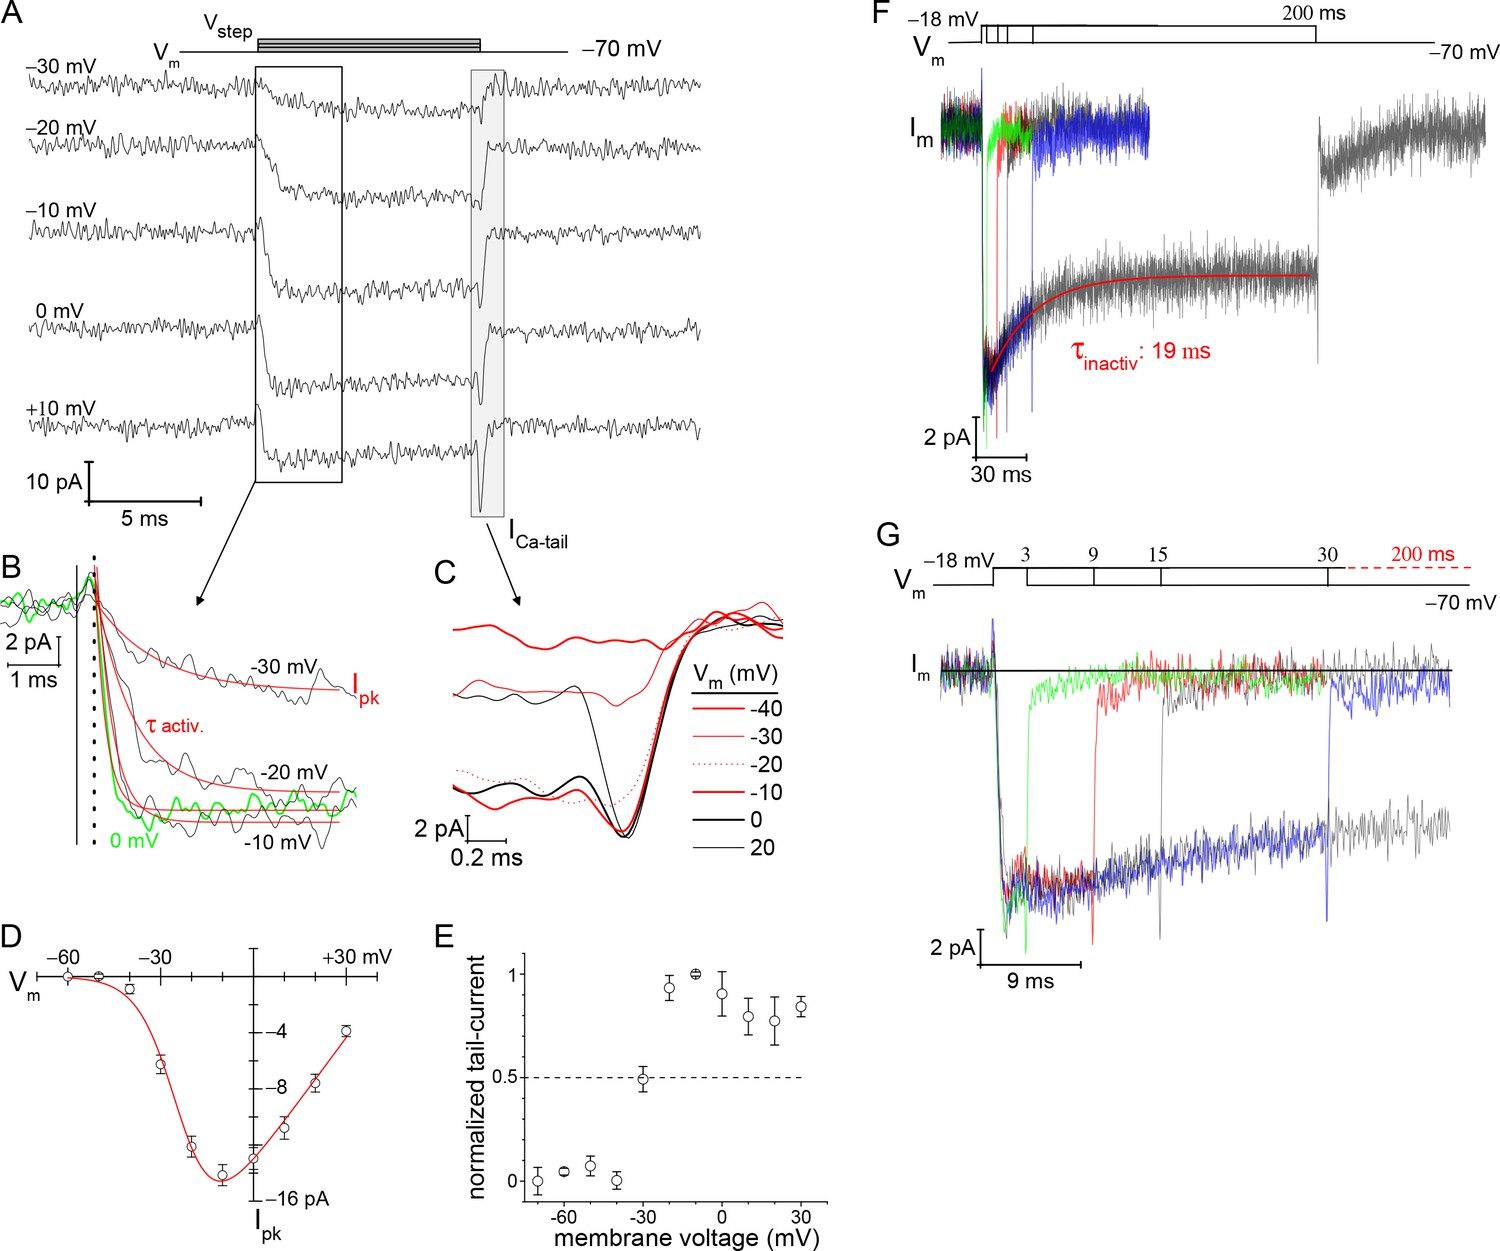
Voltage-dependence of Ca2+-currents.
(A) Presents a subset of individual ICa traces taken from a rod filled with 10 mM EGTA. The 10 ms voltage steps were delivered in descending order from +30 to −80 mV at −10 mV increments, every 3 s. (B) Zoomed in view of ICa activation. Start of the Vstep is indicated with the vertical solid line, and the onset of ICa is indicated with a vertical dashed line. An exponential function was used to fit (red lines) each ICa trace from which τactivation and peak-ICa were ascertained. (C) Overlay of tail currents from (A). (D) Averaged peak-ICa versus Vstep fit with a modified Boltzmann I-V equation (V1/2: −24.0±1.3, slope (dx): −6.2± 0.6 mV/e, Vrev: +44.6±2.6 mV, and Gmax: 0.30±0.02 pA-mV−1; 9 cells; see Supplementary files 2 and 3). (E) Normalized ICa-tail plotted over Vstep (4 cells). (F, G) Overlay of average membrane currents in response to voltage steps from −70 to −18 mV for the indicated durations (averages from 7 to 13 cells). The ICa associated with the 200 ms step depolarizations (7 cells) were fit as a single exponential decay (τinactivation). (G) Zoomed in view of the shorter duration voltage steps highlights the rapid return of ICa to baseline (subsequent to the transient ICa-tail).
Recordings from salamander rods have demonstrated that ICa inactivation was absent in the presence of high concentrations (i.e., 10 mM) of intracellular EGTA, demonstrating an absence of voltage-dependent inactivation (VDI); however, lowering intracellular EGTA to ~0.1 mM gave rise to Ca2+-dependent inactivation (CDI) (Corey et al., 1984; Rabl and Thoreson, 2002). To assess the situation in mouse rods, 200 ms steps were examined for signs of ICa inactivation with 10 mM EGTA in the pipette. Steps from −70 to −18 mV, for varying durations, showed a decline in ICa amplitude within the first 30 ms (Figure 3F). For instance, the 200 ms depolarizations had an initial peak-ICa=−13.2±0.8 pA, and ended with a mean current ICa=−9.2±1.2 pA (7 cells). This 31% decay in ICa had a τ=19.46±0.01 ms (7 cells; Figure 3F). The overlay of ICa traces shows that the membrane current approached baseline within 1 ms after repolarization (Figure 3G), which is in accord with Cav channel deactivation (Figure 3C), but not Ca2+-activated tail-currents (see below). This result is distinct from previous studies on salamander rods that did not find evidence for VDI (Bader et al., 1982; Corey et al., 1984; Rabl and Thoreson, 2002). A notable difference in our study and that by Corey et al., 1984 is that they replaced all intra- and extra-cellular monovalent cations with 100 mM TEA+ to eliminate contributions from Kv channels (Beech and Barnes, 1989). In contrast, we only used 20 and 35 mM TEA+ inside and outside, respectively (see Materials and methods), which may not have been adequate to fully block Kv channel currents. For these reasons, it is tentatively concluded that a fraction of the Cav channels are sensitive to VDI.
Expanding the Ca2+-domain triggers Ca2+-activated channels
It has been predicted that by changing intracellular EGTA from 10 to 0.5 mM, the Ca2+-domain about the Cav channels will expand in size from ~6 to ~ 210 nm, respectively, during depolarization (Neher, 1986). At ribbon synapses, high intracellular concentrations of EGTA (~10 mM) restrict the domain of evoked, free Ca2+ to the base of the ribbon where the L-type Cav channels are located (Zenisek et al., 2003; Neef et al., 2018; for review, Moser et al., 2020). A potential consequence of elevating intracellular Ca2+ is that the Ca2+-dependent Cl− currents (ICl(Ca)) will be activated (Bader et al., 1982). The TMEM16A/B channels are localized to mouse rod terminals (Stöhr et al., 2009; Caputo et al., 2015), and are thought to underlie Ca2+-dependent Cl−-currents in salamander PRs (ICl(Ca)) (Mercer et al., 2011). The above measurements made with 10 mM EGTA in the pipette did not exhibit a current resembling ICl(Ca) (Figure 3F), which concurs with earlier studies on salamander and porcine rods that concluded ICl(Ca) was blocked with high concentrations of EGTA (Bader et al., 1982; Cia et al., 2005). In contrast, when the intracellular concentration of EGTA was lowered to 0.5 mM, two new features appeared. First, an outward-current slowly developed during the 10 ms voltage step depolarizations (presumed Cl− influx). Second, at the end of the voltage step when the rod was repolarized to −70 mV, a inward tail-current appeared (presumed Cl− efflux), which slowly deactivated over the course of several milliseconds (Figure 4A–B). These features are indicative of a Ca2+-dependent Cl− current (Bader et al., 1982; Cia et al., 2005).
Figure 4
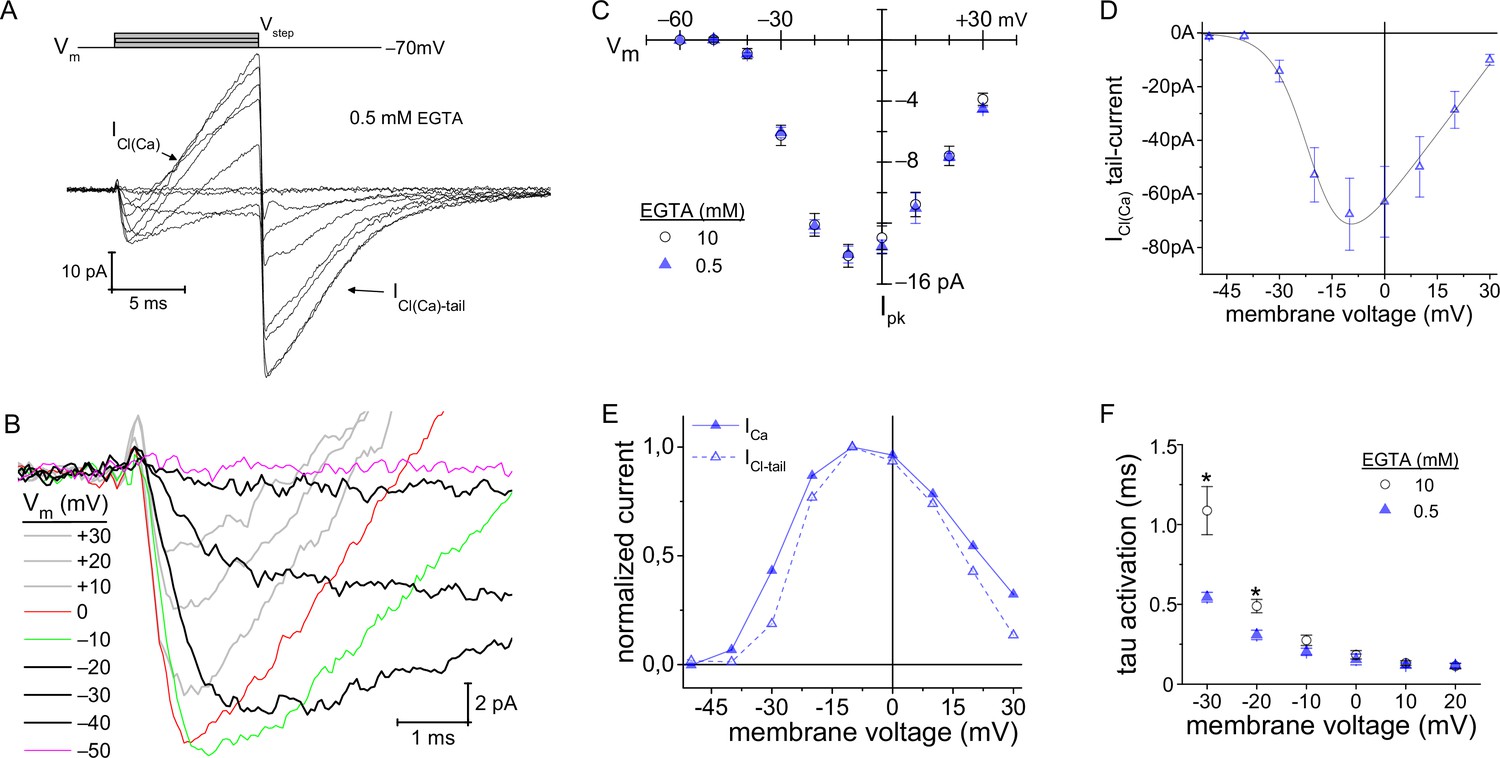
Lowering intracellular Ca2+-buffering accelerated Cav channel activation kinetics.
(A, B) With 0.5 mM EGTA in the pipette, an outward current developed during the Vstep (designated as ICl(Ca)), which became an inward current upon repolarization (ICl(Ca)-tail). (B) Expanded view of the activation portion of the current traces from (A). Traces from 8 cells were averaged; depolarization protocol is described in Figure 3A. (C) Overlay of average peak-ICa plotted over Vstep made from experiments with an intracellular concentration of either 0.5 (8 cells) or 10 mM EGTA . (D) Average ICl(Ca)-tails versus Vstep (6 cells). Modified Boltzmann I-V fit (blue trace): V1/2: −20.4±0.5, slope (dx): −5.6±1 mV/e, Vrev: +35.8±3.8 mV and Gmax: 1.41±0.44 pA-mV−1 (6 cells; see Supplementary file 4). (E) Normalized average ICl(Ca) and peak-ICa from 0.5 EGTA data in (C, D) plotted over Vstep (error bars excluded). (F) Plot of τactivation versus Vstep with an intracellular concentration of either 0.5 or 10 mM EGTA (*: p≤0.006; see Supplementary file 2).
If ICl(Ca) is indeed Ca2+-dependent, then it should follow the voltage-dependence of ICa. To evaluate this, first peak-ICa had to be measured over the range of Vstep values, under the condition of low intracellular EGTA. The results show that peak-ICa values were virtually identical for the two intracellular EGTA concentrations (Figure 4C; see Supplementary file 2); however, differences in activation kinetics were apparent (described below). Next, the peak-ICl(Ca)-tail currents were measured as a function of Vstep. Since the ICl(Ca)-tail amplitudes were measured at −70 mV (Vrest), regardless of the preceding depolarizing Vstep, the ICl(Ca)-tail amplitudes should be proportional to the number of TMEM16 channels opened; whereas, the amount of Ca2+ entering depended on the Vstep. The results show that peak-ICl(Ca)-tail and peak-ICa currents followed a similar voltage-dependence (Figure 4C and D). This is best illustrated in the overlay of the normalized currents versus Vstep, and here the ICl(Ca)-tail amplitudes scaled in proportion to ICa over the entire range of Vstep values (Figure 4E; see Supplementary file 4 for Boltzmann fits). This demonstrates that the Ca2+-dependent current activated in proportion to the amplitude of peak-ICa. In summary, 10 mM EGTA blocked activation of the Cl−-channels in mouse rods, as has been described previously in studies on salamander and porcine rods (Bader et al., 1982; Cia et al., 2005; Mercer et al., 2011), which suggests the Ca2+-activated Cl−-channels are not localized within nanometers of the Cav channels.
Reducing intracellular EGTA accelerates Cav channel activation kinetics
It is known that cytoplasmic Ca2+ can facilitate the opening of Cav channels (Lee et al., 2000; Nanou and Catterall, 2018). This behavior has been documented at rat inner hair cell (IHC) ribbon synapses (Grant and Fuchs, 2008; Goutman and Glowatzki, 2011) and at central synapses (Borst and Sakmann, 1998), but it is not known if mammalian PRs support similar channel dynamics. Interestingly, when comparing results from experiments with 0.5 and 10 mM EGTA in the pipette, the activation kinetics were slowed to a greater extent at negative voltages when 10 mM EGTA was used. Specifically, with 10 mM EGTA, the time constant for ICa activation (τactiv) was lengthened sixfold when changing the Vstep from 0 to −30 mV (0.18±0.03 to 1.09±0.15 ms, respectively; 9 cells; Figure 4F), compared to the 3.4-fold lengthening of τactiv when 0.5 mM EGTA (0.16±0.03 to 0.55± 0.03 ms, respectively; 8 cells; Figure 4F). Furthermore, in the physiological range for Cav channel activation, τactiv was twofold faster at −30 mV (−40 mV after correction for Elj) when 0.5 mM EGTA was used (p: 0.003; Figure 4F). Comparison of activation kinetics for low (0.5 mM) and high (10 mM) EGTA shows that they converged at more depolarized voltages (Figure 4F; see Supplementary file 2). Assuming basal intracellular Ca2+ was higher when less EGTA was used, then the results can be interpreted as Ca2+-dependent facilitation of Cav channel activation kinetics (Borst and Sakmann, 1998); but not peak-ICa amplitude (Figure 4C). The results bare some resemblance to the behavior of Cav1.3 channels found in rat IHCs (Goutman and Glowatzki, 2011), in that the time to peak-Ca2+ current is shortened when residual intracellular Ca2+ is elevated; however, current onset delay was shortened in the case of IHCs.
The readily releasable pool of SVs is primed for ultrafast release
As outlined earlier in Figure 1, evoked ΔCm can be related to the number of SVs that fused with the plasma membrane. We first used this approach to determine how many SVs were near Cav channels and ready for release (Mennerick and Matthews, 1996; Moser and Beutner, 2000; Singer and Diamond, 2003; Thoreson et al., 2004; Graydon et al., 2011). This was achieved by using 10 mM EGTA in the pipette to restrict the evoked Ca2+-domain to within nanometers of the Cav channels, and a series of brief depolarizing voltage steps were given to map out the initial phase of release (Vrest=−70 mV, and Vstep=−18 mV; ordering of steps: 0.5, 1, 3, 9, 15, and 30 ms, with 8 s of rest between stimulations). Inspection of the plot of ΔCm versus step duration shows that the greatest change occurred within the first 3 ms of depolarization (Figure 5A). This point is documented in a couple of ways. First, the ΔCm generated with 3 ms steps reached 86% the amplitude of responses evoked with a 30 ms step (2.99±0.48 vs. 3.54±0.50 fF; p: 0.033, paired sample t-test; 7 cells; Figure 5A). The second approach involved making a comparison of exponential fits (τdepletion) to the average ΔCm versus step duration over different ranges of stimulations. Specifically, a fit from 0.5 to 9 ms gave a τdepletion=348 µs and an amplitude=3.27 fF (adjusted R-square=0.999), which was similar to the result attained when the fit was extended out to 30 ms: τdepletion=383 µs and amplitude=3.43 fF (adjusted R-square=0.992; 7–15 cells per step duration; Figure 5A). This suggests the initial kinetic release phase, referred to here as the fusion of the RRP of SVs, expired with a time constant <0.4 ms and amounted to 3.27 fF (~87 SVs). It is worth noting that only slightly more time was needed to empty the RRP than indicated by τdepletion. The 0.5 ms steps produced negligible changes in ΔCm (0.14±0.19 fF ~4 SVs; 8 cells); whereas, the 1 ms steps released ~70% of the RRP (ΔCm: 2.11±0.74 fF ~56 SVs; 14 cells). This indicates a fusion delay of ~0.5 ms, involving Cav channel activation kinetics and Ca2+-dependent activation of SV fusion, which was followed by ultrafast depletion of the RRP in under a millisecond. Similarly rapid depletion of the RRP of SV formed at goldfish Mb1 bipolar terminals (Mennerick and Matthews, 1996; Palmer et al., 2003) and rodent calyxes of Held (Schneggenburger et al., 2002) have been reported when using strong step depolarizations.
Figure 5
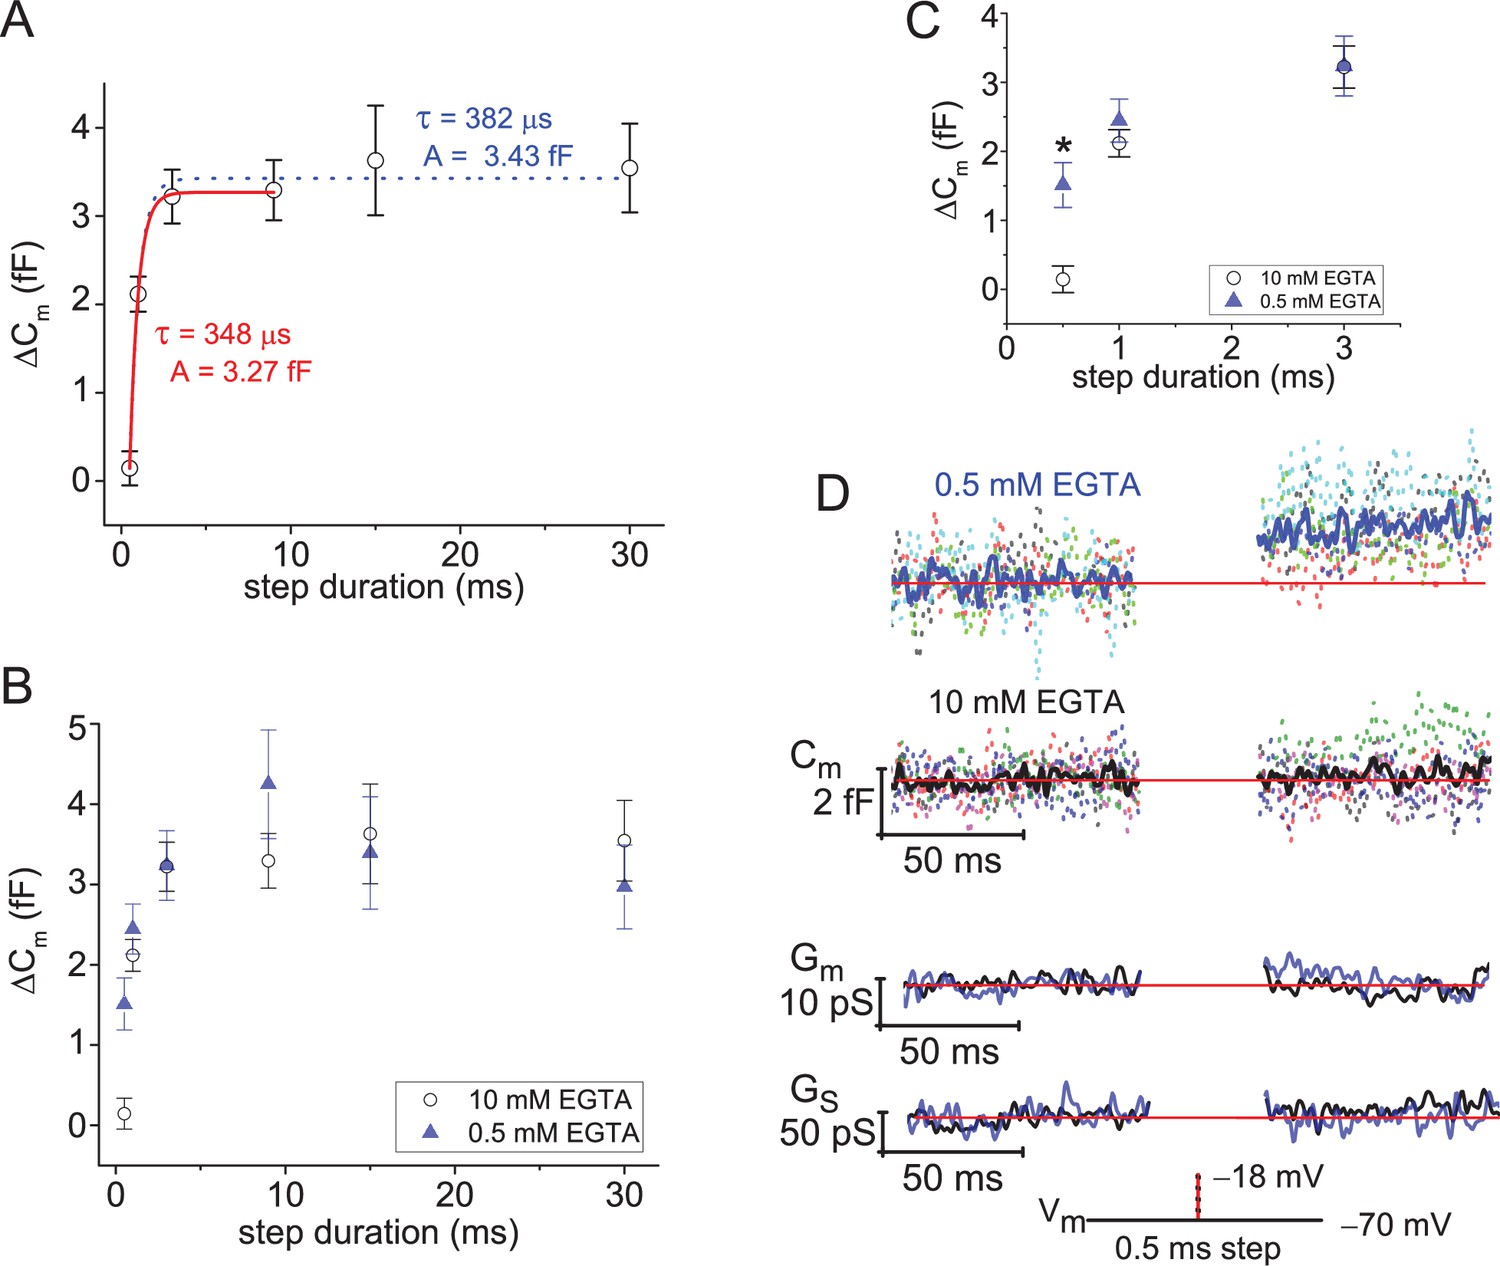
Ultrafast depletion of the RRP of SVs.
(A) Average ΔCm measured from rods filled with 10 mM EGTA and stimulated with a Vstep to −18 mV for durations from 0.5 to 30 ms. Single exponential fits to points from 0.5 to 9 ms (red curve), and from 0.5 to 30 ms (dotted curve). Stimulations were delivered in ascending order, and only a single cycle per cell. (B) Comparison of ΔCm derived from experiments with 0.5 or 10 mM EGTA in the pipette; voltage step durations: 0.5–30 ms. (C) Highlights the more rapid ΔCm at the singular time point of 0.5 ms when rods were loaded with 0.5 mM EGTA (*, p: 0.0016; 6 and 8 cells for 0.5 and 10 mM EGTA, respectively). (D) Summary of lock-in amplifier traces recorded during 0.5 ms step depolarizations with either 0.5 or 10 mM EGTA in the pipette (6 and 8 cells, respectively). Dashed Cm traces represent an overlay of individual recordings (cells; each a different color), and the Cm trace presented in bold font represents the average response. Only an overlay of the average responses in low and high EGTA are presented for Gm and Gs with the blue traces corresponding to 0.5 mM EGTA and black traces corresponding to 10 mM EGTA. RRP, readily releasable pool; SV, synaptic vesicle.
Before advancing to the next set of results, a description of the experimental design is given. The first expectation was that the RRP of SVs refilled in <8 s, which was the inter-stimulus interval used in the short step duration protocols. The second assumption was that evoked responses adapted over the cumulative time course of the experiment. To the first point, AMPA receptor-mediated EPSCs recorded from ground squirrel cb2 bipolars, paired to either a presynaptic rod or green-cone, recovered from paired-pulse depression within 0.3 s (Li et al., 2010). However, longer recovery times of ~1 s have been reported for green-cones paired to cone bipolars that express a majority of kainate receptors (DeVries, 2000). Finally, presynaptic release (ΔCm) measured from green-cones recovered from paired-pulse depression in 0.7 s (Grabner et al., 2016). Without additional studies on mammalian PRs to point to, we note that salamander rods and cones recovered from paired-pulse depression (assayed as EPSCs or ΔCm) with a τrecovery ~1 s or less (Rabl et al., 2006; Innocenti and Heidelberger, 2008). On this backdrop, one can assume that 8 s was enough time for mouse rods to recover their RRP of SVs. Furthermore, the data plotted in Figure 5A: ΔCm versus step duration, show a drastic difference between the first two stimulations given at 0.5–1 ms, but subsequent, longer duration stimulations (3–30 ms) showed only a modest incremental increase in ΔCm. This is interpreted as depletion of a finite pool of primed SVs (Mennerick and Matthews, 1996). Based on the literature and data, a stimulation interval <8 s would be justified; however, we also had to accommodate experiments on Ribeye-ko mice, described below, that may need more time to recover from stimulation. In addition, experiments with an intracellular concentration of 0.5 mM EGTA may need more time to clear intracellular Ca2+ between stimulations (Van Hook and Thoreson, 2015).
To address the second concern: time-dependent adaptation after whole-cell entry, the overall experimental time was minimized. This effort entailed starting stimulations ~ 35 s after gaining whole-cell access, and the protocol was circumscribed to mapping out the RRP of SVs (the stimulation protocol is described above). This protocol amounted to less than 2 min from the time of entry. Furthermore, an infusion time of 35 s was sufficient to affect Ca2+-buffering, because Ca2+-activated currents only appeared when 0.5 mM EGTA was in the pipette (Figure 4A versus Figure 3F). This conclusion was reinforced in the experiments presented in Figure 6A and B, and described below. These features suggest that rod terminals were adequately infused. For reference, a comparison to experiments performed on mouse rbcs is made. The rbc forms a single axon that is ~60 µm long, and it branches into multiple terminal synapses. Singer and Diamond, 2003 showed that after gaining whole-cell access via the rbc soma, synaptic terminals were filled with exogenous Ca2+-buffers within 2 min (Singer and Diamond, 2003).
Figure 6

ICa facilitation expedites depletion of the RRP.
(A, B) Overlay of average ICa traces in response to step durations of 0.5, 1, and 3 ms (*; sign. diff., p: 0.008). Vertical dashed lines indicate the moment of repolarization. (C) Comparison of average peak-ICa derived from high and low intracellular EGTA. Only voltage steps for 0.5 ms were statistically different when comparing different EGTA levels (p: 0.008; see text). The 0.5 and 1 ms steps were dominated by their tail-currents, which is why their amplitudes varied from step durations ≥3 ms. (D) Plot of ΔCm over QCa. All data points from experiments with 0.5 and 10 mM EGTA were treated as one group and fit with a single exponential equation (red curve) to estimate the size of the RRP (ΔCm amplitude) and the amount of QCa needed to release 63% (~1/e) of the RRP. (E) Plot of ΔCm and QCa values produced with 0.5 and 1 ms steps. * indicates a significant difference for QCa between 0.5 mM versus 10 mM EGTA; p: 0.04, and 6 and 9 cells, respectively. (F) Plot of ΔCm over peak-ICa for step durations: 0.5–30 ms (dashed lines partition data points by step duration). * indicates a significant difference in ICathat is described in (C), and differences in ΔCm are described in Figure 5C. RRP, readily releasable pool.
Lowering the intracellular Ca2+-buffer expedites release onset
To assess whether primed SVs resided outside the spatially constrained Ca2+-domain formed with 10 mM EGTA, as has been proposed to occur at goldfish bipolar AZs (Burrone et al., 2002), rods were filled with 0.5 mM EGTA and given a series of short depolarizing steps (as described above). Figure 5B plots ΔCm versus step duration for experiments carried out with either 0.5 or 10 mM EGTA in the pipette, and the results show a high degree of overlap within the range from 1 to 30 ms steps. In contrast, ΔCm in response to 0.5 ms step depolarizations were more than tenfold larger when rods were filled with 0.5 mM versus 10 mM EGTA (1.51±0.36 vs. 0.14±0.19 fF; p: 0.006; n: 6 and 8 cells; Figure 5C). This is also illustrated in the plots of individual Cm traces measured in response to 0.5 ms steps (Figure 5D). The results show that the size of the RRP of SVs was comparable under high and low Ca2+-buffering, but the RRP emptied faster with less intracellular EGTA. The fixed size of the RRP with 0.5 or 10 mM EGTA in the pipette is compatible with studies on mouse rod bipolars Singer and Diamond, 2003; whereas, the accelerated rate of release was highly reminiscent of goldfish bipolars (Burrone et al., 2002). To better understand this, we next considered whether the Ca2+-currents were differentially impacted by the two Ca2+-buffering conditions.
Facilitation of Cav channel activation kinetics expedites release onset
From the ICa traces used to profile the voltage-dependence of Cav channel activation kinetics (Figures 3B and 4B), and those associated with evoked release experiments (Figure 6A and B), a delay of ~300 µs existed prior to the onset of the ICa. Hence, in instances where 0.5 ms voltage steps were delivered to evoke release, only ~200 µs were available for the ICa to develop before the voltage step ended. Given that τactiv at −20 mV for low and high EGTA were 310 µs versus 489 µs, respectively (Figure 4F, and Supplementary file 2), it is expected that more channels opened with less Ca2+-buffering during the 0.5 ms steps. The results from evoked release show that the average ICa-tail resulting from 0.5 ms steps to −18 mV were approximately twofold larger when less EGTA was used (0.5 vs. 10 mM EGTA: −12.5±1.7 vs. −7.4±0.7 pA; p: 0.008 from 6 and 9 cells; Figure 6A and C). In contrast, the 1 ms steps produced comparable ICa-tail amplitudes under the two intracellular EGTA conditions (Figure 6A–C), because the step duration was >τactiv. Likewise, step depolarizations for 3 ms and longer gave similar peak-ICa amplitudes that ranged from −11 to −13 pA in both low and high Ca2+-buffering (Figure 6C). Since the Ca2+-buffering conditions used to evoke exocytosis differentially facilitated Ca2+-entry within the timeframe of Cav channel activation, the next analysis evaluated ΔCm as a function of the amount of Ca2+ that entered.
First, a plot of ΔCm versus the integral of ICa (QCa) was made from a combination of experiments with low and high intracellular EGTA (11 and 15 cells, respectively). The outcome was a continual, single exponential process that reached an amplitude of 3.31 fF (RRP ~88 SVs; Figure 6D and E), and 63% of the RRP was depleted (1/e) when QCa reached 4.66 fC=12,263 Ca2+ ions (1 Ca2+ ion=3.8 × 10⁻¹⁹C) (Figure 6D). A limitation here was that QCa was not calculated for steps >3 ms when 0.5 mM EGTA was used, because ICl(Ca) interfered with determination of QCa. The second comparison made here was ΔCm versus ICa amplitude. This is an alternative to QCa for indexing Ca2+ entry, and since peak-ICa does not appear to be impacted by ICl(Ca) (Figure 4C), all of the peak-ICa amplitude data points from experiments with low EGTA were included in Figure 6F; and a combination of ICa-tail (from 0.5 and 1 ms steps) and peak-ICa (steps≥3 ms) were plotted against ΔCm. A simple linear or exponential process was not realized; but instead, the data points were scattered into groups. The steps≥3 ms were grouped within a range of ΔCm values between 3 and 4 fF (equivalent to the RRP), and with a peak-ICa of approximately −12 pA (Figure 6F). The remaining data points were generated with 0.5 and 1 ms steps, and they produced a broad range of ΔCm values (0.2–2 fF) and ICa-tail amplitudes (−7.5 to −18 pA) that suggest ΔCm scaled with ICa-tail amplitude (Figure 6F).
In summary, plotting ΔCm against step duration demonstrates ultrafast depletion of an RRP of ~90 SVs in response to a moderate amount of Ca2+ entry (~10,000 ions). These features point to a critical role for Cav channel activation kinetics, and can be interpreted as a primed SV fusing once its neighboring channel(s) opens (Jarsky et al., 2010). To this point, our experiments with low intracellular EGTA led to the majority of Cav channels activating in ~0.6 ms (ICa onset delay: 300 µs plus the τactiv: 310 µs; Figures 4C, 6A and B; Supplementary file 2). This length of time was all that was needed to fuse the majority of the RRP of SVs (Figure 5B and C). Since 10 mM EGTA slowed Cav channel activation kinetics, we propose that the small time delay in Ca2+ entry is what produced a delay in exocytosis. For comparison, changing intracellular EGTA levels has been shown to accelerate the onset of Ca2+-entry and in turn accelerated release kinetics (Borst and Sakmann, 1998; Goutman and Glowatzki, 2011). However, it is also expected that the different EGTA levels will significantly alter the size of the Ca2+-domain formed about Cav channels. This raises the possibility that a larger Ca2+-domain might access additional releasable SVs, which release at different rates (Neher and Brose, 2018); however, the size of the RRP was not influenced by the two intracellular EGTA concentrations used in our study. For these reasons, we conclude that rods use a Ca2+-nanodomain that tightly couples Cav channels and SVs to control their release (reviewed here: Moser et al., 2020).
Since high-resolution immuno-fluorescence imaging showed that Cav channels were concentrated at the base of the rod ribbon (Dembla et al., 2020), we assume that this is where the RRP of SVs are docked. From electron microscopy (EM) studies on mouse rod ribbons, the number of SVs estimated to be docked at the base of the ribbon range from 60 to 86 (Zampighi et al., 2011; Cooper et al., 2012; Grabner et al., 2015); thus, approximately the size of the RRP of 87 SVs we have measured in this study. An additional 300 SVs reside near the plasma membrane along the synaptic ridges (Zampighi et al., 2011; for review, Moser et al., 2020), which significantly exceeds the size of the RRP SVs.
Ribbonless rods support only marginal evoked exocytosis
An earlier EM study, which introduced the Ribeye-ko mice, showed that the ribbonless rod AZs maintained 60% fewer SVs than wild type rod ribbon AZs (Maxeiner et al., 2016). This former study did not measure release from rods; therefore, we tested whether the loss of SVs from the AZ would affect the size of the RRP of SVs. The measurements were first performed with 10 mM EGTA in the pipette. The evoked responses recorded from ribbonless rods given 1 and 3 ms Vstep to −18 mV amounted to 0.21±0.20 and 0.68±0.34 fF, respectively (Figure 7A; 7 and 8 cells). These responses were ten- and fivefold smaller than wt ΔCm evoked with 1 and 3 ms steps: 2.12±0.20 and 3.22±0.31 fF (Figure 7B), respectively (p-values<0.0001 for wt vs. ko; 14 and 15 cells). Responses from ribbonless rods elicited with longer step durations (out to 30 ms) did not exceed the ΔCm elicited by 3 ms steps (Figure 7A). Fitting ΔCm versus step duration with a single exponential equation gave a τdepletion=560 µs and a ΔCm amplitude=0.84 fF (RRP ~22 SVs; 8 cells), which is approximately 24% the size of that measured in wt rods (ΔCm: 3.43 fF; Figure 7A).
Figure 7 with 1 supplement see all

Ribbonless rods lack Cav channel facilitation and form a small RRP of SVs.
(A) Average ΔCm measured from ribbonless rods filled with 10 mM EGTA and stimulated with a Vstep to −18 mV for durations from 0.5 to 30 ms. Single exponential fits to points from 0.5 to 30 ms. Wild-type results are presented for comparison (see Figure 5A). (B) Comparison of all ΔCm responses that were evoked with 1 and 3 ms steps, with either 0.5 or 10 mM EGTA in the pipette, and for wt and ko rods. All ko responses were significantly smaller than wt values, see text. (C) Plot of peak-ICa over Vstep. Ribbonless rods had significantly smaller peak-ICa at the indicated Vstep values (*, p-values<0.05), with comparisons made between wt vs. ko rods for 0.5 mM EGTA (blue dashed line) and 10 mM EGTA (black dashed line). See Figure 3A for a description of voltage step protocols and analysis. (D) ICa activation kinetics were significantly slower for wt rods filled with 10 mM EGTA (* indicates sig. diff.; see Supplementary file 2). (E, F) Average ICa traces measured from rods filled with 10 mM EGTA illustrate the significant differences in peak-ICa at the onset of depolarization (*; p<0.004 and 0.03 for 1 and 3 ms steps; n: 13 wt and 7 ko cells). See Supplementary file 3 for related results with 10 ms steps. (F) wt rods showed a faster rate of ICa inactivation than ko rods. At the end of the 30 ms steps, ICa amplitudes were no longer significantly different (nd; p>0.3); whereas, at the onset they were different (*; p<0.008; n: 8 wt and 7 ko). Supplementary file 3(G) Summary of average peak-ICa measured from wt and ko rods filled with 10 mM EGTA. The 1 ms steps were essentially tail-currents, and therefore larger in amplitude than peak-ICa measured from step durations ≥3 ms. Only the 9 ms steps did not show a significant difference between wt and ko. (H, I) Comparison of ICa recorded with 0.5 mM EGTA in the pipette. Averaged traces presented in (H). In (I), statistical comparisons show no difference in ICa amplitudes resulting from 1 ms steps (nd; p: 0.13; 9, and 11 cells each), while the currents generated with 3 ms steps were significantly larger for wt rods (*, p: 0.05; 9 and 12 cells each). (J, K) ΔCm in response to 1 and 3 ms steps plotted over peak-ICa in (J), and over QCa in (K). Dashed lines partition data points by step duration. See text for discussion. RRP, readily releasable pool; SV, synaptic vesicle.
To further investigate if the reduction in exocytosis measured from ribbonless rods reflected a reduction in the number of SVs available for release or an impairment in the coupling of Ca2+ influx to SVs, as concluded to occur at ribbonless retinal bipolar cells (Maxeiner et al., 2016), the concentration of intracellular EGTA was lowered. Ribbonless rods filled with 0.5 mM EGTA and given 1 and 3 ms stimulations produced ΔCm values that averaged 0.70±0.16 and 0.86±0.67 fF, respectively (Figure 7B; 12 cells for each group). In contrast, when wt rods filled with 0.5 mM EGTA were given 1 and 3 ms stimulations, ΔCm responses average 2.44±0.31 and 3.24±0.43 fF, respectively (Figure 7B; 11 cells in each group); thus, ribbonless rods generated evoked ΔCm that were <30% the size of wt responses (p-values for wt vs. ko, for 1 and 3 ms: 0.00016 and 0.00023). Overall, the results from the different Ca2+-buffering conditions indicate that the RRP formed by ribbonless rods was only ~22 SVs. Interestingly, the different EGTA concentrations did not significantly influence RRP size within either genotype, nor were the kinetics of depletion altered. Thus, these results suggest that the coupling of Ca2+ influx to exocytosis was not noticeably different between genotypes, but rather the number of release ready SVs distinguished wt from ribbonless rods.
Deleting the ribbon alters Cav channel properties
Previous work had indicated the density of Cav1.4 (α1F subunit) staining was altered in ribbonless rods (Maxeiner et al., 2016; Dembla et al., 2020). More to the point, the ribbon-shaped profile that Cav1.4 channels adhere to in wt rods was reduced in length by 50% in ribbonless rod terminals; however, protein levels of the Cav1.4 α1F subunit examined with Western blots were found to be similar in wt and ko retina (Maxeiner et al., 2016). To test if these changes affected the behavior of Cav1.4 channels, a comparison of Ca2+ currents from wt and ribbonless rods was made. Results derived from 10 ms voltage steps showed a significant overall reduction in the ribbonless rods peak-ICa over the range of Vstep’s from −30 to +30 mV (Figure 7C, and see Supplementary files 2 and 3). Specifically, with 10 mM EGTA in the pipette, the peak-ICa amplitude was approximately 35% smaller in ko rods than in wt rods (p<0.001 or smaller, depending on Vstep; 9 wt and 5 ko cells), and when 0.5 mM EGTA was used the amplitudes were 20% smaller than in wt controls (p<0.05 or less; 8 wt and 7 ko cells; Figure 7C, and Supplementary file 3). Additional biophysical values were derived from Boltzmann fits to the I-V curves. This analysis shows that ko rods had a maximal conductance ~34% smaller than wt values, and this was true for experiments performed with high and low intracellular EGTA concentrations (p: 0.024 and 0.029, respectively; Supplementary file 3); however, V1/2 for peak-ICa amplitude was not significantly changed with high or low EGTA (p ~ 0.17; 8 and 7 cells; Figure 7C and see Supplementary file 3). The final comparison made from the voltage steps was ICa activation kinetics. Currents activated at similar rates, except for wt rods filled with 10 mM EGTA, which exhibited much slower activation kinetics (Figure 7D and Supplementary file 3).
The reduction in peak-ICa was also observed in recordings that depolarized rods to −18 mV for different durations with 10 mM EGTA in the intracellular solution (Figure 7E–G); however, over time the difference faded as Cav channels in wt rods inactivated more rapidly. Specifically, 30 ms steps had an initial peak-ICa that was 35% larger in wt rods (−13.3±0.43 pA vs. ko: −8.7±0.8 pA; p: 0.0002; 7 per genotype; Figure 7D), but by the end of the 30 ms step, the wt and ribbonless ICa were no longer statistically different (−8.7±0.8 pA vs. −7.4±1.1 pA, p: 0.35; 7 cells each; Figure 7F). In the case of recordings with 0.5 mM EGTA in the pipette, the 3 ms depolarizations also produced slightly smaller ICa amplitudes in the ribbonless rods (Figure 7H, and see Figure 7I for statistical comparisons). In total, Cav channel behavior in ribbonless rods were distinguished from their wt counter parts in one or more of the following ways: they had a lower ICa density at the onset of depolarization, and they exhibited less current inactivation (or less facilitation at onset).
The influence of peak-ICa and QCa on evoked ΔCm were also summarized. The responses to 1 and 3 ms steps, with low or high intracellular EGTA are plotted for both genotypes in Figure 7J and K. These plots show that the ribbon greatly influenced exocytosis.
Ca2+-activated currents are reduced in ribbonless rods
Ribbonless rods ICl(Ca)-tail amplitudes were 60% smaller than wt rods (Figure 7—figure supplement 1; Supplementary file 4). This parallels the observation that ribbonless rods peak-ICa amplitudes were significantly smaller than wt rods (Supplementary file 3). Next, the voltage for half-maximal ICl(Ca) was reached at more negative membrane voltages than wt rods (V1/2 for ICl(Ca)), wt vs. ko: −20.4±0.5 vs. −22.8±0.6 mV, respectively; p: 0.016 (Supplementary file 4). In spite of these differences, the overall Ca2+-dependence of ICl(Ca) appeared similar for wt and ribbonless rods. This is illustrated in the plot of normalized ICl(Ca) and normalized peak-ICa over Vstep, which shows the ICl(Ca)−Vstep curves are bounded by the peak-ICa−Vstep curves (Figure 7—figure supplement 1).
Light responses in ribbonless mice are greatly reduced
The results so far show a stark reduction in the RRP of SVs. In the intact animal, this deficit is expected to preferentially impact rod signaling in the dark, a period when the rate of glutamate release is the highest. Normally, presenting a dim light flash to a dark-adapted retina will cause a momentary pause in glutamate release from rods, which in turn causes a depolarization (dis-inhibition) of postsynaptic rbcs. The magnitude of the light response, as assessed with electroretinogram (erg) recordings, will reflect the extent of rbc depolarization. If Ribeye-ko rods are unable to keep synaptic glutamate levels high enough to inhibit rbcs in the dark, then their scotopic-erg light responses should reflect this. To test this hypothesis, ergs were performed on dark-adapted mice, under scotopic test conditions (Figure 8A–B). The amplitude of the erg a-wave reflects phototransduction in the outer segments. Wild-type and Ribeye-ko mice had similar a-wave amplitudes across the range of flash intensities (Figure 8C). In contrast, the Ribeye-ko mice generated erg b-wave amplitudes that were only 52–38% the size of wt responses. This difference was significant over two decades of flash intensities (p-values ranging from 0.04 to 0.005; Figure 8D). Further descriptions of erg kinetics involved comparing the time-to-peak and rate-of-rise for the a- and b-waves. The results show that the time-to-peak for the a- and b-waves were not significantly different (Figure 8E–F), except for the b-wave at the highest flash intensity, which had a significantly longer time-to-peak (Figure 8F). To calculate rate-of-rise, the peak amplitude was divided by time-to-peak for each light flash intensity. The rate-of-rise for a-waves were nearly identical for the two genotypes (Figure 8G). The wt mice had a b-wave rate-of-rise that rose two- to threefold faster than the Ribeye-ko b-wave (p-values ranging from 0.04 to 0.009; Figure 8H), which mirrors the difference in b-wave amplitudes. These findings show that the ribbonless retina produced a significantly smaller b-wave under scotopic conditions; however, the kinetics were not significantly affected.
Figure 8
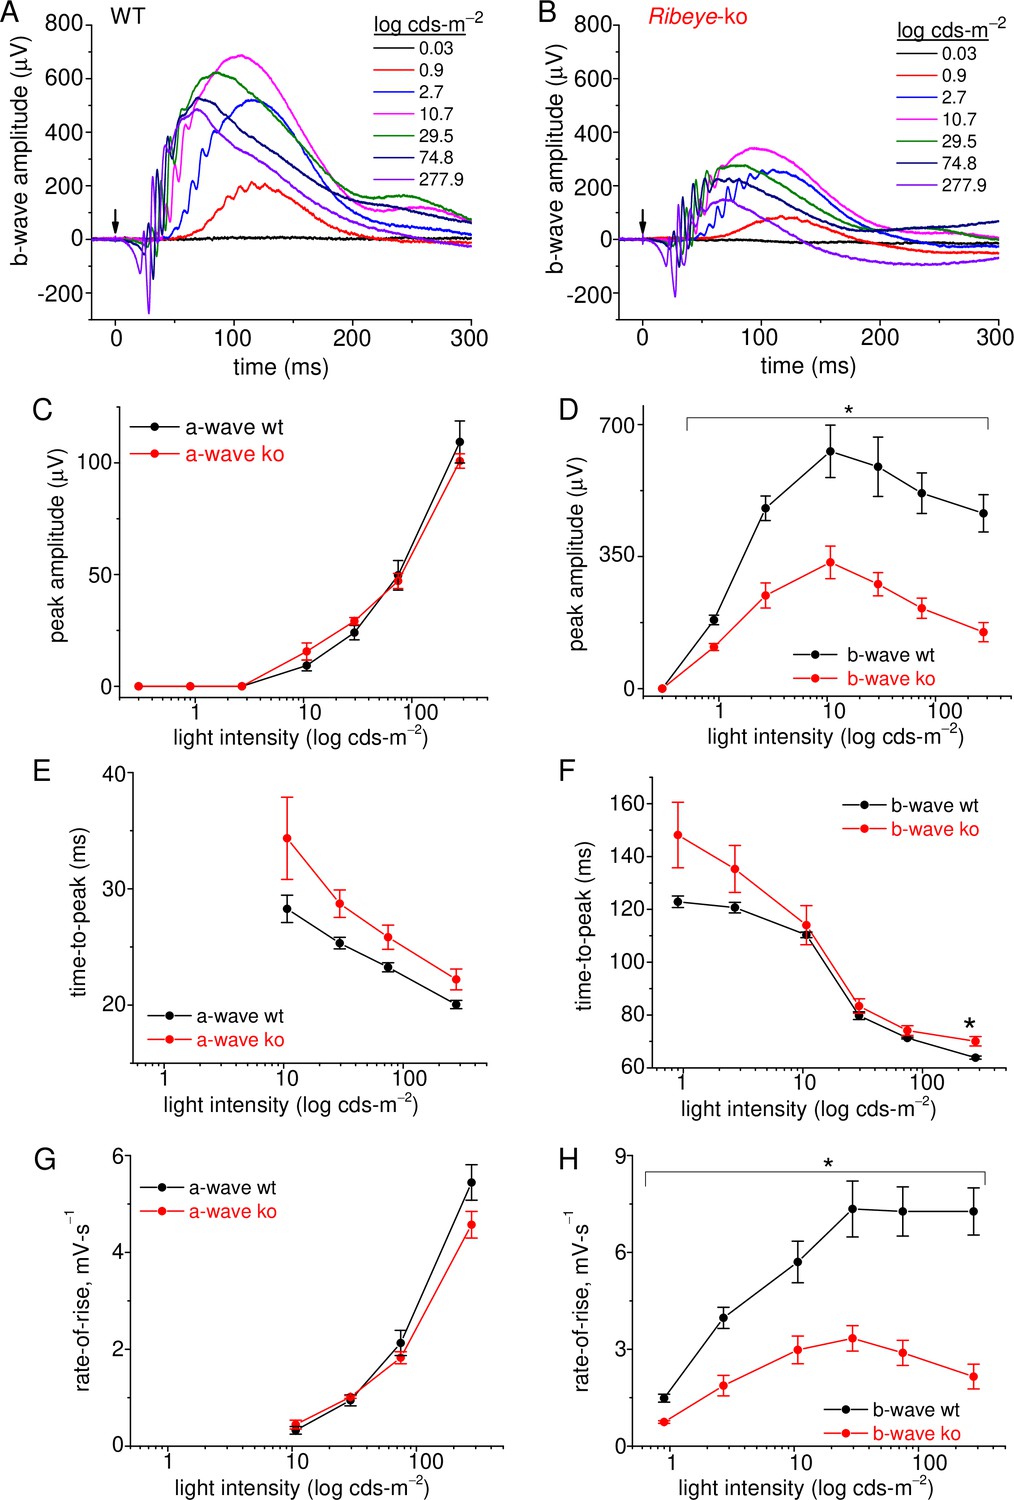
Rod-driven light responses are depressed in Ribeye-ko mice.
(A) Scotopic-ergs recorded from a dark-adapted wt animal. Light flash intensities are indicated in the graph. The arrow marks the moment of the 0.1 ms light flash. Responses are presented at full band-width, without offline filtering. (B) Scotopic-ergs recorded from a dark-adapted Ribeye-ko animal. (C) Summary of erg a-wave amplitudes plotted over the range of light flash intensities shows no significant difference between wt and ko mice. (D) Summary of dark-adapted erg b-waves measured from wt and ko mice shows a significant difference in responses at all flash intensities (*, p<0.04), except at the weakest intensity tested. (E) The a-wave time-to-peak values were not significantly different when comparing genotypes. (F) The b-wave time-to-peak values were similar, except the ko responses were significantly slower at the highest flash intensity (*, p: 0.034). (G) The a-wave rate-of-rise values were not significantly different. (H) The b-wave rate-of-rise was significantly faster for wt than ko mice across the full range of flash intensities (*; p-values: 0.04–0.009). Average values and statistical comparisons presented in C–H were derived from 4 ko and 3 wt mice.
Discussion
In this study, we set out to test whether the mammalian rod ribbon created a large RRP of SVs. This hypothesis was made decades earlier, motivated in part by results from EM studies on cat rod synapses Rao-Mirotznik et al., 1995; in addition, several quantitative computational studies have modeled how this synapse operates (Rao-Mirotznik et al., 1998; van Rossum and Smith, 1998; Hasegawa et al., 2006). What has been missing from the literature is evidence that the mammalian rod ribbon actually creates a large RRP of SVs. Therefore, the first question addressed was how many SVs were primed for release. High resolution, whole-cell Cm measurements of evoked release showed that the mouse rod was able to fuse 87 SVs in a single kinetic phase with a τdepletion of ~0.4 ms (Figure 5A). The ultrafast rate of depletion indicated the SVs were highly primed (super-primed) for fusion (Mennerick and Matthews, 1996; Neher and Brose, 2018). The significance of a single-exponential release phase is that the RRP was uniformly primed for fusion, rather than formed from a heterogeneous pool of ultrafast and fast primed states (Grabner and Zenisek, 2013). Furthermore, the size of the RRP of SVs was not altered when intracellular EGTA levels were changed, which is interpreted as proof that the release sites were within a few nanometers from the Cav channels. Since the Cav1.4 channels are concentrated along the base of the ribbon, this is where the SV release sites are presumed to be located (see schematic in Figure 9); but, is there enough room to accommodate a RRP of 87 SVs? Confocal images of immuno-labeled mouse rod ribbons have a contour length of 1.6 µm ( Grabner et al., 2015), and a length of 1.7 µm has been estimated from a study using Focused Ion Beam-EM,(Hagiwara et al., 2018). Two separate analyses of EM tomograms estimated ~60 (Zampighi et al., 2011) and ~77 (Cooper et al., 2012) SVs were docked at the base of the ribbon. The calculated maximal number of SVs that can be packed at the base of a 1.6 µm ribbon is 86 (Grabner et al., 2015), which is slightly higher than experimental estimates from EM studies, but approximately the same as the estimated RRP of 87 SVs.
Figure 9

Summary cartoon of the proposed functional organization of a rod AZ.
The wt AZ in (A) docks more SVs than the ribbonless AZ (B) .The two images in each panel are rotated by 90° relative to the plane of the ribbon. Legend: ribbon (orange), active zone (thick red line), arciform density (green diamond), ribbon flanked by synaptic ridges (thick black lines), horizontal cells (HC, in blue), and rod bipolar cell dendrite (yellow) with mGluR6 receptors (red). SV, synaptic vesicle.
To test the proposal that the ribbon contributes to the formation of release sites, ribbonless rods were studied. Here, the RRP was whittled down to 22 SVs, representing a 75% reduction from wt (Figure 7A). This shrinkage in pool size corresponded with previously published studies that described the ribbonless rod AZ as shortened and accompanied by fewer SVs. Specifically, an EM study observed that the density of docked SVs was reduced by 60% (for definition of docking see Maxeiner et al., 2016), and the rod AZ identified with Cav1.4/RIM2 immuno-staining was 50% shorter in length and rounded in the absence of the ribbon (Maxeiner et al., 2016; Dembla et al., 2020). Interestingly, the altered Cav1.4 channel staining pattern, and absence of ICa facilitation in ribbonless rods (discussed below), did not alter the tight coupling of the SVs with Cav channels. Overall a close correspondence between the size of the RRP of SVs (our study) and the number of SVs docked at the AZ (published work) was observed for wt rods. The same can be said for ribbonless rods, but the RRP and number of docked SVs were scaled down significantly (see summary illustration in Figure 9).
Since the overall anatomical organization of the Ribeye-ko retina was reported to be normal (Maxeiner et al., 2016; Okawa et al., 2019), and the scotopic erg a-waves were unaltered (Figure 8), the reduction in scotopic b-wave amplitudes is arguably a result of weakened transmission from rods to rbcs (Figure 8D) (also see: Fairless et al., 2020). Given the 75% reduction in evoked ΔCm measured from ribbonless rods, the altered erg b-wave amplitudes were likely, if not entirely, caused by the deficit in presynaptic release. Comparing the results from the erg and Cm measurements suggests that the impairment measured with ΔCm was greater than that derived from ergs by ~15%, which may reflect an under or over representation of the ΔCm results. For instance, if in the dark wt rods released more glutamate than the postsynaptic rbc transduction pathway could encode, then the excess glutamate would not be registered in the ergs; while, a substantial release deficit may fall within the coding range of the rbc postsynaptic transduction system. Such a scenario would lead to an under representation of the deficit when probed with ergs. On the other hand, the non-physiological, strong stimulation conditions used to evoke ΔCm may have exaggerated the differences between wt and ribbonless rods.
How does ribbon loss influence retinal function under low light? Normally, synaptic glutamate concentrations at rod-rbc synapses are elevated in the dark. The consequence of a release deficit in the dark will be a reduction in synaptic glutamate, which should leave rbcs depolarized relative to wt rbcs. If true, then the ribbonless circuitry will effectively put rbcs in an ‘on-state’ while in the dark, which may impair the ability of the ribbonless circuitry to encode dim light stimuli (i.e., single photon responses). In the wt mouse retina, the ‘primary rod pathway’ handles single photon responses, and this pathway consists of the following sequence of connections (synapse type): (1) rods to rbcs (ribbon synapse), (2) rbcs to AIIs (ribbon synapse), (3) AIIs to on-cone bipolar cells (on-cbcs; gap junction), and (4) on-cbcs to on-α-ganglion cells (on-α-gcs; ribbon synapse) (for review, Seilheimer et al., 2020). To encode an on-response at the output layer, the rate of excitatory (glutamatergic) input to on-α-gcs is increased by light increments. When the retina is dark adapted, this pathway encodes the rate of photons captured by rods (rhodopsin isomerizations: R*) over the following range of flash intensities: 0.01–2 R*/(rod·s); while, stronger flashes saturate the primary rod pathway (Dunn et al., 2006; Ke et al., 2014). As long as a dim background luminance is applied (<0.5 R*/(rod·s)) small increments and decrements in light can be encoded by modulating the rate of tonic excitatory inputs to on-α-gcs (Grimes et al., 2014). However, as background luminance >1 R*/(rod·s), the primary rod pathway rapidly adapts to light (Dunn et al., 2006). The adaptation is characterized by a withdrawal of tonic excitatory inputs to on-α-gcs, progressively diminishing the pathways ability to encode light decrements; thus, with light adaptation the on-α-gc responses become strongly rectified in the direction of light increments (Grimes et al., 2014; Ke et al., 2014).
On this backdrop, Okawa et al., 2019 addressed how the ribbonless retina responded to sinusoidal-chirp light stimuli. By making whole-cell voltage-clamp recordings from on-α-gcs, they showed that the ribbonless retina encoded increments in light robustly, but light decrements were poorly encoded; which was interpreted as resulting from a reduction in tonic excitatory inputs to on-α-gcs. This basic outline is comparable to the behavior of a light-adapted primary rod pathway in as far as the responses were rectified in the direction of light increments. However, additional functional deficits indicated the ribbonless circuitry was not functioning as a normal, light adapted retina. For example, rod and cone on-pathways normally collaborate to encode contrast (Ke et al., 2014) and spatial frequency (Grimes et al., 2014) on a background luminance between 10–100 R*/(rod·s), but the ribbonless retina exhibited the greatest deficits in coding these features within this range of luminance (50 R*/(rod·s); Okawa et al., 2019). To assign the deficits in functional coding to the ribbonless primary rod pathway is tempting given deficits in the rod pathway outlined above; however, Okawa et al., 2019 further showed that a normal frequency of action potentials (using on-cell patch-clamp) was generated by on-α-gcs in response to light steps from dark to 10 R*/(rod·s) for 0.5 s. This finding is consistent with their whole-cell voltage-clamp results: robust on-responses, but it illustrates a surprising degree of functional resiliency that likely involved compensatory mechanisms. One possible explanation is that the ribbonless cone pathway, which responded normally to photopic light flashes (Fairless et al., 2020), helped compensate by rerouting rod signals through the secondary rod on-pathway: rods−cones−on-cbcs−on-α-gcs (Seilheimer et al., 2020). A step luminance of 10 R*/(rod·s) marks the point where the secondary on-pathway is normally just starting to get engaged Ke et al., 2014; thus, it is hard to imagine this pathway alone could compensate so robustly. Another possibility is that the ribbonless primary rod pathway utilized compensatory mechanisms in the inner retina at the rbc-AII synapse, where light adaption is normally thought to be mediated (Dunn et al., 2006; for review, Demb and Singer, 2015). Whether the primary and/or secondary rod pathway were involved will require further study. For example, by selectively deleting electrical synapses formed between rods and cones, it should be possible to study the ribbonless rod primary on-pathway more directly.
To begin to examine the biophysics of exocytosis in more detail, we first compare results from mouse rods to studies carried out on isolated Mb1 bipolars. The comparisons are rather straightforward to make since SV fusion at Mb1 synaptic terminals has been studied extensively with the whole-cell Cm technique. A subpopulation of Mb1 SVs fuse with a τultrafast ~0.5 ms (Heidelberger et al., 1994; Mennerick and Matthews, 1996; Burrone et al., 2002), which are rate limited by Cav channel activation kinetics (τ ~ 0.6 ms at −10 mV, Mennerick and Matthews, 1998), and their release is unimpeded by elevated intracellular Ca2+-buffering (5 mM EGTA) (Mennerick and Matthews, 1996). An additional population of SVs are considered to reside at greater distances from Cav channels, because they only enter the RRP when intracellular Ca2+-buffering is reduced (0.1 mM EGTA) (Burrone et al., 2002). Such heterogeneity in rates of fast release were not apparent in the recordings from mouse rods; however, we find that facilitation of Cav channel activation kinetics occurs on a timescale that can influence the timing of ultrafast release. In response to 0.5 ms voltage steps, the RRP was depleted by 50% with 0.5 mM EGTA in the pipette, but only 4% of the RRP emptied when 10 mM EGTA was used (Figure 5C). The faster release onset is attributed to the acceleration of Cav channel activation kinetics in 0.5 mM EGTA (Figures 4F and 6A; Supplementary file 2), which enhanced QCa selectively at 0.5 ms (Figure 6E). Interestingly, Burrone et al., 2002 showed something very similar with respect to release, specifically a tail-current released 50% of the RRP when the Mb1 bipolars were loaded with 0.1 mM EGTA, but with higher Ca2+-buffering (endogenous) the tail-current released only 5% of the RRP. They attributed the enhanced rate of release to the expansion of the Ca2+-domain, but differences in ICa were not reported. For comparison to mammalian bipolar cells, mouse rbcs also support ultrafast release (Oltedal and Hartveit, 2010), and this is mediated through tight, nano-domain coupling to Cav channels to SVs (Jarsky et al., 2010).
Auditory hair cells also support a robust form of facilitation when they are pre-conditioned to elevated concentrations of free, intracellular-Ca2+, which was achieved by pre-depolarizing the cells (Goutman and Glowatzki, 2011) and/or lowering intracellular Ca2+-buffering (Cho et al., 2011). Release facilitation was characterized by shorter onset latencies and higher release synchrony (Cho et al., 2011; Goutman and Glowatzki, 2011; Chen and von Gersdorff, 2019). Notably, rat IHCs showed facilitation of ICa onset, but without a change in steady-ICa amplitude (Goutman and Glowatzki, 2011); similar to what we report for rods. However, frog HCs did not exhibit a change in ICa onset (Cho et al., 2011). These studies show that mammalian IHCs (Goutman and Glowatzki, 2011) and rods accelerate Cav channel opening (this study), and this in turn expedited release. In contrast, frog HCs (Cho et al., 2011) and Mb1 bipolars (Burrone et al., 2002) accelerate release through a distinct process that may involve a Ca2+-dependent priming step or differences in the spatial coupling between Cav channels and SVs, respectively.
In this study, we also found that wt ICa decayed by a third with a τ of 19 ms, suggestive of Cav channel inactivation. This was observed with 10 mM EGTA in the pipette, which is sufficient to block Ca2+-dependent inactivation (CDI) in salamander rods (Corey et al., 1984; Rabl and Thoreson, 2002); however, Ca2+ will need to be substituted with Ba2+ to more definitively demonstrate the process is CDI. Voltage-dependent inactivation (VDI) may be involved, but this was not observed in salamander rods when 10 mM EGTA was used (Corey et al., 1984; Rabl and Thoreson, 2002); furthermore, VDI was not apparent in recordings from porcine (Cia et al., 2005) or ground squirrel (Li et al., 2010) rods when experiments were performed with 2 mM Ba2+ or 10 mM BAPTA. Though we do not have a definitive answer from our recordings on rods, both CDI and VDI have been reported in studies carried out on human Cav1.4 channels heterologously expressed in HEK cells. The molecular details are being worked out for CDI (Haeseleer et al., 2016; Sang et al., 2016); whereas, VDI has only been described as highly temperature-dependent. For instance, raising the recording temperature from 23 to 37°C increased peak-ICa amplitude by 3-fold and accelerate VDI by 50-fold (Peloquin et al., 2008, with 20 mM BaCl2). Future studies will need to assess if VDI and/or CDI are involved.
Both of the Cav channel gating phenomena observed in wt rods were eliminated in ribbonless rods. ICa activation kinetics measured with 10 mM EGTA in the pipette showed slower activation kinetics in wt than ribbonless rods (Figure 7D and Supplementary file 2), and ICa inactivation was more apparent in wt rods (Figures 3F and 7F). Given the steady-ICa amplitude measured from wt and ko rods were similar, there were arguably comparable numbers of open channels at ~30 ms; however, ribbonless rods appeared to lack a transient facilitation in ICa. To better set the context, it is important to note that normal levels of Cav1.4 (α1F-subunit) protein were reported to be expressed in the retina of Ribeye-ko mice (Maxeiner et al., 2016); nonetheless, immuno-fluorescence staining for Cav1.4 (α1F) and RIM2α revealed the ribbonless AZ was 50% shorter (Maxeiner et al., 2016; Dembla et al., 2020). This indicates that ribeye directly influenced the structure of the rod AZ Maxeiner et al., 2016, and either directly or indirectly facilitated the opening of Cav1.4 channels (this study; and see Jean et al., 2018). The ribbons stabilization of RIM2α and its higher molecular weight splice variants is of interest, because deletion of long forms of RIM1/2α selectively from rods significantly reduced ICa, reduced the frequency of miniature glutamate transporter events, and reduced the evoked ΔCm, but this did not alter Cav1.4 (α1F) channel or ribeye staining patterns (Grabner et al., 2015). In a separate study of RIM2α-ko mice, OPL organization and rod ribbon structure were normal, but the rod pathway exhibited impaired scotopic light responses based on ergs, and excitatory inputs to horizontal cells (Löhner et al., 2017). From these studies, perturbation of RIM2α impaired synaptic function (i.e., Cav channel function) without an essential role in shaping rod ribbon size or OPL organization; therefore, loss of ribeye may impair the ability of RIM2α and its splice vatiants to positively impact synaptic function at rods. Whether ribeye influences other AZ scaffolding proteins has not been thoroughly addressed, but it seems unlikely that loss of ribeye greatly impacted CAST/ELKs. When deleted individually as was done in the CAST-ko (tom Dieck et al., 2012), or simultaneously in the CAST/ELKs-dko (Hagiwara et al., 2018), the following deficits were reported: dramatic degeneration of the OPL, diminished photopic- and scotopic-erg responses, shortening of rod ribbon length, and a near elimination of rod ICa (Hagiwara et al., 2018). A dramatic structural and functional phenotype is also observed in bassoon-ko mice. Bassoon deletion significantly impacted the anchoring of the ribbon to the AZ (Dick et al., 2003). Unlike ribeye and RIM2α, CAST/ELKs and bassoon are essential for normal development and maintenance of synapses in the OPL.
Our study provides new insight into the biophysics of SV fusion at the mammalian rod ribbon synapse. The results demonstrate that the rod ribbon creates multiple release sites with similar release probability in response to strong stimulations (summarized in Figure 9). This is driven by Cav channels that activate at ultrafast rates. The coupling between Cav channels and SVs is on a nano-scale, with no sign of heterogeneity in spatial coupling. Instead, release heterogeneity arose from alterations in Cav channel facilitation, which was specific to the timing of release onset. These features were dependent on the synaptic ribbon, as ribbonless rods lacked Cav channel facilitation and the RRP was greatly scaled down. Future studies will need to determine the stoichiometry of a release site, starting with how many Cav channels open to trigger an SV(s) to fuse and what mechanisms impact release probability (i.e., PKA). Better insight into these matters will further our understanding of how rods convert depolarizations into synaptic signals, and ultimately how the mammalian rod pathway helps encode object motion and position.
Materials and methods
Animal handling
Request a detailed protocolAnimals were handled in accord with institutional and German national animal care guidelines. The Ribeye knockout (Ribeye-ko) mice that were first described by Maxeiner et al., 2016, were a kind gift from Frank Schmitz and Stefan Maxeiner (University of Saarland). The Ribeye-ko mice have null mutations in both alleles of the Ribeye gene, and were maintained on a C57BL6/J mouse background. Heterozygous males and females (Ribeye−/+) were bred for experiments. Wild-type and Ribeye-ko offspring littermates (male or female), between 3 and 6 months of age, were used for experiments during the daylight phase of the day/night cycle.
Electrophysiology
Request a detailed protocolRetinae were dissected at an ambient temperature of 18–20°C and then submersed in mouse extracellular solution (MES) with a low Ca2+ concentration that had the following composition (in mM): 135 NaCl, 2.5 KCl, 0.5 CaCl2, 1 MgCl2, 10 glucose, 15 HEPES, and pH adjusted to 7.35 with NaOH and an osmolarity of 295 mOsm. Dissected portions of retina were absorbed onto pieces of nitrocellulose membrane mounted onto glass with the vitreal side of the retina contacting the membrane. The sclera and pigment epithelium were removed from the exposed surface of retina and then ~200 µm thick slices were made with a custom built tissue chopper. Immediately after slicing, the retinal sections (attached to the nitrocellulose membrane) were transferred to the recording chamber and arranged to be viewed in vertical cross section to optimize resolution of the OPL. Slices were washed continually with low Ca2+ MES for approximately 5 min as they equilibrated to an ambient temperature of 30–32 °C, and then the Ca2+ was increased to 2 mM.
The intra- and extra-cellular recording solutions have been described previously (Grabner et al., 2015; Grabner et al., 2016), and a few modifications as noted here were made to improve the ICa measurements. To further block a delayed rectifier, outward K+-current (Cia et al., 2005), the concentration of TEA was increased to 20 mM in the intracellular and 35 mM in the extracellular solutions. As previously, Cs+ replaced intracellular K+. Next the glutamate transporter Cl−-current was previously blocked with a high concentration of DL-TBOA, 350 µM (Grabner et al., 2016), which is a non-selective EEAT blocker. In the current study, we used TFB-TBOA (TOCRIS), which is a high affinity blocker for EEAT1-3, at a concentration of 3 µM. It showed better stability over time, and far greater potency than the DL-TBOA (Grabner et al., 2016). The terminals have an Ih current (Hagiwara et al., 2018) that was blocked by adding 5 mM CsCl to the extracellular solution (Bader et al., 1982). Finally, as a precaution, extracellular HEPES was elevated to 15 mM to block inhibitory proton feedback onto Cav channels (DeVries, 2001). In the end, the extracellular recording solution had the following reagents (mM): 105 NaCl, 2.5 KCl, 35 TEA-Cl, 5 CsCl, 2 CaCl2, 1 MgCl2, 0.003 TFB-TBOA, 15 HEPES, and pH adjusted to 7.35 with NaOH, and a final osmolarity between 290 and 295 mOsm. The intracellular solution with 10 mM EGTA consisted of the following reagents (mM): 105 CsCH3SO4, 20 TEA-Cl, 1 MgCl2, 5 MgATP, 0.2 NaGTP, 10 HEPES, 10 EGTA, and pH adjusted to 7.30 with CsOH to an osmolarity of 285–290 mOsm. To balance the osmolarity when EGTA was lowered to 0.5 mM, CsCH3SO4 was raised to 112 mM. The calculated liquid junction potentials (Elj) created between the extracellular recording solution and pipette solution were: 8.9 and 9.6 mV, for 10 and 0.5 mM EGTA, respectively (Neher, 1992). The voltage-clamp data presented in the Results section has not been corrected for Elj; thus, the actual applied voltages are shift by ~ −9 to −10 mV from what is stated in the manuscript.
Whole-cell patch-clamp measurements were made with a HEKA EPC-10 amplifier equipped with Patchmaster software (Lambrecht, Pfalz, Germany). The ‘sine+ dc’ lock-in operation mode was used to monitor changes in membrane capacitance, conductance, and series resistance. Whole-cell electrodes were fabricated from thick-wall glass capillary tubes, and their tip region was coated with Sylgard (Dow Corning). Pipette resistance was 9–11 MOhms. The cell’s voltage was held at −70 mV, to which a 2 kHz sine wave with a 50 mV peak-to-peak amplitude (−95 to −45 mV) was applied. A higher sine wave frequency was used here than in a previous study on mouse rods (Grabner et al., 2015), because here only the axonless, soma-ribbon terminals were patched. The lock-in outputs were sampled at 20 kHz and filtered online with the low-pass fc set to 2.9 kHz. The I-Vstep protocols were sampled at 50 kHz and filtered online with the low-pass fc set to 10 kHz.
Patch-clamp recordings in this study targeted rod soma in the OPL, which contain the ribbon in the soma compartment, referred to as the ‘soma-ribbon’ configuration (Hagiwara et al., 2018). Immediately before making the on-cell seal, the extracellular solution was exchanged to an MES with 2.0 mM Ca2+ and TEA/Cs/TBOA. After gaining whole-cell access, rods were held at a Vm of −70 mV. The cells were infused for 30–40 s before the evoked release protocols began, which entailed a sequence of 5 or 7 depolarizations with stimulations given at 8 s intervals. The stimulations used to evoke release were given in the order of shortest to longest duration steps: 0.5–30 ms, and always stepping from a Vm of −70 mV (rest) to −18 mV (see the Results section for a detailed explanation of the stimulation protocol used to study ΔCm as a function of step duration.). Evoked release was studied within the first 2 min, and then I-V protocols were performed afterwards. The passive electrical properties of the soma-ribbon measured in voltage-clamp were on average as follows, Rseries: 29.7±0.6 MΩ and whole-cell capacitance Cm: 1.02±0.03 pF; yielding a membrane time constant τRC ~ 30 µs (see Figure 1C and Supplementary file 1). Recordings were made at an ambient temperature of 30–32°C. Almost all recordings were made within 30–45 mins after slicing, and typically 1–2 successful recordings (cells) per mouse.
Data analysis
Request a detailed protocolThe evoked ΔCm was assessed as outlined in Figure 2E. Segments of the Cm trace, 50 ms in length, before and after depolarization were averaged and the difference equaled the evoked ΔCm; ΔGm and ΔGs were calculated in the same way. Since Gm is influenced by Cl−-currents arising from Ca2+-activated TMEM16A/B channels and the glutamate transporter, the following precautions were taken. For experiments with 0.5 mM EGTA in the intracellular solution, the post-depolarization segment was averaged after ICl(Ca) relaxed, 75 ms after the end of the stimulation. Next, TFB-TBOA was used to block the glutamate transporter tail-currents (concentration described above). Finally, lock-in amplifier outputs were monitored between depolarization episodes, and this was done by taking 100 ms sine wave sweeps (Figure 2A), and the difference between 10 ms windows averaged at the start (time point: 5–15 ms) and end (t: 85–95 ms) of the 100 ms sweeps were treated as baseline/between stimulation Δ values (see Figure 2E).
The ICa amplitude and activation time constant were determined by fitting the onset of the inward membrane current with a single exponential. When 0.5 or 10 mM EGTA was used, fits started after a 200–300 µs delay from the start of Vstep, and the fit ended approximately 3 ms later (see Figure 3A). The exception was when 0.5 mM EGTA was used and Vstep’s were made more positive than −20 mV, which accelerated ICl(Ca) onset (Figure 4B). This left 1–2 ms to fit peak-ICa when Vstep was −10 to +30 mV. The calculated ECl is −51 mV, and after adding the Elj (9.6 mV) the ECl is −41 mV. Finally, the I-V relationships were fitted with a Boltzmann equation: I=Imax*(Imin−Imax)/(1+exp((Vm−V1/2)/k)) from a Vstep −60 mV to the Vstep corresponding to max ICa (typically −10 mV). In addition, a modified form of the Boltzmann equation: I=Gmax*(Vm−Vrev)/(1+exp(−(Vm−V1/2)/k)), was used to fit the entire range Vstep’s. Notations are as follows: I is the peak current, Vm is the membrane voltage, V1/2 is the voltage for half activation, Vrev is the reversal potential, Gmax is the maximal conductance, and k is the slope factor. Fitting and statistical analysis were performed with Origin software (OriginLab Corporation). All experimental values are given as mean±SE. All p-values were calculated with the unpaired Student’s t-test.
ERG recordings
Request a detailed protocolMice were dark adapted overnight. They were anesthetized with an intraperitoneal injection of ketamine (0.125 mg/g) and xylazine (2.5 µg/g), and pupils dilated with 1% atropine sulfate. An AgCl wire ring-electrode was placed on the cornea, and electrical contact was made with a NaCl saline solution, plus methylcellulose to maintain moisture. A needle reference electrode was inserted subcutaneously above the nose, and a ground electrode was inserted near the tail. A custom-designed Ganzfield illuminator with 25 white LEDs was used to deliver 0.1 ms light flashes every 5 s, which were incrementally increased in intensity from 0.0003 to 0.278 cds/m2 (calibrated with a Mavolux, IPL 10530). Recorded potentials were amplified, low-pass filtered at 8 kHz, and sampled at a rate of 24 kHz. Ten responses were averaged per light intensity. The ergs were low-pass filtered using an FFT set to a corner frequency of 400 Hz or 20 Hz for measurement of a- or b-wave parameters, respectively. All analyses were performed with Origin software (OriginLab Corporation).
Converting ΔCm into the number of fusing vesicles
Request a detailed protocolTo calculate the capacitance per vesicle we relied on published data. Single SV fusion events measured from mouse IHCs have an average Cm: 40.2 aF and SV diameter of 36.9 nm (Grabner and Moser, 2018). The average SV diameter, measured in mouse rod terminals, was taken from multiple published studies and yielded a diameter of 34.6 nm (32.4 nm, Spiwoks-Becker et al., 2001; 37.3 nm, Fuchs et al., 2014; 32.5 nm, Grabner et al., 2015; 36 nm, Hirano et al., 2020). The calculated Cm per mouse rod SV is 37.6 aF.
Data availability
All analytic tools are described in the Methods section, and they are commercially available. All data and statistical analyses are described throughout the manuscript and in the Methods.
References
-
Facilitation of presynaptic calcium currents in the rat brainstemThe Journal of Physiology 513 (Pt 1):149–155.https://doi.org/10.1111/j.1469-7793.1998.149by.x
-
How to Build a Fast and Highly Sensitive Sound Detector That Remains Robust to Temperature ShiftsThe Journal of Neuroscience 39:7260–7276.https://doi.org/10.1523/JNEUROSCI.2510-18.2019
-
Voltage-gated channels and calcium homeostasis in mammalian rod photoreceptorsJournal of Neurophysiology 93:1468–1475.https://doi.org/10.1152/jn.00874.2004
-
Munc13-independent vesicle priming at mouse photoreceptor ribbon synapsesThe Journal of Neuroscience 32:8040–8052.https://doi.org/10.1523/JNEUROSCI.4240-11.2012
-
The calcium current in inner segments of rods from the salamander (Ambystoma tigrinum) retinaThe Journal of Physiology 354:557–575.https://doi.org/10.1113/jphysiol.1984.sp015393
-
Functional Circuitry of the RetinaAnnual Review of Vision Science 1:263–289.https://doi.org/10.1146/annurev-vision-082114-035334
-
Presynaptic calcium channels: specialized control of synaptic neurotransmitter releaseNature Reviews. Neuroscience 21:213–229.https://doi.org/10.1038/s41583-020-0278-2
-
Controlling the gain of rod-mediated signals in the Mammalian retinaThe Journal of Neuroscience 26:3959–3970.https://doi.org/10.1523/JNEUROSCI.5148-05.2006
-
Phototransduction and the evolution of photoreceptorsCurrent Biology 20:R114–R124.https://doi.org/10.1016/j.cub.2009.12.006
-
ERG Responses in Mice with Deletion of the Synaptic Ribbon Component RIBEYEInvestigative Opthalmology & Visual Science 61:37.https://doi.org/10.1167/iovs.61.5.37
-
Behavioural and physiological limits to vision in mammalsPhilosophical Transactions of the Royal Society B 372:20160072.https://doi.org/10.1098/rstb.2016.0072
-
Evidence for a Clathrin-independent mode of endocytosis at a continuously active sensory synapseFrontiers in Cellular Neuroscience 8:60.https://doi.org/10.3389/fncel.2014.00060
-
Short-term facilitation modulates size and timing of the synaptic response at the inner hair cell ribbon synapseThe Journal of Neuroscience 31:7974–7981.https://doi.org/10.1523/JNEUROSCI.0604-11.2011
-
Amperometric resolution of a prespike stammer and evoked phases of fast release from retinal bipolar cellsThe Journal of Neuroscience 33:8144–8158.https://doi.org/10.1523/JNEUROSCI.5062-12.2013
-
RIM1/2-Mediated Facilitation of Cav1.4 Channel Opening Is Required for Ca2+-Stimulated Release in Mouse Rod PhotoreceptorsThe Journal of Neuroscience 35:13133–13147.https://doi.org/10.1523/JNEUROSCI.0658-15.2015
-
Calcium- and calmodulin-dependent inactivation of calcium channels in inner hair cells of the rat cochleaJournal of Neurophysiology 99:2183–2193.https://doi.org/10.1152/jn.01174.2007
-
Sharp Ca2+ nanodomains beneath the ribbon promote highly synchronous multivesicular release at hair cell synapsesThe Journal of Neuroscience 31:16637–16650.https://doi.org/10.1523/JNEUROSCI.1866-11.2011
-
Cell types and cell circuits in human and non-human primate retinaProgress in Retinal and Eye Research 78:100844.https://doi.org/10.1016/j.preteyeres.2020.100844
-
Characterization of C-terminal Splice Variants of Cav1.4 Ca2+ Channels in Human RetinaThe Journal of Biological Chemistry 291:15663–15673.https://doi.org/10.1074/jbc.M116.731737
-
Cytomatrix proteins CAST and ELKS regulate retinal photoreceptor development and maintenanceThe Journal of Cell Biology 217:3993–4006.https://doi.org/10.1083/jcb.201704076
-
Vesicular Release of GABA by Mammalian Horizontal Cells Mediates Inhibitory Output to PhotoreceptorsFrontiers in Cellular Neuroscience 14:600777.https://doi.org/10.3389/fncel.2020.600777
-
Mechanisms contributing to tonic release at the cone photoreceptor ribbon synapseJournal of Neurophysiology 99:25–36.https://doi.org/10.1152/jn.00737.2007
-
Nanodomain control of exocytosis is responsible for the signaling capability of a retinal ribbon synapseThe Journal of Neuroscience 30:11885–11895.https://doi.org/10.1523/JNEUROSCI.1415-10.2010
-
Ribbon Synapses and Visual Processing in the RetinaAnnual Review of Vision Science 1:235–262.https://doi.org/10.1146/annurev-vision-082114-035709
-
Ca2+/calmodulin-dependent facilitation and inactivation of P/Q-type Ca2+ channelsThe Journal of Neuroscience 20:6830–6838.
-
A fast rod photoreceptor signaling pathway in the mammalian retinaNature Neuroscience 13:414–416.https://doi.org/10.1038/nn.2507
-
Organizational motifs for ground squirrel cone bipolar cellsThe Journal of Comparative Neurology 520:2864–2887.https://doi.org/10.1002/cne.23068
-
Analysis of RIM Expression and Function at Mouse Photoreceptor Ribbon SynapsesThe Journal of Neuroscience 37:7848–7863.https://doi.org/10.1523/JNEUROSCI.2795-16.2017
-
The CACNA1F gene encodes an L-type calcium channel with unique biophysical properties and tissue distributionThe Journal of Neuroscience 24:1707–1718.https://doi.org/10.1523/JNEUROSCI.4846-03.2004
-
Sensory processing at ribbon synapses in the retina and the cochleaPhysiological Reviews 100:103–144.https://doi.org/10.1152/physrev.00026.2018
-
Concentrations Profiles of Intracellular Calcium in the Presence of a Diffusible ChelatorExperimental Brain Research Series 14:17.https://doi.org/10.1007/978-3-642-70744-5_8
-
Correction for liquid junction potentials in patch clamp experimentsMethods in Enzymology 207:123–131.https://doi.org/10.1016/0076-6879(92)07008-c
-
Synaptic cleft acidification and modulation of short-term depression by exocytosed protons in retinal bipolar cellsThe Journal of Neuroscience 23:11332–11341.
-
Voltage-Gated Calcium Channels: Key Players in Sensory Coding in the Retina and the Inner EarPhysiological Reviews 98:2063–2096.https://doi.org/10.1152/physrev.00030.2017
-
Calcium-dependent inactivation and depletion of synaptic cleft calcium ions combine to regulate rod calcium currents under physiological conditionsThe European Journal of Neuroscience 16:2070–2077.https://doi.org/10.1046/j.1460-9568.2002.02277.x
-
Paired-pulse depression at photoreceptor synapsesThe Journal of Neuroscience 26:2555–2563.https://doi.org/10.1523/JNEUROSCI.3667-05.2006
-
Transmitter concentration at a three-dimensional synapseJournal of Neurophysiology 80:3163–3172.https://doi.org/10.1152/jn.1998.80.6.3163
-
Flexible Neural Hardware Supports Dynamic Computations in RetinaTrends in Neurosciences 41:224–237.https://doi.org/10.1016/j.tins.2018.01.009
-
Protein kinase A modulation of CaV1.4 calcium channelsNature Communications 7:12239.https://doi.org/10.1038/ncomms12239
-
Vesicle pools and short-term synaptic depression: lessons from a large synapseTrends in Neurosciences 25:206–212.https://doi.org/10.1016/s0166-2236(02)02139-2
-
Sustained Ca2+ entry elicits transient postsynaptic currents at a retinal ribbon synapseThe Journal of Neuroscience 23:10923–10933.
-
Some principles of retinal design: the Proctor lectureInvestigative Opthalmology & Visual Science 54:2267.https://doi.org/10.1167/iovs.12-10788
-
Vestibular blueprint in early vertebratesFrontiers in Neural Circuits 7:182.https://doi.org/10.3389/fncir.2013.00182
-
Deletion of the presynaptic scaffold CAST reduces active zone size in rod photoreceptors and impairs visual processingThe Journal of Neuroscience 32:12192–12203.https://doi.org/10.1523/JNEUROSCI.0752-12.2012
-
Noise removal at the rod synapse of mammalian retinaVisual Neuroscience 15:809–821.https://doi.org/10.1017/s0952523898155037
-
Imaging calcium entry sites and ribbon structures in two presynaptic cellsThe Journal of Neuroscience 23:2538–2548.
Article and author information
Author details
Funding
Deutsche Forschungsgemeinschaft (Leibniz Award)
- Tobias Moser
Deutsche Forschungsgemeinschaft (ExC 2067)
- Tobias Moser
Deutsche Forschungsgemeinschaft (CRC 1286 project C08)
- Tobias Moser
Deutsche Forschungsgemeinschaft (Multiscale Bioimaging Cluster of Excellence ExC 2067)
- Tobias Moser
The funders had no role in study design, data collection and interpretation, or the decision to submit the work for publication.
Acknowledgements
General: The authors would like to thank Stefan Thom for excellent technical assistance with the erg recordings. The authors thank Drs. Erwin Neher and Jakob Neef for critical feedback on the manuscript. Funding: This work was supported by the Max-Planck-Society (Max-Planck-Fellowship to TM) and the following funding from the Deutsche Forschungsgemeinschaft (DFG): Leibniz Award (TM); Multiscale Bioimaging Cluster of Excellence, ExC 2067 (TM); CRC 1286, project C08 (TM).
Ethics
All experiments complied with national animal care guidelines and were approved by the University of Götingen Board for Animal Welfare and the Animal Welfare Office of the State of Lower Saxony (permit number: 14-1391).
Copyright
© 2021, Grabner and Moser
This article is distributed under the terms of the Creative Commons Attribution License, which permits unrestricted use and redistribution provided that the original author and source are credited.
Metrics
-
- 1,263
- views
-
- 206
- downloads
-
- 33
- citations
Views, downloads and citations are aggregated across all versions of this paper published by eLife.
Citations by DOI
-
- 33
- citations for umbrella DOI https://doi.org/10.7554/eLife.63844
Download links
A two-part list of links to download the article, or parts of the article, in various formats.
Downloads (link to download the article as PDF)
Open citations (links to open the citations from this article in various online reference manager services)
Cite this article (links to download the citations from this article in formats compatible with various reference manager tools)
The mammalian rod synaptic ribbon is essential for Cav channel facilitation and ultrafast synaptic vesicle fusion
eLife 10:e63844.
https://doi.org/10.7554/eLife.63844


