The mammalian rod synaptic ribbon is essential for Cav channel facilitation and ultrafast synaptic vesicle fusion
- Institute for Auditory Neuroscience and InnerEarLab, University Medical Center Göttingen, Germany
- Synaptic Nanophysiology Group, Max Planck Institute of Biophysical Chemistry, Germany
- Collaborative Research Center 1286 'Quantitative Synaptology', University of Göttingen, Germany
- Multiscale Bioimaging Cluster of Excellence (MBExC), University of Göttingen, Germany
Figures
Figure 1
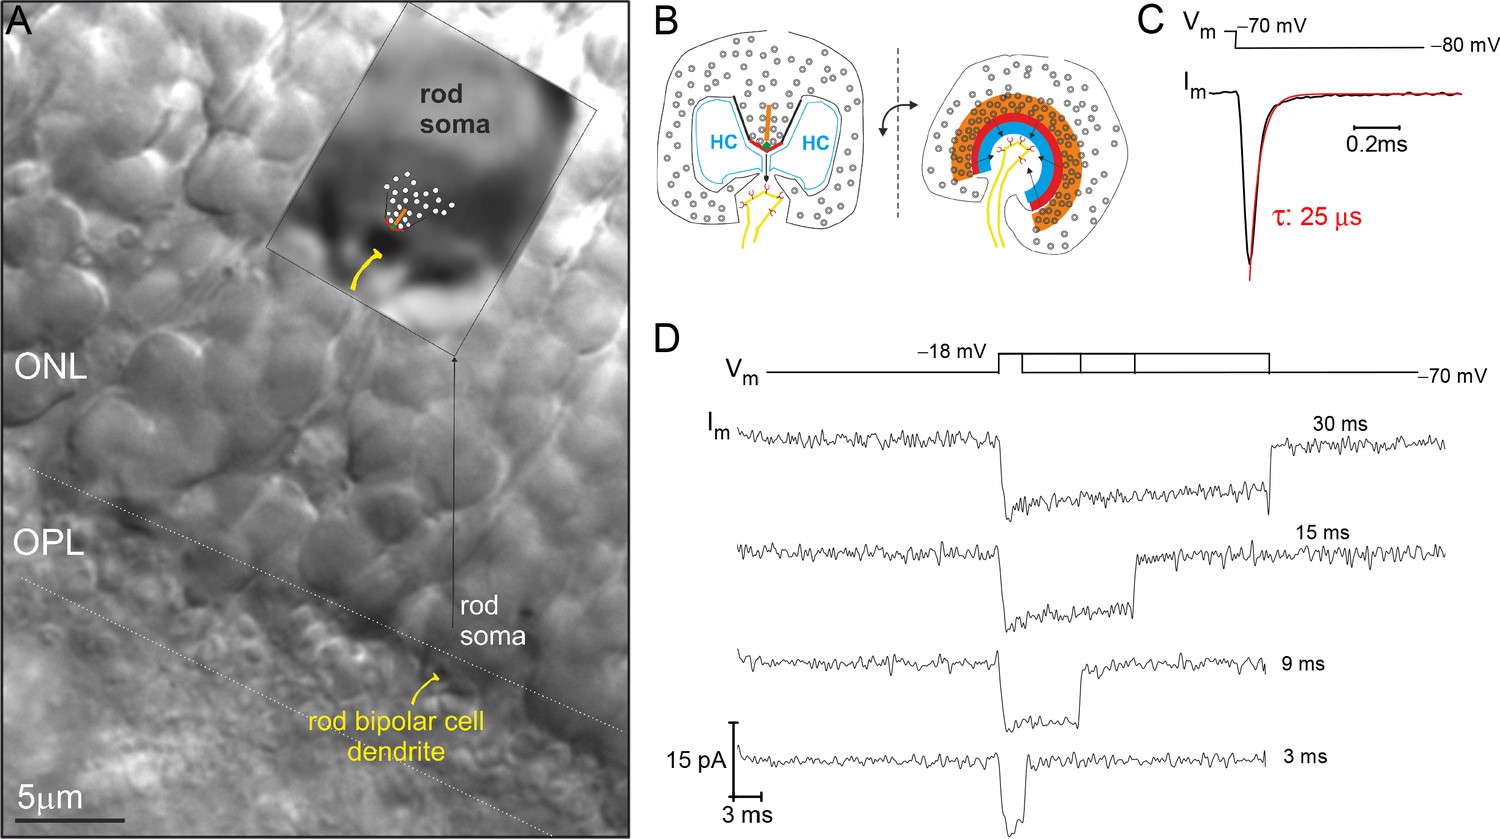
Example recording from a rod photoreceptor (PR) that lacks an axon.
(A) Image of a retinal slice centered on PR terminals in the outer plexiform layer (OPL) and somata in the outer nuclear layer (ONL). The inset shows a zoomed in view of an axonless rod soma-ribbon in the OPL, to which the synaptic ribbon synapse has been drawn into the image for reference. (B) Illustration of the major components of the rod ribbon synapse. The two images are rotated by 90° relative to the plane of the ribbon. Legend: ribbon (orange), active zone (thick red line), arciform density (green diamond), ribbon flanked by synaptic ridges (thick black lines), horizontal cells (HC, in blue), and rod bipolar cell dendrite (yellow) with mGluR6 receptors (red). (C) The membrane current (Im) transient measured from a rod soma-ribbon in response to a brief hyperpolarizing voltage step. Current trace taken prior to compensating whole-cell membrane capacitance (Cm). (D) Series of Ca2+-currents measured from an individual rod in response to voltage steps for the indicated durations. See Figure 2 for the corresponding evoked release from this rod.
Figure 2
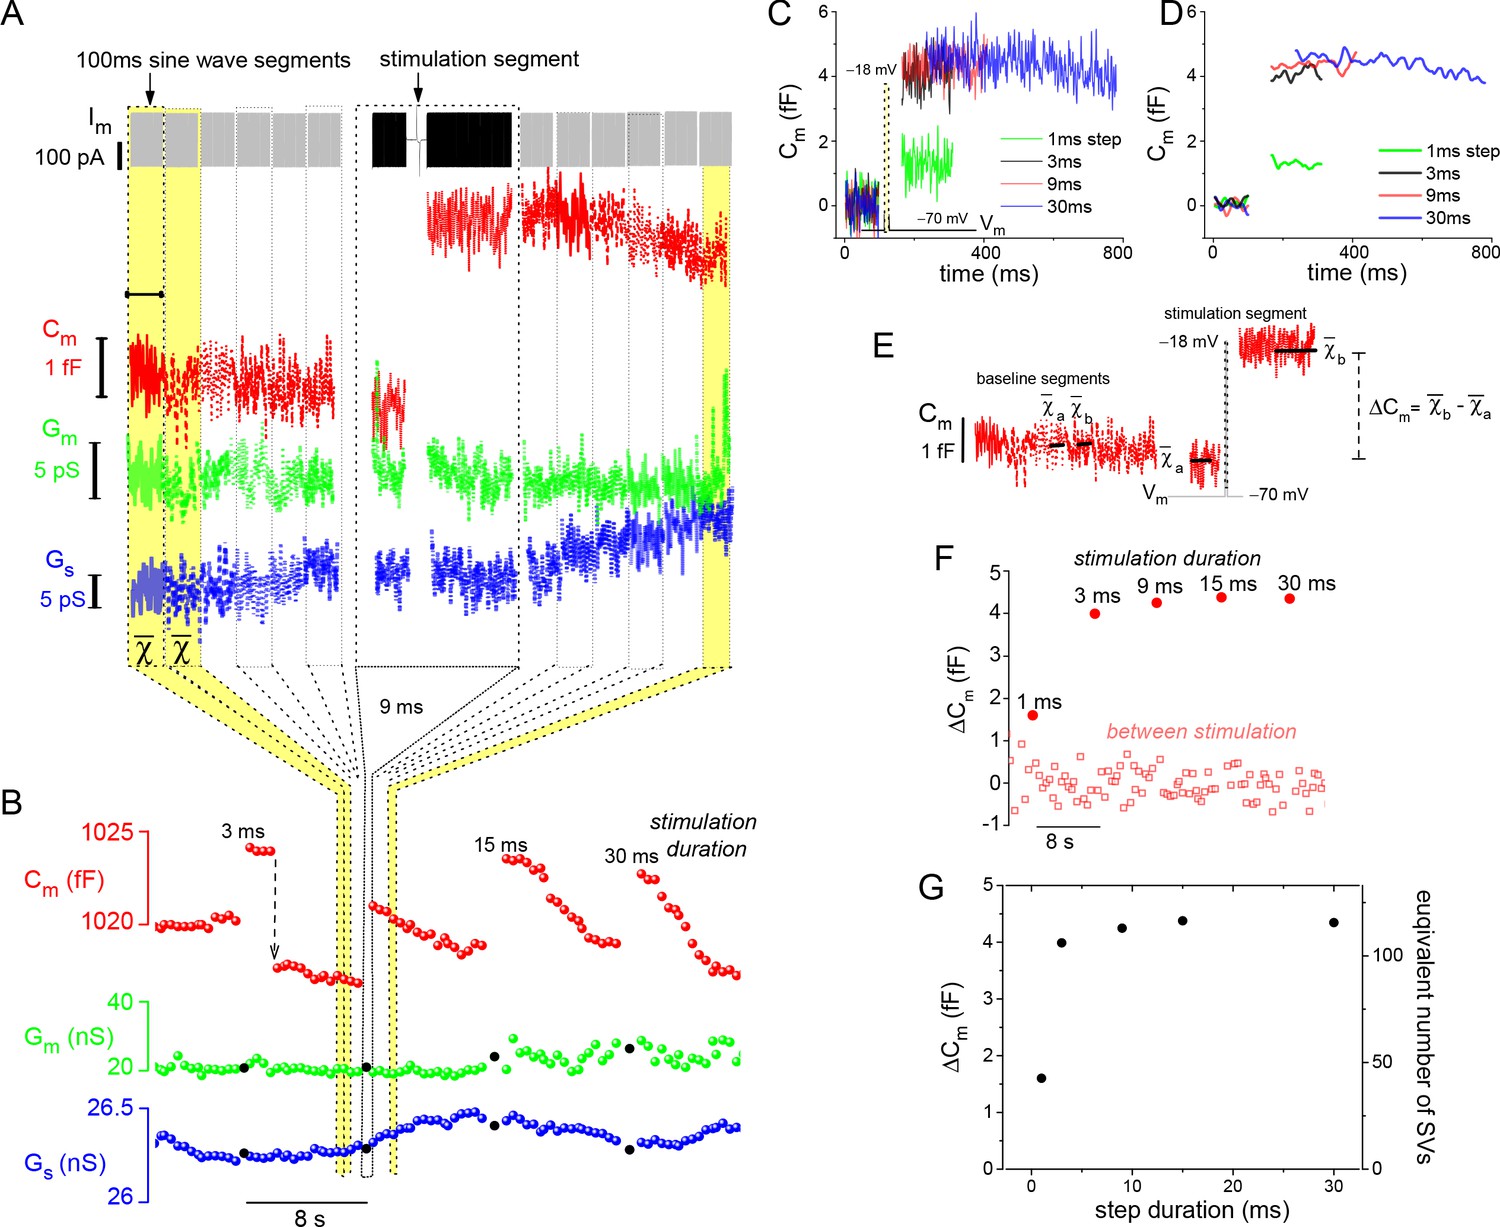
Resolution and analysis of evoked ΔCm.
(A) The Im presented at the top of the figure is dominated by the sine-wave voltage protocol used to derive the lock-in amplifier outputs: Cm, Gm, and Gs. The protocol consisted of a series of 100 ms sine-wave segments presented in gray, which bracket the stimulation segment depicted in black (arrow points to the 9 ms depolarizing voltage step). (B) Responses to a series of step depolarizations for the indicated durations are presented. The approach used to bin the data in (A) and create the plot in (B) are illustrated schematically. The Gm and Gs data points that are filled in black mark the stimulation segments. The dashed, downward pointing arrow following the 3 ms stimulation highlights an unusually large endocytotic, downward step in Cm (see text). (C, D) Plot the individual Cm traces for each evoked response. Traces in (D) were low-pass filtered to a corner frequency (fc) of 20 Hz, and in (C) a fc of 200 Hz was used. (E) Illustrates how ΔCm was quantified over both baseline (between stimulation) and stimulation segments (see Materials and methods). (F) Chronological plot of ΔCm during baseline and stimulation segments. (G) Summary plot with two y-axes: ‘ΔCm’ and ‘equivalent number of SVs,’ versus step duration (x-axis). The conversion factor for calculating the number of SVs is described in Materials and methods. The ICa traces measured from this cell are presented in Figure 1C. SV, synaptic vesicle.
Figure 3
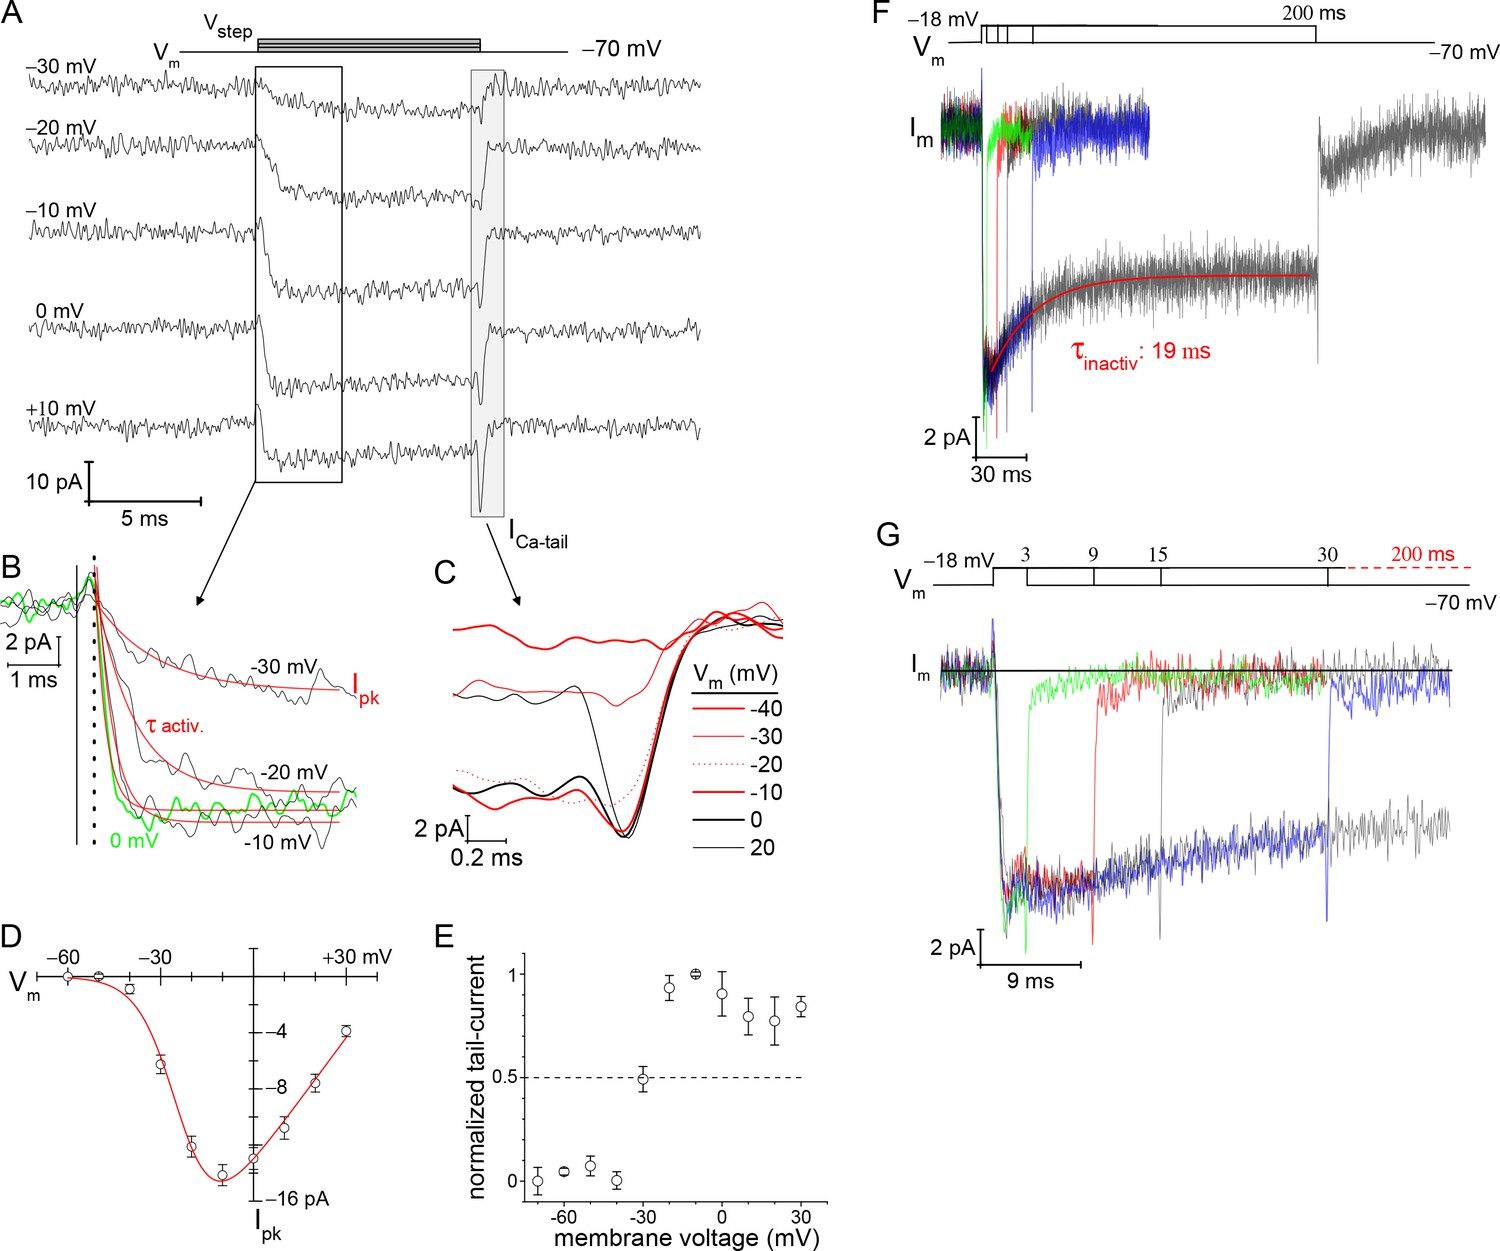
Voltage-dependence of Ca2+-currents.
(A) Presents a subset of individual ICa traces taken from a rod filled with 10 mM EGTA. The 10 ms voltage steps were delivered in descending order from +30 to −80 mV at −10 mV increments, every 3 s. (B) Zoomed in view of ICa activation. Start of the Vstep is indicated with the vertical solid line, and the onset of ICa is indicated with a vertical dashed line. An exponential function was used to fit (red lines) each ICa trace from which τactivation and peak-ICa were ascertained. (C) Overlay of tail currents from (A). (D) Averaged peak-ICa versus Vstep fit with a modified Boltzmann I-V equation (V1/2: −24.0±1.3, slope (dx): −6.2± 0.6 mV/e, Vrev: +44.6±2.6 mV, and Gmax: 0.30±0.02 pA-mV−1; 9 cells; see Supplementary files 2 and 3). (E) Normalized ICa-tail plotted over Vstep (4 cells). (F, G) Overlay of average membrane currents in response to voltage steps from −70 to −18 mV for the indicated durations (averages from 7 to 13 cells). The ICa associated with the 200 ms step depolarizations (7 cells) were fit as a single exponential decay (τinactivation). (G) Zoomed in view of the shorter duration voltage steps highlights the rapid return of ICa to baseline (subsequent to the transient ICa-tail).
Figure 4
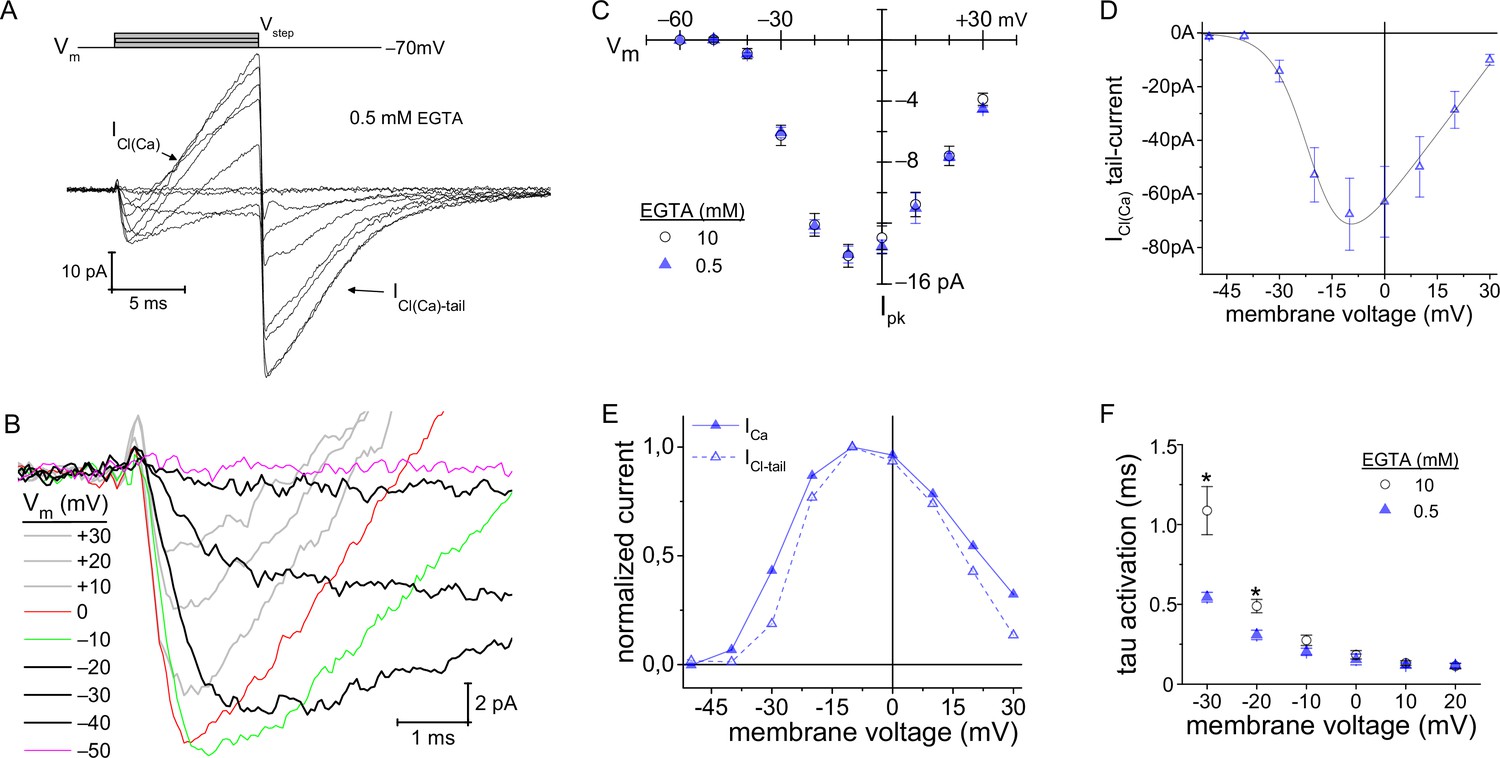
Lowering intracellular Ca2+-buffering accelerated Cav channel activation kinetics.
(A, B) With 0.5 mM EGTA in the pipette, an outward current developed during the Vstep (designated as ICl(Ca)), which became an inward current upon repolarization (ICl(Ca)-tail). (B) Expanded view of the activation portion of the current traces from (A). Traces from 8 cells were averaged; depolarization protocol is described in Figure 3A. (C) Overlay of average peak-ICa plotted over Vstep made from experiments with an intracellular concentration of either 0.5 (8 cells) or 10 mM EGTA . (D) Average ICl(Ca)-tails versus Vstep (6 cells). Modified Boltzmann I-V fit (blue trace): V1/2: −20.4±0.5, slope (dx): −5.6±1 mV/e, Vrev: +35.8±3.8 mV and Gmax: 1.41±0.44 pA-mV−1 (6 cells; see Supplementary file 4). (E) Normalized average ICl(Ca) and peak-ICa from 0.5 EGTA data in (C, D) plotted over Vstep (error bars excluded). (F) Plot of τactivation versus Vstep with an intracellular concentration of either 0.5 or 10 mM EGTA (*: p≤0.006; see Supplementary file 2).
Figure 5
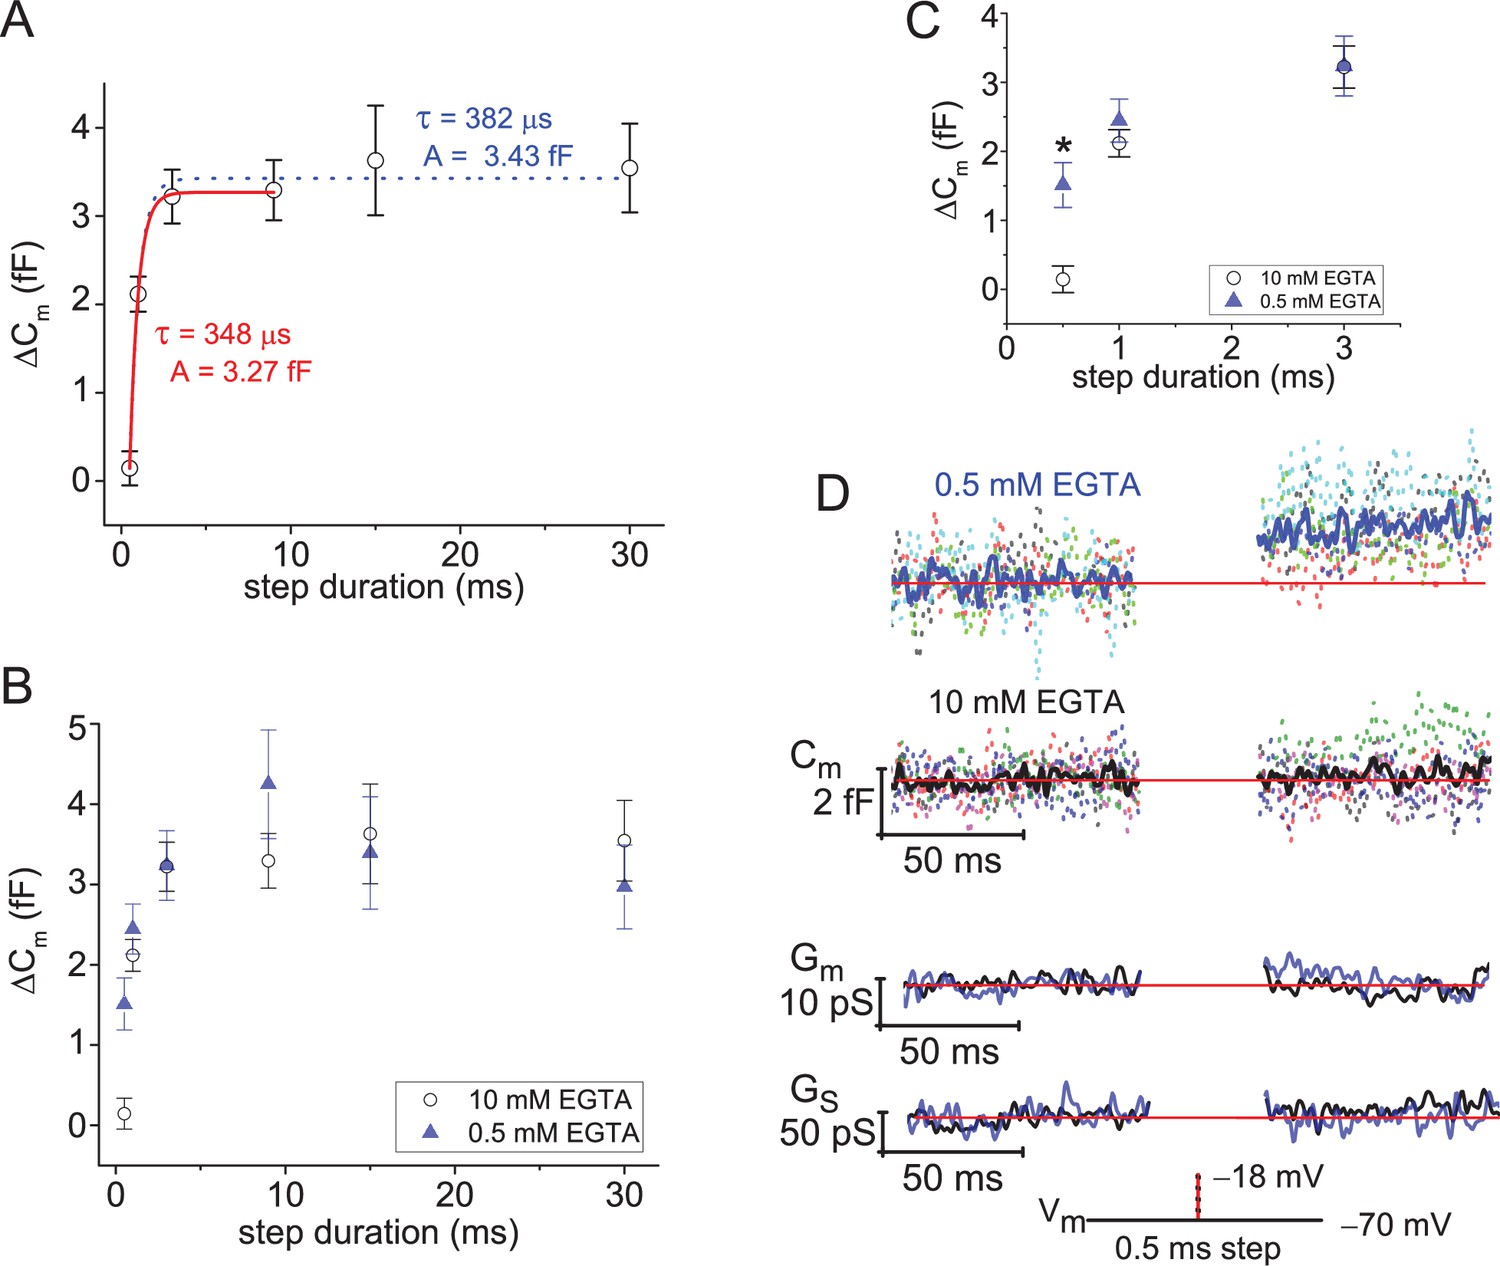
Ultrafast depletion of the RRP of SVs.
(A) Average ΔCm measured from rods filled with 10 mM EGTA and stimulated with a Vstep to −18 mV for durations from 0.5 to 30 ms. Single exponential fits to points from 0.5 to 9 ms (red curve), and from 0.5 to 30 ms (dotted curve). Stimulations were delivered in ascending order, and only a single cycle per cell. (B) Comparison of ΔCm derived from experiments with 0.5 or 10 mM EGTA in the pipette; voltage step durations: 0.5–30 ms. (C) Highlights the more rapid ΔCm at the singular time point of 0.5 ms when rods were loaded with 0.5 mM EGTA (*, p: 0.0016; 6 and 8 cells for 0.5 and 10 mM EGTA, respectively). (D) Summary of lock-in amplifier traces recorded during 0.5 ms step depolarizations with either 0.5 or 10 mM EGTA in the pipette (6 and 8 cells, respectively). Dashed Cm traces represent an overlay of individual recordings (cells; each a different color), and the Cm trace presented in bold font represents the average response. Only an overlay of the average responses in low and high EGTA are presented for Gm and Gs with the blue traces corresponding to 0.5 mM EGTA and black traces corresponding to 10 mM EGTA. RRP, readily releasable pool; SV, synaptic vesicle.
Figure 6

ICa facilitation expedites depletion of the RRP.
(A, B) Overlay of average ICa traces in response to step durations of 0.5, 1, and 3 ms (*; sign. diff., p: 0.008). Vertical dashed lines indicate the moment of repolarization. (C) Comparison of average peak-ICa derived from high and low intracellular EGTA. Only voltage steps for 0.5 ms were statistically different when comparing different EGTA levels (p: 0.008; see text). The 0.5 and 1 ms steps were dominated by their tail-currents, which is why their amplitudes varied from step durations ≥3 ms. (D) Plot of ΔCm over QCa. All data points from experiments with 0.5 and 10 mM EGTA were treated as one group and fit with a single exponential equation (red curve) to estimate the size of the RRP (ΔCm amplitude) and the amount of QCa needed to release 63% (~1/e) of the RRP. (E) Plot of ΔCm and QCa values produced with 0.5 and 1 ms steps. * indicates a significant difference for QCa between 0.5 mM versus 10 mM EGTA; p: 0.04, and 6 and 9 cells, respectively. (F) Plot of ΔCm over peak-ICa for step durations: 0.5–30 ms (dashed lines partition data points by step duration). * indicates a significant difference in ICathat is described in (C), and differences in ΔCm are described in Figure 5C. RRP, readily releasable pool.
Figure 7 with 1 supplement

Ribbonless rods lack Cav channel facilitation and form a small RRP of SVs.
(A) Average ΔCm measured from ribbonless rods filled with 10 mM EGTA and stimulated with a Vstep to −18 mV for durations from 0.5 to 30 ms. Single exponential fits to points from 0.5 to 30 ms. Wild-type results are presented for comparison (see Figure 5A). (B) Comparison of all ΔCm responses that were evoked with 1 and 3 ms steps, with either 0.5 or 10 mM EGTA in the pipette, and for wt and ko rods. All ko responses were significantly smaller than wt values, see text. (C) Plot of peak-ICa over Vstep. Ribbonless rods had significantly smaller peak-ICa at the indicated Vstep values (*, p-values<0.05), with comparisons made between wt vs. ko rods for 0.5 mM EGTA (blue dashed line) and 10 mM EGTA (black dashed line). See Figure 3A for a description of voltage step protocols and analysis. (D) ICa activation kinetics were significantly slower for wt rods filled with 10 mM EGTA (* indicates sig. diff.; see Supplementary file 2). (E, F) Average ICa traces measured from rods filled with 10 mM EGTA illustrate the significant differences in peak-ICa at the onset of depolarization (*; p<0.004 and 0.03 for 1 and 3 ms steps; n: 13 wt and 7 ko cells). See Supplementary file 3 for related results with 10 ms steps. (F) wt rods showed a faster rate of ICa inactivation than ko rods. At the end of the 30 ms steps, ICa amplitudes were no longer significantly different (nd; p>0.3); whereas, at the onset they were different (*; p<0.008; n: 8 wt and 7 ko). Supplementary file 3(G) Summary of average peak-ICa measured from wt and ko rods filled with 10 mM EGTA. The 1 ms steps were essentially tail-currents, and therefore larger in amplitude than peak-ICa measured from step durations ≥3 ms. Only the 9 ms steps did not show a significant difference between wt and ko. (H, I) Comparison of ICa recorded with 0.5 mM EGTA in the pipette. Averaged traces presented in (H). In (I), statistical comparisons show no difference in ICa amplitudes resulting from 1 ms steps (nd; p: 0.13; 9, and 11 cells each), while the currents generated with 3 ms steps were significantly larger for wt rods (*, p: 0.05; 9 and 12 cells each). (J, K) ΔCm in response to 1 and 3 ms steps plotted over peak-ICa in (J), and over QCa in (K). Dashed lines partition data points by step duration. See text for discussion. RRP, readily releasable pool; SV, synaptic vesicle.
Figure 7—figure supplement 1
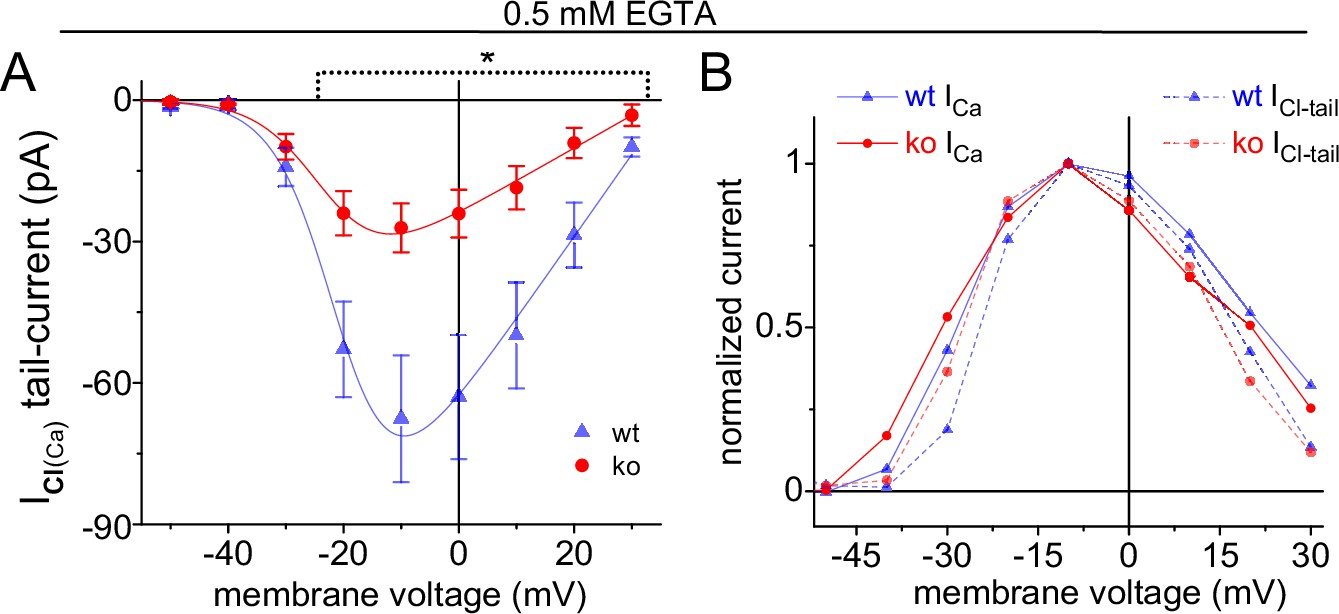
Average ICl(Ca)-tails versus Vstep.
Significant difference indicated by the dashed line (*; p<0.05; 5 ko and 6 wt cells). For Boltzmann I-V fits, see Supplementary file 4. (B) Normalized average ICl(Ca)-tails and peak-ICa plotted over Vstep for wt and ko rods (error bars excluded).
Figure 8
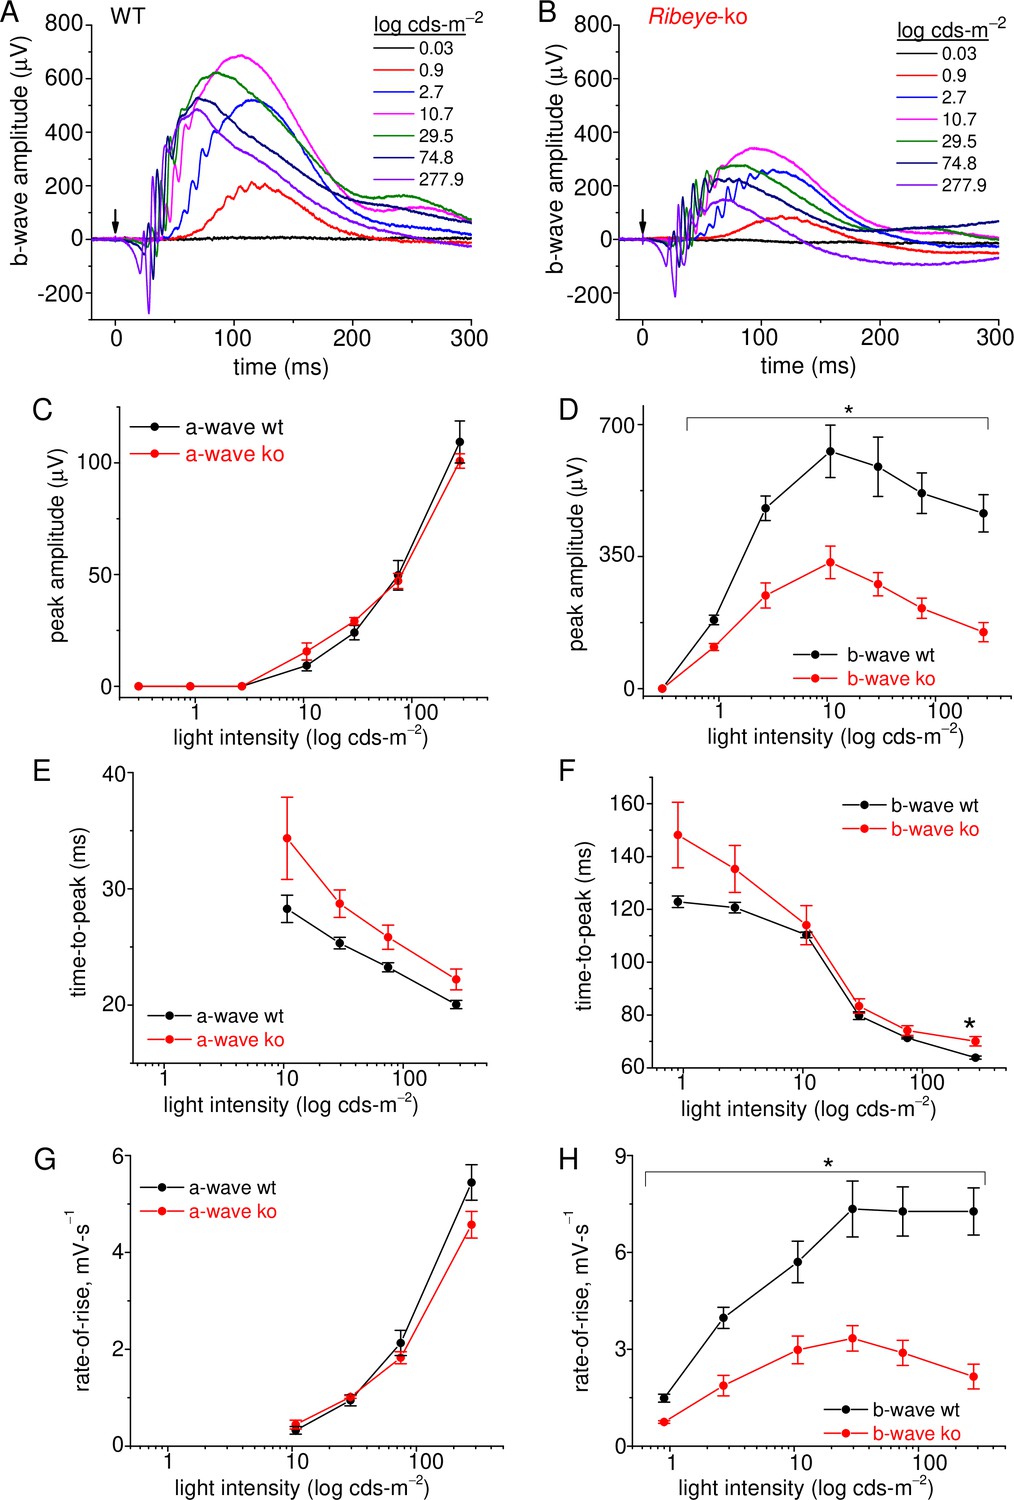
Rod-driven light responses are depressed in Ribeye-ko mice.
(A) Scotopic-ergs recorded from a dark-adapted wt animal. Light flash intensities are indicated in the graph. The arrow marks the moment of the 0.1 ms light flash. Responses are presented at full band-width, without offline filtering. (B) Scotopic-ergs recorded from a dark-adapted Ribeye-ko animal. (C) Summary of erg a-wave amplitudes plotted over the range of light flash intensities shows no significant difference between wt and ko mice. (D) Summary of dark-adapted erg b-waves measured from wt and ko mice shows a significant difference in responses at all flash intensities (*, p<0.04), except at the weakest intensity tested. (E) The a-wave time-to-peak values were not significantly different when comparing genotypes. (F) The b-wave time-to-peak values were similar, except the ko responses were significantly slower at the highest flash intensity (*, p: 0.034). (G) The a-wave rate-of-rise values were not significantly different. (H) The b-wave rate-of-rise was significantly faster for wt than ko mice across the full range of flash intensities (*; p-values: 0.04–0.009). Average values and statistical comparisons presented in C–H were derived from 4 ko and 3 wt mice.
Figure 9

Summary cartoon of the proposed functional organization of a rod AZ.
The wt AZ in (A) docks more SVs than the ribbonless AZ (B) .The two images in each panel are rotated by 90° relative to the plane of the ribbon. Legend: ribbon (orange), active zone (thick red line), arciform density (green diamond), ribbon flanked by synaptic ridges (thick black lines), horizontal cells (HC, in blue), and rod bipolar cell dendrite (yellow) with mGluR6 receptors (red). SV, synaptic vesicle.
Additional files
-
Transparent reporting form
- https://cdn.elifesciences.org/articles/63844/elife-63844-transrepform1-v2.docx
-
Supplementary file 1
Whole-cell patch-clamp recording parameters.
- https://cdn.elifesciences.org/articles/63844/elife-63844-supp1-v2.docx
-
Supplementary file 2
Activation kinetics for Ca2+-currents measured from wild type and Ribeye-ko rods filled with 0.5 or 10 mM EGTA.
- https://cdn.elifesciences.org/articles/63844/elife-63844-supp2-v2.docx
-
Supplementary file 3
Peak-ICa−Voltage relationship for wild type and Ribeye-ko rods filled with 0.5 or 10 mM EGTA.
Comparison of different intracellular concentrations of EGTA (within each genotype).
- https://cdn.elifesciences.org/articles/63844/elife-63844-supp3-v2.docx
-
Supplementary file 4
Comparison of Ca2+-activated Cl--tail currents measured from wild type and Ribeye-ko rods filled with 0.5 mM EGTA.
- https://cdn.elifesciences.org/articles/63844/elife-63844-supp4-v2.docx
Download links
A two-part list of links to download the article, or parts of the article, in various formats.
Downloads (link to download the article as PDF)
Open citations (links to open the citations from this article in various online reference manager services)
Cite this article (links to download the citations from this article in formats compatible with various reference manager tools)
The mammalian rod synaptic ribbon is essential for Cav channel facilitation and ultrafast synaptic vesicle fusion
eLife 10:e63844.
https://doi.org/10.7554/eLife.63844


