HP1α is a chromatin crosslinker that controls nuclear and mitotic chromosome mechanics
- Howard Hughes Medical Institute, Department of Chemical and Biological Engineering, Princeton University, United States
- Department of Molecular Biosciences, Northwestern University, United States
- Institute for Medical Engineering and Science and Department of Physics, Massachusetts Institute of Technology, United States
- Department of Biochemistry and Molecular Genetics, Feinberg School of Medicine, Northwestern University, United States
- Biology Department, University of Massachusetts Amherst, United States
- Robert H. Lurie Comprehensive Cancer Center, Feinberg School of Medicine, Northwestern University, United States
- The Fred Hutchinson Cancer Research Center, United States
- Department of Physics and Astronomy, Northwestern University, United States
Figures
Figure 1 with 1 supplement
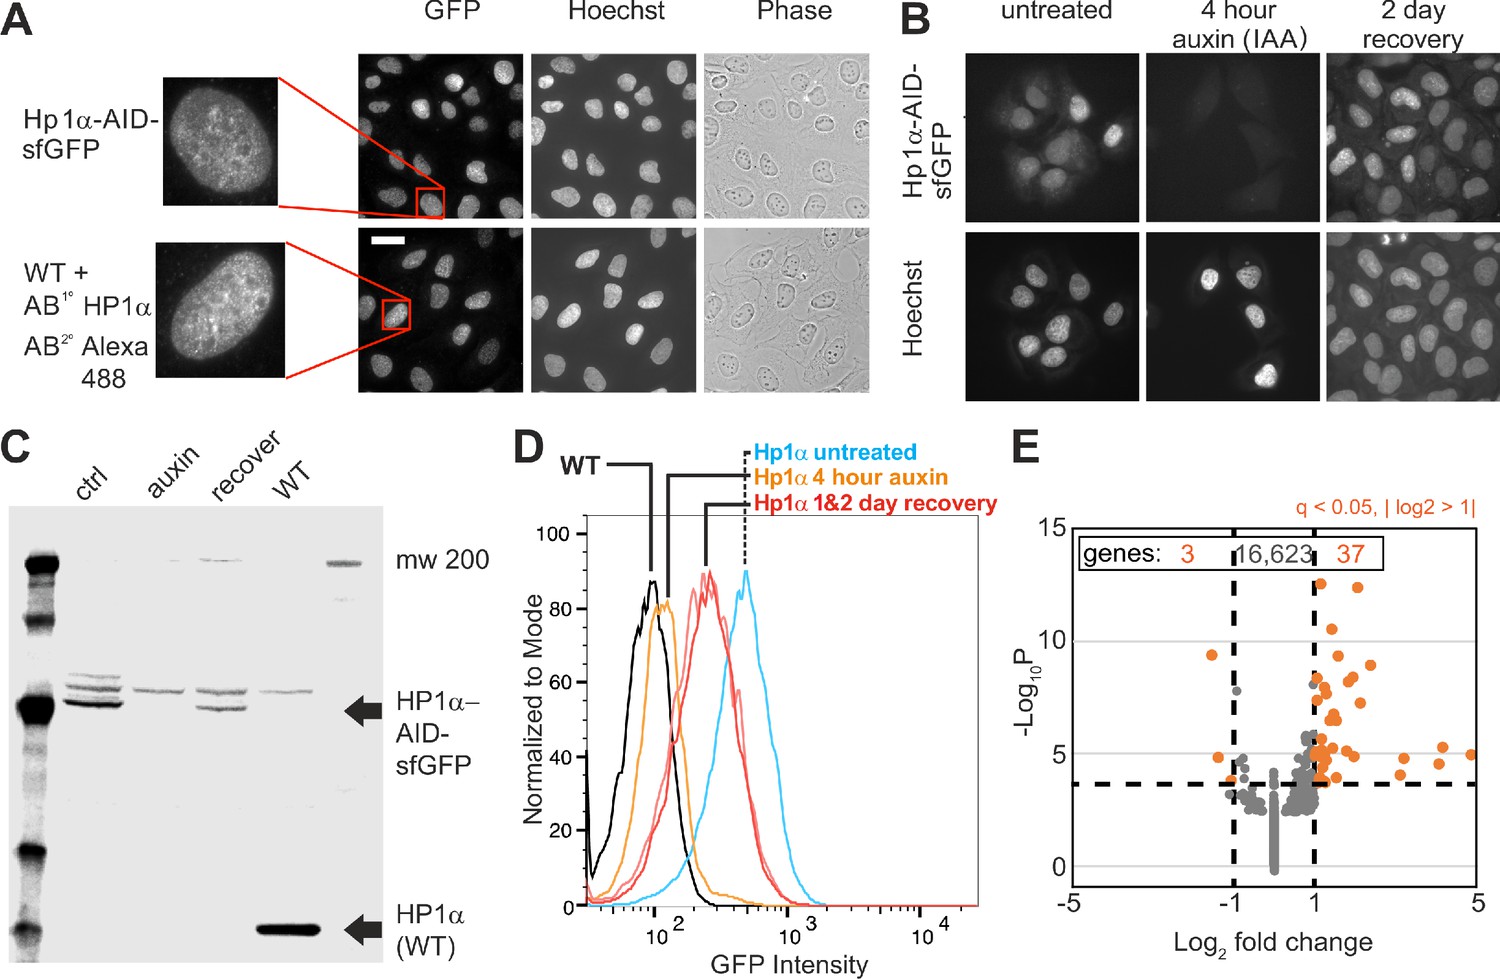
Generation of an CRISPR endogenous HP1α-auxin-inducible-degron-sfGFP cell line.
(A) Example images of HP1α-AID-sfGFP relative to wild-type cells stained for HP1α via immunofluorescence along with Hoechst DNA stain and phase contrast images. Scale bar = 20 μm. (B) Example images of HP1α-AID-sfGFP before, after 4 hr of auxin treatment, and 2 days post auxin removal. Hoechst DNA stain aids labeling of nuclei. (C) Western blot and (D) Flow cytometer graph of GFP intensity of control (ctrl/untreated), auxin-treated for 4 hr, 2 days after removal of auxin, and wild-type (WT) showing short-term loss and recovery of HP1α-AID-sfGFP. (E) Graph of RNA-seq data showing that few genes change transcript levels as determined by q-value <0.05 (calculated via -Log10P) and absolute change of Log2 fold >1 (marked in orange), with expression of only 40 out of of 16,663 genes changing significantly comparing control/untreated versus 4 hr auxin-treated.
Figure 1—figure supplement 1
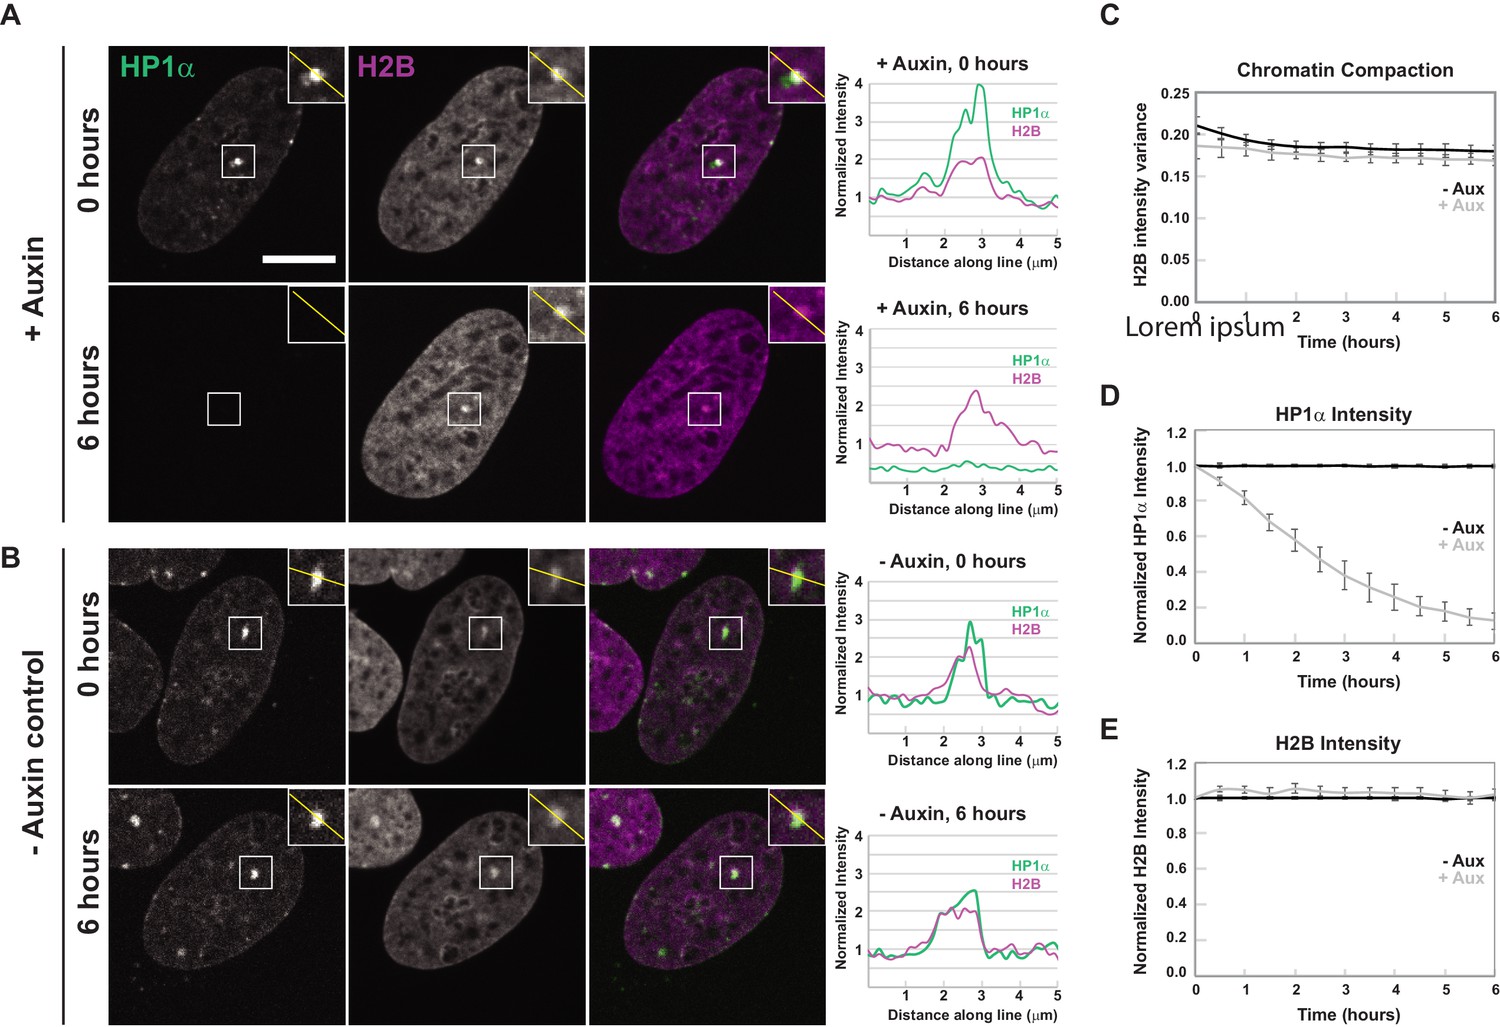
Local chromatin compaction remains after HP1α degradation.
(A, B) Example images and line scans of HP1α-AID-sfGFP and histone 2B (H2B-miRFP) before and after addition of (A) + auxin or (B) - auxin control. Scale bar = 10 μm. Graphs of average (C) chromatin compaction, (D) HP1α-AID-sfGFP intensity, and (E) H2B intensity for control (- auxin, black line) and HP1α degradation (+auxin, gray line). N = 3 trials, n = 20, 20, 20 nuclei per trial, total n = 60 nuclei.
Figure 2 with 3 supplements
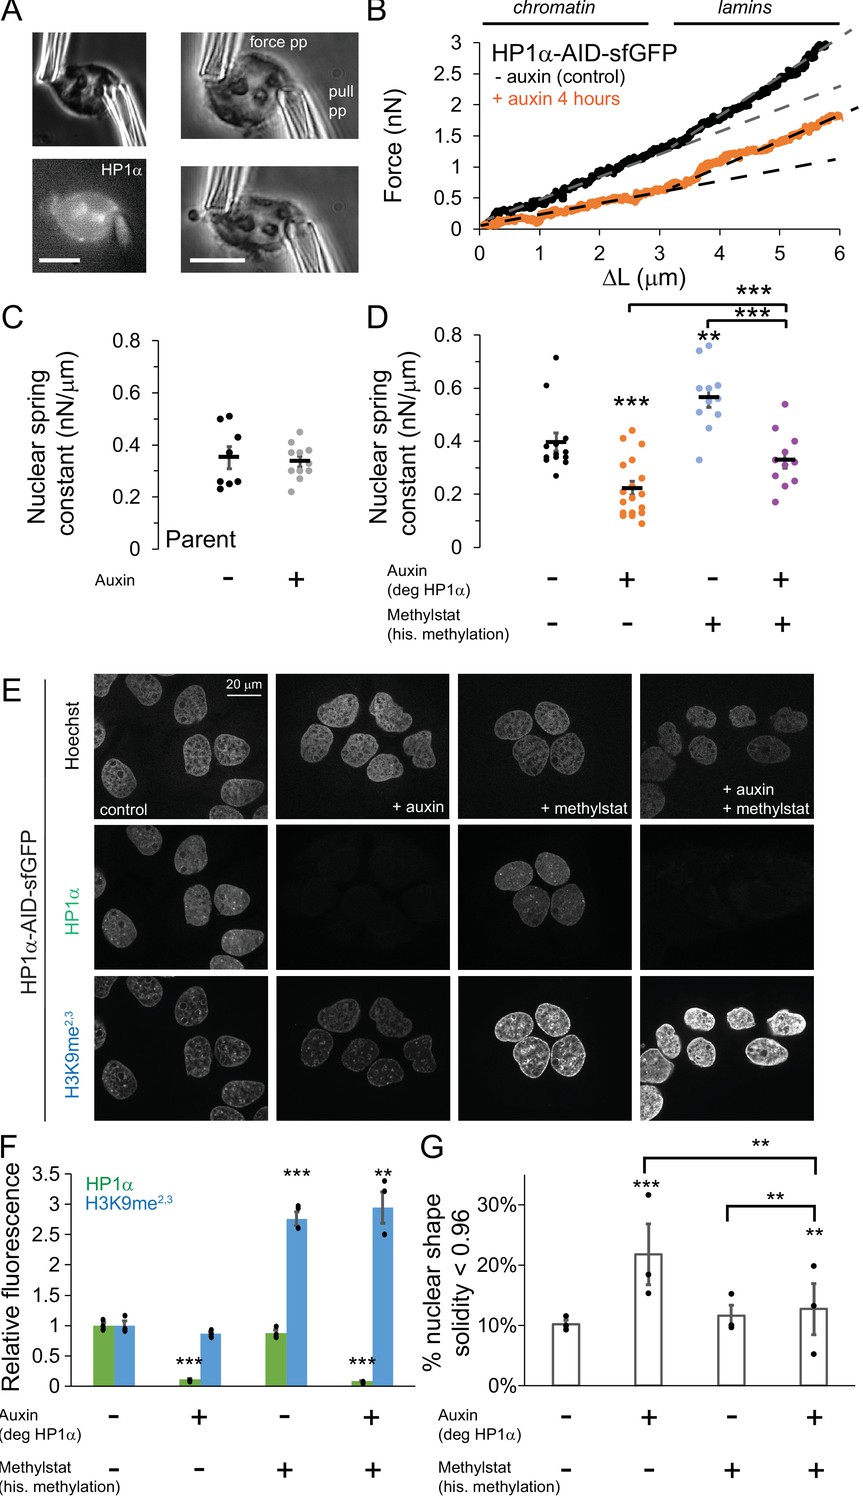
HP1α is a mechanical component of the nucleus controlling nuclear shape, separately from histone methylation.
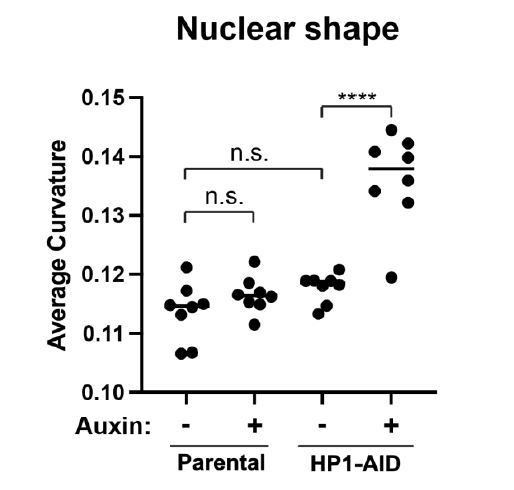
(A) Example images of a single isolated nucleus via transmitted light and HP1α-AID-sfGFP fluorescence and single nucleus micromanipulation force-extension measurement experiment. The pull pipette extends the nucleus while the bending of a premeasured force pipette provides the force measurement. Scale bar = 10 μm. (B) Example traces of micromanipulation force-extension for control (black) and auxin-induced degradation of HP1α (orange) provide a measure of nuclear spring constant from the slope (dotted lines). Initial slope provides chromatin-based nuclear spring constant while the second slope provides the lamin-based strain stiffening nuclear spring constant. (C and D) Graphs of average and single chromatin-based nuclear spring constant for (C) parental cell line control and 4–6 hr auxin treated and (D) HP1α-AID-sfGFP with and without auxin and/or methylstat treatment. n = 11–18 nuclei each. (E) Example images of cells treated with and without auxin and/or methylstat. (F) Quantified relative fluorescence of HP1α-AID-sfGFP and heterochromatin marker H3K9me2,3. (G) Quantified abnormal nuclear morphology determined as solidity value less than 0.96, statistics via chi-squared analysis. Another way to quantify abnormal nuclear morphology is via average nuclear curvature reported in Figure 2—figure supplement 2. Three biological experiments (shown as black dots) each consisting of n = 109, 102, 105 control; n = 137, 115, 165 auxin, n = 31, 34, 32 methylstat, and n = 102, 92, 78 auxin methylstat. Average measurements were similar for control, methystat, and auxin with methylstat 0.971 ± 0.0001 but different for auxin 0.969 ± 0.0015, p=0.005. p values reported as *<0.05, **<0.01, ***<0.001, no asterisk denotes no significance, p>0.05. Error bars represent standard error.
Figure 2—figure supplement 1
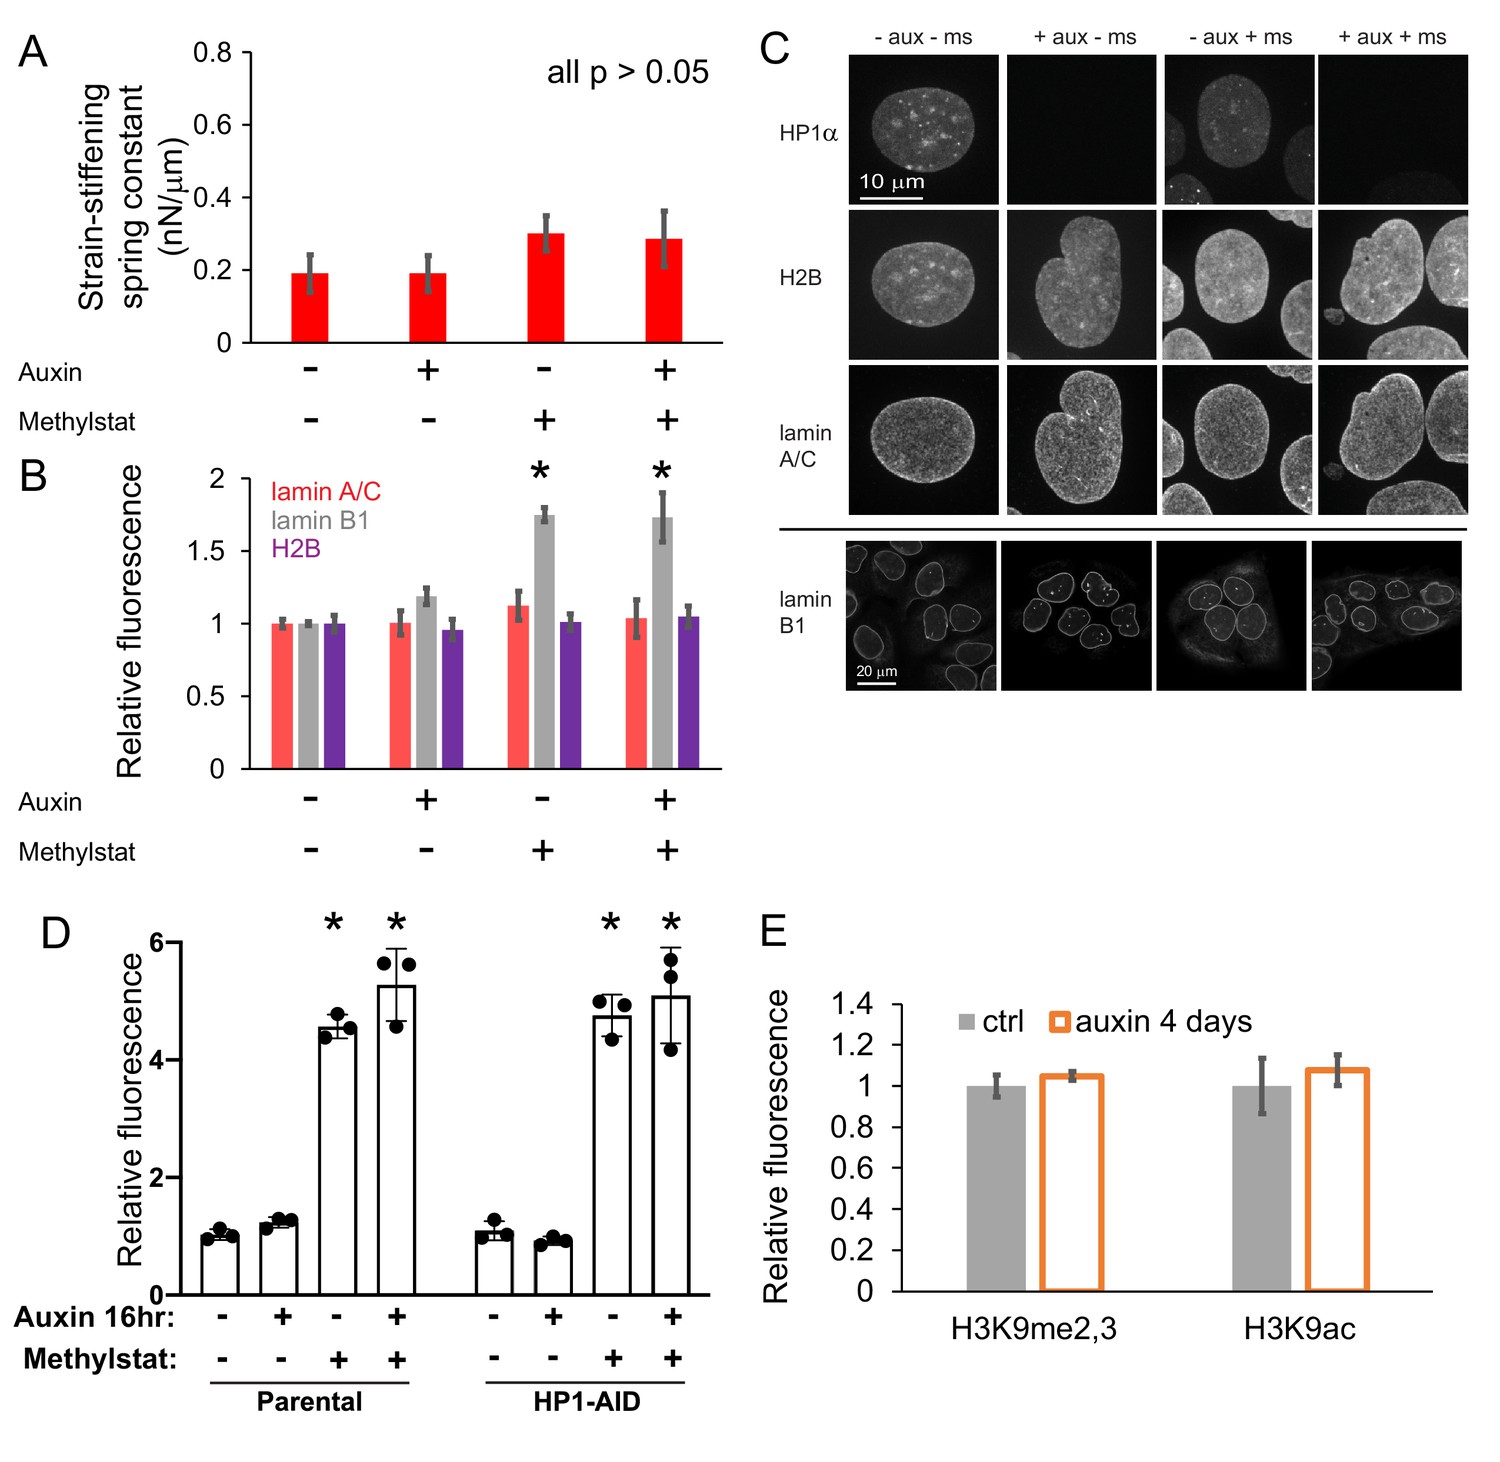
Lamin mechanics and levels do not change upon degradation of HP1α.
(A) Strain-stiffening nuclear spring constant measured as the long extension force-extension slope minus the short extension (chromatin-based) force-extension slope. n > 9 for each condition. This data was taken simultaneously with force data presented in Figure 2. (B) Graph of the average relative fluorescence for lamin A/C and lamin B1 levels upon auxin and/or methylstat treatment. For lamin A/C and H2B N = 3 experiments where total n is HP1α-AID-sfGFP untreated (-/-) n = 91, auxin (+/-) n = 81, methylstat (-/+) n = 87, and auxin with methylstat n = 90. For lamin B1 this data was acquired along with those presented in Figure 2, E and F where the n values are reported. p Values reported as *<0.05, **<0.01, ***<0.001. (C) Example images. (D) Normalized to parental control, immunofluorescence signal of H3K9me2,3 for parental and HP1α-AID-sfGFP modified cell lines without or with treatment of auxin for 16 hr and/or methylstat for 48 hr. Three experimental biological replicates parental -/- n = 216, 128, 229;±n = 307, 324, 215; -/+ n = 188, 115, 155; +/+n = 184, 258, 284; HP1α-AID-sfGFP -/- n = 108, 101, 104;±n = 136, 114, 164; -/+ n = 30, 33, 31; +/+n = 102, 91, 77. (E) Normalized immunofluorescence for H3K9me2,3 and H3K9ac in HP1α-AID-sfGFP - or +auxin for 4 days (96 hr) for six experimental replicates - auxin (218, 246, 263, 186, 238, 265) and +auxin (188, 184, 174, 208, 199, 187). p Values reported as *<0.05, **<0.01, ***<0.001, no asterisk denotes no significance p>0.05, calculated by student’s t-test. Error bars represent standard error.
Figure 2—figure supplement 2
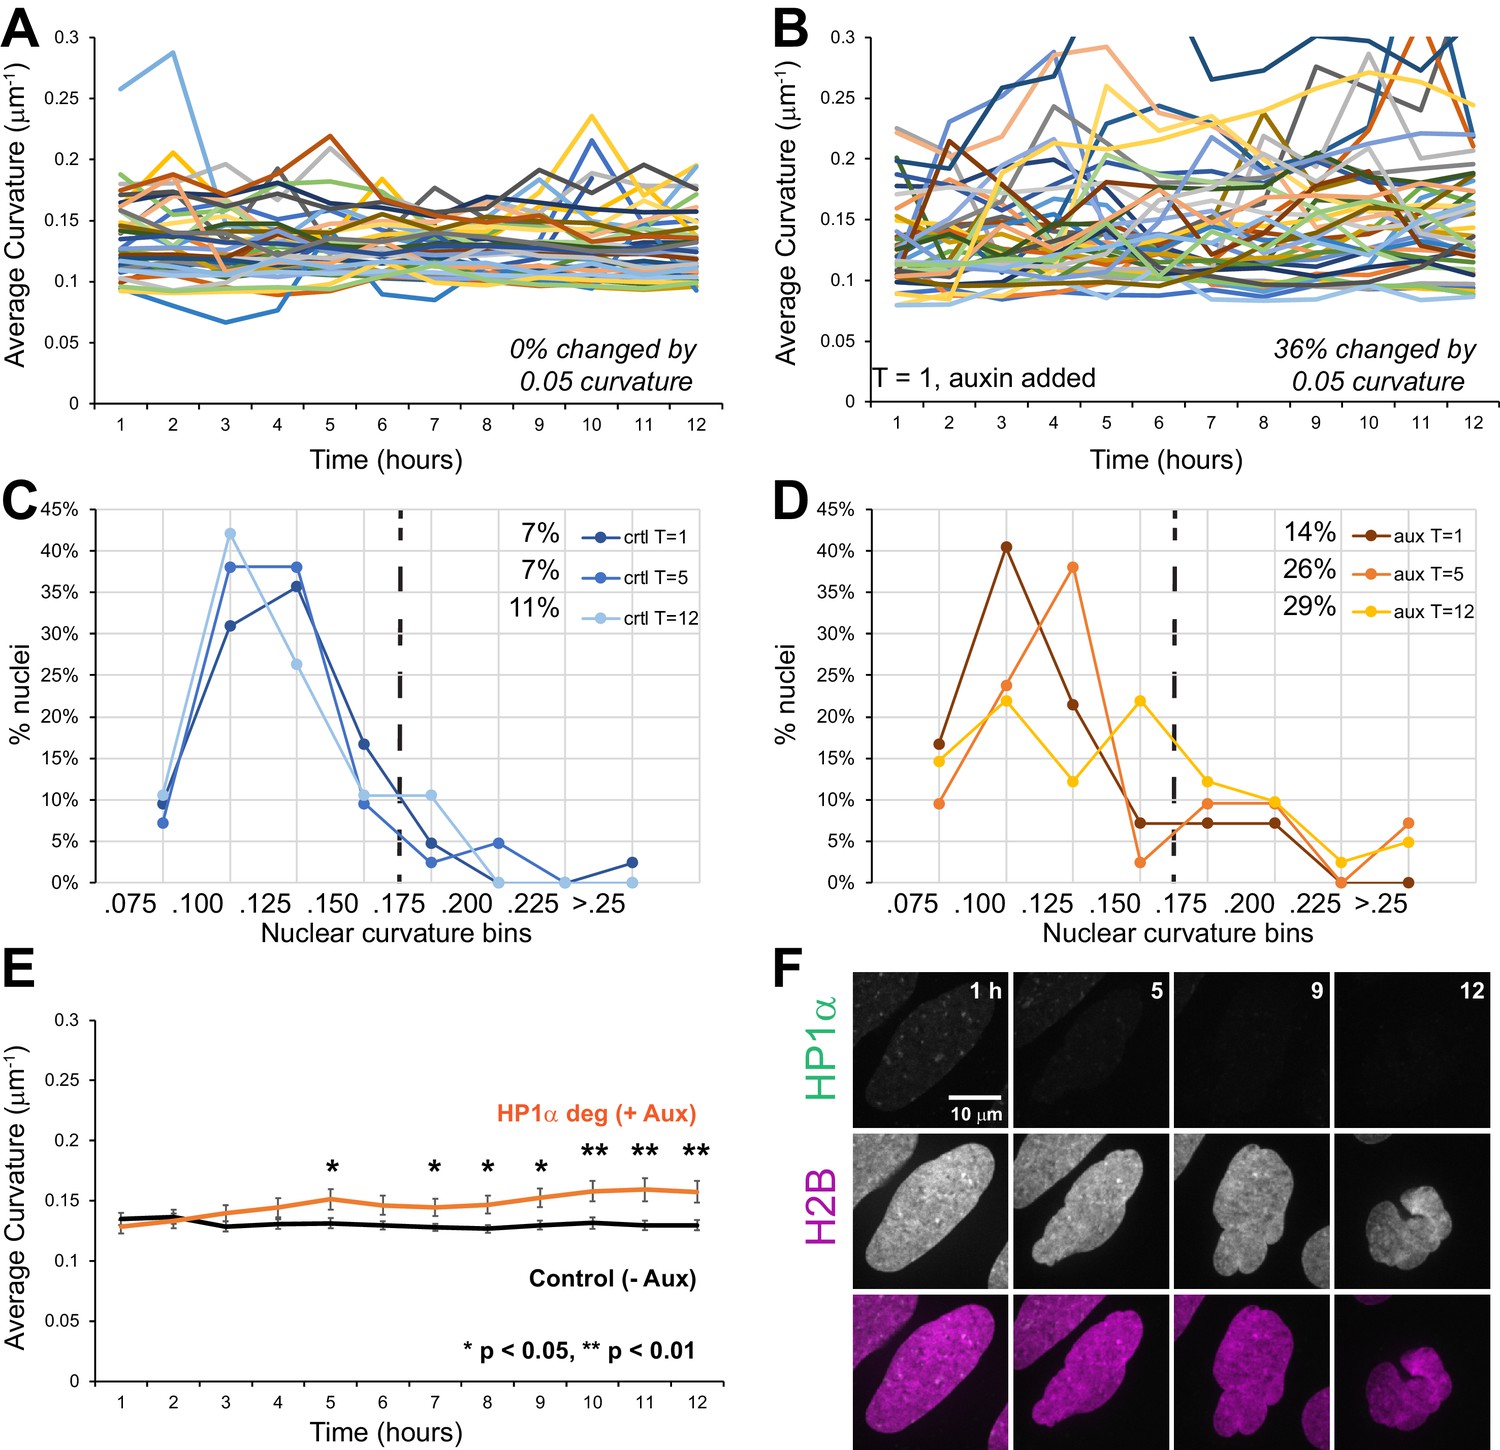
Increased nuclear curvature onsets coincident with HP1α loss during interphase.
Graphs of average nuclear curvature for single cells over time for U2OS HP1α-AID-sfGFP expressing H2B-miRFP (A) without auxin and (B) with auxin added. Percentage of nuclei that drastically (>0.05 μm−1 curvature change) and stably (more than three time points) changed shape are denoted in the bottom-right corner. Histograms of (C) untreated (ctrl) and (D) auxin-treated (aux) nuclear curvature at time 1, 5, 12 hr. The dotted line denotes abnormally shaped nuclei (curvature >0.175 μm−1), and the numbers in the upper right are percentages of abnormal nuclei. (E) Average population nuclear curvature over time with (gray) and without (black) the addition of auxin at time zero. Error bars represent standard error, n = 42 nuclei each condition. (F) Example images of single nucleus treated with auxin over time shows loss of normal elliptical morphology during interphase. p Values reported as *<0.05, **<0.01, ***<0.001, calculated by student’s t-test.
Figure 2—figure supplement 3
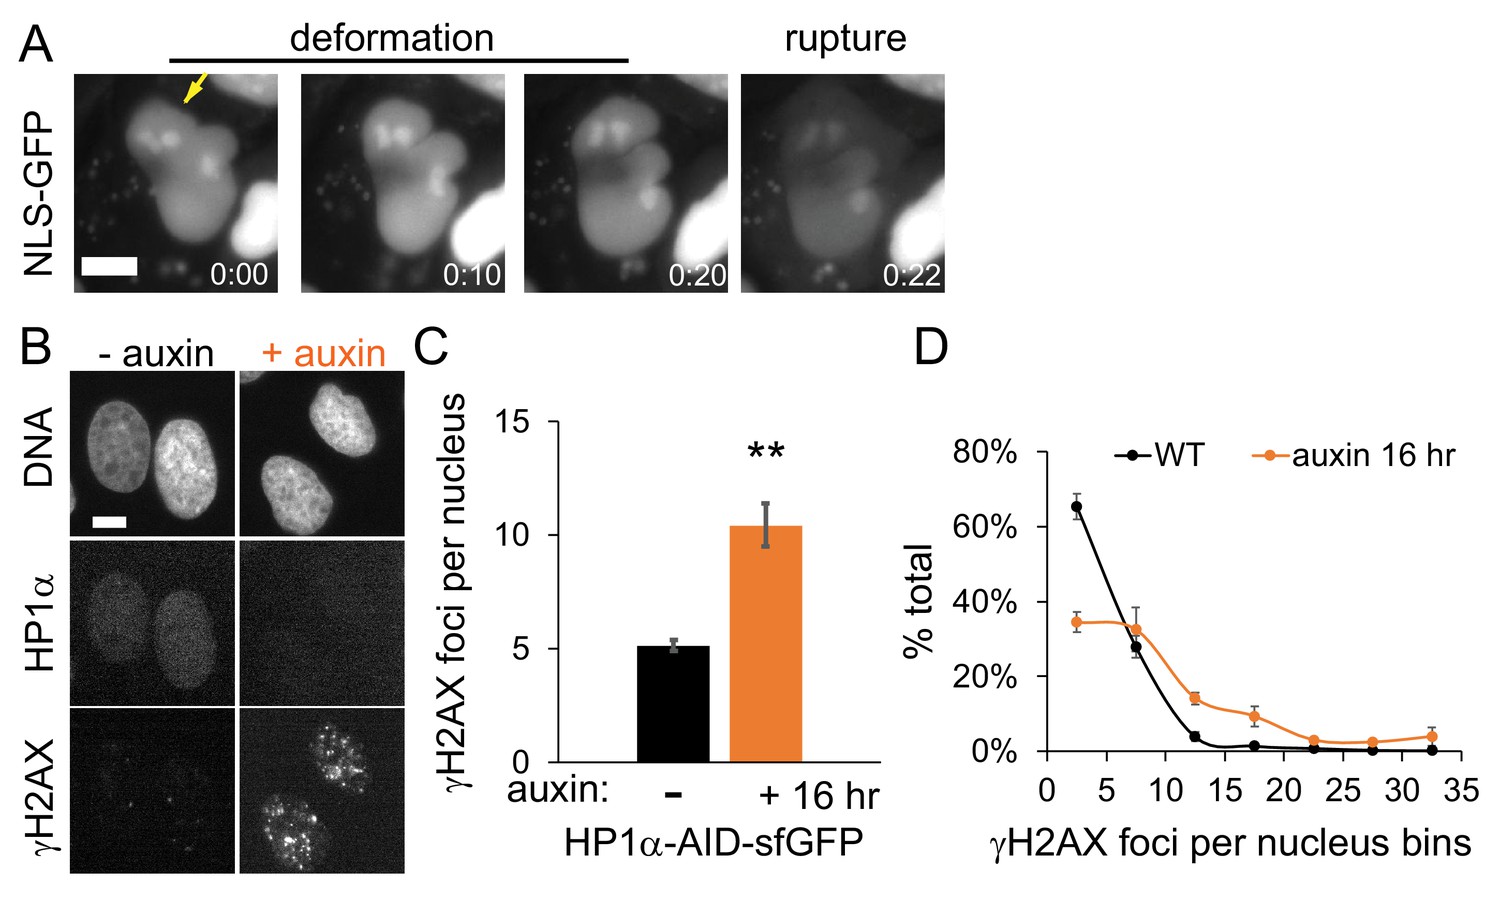
HP1α-degraded nuclei display nuclear rupture, increased DNA damage, and abnormal nuclear morphology post mitosis.
(A) Representative images from time-lapse imaging of NLS-RFP HP1α-AID-sfGFP in cells treated with auxin for 4 hr reveal that loss of nuclear shape also results in nuclear rupture and loss of nuclear compartmentalization. Bottom right denotes minutes after the first image. (B–D) HP1α-AID-sfGFP cells -/+auxin for 16 hr were imaged for DNA damage marker ϒH2AX. (B) Representative images show nucleus with Hoechst DNA stain, HP1α-AID-sfGFP, and ϒH2AX. (C) Graph of average ϒH2AX foci and (D) histogram of ϒH2AX foci of per nucleus for -/+auxin 16 hr. Four replicate experiments were performed for control (110, 189, 112, 155) and auxin-treated for 16 hr (145, 89, 94, 97). p Values reported as *<0.05, **<0.01, ***<0.001, calculated by student’s t-test. Error bars represent standard error. Scale bar represents 10 μm.
Figure 3

HP1α dimerization is essential for maintenance of nuclear shape.
(A) Example images of HP1α-AID-sfGFP cells control (-Aux) and auxin treated (+Aux) with and without exogenous HP1α wild-type (WT) or dimer mutant (I165E) rescue constructs tagged with mCherry. Scale bar = 10 μm. (B) Graph of average nuclear curvature measurements with individual trials as black dots. (C) Graph of percentage of abnormally shaped nuclei, determined as greater than 0.15 μm−1 curvature, which is the average untreated nucleus plus the standard deviation. Eight experimental biological replicates were measured for each condition (denoted as black dots) consisting of -auxin, n = 37, 45, 45, 57, 58, 57, 55, 54; +auxin, n = 60, 44, 41, 60, 60, 60, 60, 60; +auxin and WT exogenous rescue, n = 27, 30, 36, 60, 60, 60, 60, 19; +auxin and I165E exogenous rescue, n = 38, 40, 50, 59, 56, 58, 58, 51. p values reported as no asterisk >0.05, *<0.05, **<0.01, ***<0.001, calculated by one-way ANOVA. Error bars represent standard error.
Figure 4
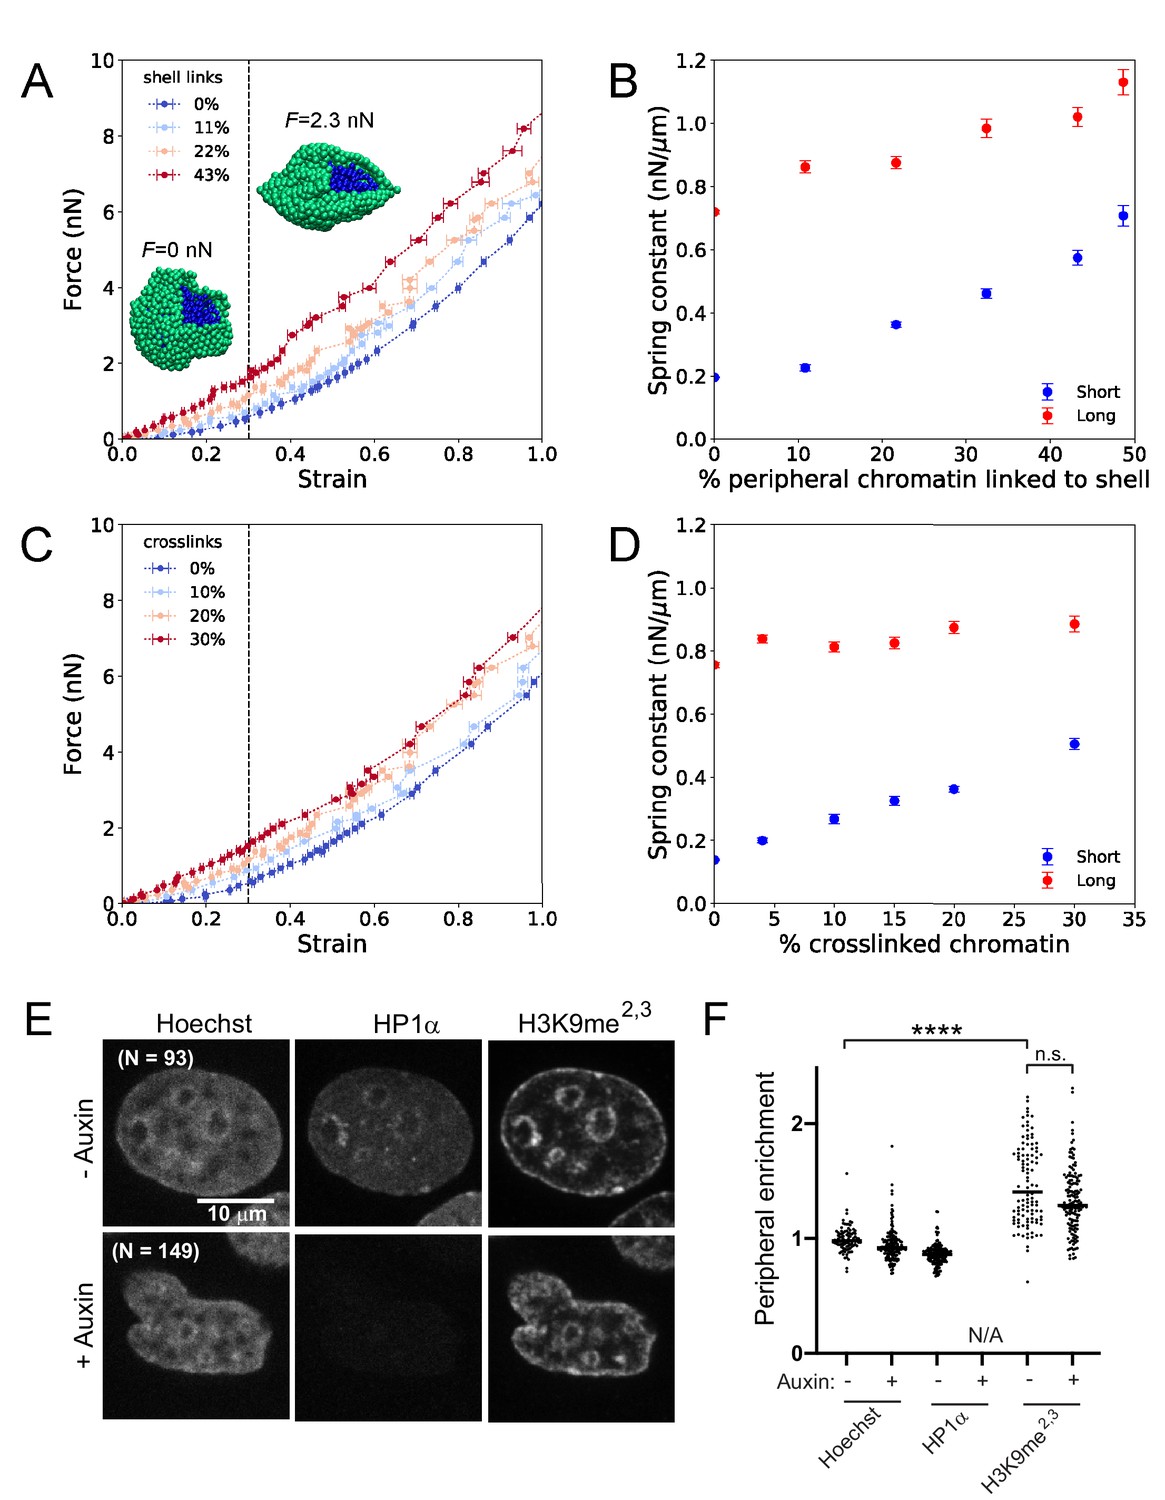
Simulations of nuclear mechanical response and experimental measurements of peripheral heterochromatin support a model with HP1α as a chromatin-chromatin crosslinker.
(A) Force-strain relationship for simulated nuclei with various levels of chromatin-lamina (shell) linkages. Colors indicate different percentages of chromatin segments linked to the lamina. Insets: Snapshots of simulations with a portion of the lamina (green) removed to reveal the interior chromatin (blue) for two different applied stretching forces, F. (B) Spring constants for short- and long-extension regimes for simulations with various levels of chromatin-lamina crosslinks, quantified by percentage of peripheral chromatin subunits linked to the shell (blue and red, respectively). (C) Force-strain relation for simulated nuclei with various levels of chromatin-chromatin crosslinks. (D) Spring constants for short- and long-extension with varying levels of chromatin-chromatin crosslinks (blue and red). Vertical dashed lines in (A) and (C) separate the short-extension and long-extension regimes. Each force-strain data point in (A) and (C) is an average that is computed from n ≥ 11 simulations. Short-extension spring constants in (B) and (D) are each computed from nshort ≥13 and 10 force-extension data points, respectively. Long-extension spring constants in (B) and (D) are each computed from nlong ≥19 and 15 force-extension data points, respectively. (E) Example images of HP1α-AID-sfGFP nuclei untreated or auxin-treated, analyzed for (F) enrichment measurements (peripheral/internal average signal) to determine peripheral enrichment of DNA (Hoechst), HP1α, and H3K9me2,3. p values denoted as n.s. >0.05 and ****<0.0001, calculated by one-way ANOVA. Error bars in (A)-(D) show standard error of the mean.
Figure 5 with 1 supplement
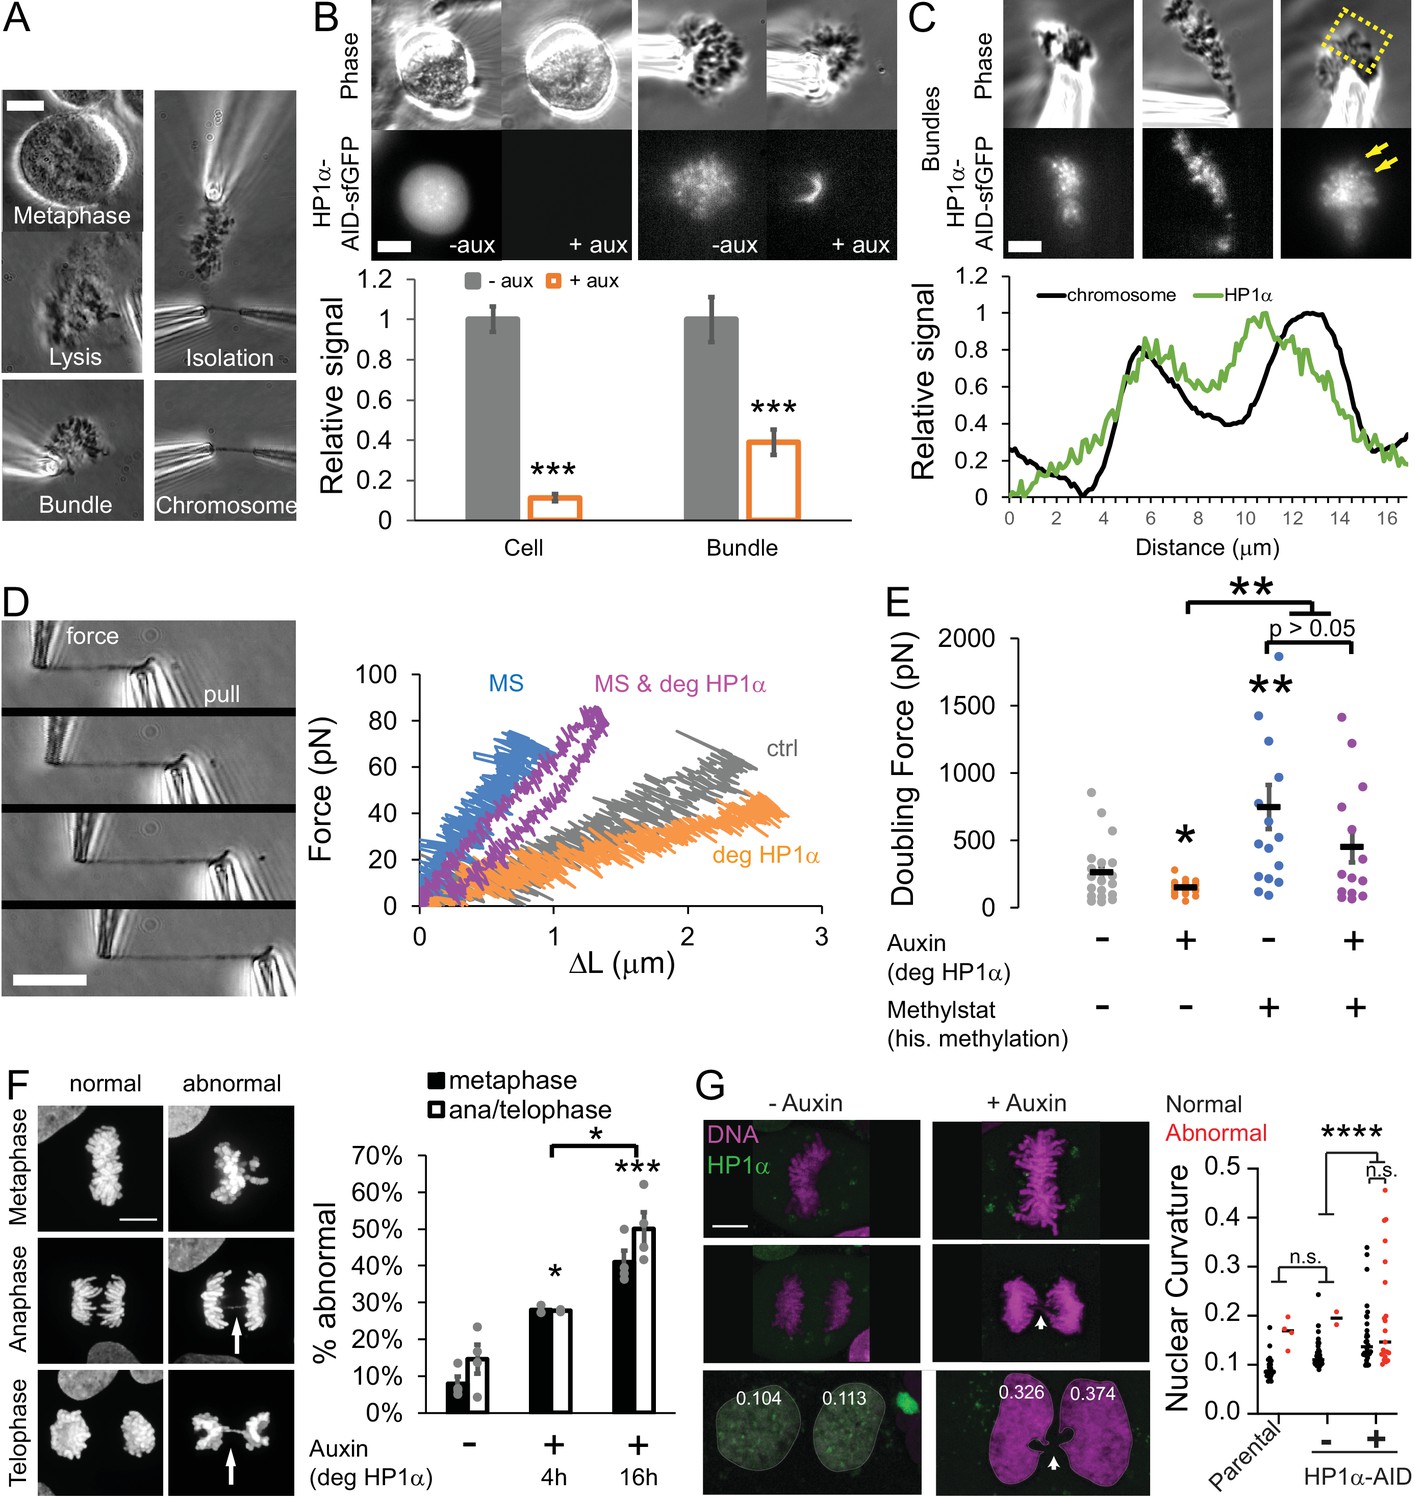
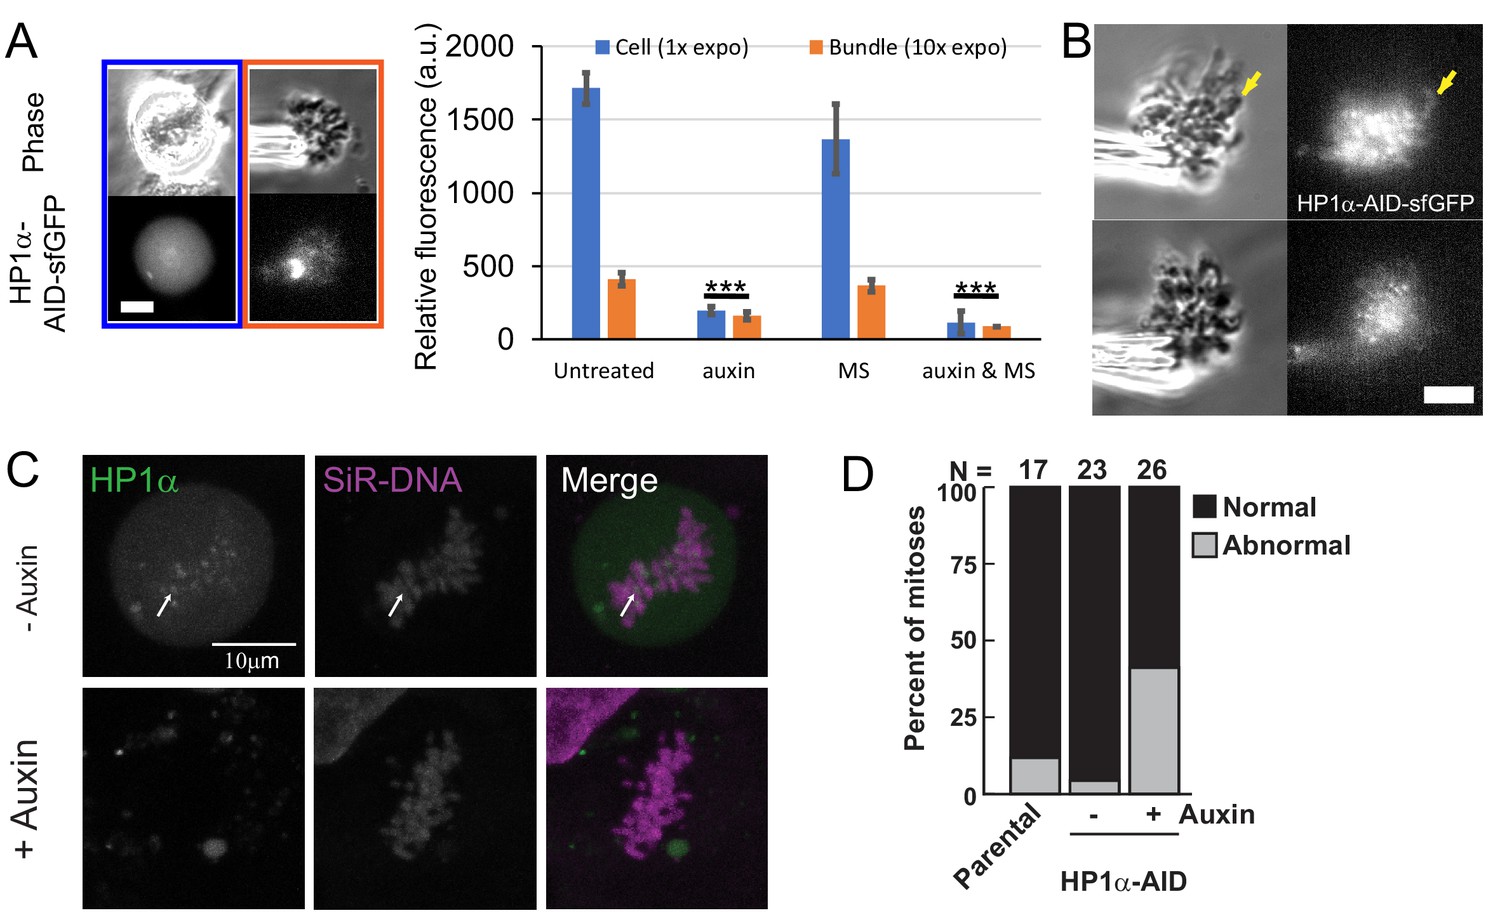
HP1α is a mechanical component of the mitotic chromosome aiding proper segregation in mitosis.
(A) Example image of the steps to isolating a mitotic chromosome from a live cell using micropipettes. (B) Representative live mitotic cells and isolated mitotic chromosome bundles imaged via phase contrast and HP1α-AID-sfGFP fluorescence intensity across treatments. Values calculated by measuring the cell’s or chromosome bundle’s fluorescence minus the background fluorescence, normalized to the average intensity of the untreated cellular HP1α fluorescent intensity. p Values reported as ***<0.001, calculated by student’s t-test. (C) Example images of the endogenous HP1α-AID-sfGFP fluorescence of an isolated mitotic bundle outside of the lysed cell. Yellow box denotes the area where the graphed line scan was drawn. The line scan reveals HP1α on chromosome arms. (D) Example images of a force-extension experiment. The right pipette pulls away from the left pipette, which stretches the chromosome and causes the left pipette to deflect. The left ‘force’ pipette has a premeasured bending constant (in pN/um) to calculate force. Left graph, example traces of force-extension experiments for the different conditions. (E) Graph of average doubling force (100% strain) in picoNewtons for each condition, which is determined by slope of the force extension traces and the initial chromosomes length. For B-E, n = 20 for control and auxin treated, n = 16 for methylstat, and n = 14 auxin methylstat treated, p values calculated by student’s t-test. (F) Example images of abnormal mitotic segregation via anaphase bridge or nondisjunction. Graphs of percentage of mitotic cells displaying abnormal metaphase misalignment (black bars) and anaphase/telophase missegregation (white bars) via presence of anaphase bridges or nondisjunction/aneuploidy in control untreated cells (-) or auxin-treated (+) cells for 4 or 16 hr. Metaphase misalignment three to four biological replicate experiments (black dots) consisting of n = 16, 15, 20, 37 -aux, n = 33, 33, 24 +aux 4 hr, n = 22, 48, 58, 54 +aux 16 hr. Anaphase and telophase missegregation 3–4 experiments (black dots) consisting of n = 29, 23, 30, 30 -aux, n = 32, 29, 18 +aux 4 hr, n = 20, 35, 36, 45 +aux 16 hr. p values reported as *<0.05, **<0.01, ***<0.001, ****<0.0001, calculated by Student’s t-test. (G) HP1α-AID-sfGFP cells - auxin or +auxin for 24 hr were tracked through mitosis to determine if abnormal mitosis results in abnormally shaped daughter nuclei measured via nuclear curvature (parental 34 nuclei from 17 mitoses; -auxin 46 nuclei from 23 mitoses; +auxin 51 nuclei from 26 mitoses, p value from one-way ANOVA). Percentage of abnormal mitosis presented in Figure 5—figure supplement 1D. Error bars represent standard error. Scale bar in A-C = 10 μm and F = 20 μm.
Figure 5—figure supplement 1
HP1α-AID-sfGFP displays cell and chromosome fluorescence and upon its degradation mitotic errors occur leading to higher curvature nuclei.
(A) HP1a-AID-sfGFP total fluorescence counts compared between mitotic cells and isolated mitotic chromosome bundles, which we imaged at 10-times the exposure time and same power, for untreated, auxin 4 hr, methylstat 2 days, and auxin +methylstat. (B) Example images of whole chromosomes decorated with HP1α-AID-sfGFP in isolated chromosome bundles. (C) In vivo confocal imaging of HP1α-AID-sfGFP relative to SiR-Hoechst labeling reveals pericentromeric foci concentration. (D) Tracking of the parental cell line, HP1α-AID-sfGFP 24 hr - auxin and +auxin-treated cells through mitosis for normal or abnormal behavior denoted by chromosome bridges (also reported in Figure 5G). This data is analyzed from the same data as presented in main Figure 5G, which shows nuclear curvature daughter nuclei.
Figure 6
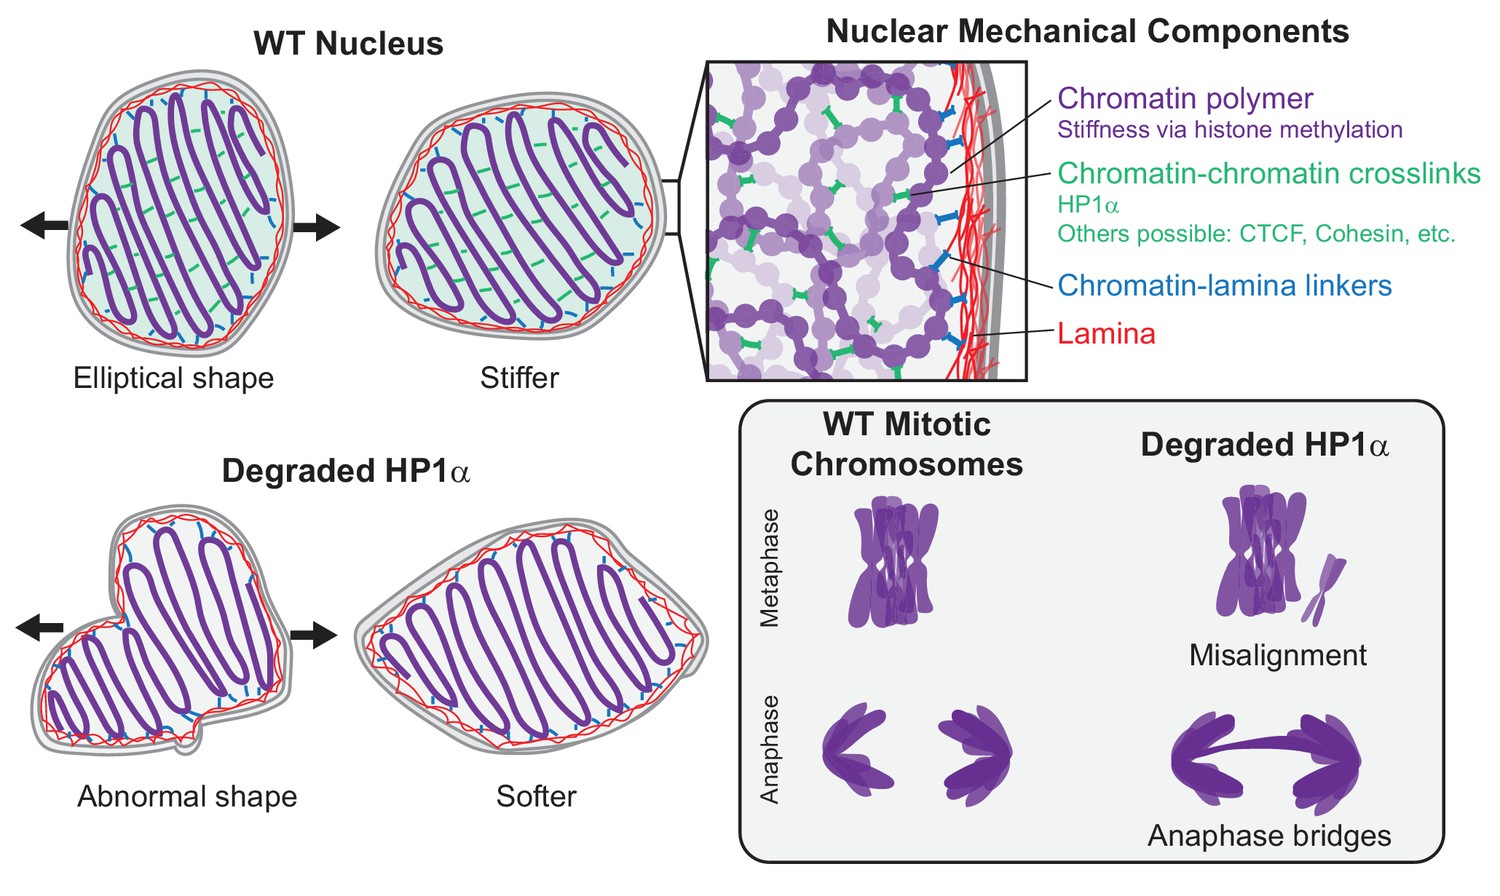
HP1α is a mechanical element of interphase nuclei and mitotic chromosomes.
In wild-type (WT) nuclei, HP1α acts as a chromatin-chromatin crosslinker, resulting in stiffer nuclear mechanics. Other components that contribute to nuclear mechanics include the chromatin polymer (whose mechanical contribution is dictated by histone methylation), the lamina, and chromatin-lamina linkages. Nuclei with HP1α degraded have abnormal shape and softer chromatin-based short-extension mechanical response. Degradation of HP1α also leads to softer mitotic chromosomes and mitotic defects, including chromosome misalignment and anaphase bridges.
Author response image 1

Author response image 2
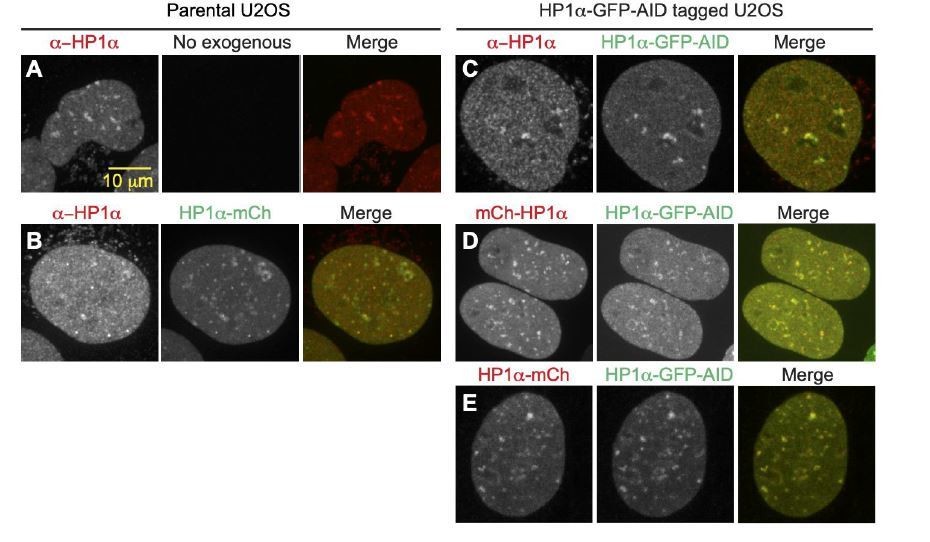
A.
Antibody stain with anti-HP1α in parental U2OS showing endogenous localization to heterochromatic areas and around nucleoli. B. Antibody stain with anti-HP1α in parental U2OS expressing exogenous C-terminally tagged HP1α-mCherry, showing similar localization around nucleoli and in heterochromatic areas. C. Antibody stain with anti-HP1α in HP1 α-GFP-AID C-terminally tagged cell-line, showing colocalization between antibody and GFP tag, and normal localization around nucleoli. D. Co-expression of N-terminally tagged exogenous mCherry-HP1α and endogenously tagged HP1 α-GFP-AID showing no difference in protein localization between N-terminal and C-terminal tagged populations. E. Co-expression of C-terminally tagged exogenous HP1α-mCherry and endogenously tagged HP1α=GFP-AID showing no difference in protein localization between endogenous and exogenous C-terminally tagged proteins.
Author response image 3
Tables
Key resources table
| Reagent type (species) or resource | Designation | Source or reference | Identifiers | Additional information |
|---|---|---|---|---|
| Gene (H. sapiens) | CBX5 | GenBank | ||
| Cell line (H. sapiens) | U20S | ATCC | ATCC HTB-96 | RRID:CVCL_0042 |
| Transfected construct (H. sapiens) | 3' HP1α-AID- sfGFP 2A PuroR | Addgene | 127906 | RRID:Addgene_127906 |
| Transfected construct (H. sapiens) | Guide RNA/Cas9 plasmid pX330 human 3' HP1α gRNA | Addgene | 127906 | RRID:Addgene_127906 |
| Sequence-based reagent | Guide RNA sequence, 5’- acagcaaagagctaaaggag −3' | This paper | ||
| Transfected construct (H. sapiens) | HP1α-mCherry | This paper, in pHR vector | HP1α PCR from Addgene_17652 | |
| Transfected construct (H. sapiens) | HP1αI165E- mCherry | This paper, in pHR vector | Point mutant made with quickchange | |
| Antibody | Anti-HP1 alpha (rabbit monoclonal) | Abcam | ab109028 | (1:250) RRID:AB_10858495 |
| Antibody | anti-H3K9me2/3 (mouse monoclonal) | Cell Signaling | 5327 | (1:100) RRID:AB_10695295 |
| Antibody | anti-Lamin B1 (rabbit polyclonal) | Abcam | ab16048 | (1:500) RRID:AB_443298 |
| Antibody | anti-Lamin A/C (mouse monoclonal) | Active Motif | 39287 | (1:1000) RRID:AB_2793218 |
| Chemical compound, drug | Auxin (NaIAA) | Sigma | I5148 | 1 mM |
| Chemical compound, drug | Methylstat | Sigma | SML0343-5MG | 1 μM |
| Software, algorithm | Kappa, nuclear curvature | FIJI Schindelin et al., 2012 |
Additional files
-
Source data 1
RNAseq data analysis for HP1a-AID-sfGFP without the addition of auxin compared to auxin treatment for 4 hr.
The sheet provides genes analyzed and reports log 2-Fold Change (log2FoldChange) and q-value (padj) used to determine significance.
- https://cdn.elifesciences.org/articles/63972/elife-63972-data1-v2.zip
-
Source data 2
RNAseq data analysis for HP1a-AID-sfGFP without the addition of auxin compared to auxin treatment for 16 hr.
The sheet provides genes analyzed and reports log 2-Fold Change (log2FoldChange) and q-value (padj) used to determine significance.
- https://cdn.elifesciences.org/articles/63972/elife-63972-data2-v2.zip
-
Source data 3
RNAseq data analysis for U2OS parental cell line compared to modified U2OS HP1a-AID-sfGFP cell line.
The sheet provides genes analyzed and reports log 2-Fold Change (log2FoldChange) and q-value (padj) used to determine significance.
- https://cdn.elifesciences.org/articles/63972/elife-63972-data3-v2.zip
-
Transparent reporting form
- https://cdn.elifesciences.org/articles/63972/elife-63972-transrepform-v2.pdf
Download links
A two-part list of links to download the article, or parts of the article, in various formats.
Downloads (link to download the article as PDF)
Open citations (links to open the citations from this article in various online reference manager services)
Cite this article (links to download the citations from this article in formats compatible with various reference manager tools)
HP1α is a chromatin crosslinker that controls nuclear and mitotic chromosome mechanics
eLife 10:e63972.
https://doi.org/10.7554/eLife.63972


