Ca2+ signaling driving pacemaker activity in submucosal interstitial cells of Cajal in the murine colon
- Department of Physiology and Cell Biology, University of Nevada, Reno, School of Medicine, United States
Figures
Figure 1
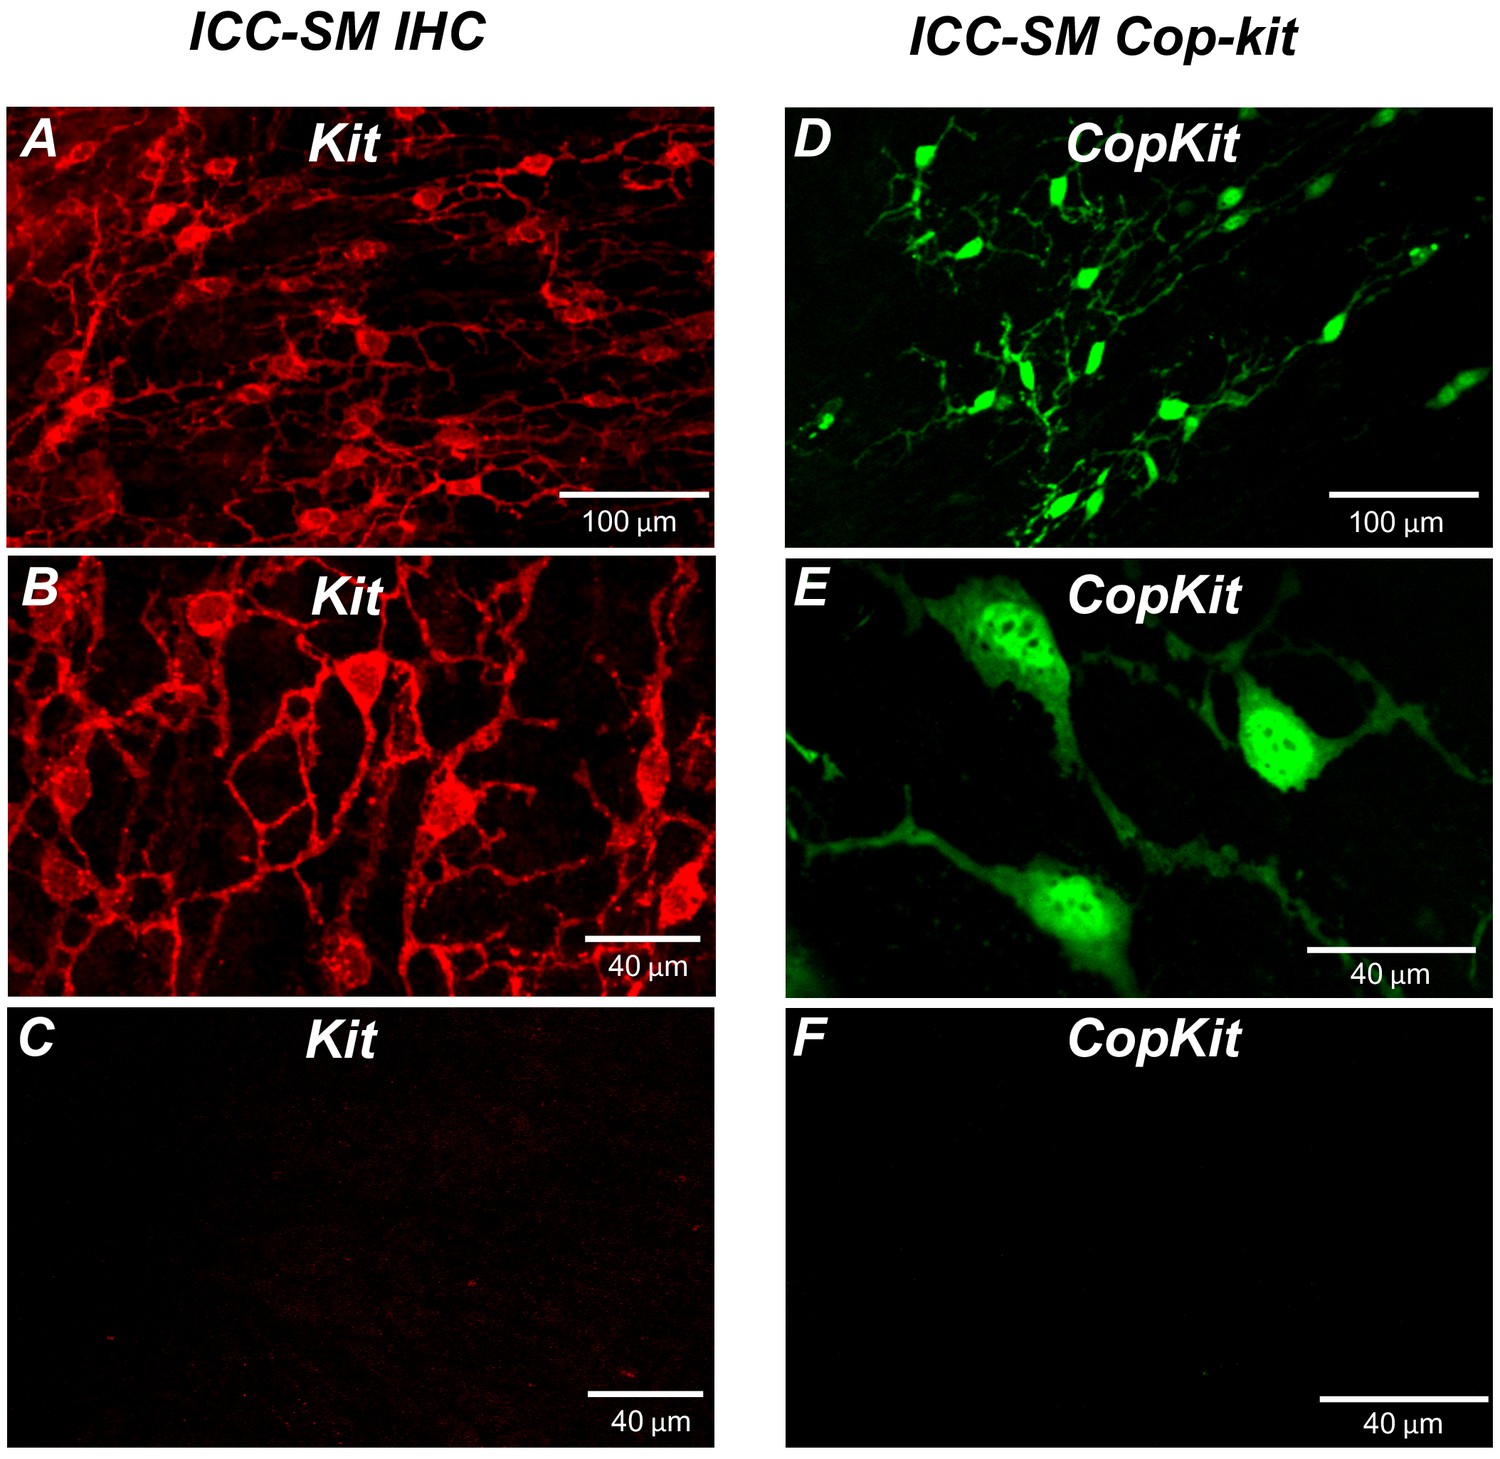
Distribution of Kit+ submucosal interstitial cells of Cajal (ICC-SM) in the murine colon.
(A and B) Images of Kit+ (ICC-SM) in isolated submucosal layer of wild-type animals at ×20 and×40 magnifications (n = 6). Scale bars are 100 μm and 40 μm respectively. (C) Absence of ICC-SM on the submucosal surface of the tunica muscularis of the proximal colon after removing the submucosa. ICC-SM networks are intact in preparations of submucosal tissues removed from the muscle. (D and E) ICC-SM were present in Kit+/copGFP mice at ×20 and×60 magnifications (n = 6). Scale bars are 100 μm and 40 μm respectively. (F) Absence of Kit+ (ICC-SM) on the submucosal surface of the tunica muscularis after removing the submucosa from Kit+/copGFP proximal colon muscles (n = 6). Scale bars are 40 μm in both C and F. All image parameters were analyzed using Image J software.
Figure 2
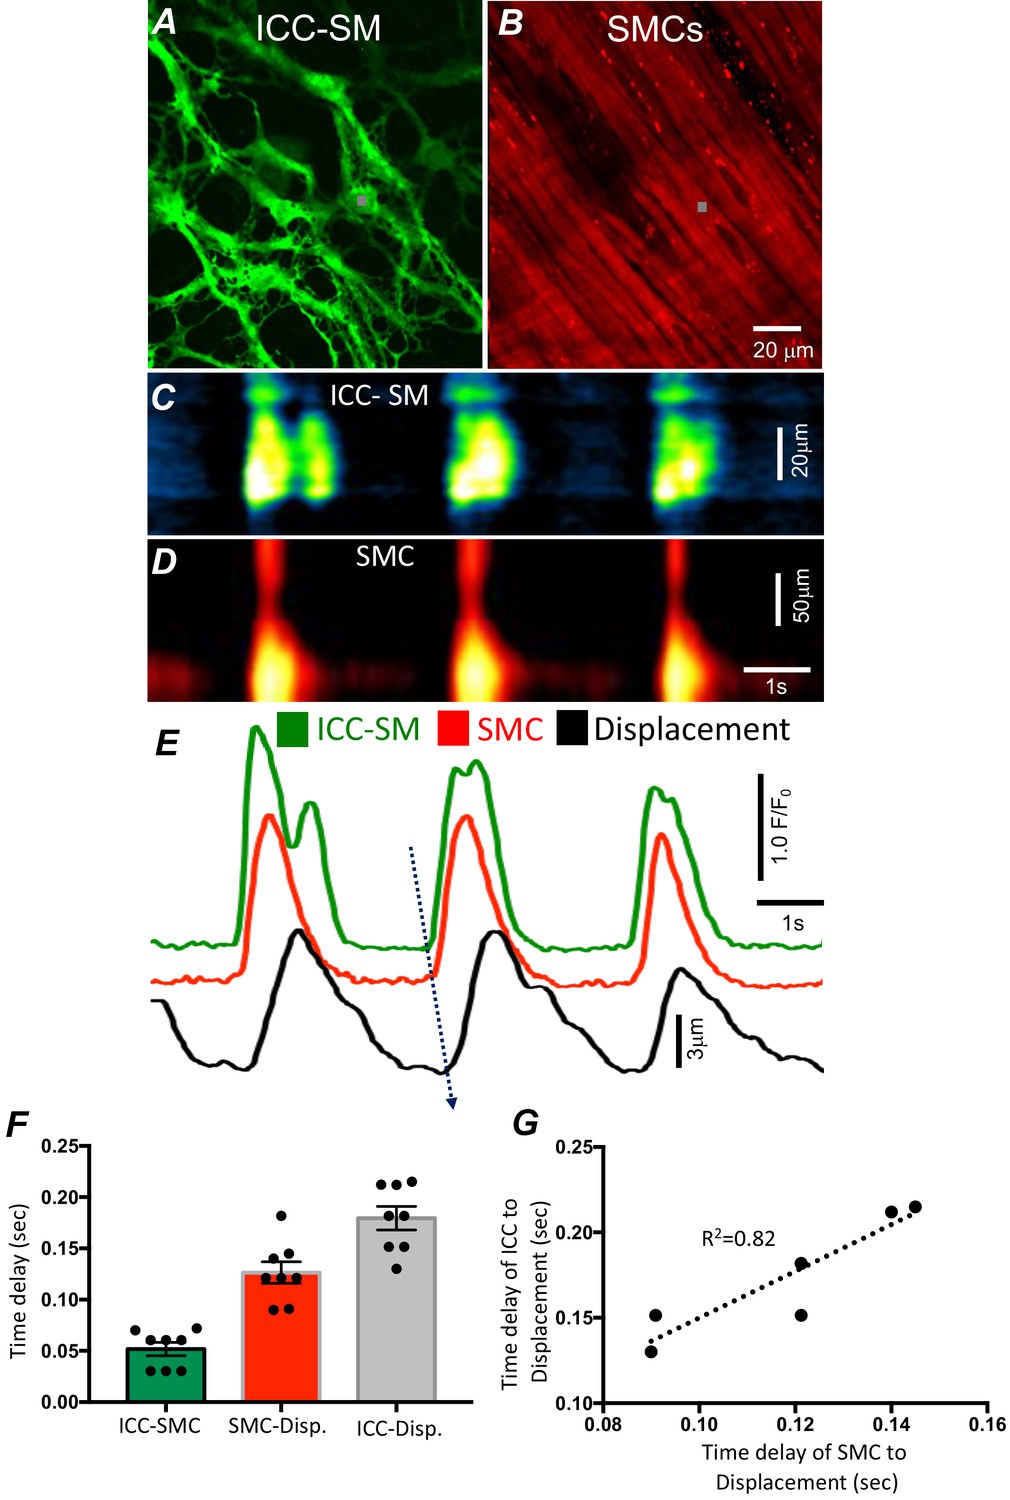
Temporal sequence of Ca2+ transients firing in submucosal interstitial cells of Cajal (ICC-SM) and smooth muscle cells (SMCs).
Representative dual-color imaging of ICC-SM (green; A) and SMCs (red; B) Ca2+ transients were recorded simultaneously from proximal colonic muscles of Kit-iCre-GCaMP6f/Acta2-RCaMP1.07 mice (see Materials and methods for details). C and D Spatiotemporal maps (STMaps) of Ca2+ signals in ICC-SM and SMCs during a recording period (gray boxes in A and B denote cell locations; see Video 1). The STMaps show coordinated firing of Ca2+ transients in both types of cells. Ca2+ transient traces are plotted in E (ICC-SM-green, SMCs-red). Tissue displacement was also monitored and plotted (black trace; E). The black dotted arrow depicts the sequence of activation firing of Ca2+ transients in ICC-SM, to activation of Ca2+ events in SMCs, and tissue displacement. (F) A comparison of latencies (ms) from the start of the initiation of Ca2+ transients in ICC-SM to SMC activation and tissue displacement (n = 8). (G) Correlation analysis of latencies between ICC-SM and SMC Ca2+ transients and tissue displacement (R2 = 0.82). All data graphed as mean ± SEM.
Figure 3

Propagating Ca2+ waves in submucosal interstitial cells of Cajal (ICC-SM) network.
(A) An image of ICC-SM network from the proximal colon of a Kit-iCre-GCaMP6f mouse visualized at 10x (low resolution) magnification. Scale bar is 100 μm in A and pertains to all images in B-F. A-F Representative montage of the propagation of a Ca2+ wave throughout the ICC-SM network. The yellow arrow in panel C indicates the direction of Ca2+ transient propagation. (G) Spatiotemporal map (STMap) of Ca2+ signal in single ICC from the movie in panel A showing rhythmic firing of Ca2+ waves. Ca2+ activity is color coded with warm areas (red, orange) representing bright areas of Ca2+ fluorescence and cold colors (blue, black) representing dim areas of Ca2+ fluorescence. Summary data of multiple ICC-SM Ca2+-firing parameters (n = 15): frequency H, duration I, intensity J, spatial spread K and area of Ca2+ transients L. All data graphed as mean ± SEM.
Figure 4

Submucosal interstitial cells of Cajal (ICC-SM) Ca2+ signaling activity is entrained.
(A) Raw image of multiple colonic ICC-SM in a field of view (FOV). Ten cells were color coded, and their Ca2+ fluorescence activity traces were plotted in B. Three ICC-SM (coded as red, green and blue regions of interest; ROIs in A) were selected and STMaps of the average Ca2+ fluorescence intensity across the diameter of the cell during a 30-s recording were constructed C–E. STMaps from each cell were color coded to correspond to the red, green, and blue cells and merged into a summed STMap in F. Percentage of fluorescence area overlap of intracellular Ca2+ transients between ICC-SM cells is plotted in G and cell location is identified in H (n = 10). The durations of Ca2+ waves were such that there was a significant overlap of the Ca2+ events in individual cells across the FOVs at this magnification. Thus, each cell within the FOVs demonstrated similar temporal firing intervals (calculated as peak to peak intervals, n = 6) as shown in I.
Figure 5
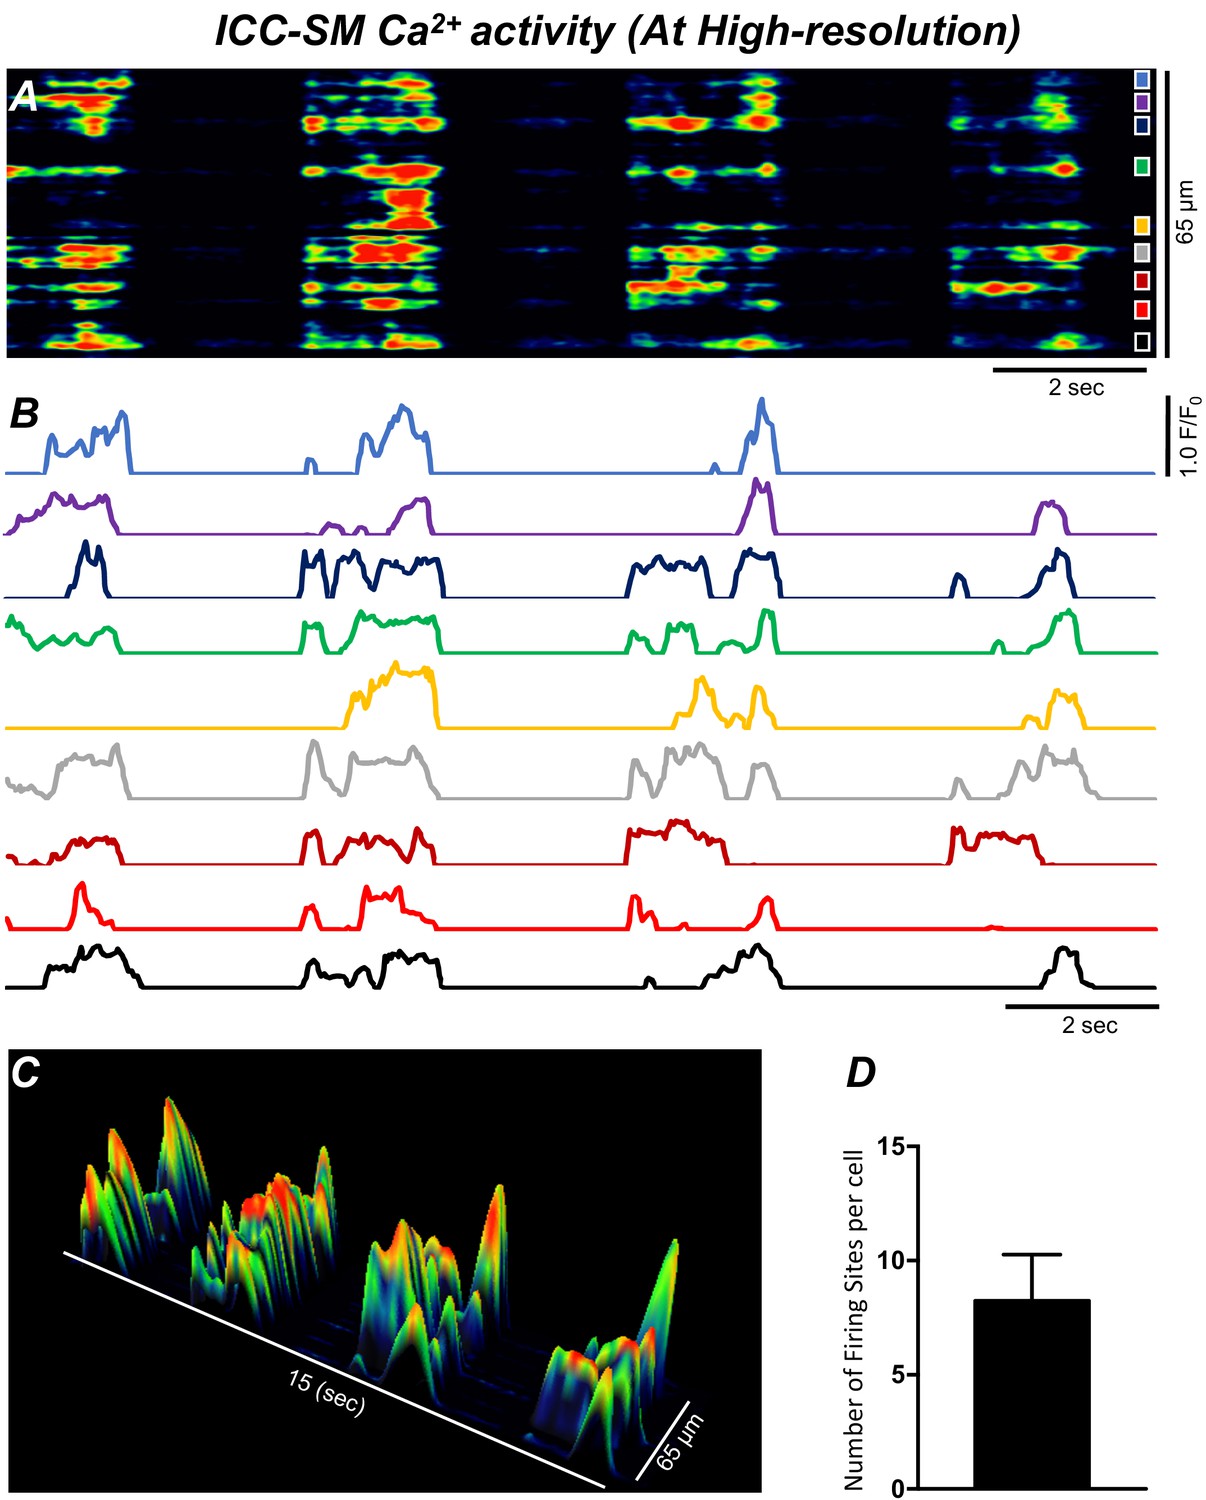
Ca2+ transients in submucosal interstitial cells of Cajal (ICC-SM) arise from multiple firing sites.
(A) Spatiotemporal map (STMap) of Ca2+-firing sites from a single ICC-SM during four consecutive firing cycles. Ca2+ activity is color coded with warm areas (red, orange) representing bright areas of Ca2+ fluorescence and cold colors (blue, black) representing dim areas of Ca2+ fluorescence. Nine distinct firing sites were detected in this cell and are marked as color squares on the right of the STMap. (B) Traces of the Ca2+ transients at each of the nine Ca2+-firing sites shown on the STMap in panel A. (C) 3-D surface plots showing the Ca2+ activity at the Ca2+-firing sites shown on the STMap in panel A over four consecutive Ca2+-firing cycles. (D) Average number of the firing sites per cell (n = 25). Data graphed as mean ± SEM.
Figure 6
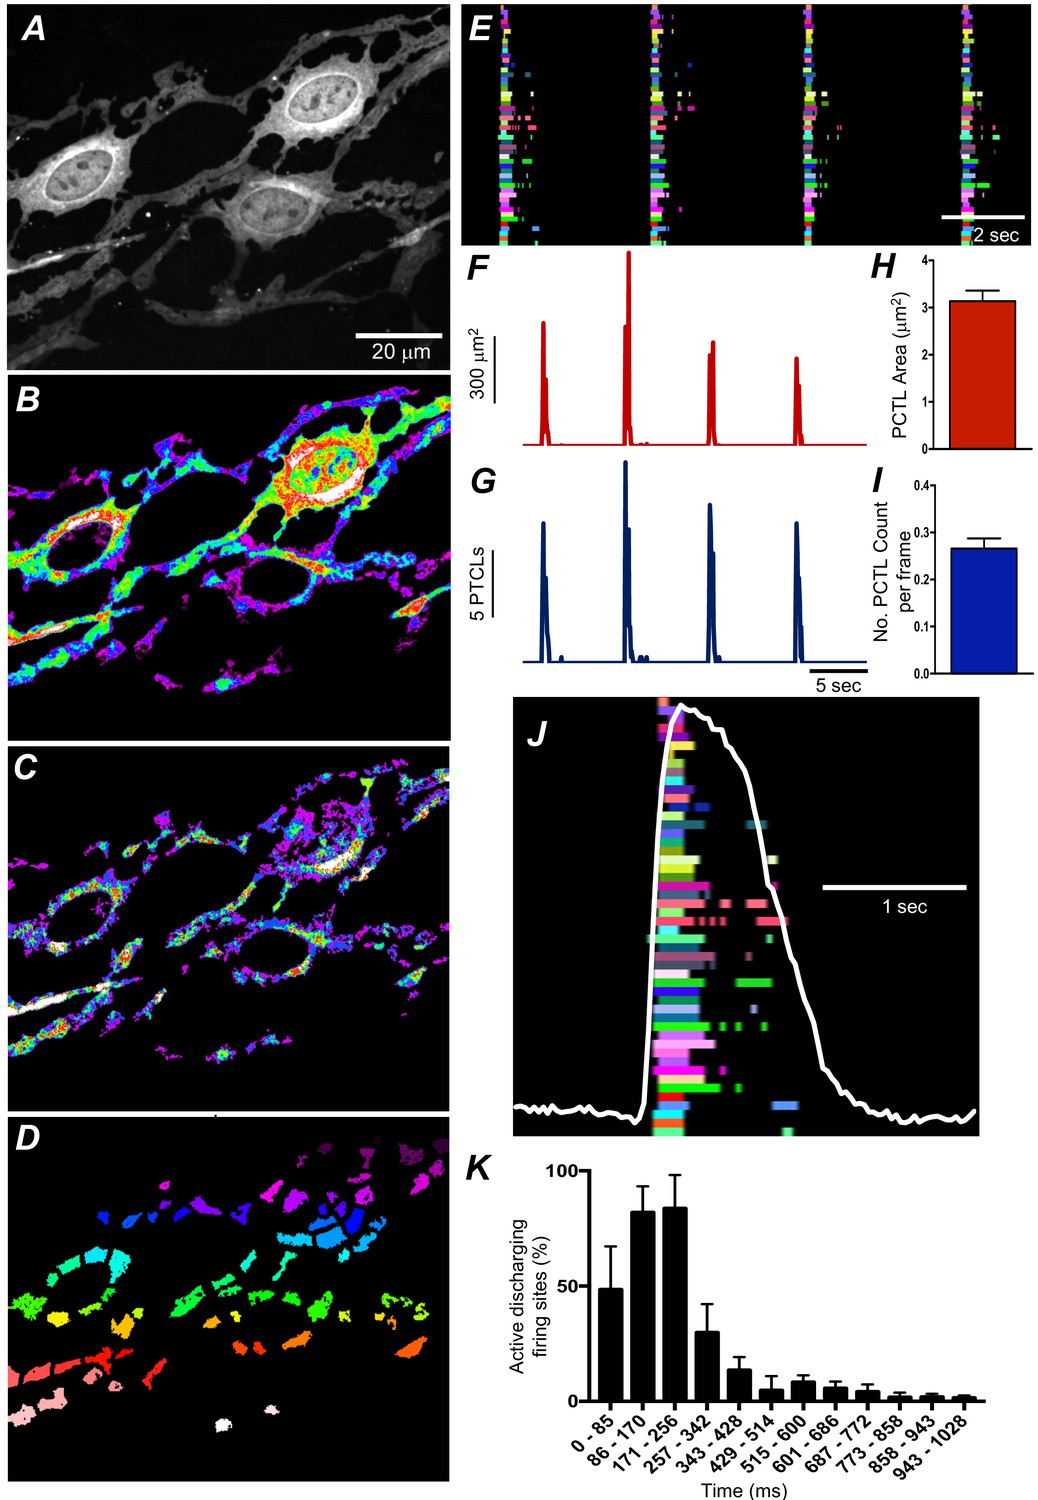
Submucosal interstitial cells of Cajal (ICC-SM) Ca2+ transient initiation sites.
(A) Representative image of an ICC-SM network from proximal colon of a Kit-iCre-GCaMP6f mouse at ×60 magnification. (B) Heat map of total Ca2+ PTCLs generated from the video shown in A (see Video 2). (C) Particles were thresholded temporally to generate a heat map indicating Ca2+-firing sites in the ICC-SM. (D) Image showing individually color-coded Ca2+-firing sites in the field of view (FOV) shown in C. (E) The temporal characteristics of each individual, color-coded firing site is displayed as an occurrence map, with each ‘lane’ representing the occurrence of firing PTCLs within each firing site. Activity traces for PTCLs for the duration of recording from the entire FOV are shown in F and G. Traces for PTCL area (F; red) and PTCL count (G; blue) are shown. H and I Summary graphs show average PTCL areas and counts for Ca2+-firing sites in ICC-SM (n = 25). (J) One Ca2+ wave in ICC-SM (white trace) is expanded and the numerous Ca2+ initiation sites that fired during this wave are superimposed. (K) Distribution plot showing average percentages of firing sites during a Ca2+ wave. Values are calculated for 1 s and plotted in 85 ms bins (n = 25). Data graphed as mean ± SEM.
Figure 7

The effect of lowering [Ca2+]o on Ca2+ transients in submucosal interstitial cells of Cajal (ICC-SM).
(A) ICC-SM Ca2+ transients and Ca2+-firing sites were color coded and plotted as an occurrence map under control conditions with [Ca2+]o = 2.5 mM. (B–E) showing the effects of reducing [Ca2+]o to 2 mM B; 1 mM C; 0.5 mM D and after Ca2+ removal of [Ca2+]o (0 mM added and final solution buffered with 0.5 mM EGTA) E. F-J Traces of Ca2+ PTCL activity in ICC-SM (PTCL area, blue and PTCL count, green) under control conditions F and after reducing [Ca2+]o to 2 mM G; 1 mM H; 0.5 mM I and after removal of [Ca2+]o as shown in J. Summary graphs of Ca2+ PTCLs in ICC-SM under control conditions and with reduced [Ca2+]o in K (PTCL area); L (PTCL count) and M (PTCL duration). Data were normalized to controls and expressed as percentages (%). Significance was determined using one-way ANOVA, * = p<0.1, ** = p<0.01, **** = p<0.0001, n = 6. All data graphed as mean ± SEM.
Figure 8
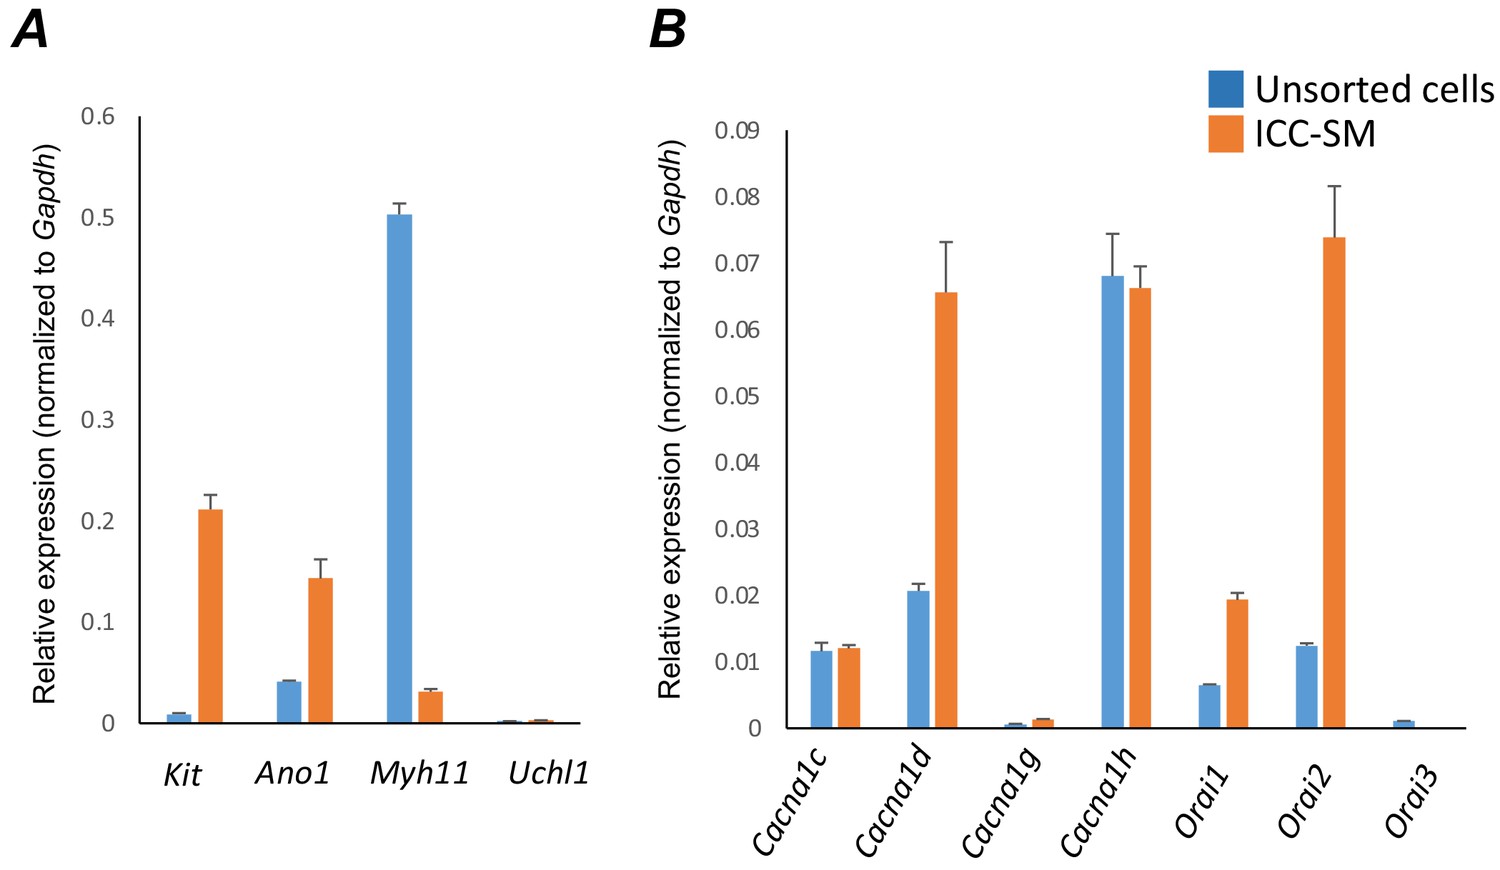
Molecular expression of genes related to Ca2+ entry channels.
(A) Relative expression of cellular-specific biomarker genes in submucosal interstitial cells of Cajal (ICC-SM; sorted to purity by FACS) and compared with unsorted cells dispersed from submucosal tissues obtained from Kit+/copGFP mice. Relative expression was determined by qPCR and normalized to Gapdh expression. Genes examined were Kit (tyrosine kinase receptor, found in ICC), Ano1 (Ca2+-activated Cl- channel), Uch11 (neural marker encoding PGP 9.5), Myh11 (smooth muscle myosin). (B) Relative expression of major Ca2+ entry channels considered most likely to be expressed in colonic ICC from RNAseq of total ICC in murine colon (Lee et al., 2017). L-Type Ca2+ channels (Cacna1c and Cacna1d) T-type Ca2+ channels (Cacna1g and Cacna1h) and Store‐operated Ca2+ entry (SOCE) channels (Orai1, Orai2 and Orai3) were evaluated. All data graphed as mean ± SEM (n = 4).
Figure 9 with 1 supplement
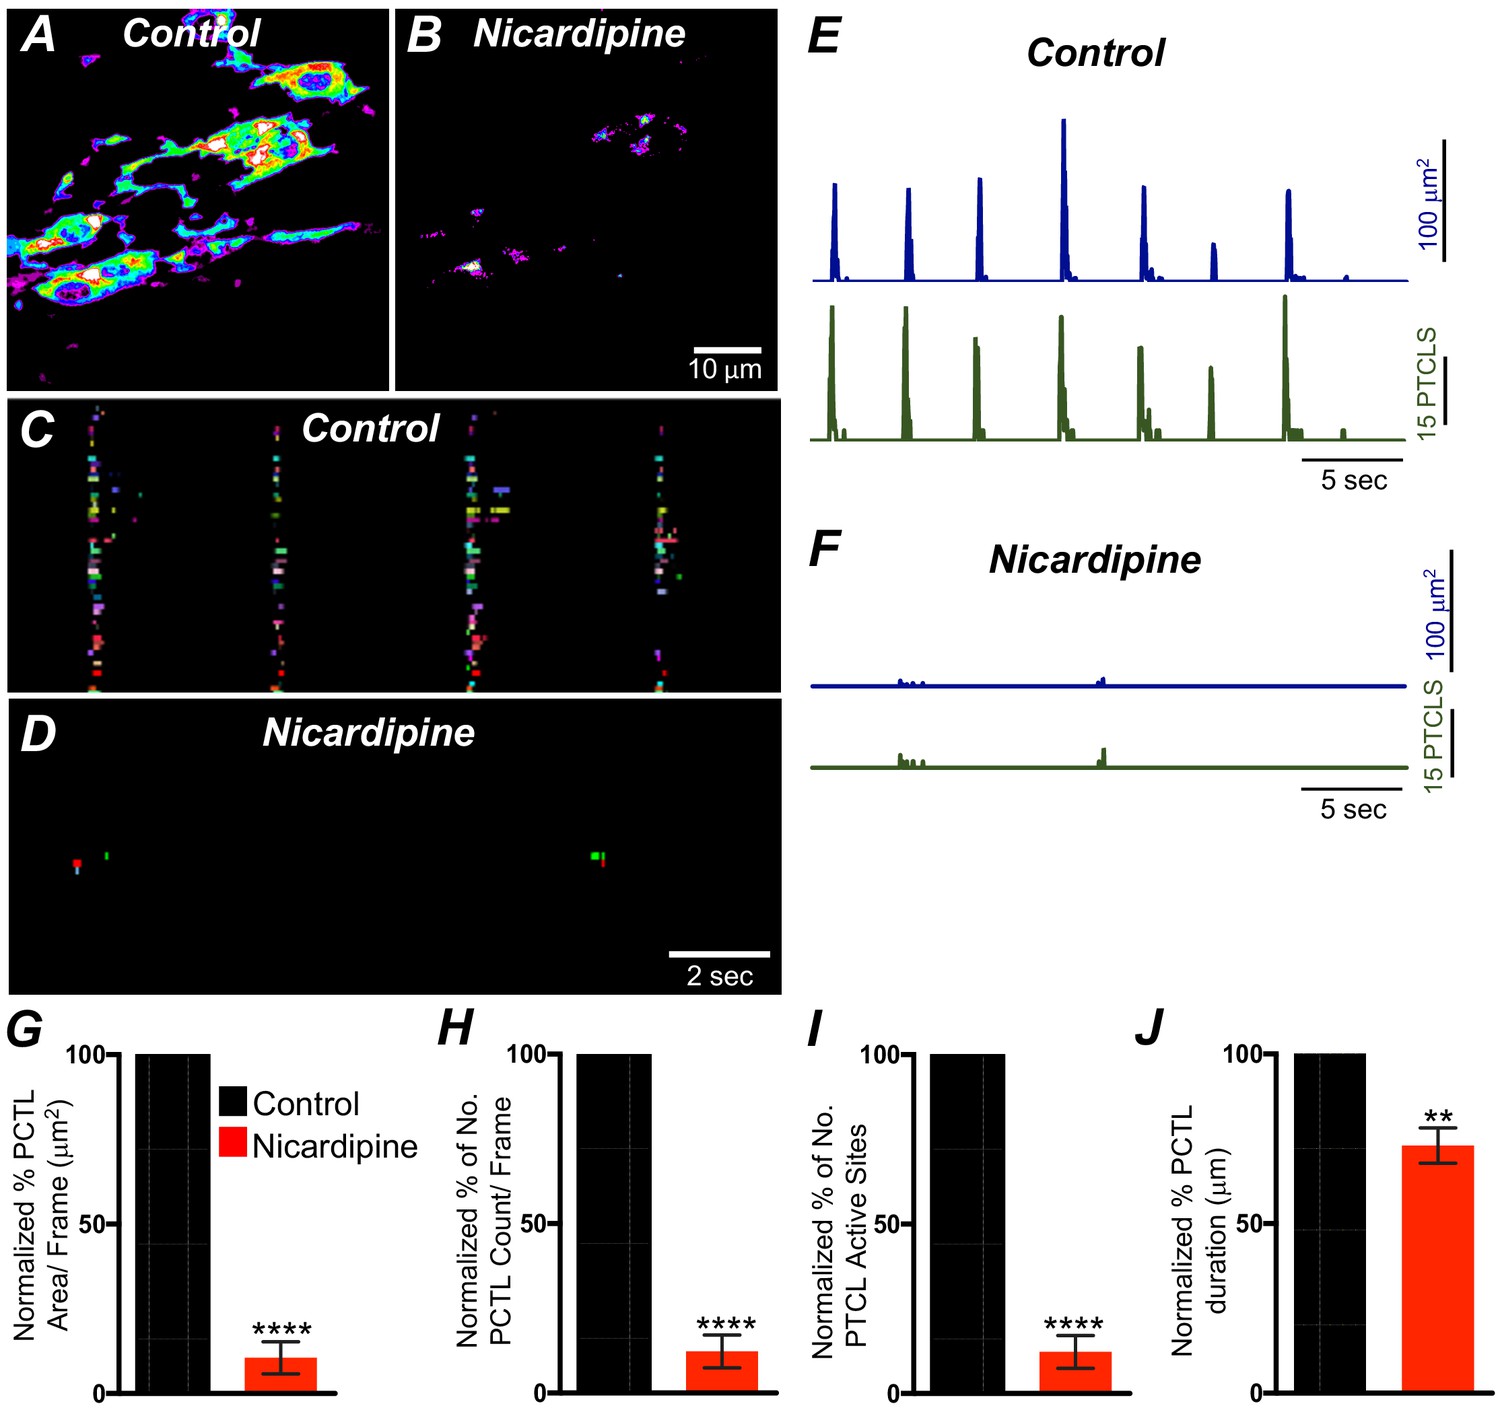
L-type Ca2+ channel antagonist, nicardipine effects on submucosal interstitial cells of Cajal (ICC-SM) Ca2+ transients.
A and B Representative heat-map images of an ICC-SM network from the proximal colon of a Kit-iCre-GCaMP6f mouse showing active Ca2+ PTCLs under control conditions and in the presence of nicardipine (1 μM). Ca2+ activity is color coded with warm areas (white, red) representing bright areas of Ca2+ fluorescence and cold colors (purple, black) representing dim areas of Ca2+ fluorescence. Scale bar is 10 μm in both A and B. C and D Firing sites showing Ca2+ activity in ICC-SM. Firing sites were color coded and plotted as an occurrence map under control conditions and in the presence of nicardipine (1 μM). Traces of firing sites showing PTCL area (E; blue) and PTCL count (E; green) under control conditions and in the presence of nicardipine; PTCL area (F; blue) and PTCL count (F; green) show the inhibitory effects of nicardipine on Ca2+ transients in ICC-SM. Summary graphs of Ca2+ PTCL activity in ICC-SM before and in the presence of nicardipine are shown in G (PTCL area/frame), (H) (PTCL count/frame), (I) the number of PTCL active sites and J (PTCL duration). Data were normalized to controls and expressed as percentages (%). Significance determined using unpaired t-test, ** = p<0.01, **** = p<0.0001, n = 8. All data graphed as mean ± SEM.
Figure 9—figure supplement 1
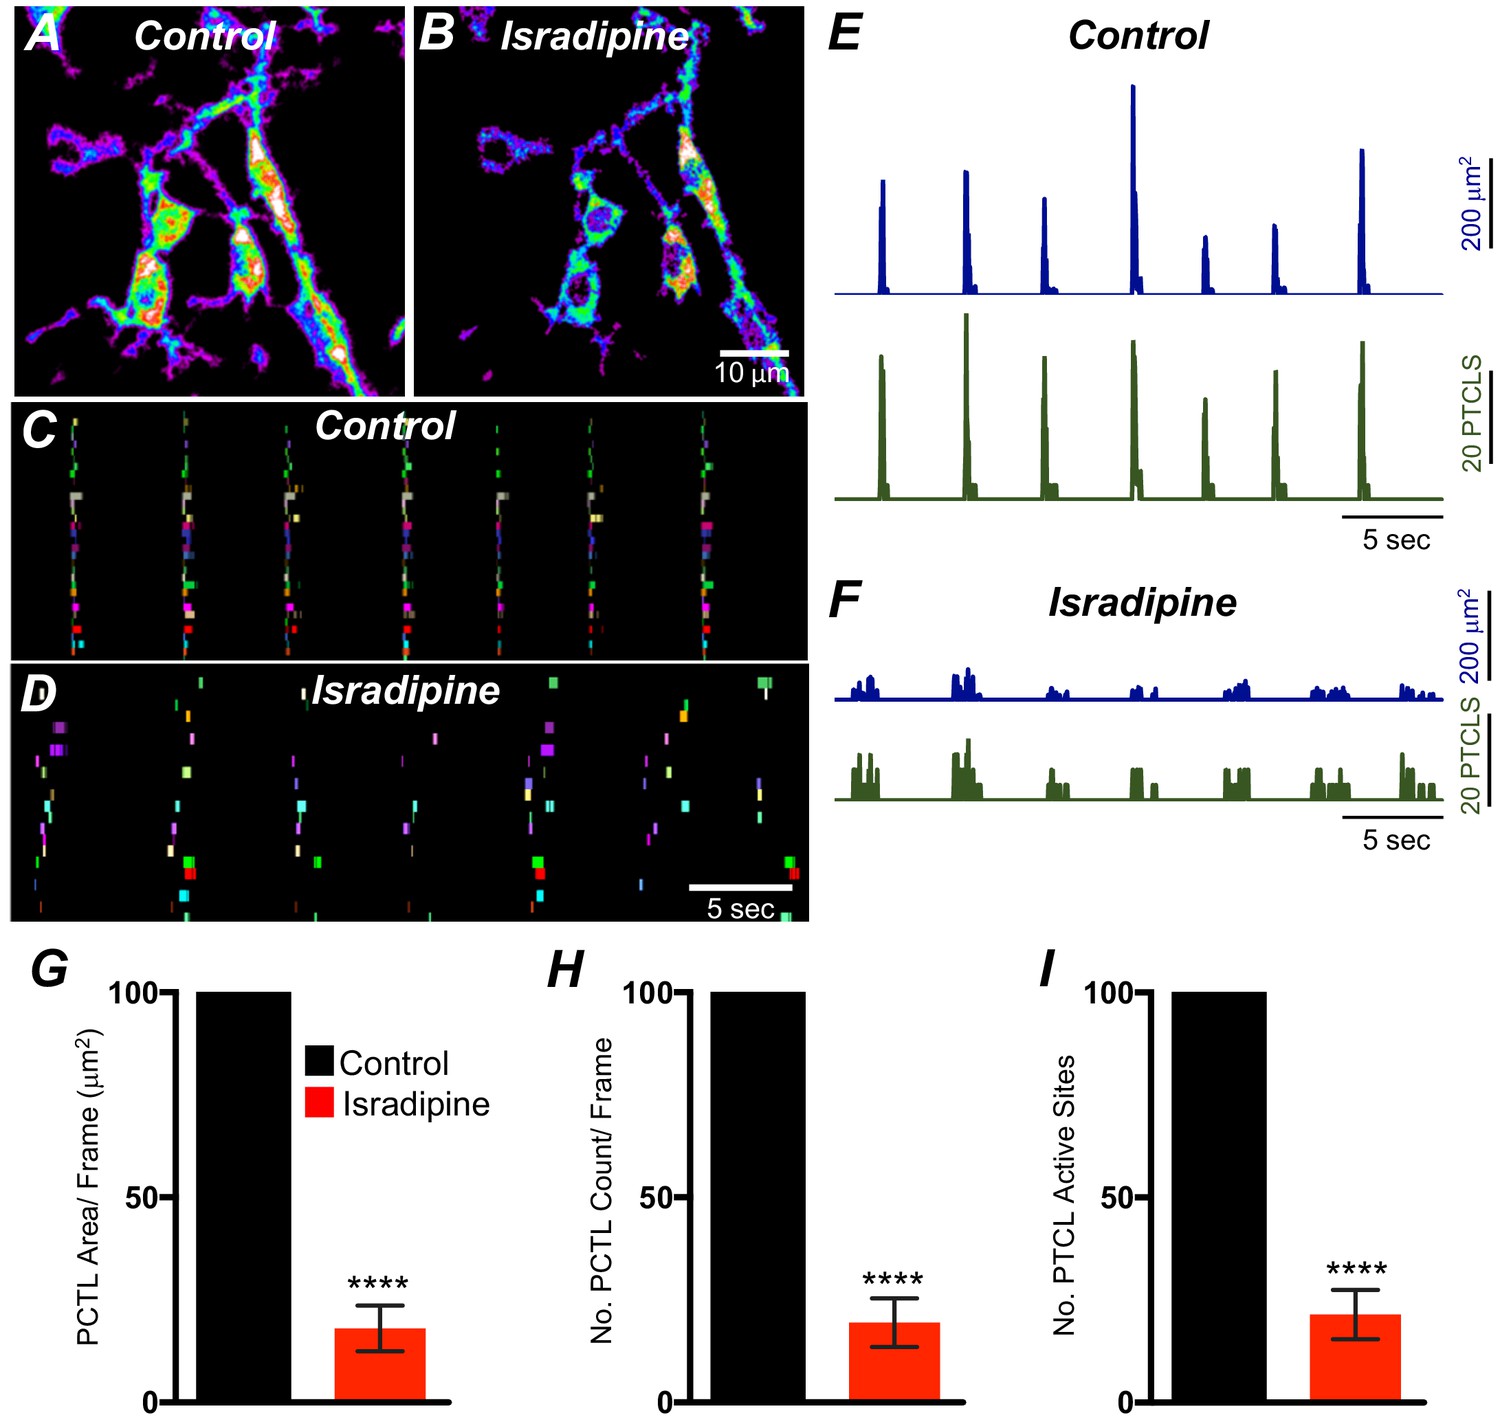
Isradipine effects on Ca2+ transients in submucosal interstitial cells of Cajal (ICC-SM).
A and B Heat-map images showing the summated Ca2+ transient particles of ICC-SM under control conditions and in the presence of isradipine (1 μM). C and D Occurrence maps of individually color-coded Ca2+-firing sites in the ICC-SM in the field of view (FOV) under control conditions and in isradipine. Ca2+ transient PTCL activity Traces over an entire recording of the ICC-MY showing PTCL area/frame (blue) and PTCL count/frame (green) in control conditions E and in the presence of isradipine (1 μM) (F). Summary graphs of average percentage change of PTCL area G, PTCL count H and the number of Ca2+-firing sites was significantly affected by isradipine I (n = 7). Significance determined using unpaired t-test, **** = p<0.0001. All data graphed as mean ± SEM.
Figure 10 with 1 supplement
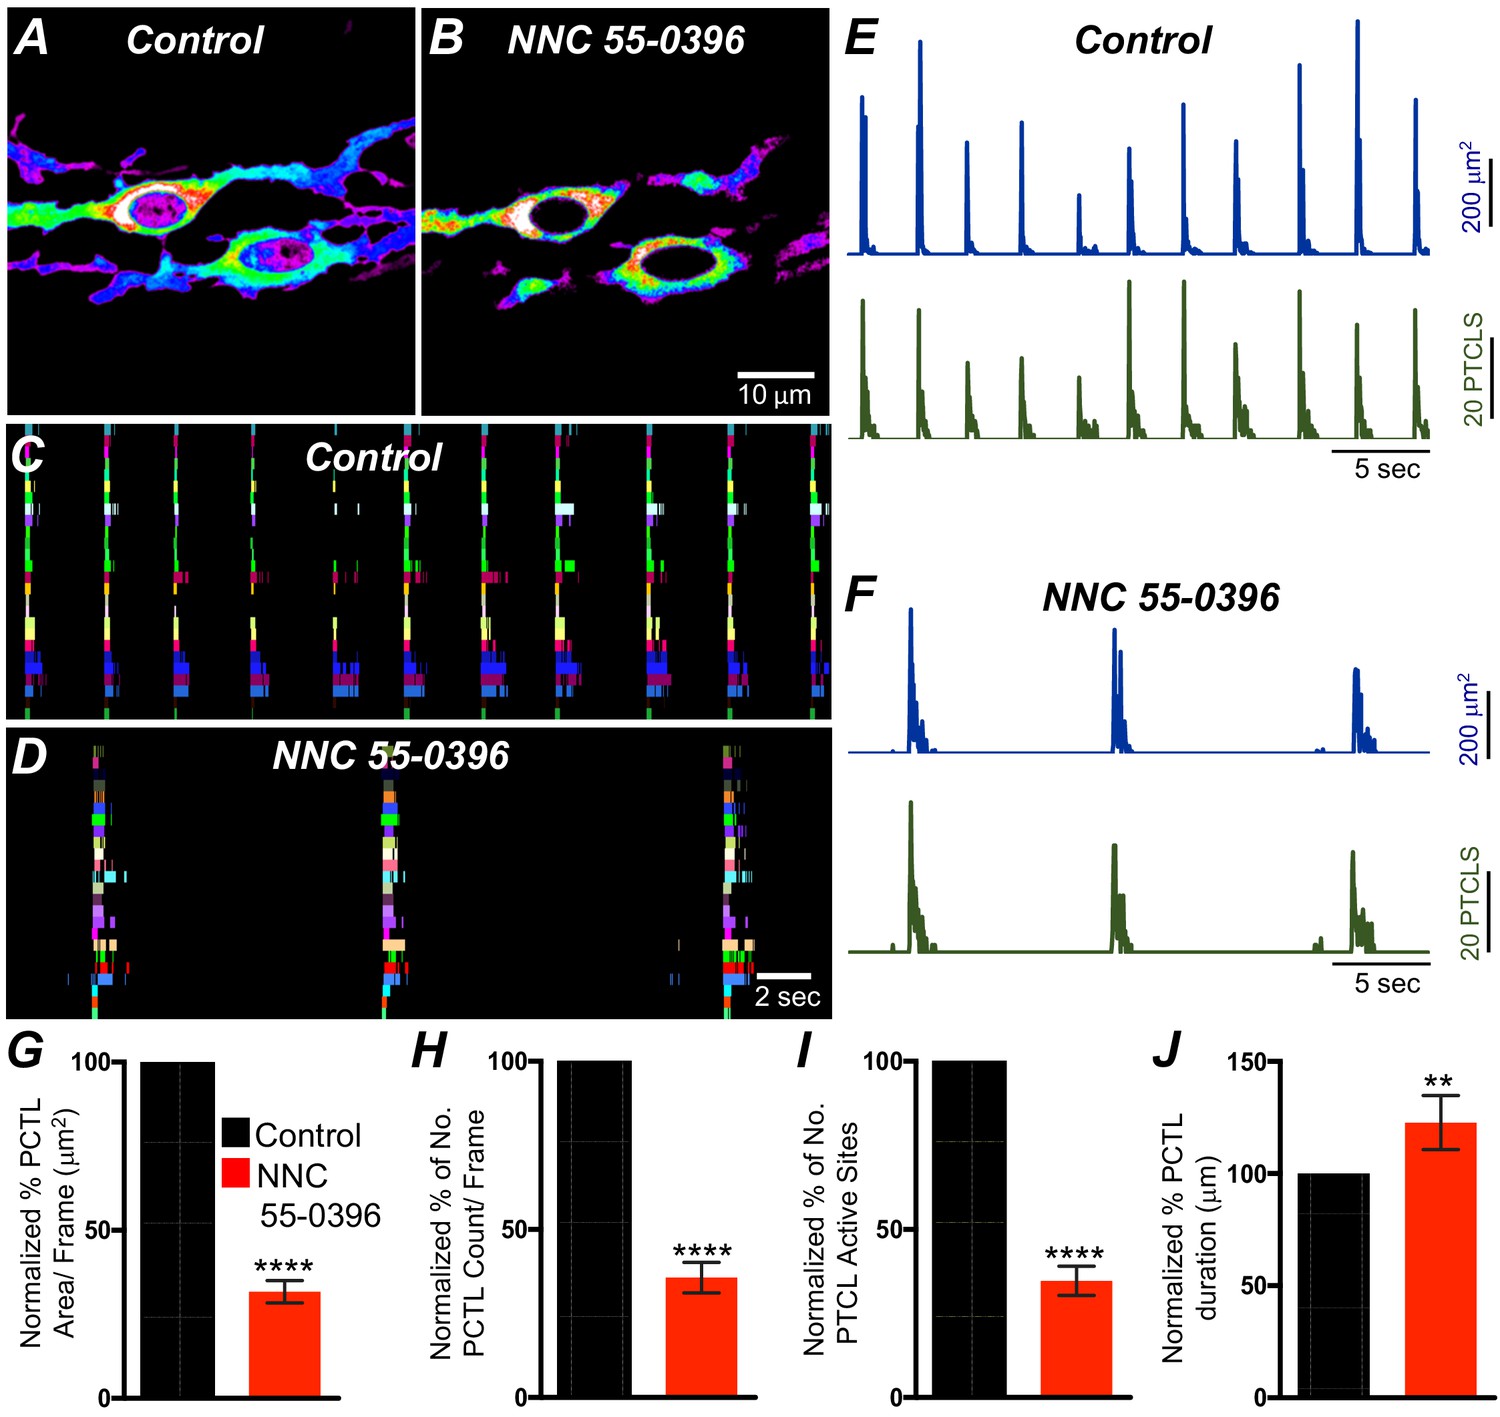
T-type Ca2+ channel antagonist, NNC 55–0396 effects on ICC-SM Ca2+ transients.
A and B Representative heat-map images of Ca2+ transient particles in ICC-SM under control conditions A and in the presence of NNC 55–0396 (10 μM) (B). Active firing sites were color coded and plotted as an occurrence maps in the ICC-SM network under control C and NNC 55–0396 D conditions. Plots of Ca2+ transient particle activity of ICC-SM in control conditions and in the presence of NNC 55–0396 showing PTCL area (blue) and PTCL count (green) under control conditions E and in the presence of NNC 55–0396 F. Summary graphs of average percentage changes in PTCL area G, PTCL count H, the number of PTCL active sites I and PTCL duration J. Data were normalized to controls and expressed as percentages (%). Significance determined using unpaired t-test, **** = p<0.0001, n = 8. All data graphed as mean ± SEM.
Figure 10—figure supplement 1
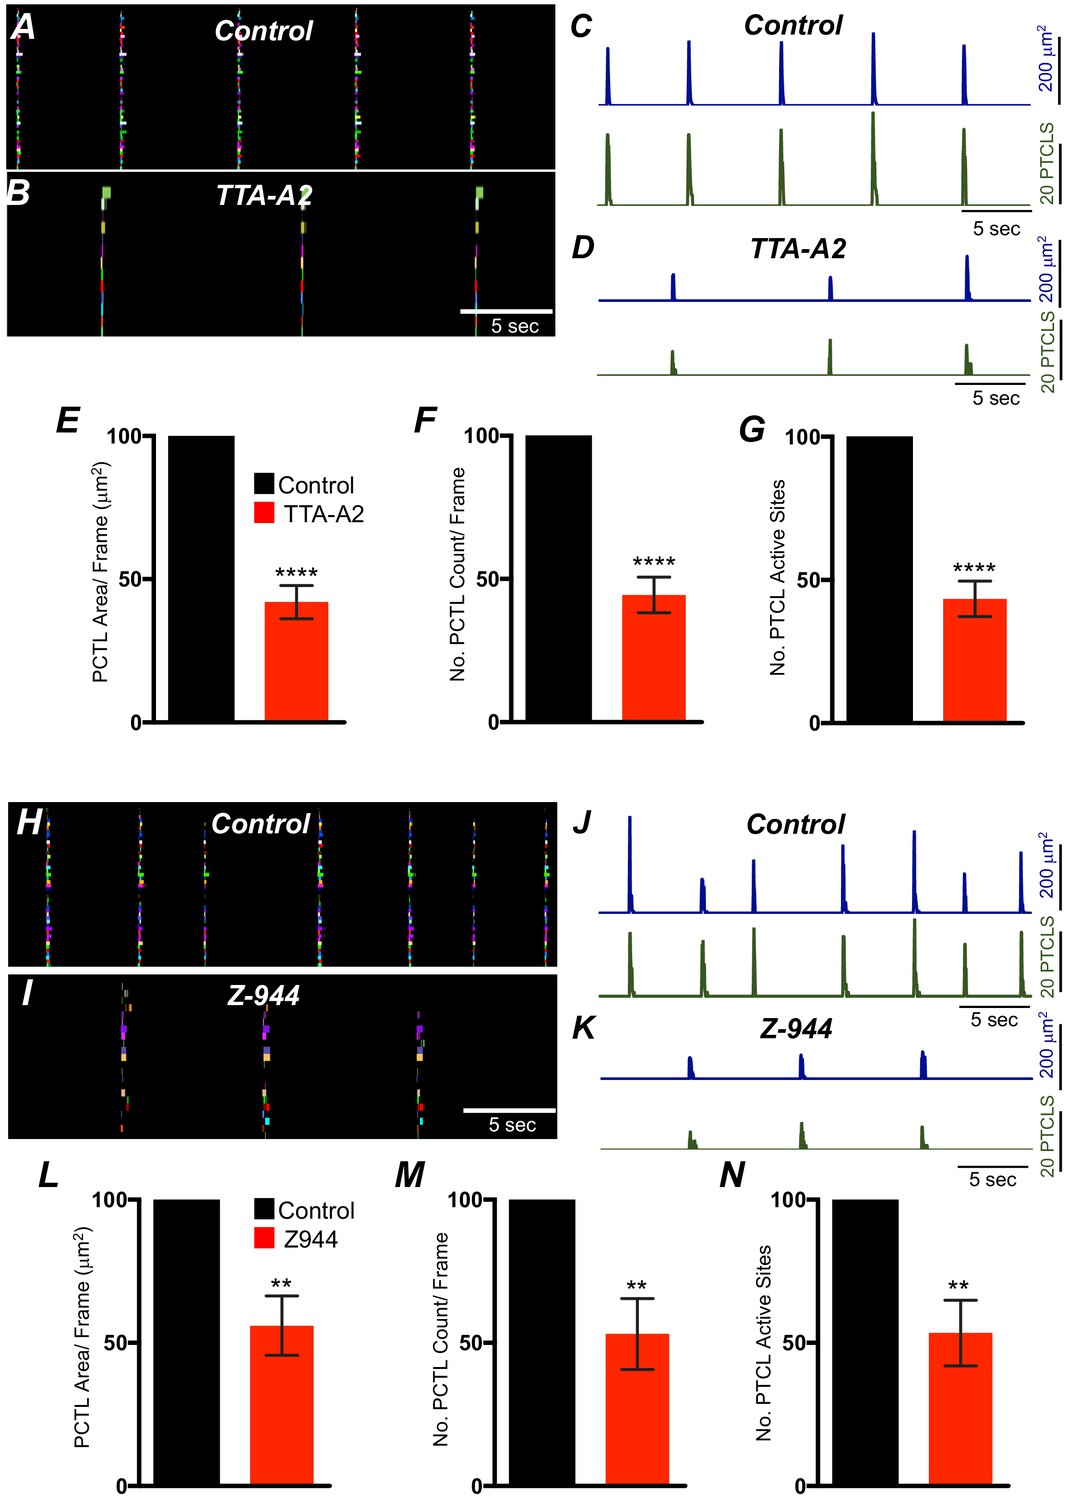
Effects of T-type Ca2+ channel antagonists, TTA-A2 and Z-944 on submucosal interstitial cells of Cajal (ICC-SM) Ca2+ transients.
A and B Occurrence maps showing ICC-SM network active firing sites. Sites were individually color coded and plotted under control A and in the presence of TTA-A2 (10 μM) (B) conditions. Plots of Ca2+ transient particle activity of ICC-SM in control conditions and in the presence of TTA-A2 showing PTCL area (blue) and PTCL count (green) under control conditions C and in the presence of TTA-A2 D. Summary graphs of average percentage change of PTCL area E, PTCL count F and the number of Ca2+-firing sites was reduced by TTA-A2 G (n = 7). H and I Active firing sites were individually color coded and plotted as an occurrence maps in the ICC-SM network under control H and Z-944 (1 μM) (I) conditions. Plots of Ca2+ transient particle activity of ICC-SM in control conditions and in the presence of Z-944 showing PTCL area (blue) and PTCL count (green) under control conditions J and in the presence of Z-944 K. Summary graphs of average percentage change of PTCL area L, PTCL count M and the number of Ca2+-firing sites was reduced by Z-944 N (n = 5). Significance determined using unpaired t-test, ** = p<0.01,**** = p<0.0001. All data graphed as mean ± SEM.
Figure 11 with 1 supplement
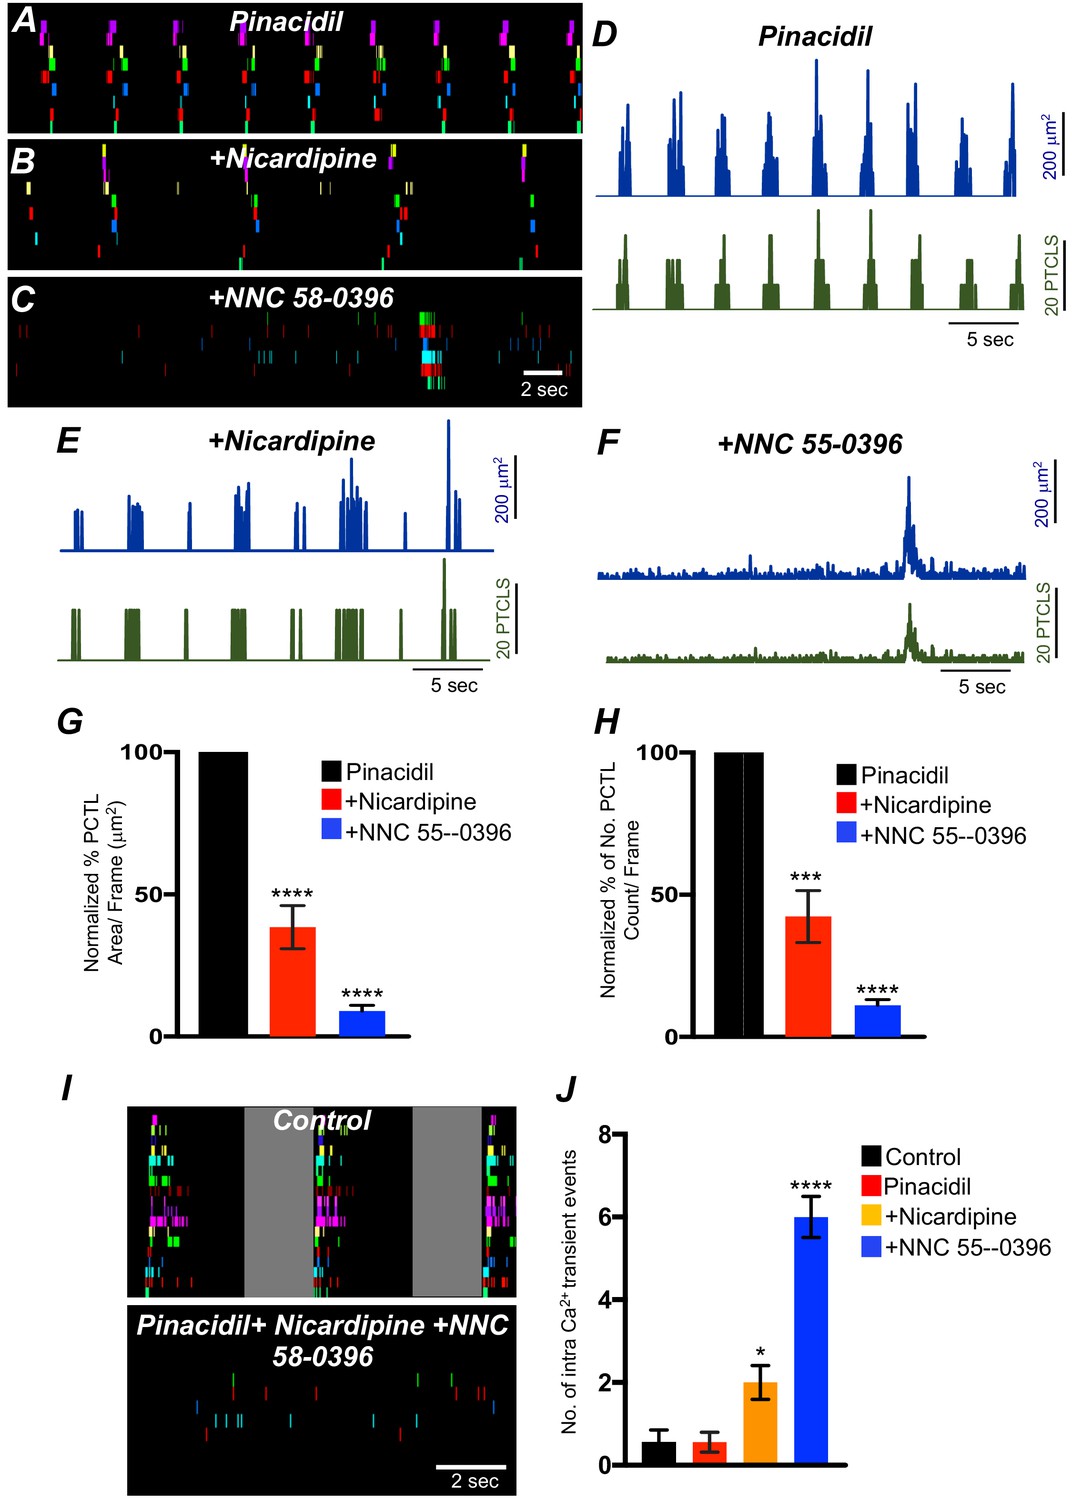
The effects of membrane hyperpolarization and voltage-dependent Ca2+ entry block on submucosal interstitial cells of Cajal (ICC-SM) Ca2+ transients.
(A) Ca2+-firing sites in ICC-SM are color coded and plotted in an occurrence map in the presence of pinacidil (10 μM). (B) Shows the effects of nicardipine (1 μM) in the continued presence of pinacidil. (C) shows effects of combining nicardipine and NNC 55–0396 (10 μM) in the continued presence of pinacidil. Traces of firing sites PTCL area (blue) and PTCL count (green) under each condition are shown in D pinacidil E pinacidil and nicardipine and F combination of pinacidil, nicardipine, and NNC 55–0396. Summary graphs of Ca2+ PTCL activity in ICC-SM in the presence of voltage-dependent Ca2+ channel antagonists (nicardipine and NNC 55–0396) are shown in G (PTCL area) and H (PTCL count). (I) The number of Ca2+-firing events were tabulated during 2 s intervals before the initiation of Ca2+ transient clusters in ICC-SM (period of tabulation indicated by the gray box) and summarized in J under control conditions, in pinacidil, in pinacidil and nicardipine and in a combination of pinacidil, nicardipine, and NNC 55–0396. Data were normalized to controls and expressed as percentages (%) in G and H. Significance determined using one-way-ANOVA, * = p<0.1, ** = p<0.01, *** = p<0.001 **** = p<0.0001, n = 5. All data graphed as mean ± SEM.
Figure 11—figure supplement 1

The effects of pinacidil of Ca2+ transients in submucosal interstitial cells of Cajal (ICC-SM).
(A) Representative heat-map image of an ICC-SM network showing total Ca2+ PTCLs under control conditions and in the presence of pinacidil (10 μM) (B). Ca2+ activity was color coded with warm areas (white, red) representing bright areas of Ca2+ fluorescence and cold colors (purple, black) representing dim areas of Ca2+ fluorescence. Scale bar is 10 mm in both A and B. Ca2+-firing sites in ICC-SM were color coded and plotted as occurrence maps under control conditions in C and in the presence of pinacidil (10 μM) (D). Traces of firing sites PTCL area (E; blue) and PTCL count (E; red) under control conditions and in the presence of pinacidil PTCL area (F; blue) and PTCL count (F; red). Summary graphs of Ca2+ PTCL activity in ICC-SM in the presence of pinacidil are shown in G (PTCL area; 130.3 ± 24.3%; p value = 0.24; n = 6), (H) (PTCL count; 121.8 ± 17.8%; p value = 0.25; n = 6) and the number of PTCL active sites I (p value = 0.22; n = 6). Global Ca2+ traces are plotted from all cells in the field of view (FOV) in B under control conditions (black trace) and in the presence of pinacidil (red trace). K and L Summary graphs of the duration (s) K and frequency (cpm) (L) of global Ca2+ transients in ICC-SM. Data were normalized to controls and expressed as percentages (%) in G, H, and I. Significance determined using unpaired t-test, *** = p<0.001, n = 6. All data graphed as mean ± SEM.
Figure 12
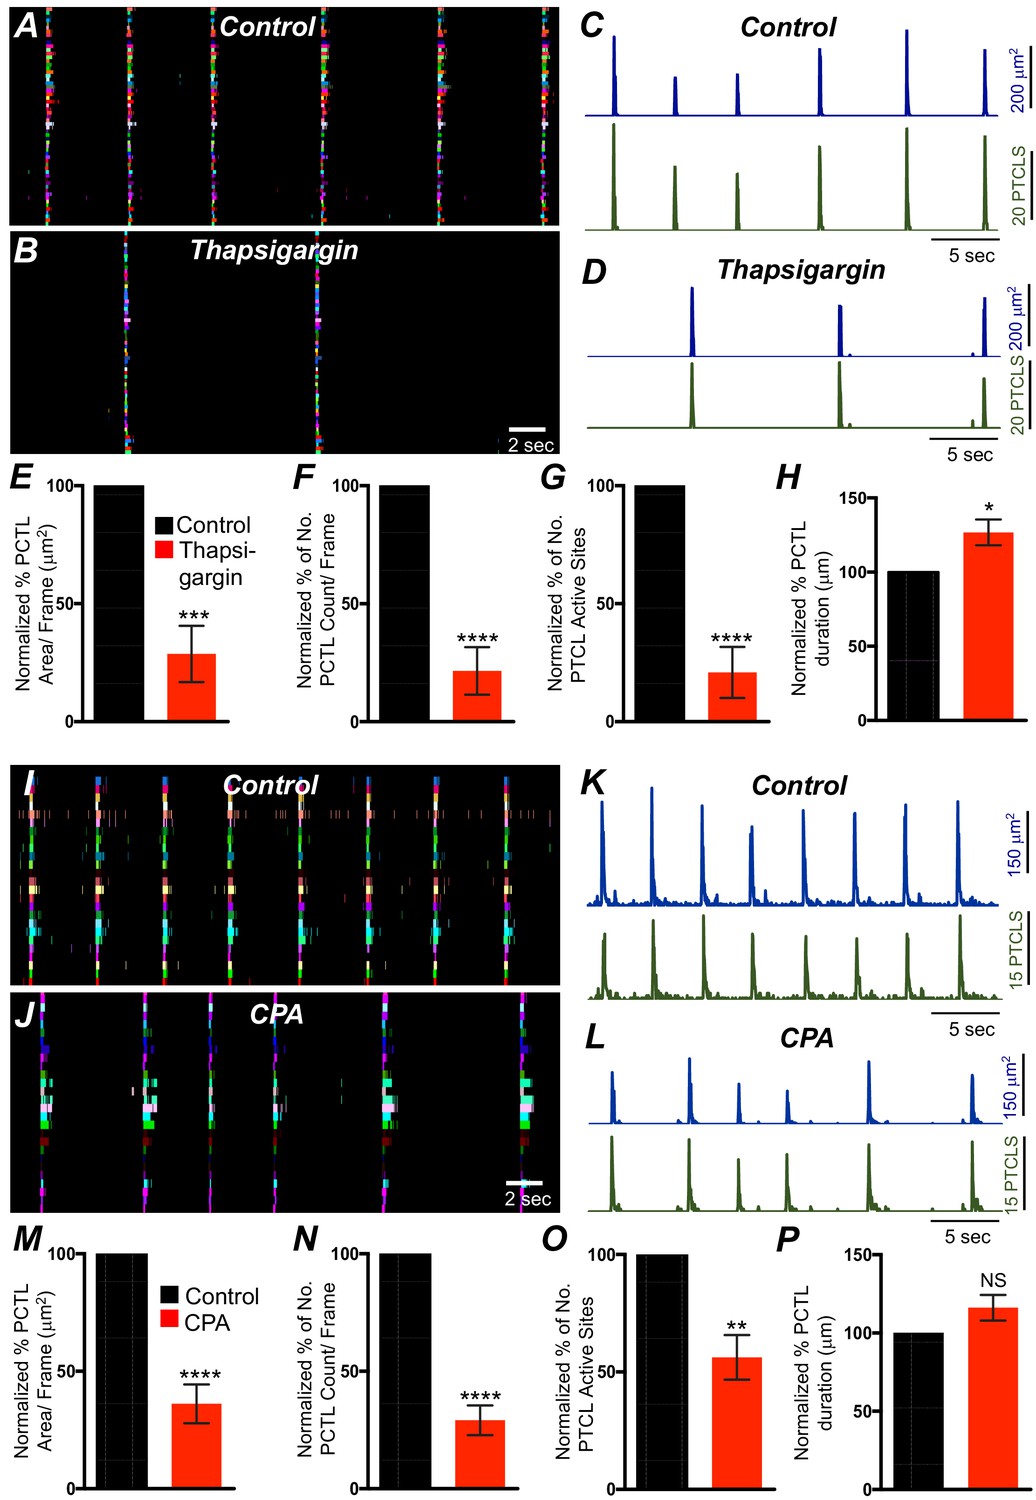
Intracellular Ca2+ stores contributions in submucosal interstitial cells of Cajal (ICC-SM) Ca2+ transients firing.
(A) Ca2+ activity of firing sites in ICC-SM are color coded and plotted in occurrence maps under control conditions and in the presence of thapsigargin (1 μM) (B). Traces of firing sites PTCL area (C; blue) and PTCL count (C; green) under control conditions and in the presence of thapsigargin PTCL area (D; blue) and PTCL count (D; green). Scale bars in C applies to traces in D. Summary graphs of Ca2+ PTCL activity in ICC-SM in the presence of thapsigargin are shown in E (PTCL area), (F) (PTCL count), (G) the number of PTCL active sites and H (PTCL duration; n = 6). CPA (SERCA pump inhibitor) reduced transients compared to control as shown in occurrence maps of firing sites I and J and Ca2+ activity traces K and L. Summary graphs of Ca2+ PTCL activity in ICC-SM in the presence of CPA are shown in M (PTCL area), (N) (PTCL count), (O) the number of PTCL active sites and P (PTCL duration; n = 5). Data were normalized to controls and expressed as percentages (%). Significance determined using unpaired t-test, * = p<0.1, ** = p<0.01, *** = p<0.001 **** = p<0.0001. All data graphed as mean ± SEM.
Figure 13 with 2 supplements
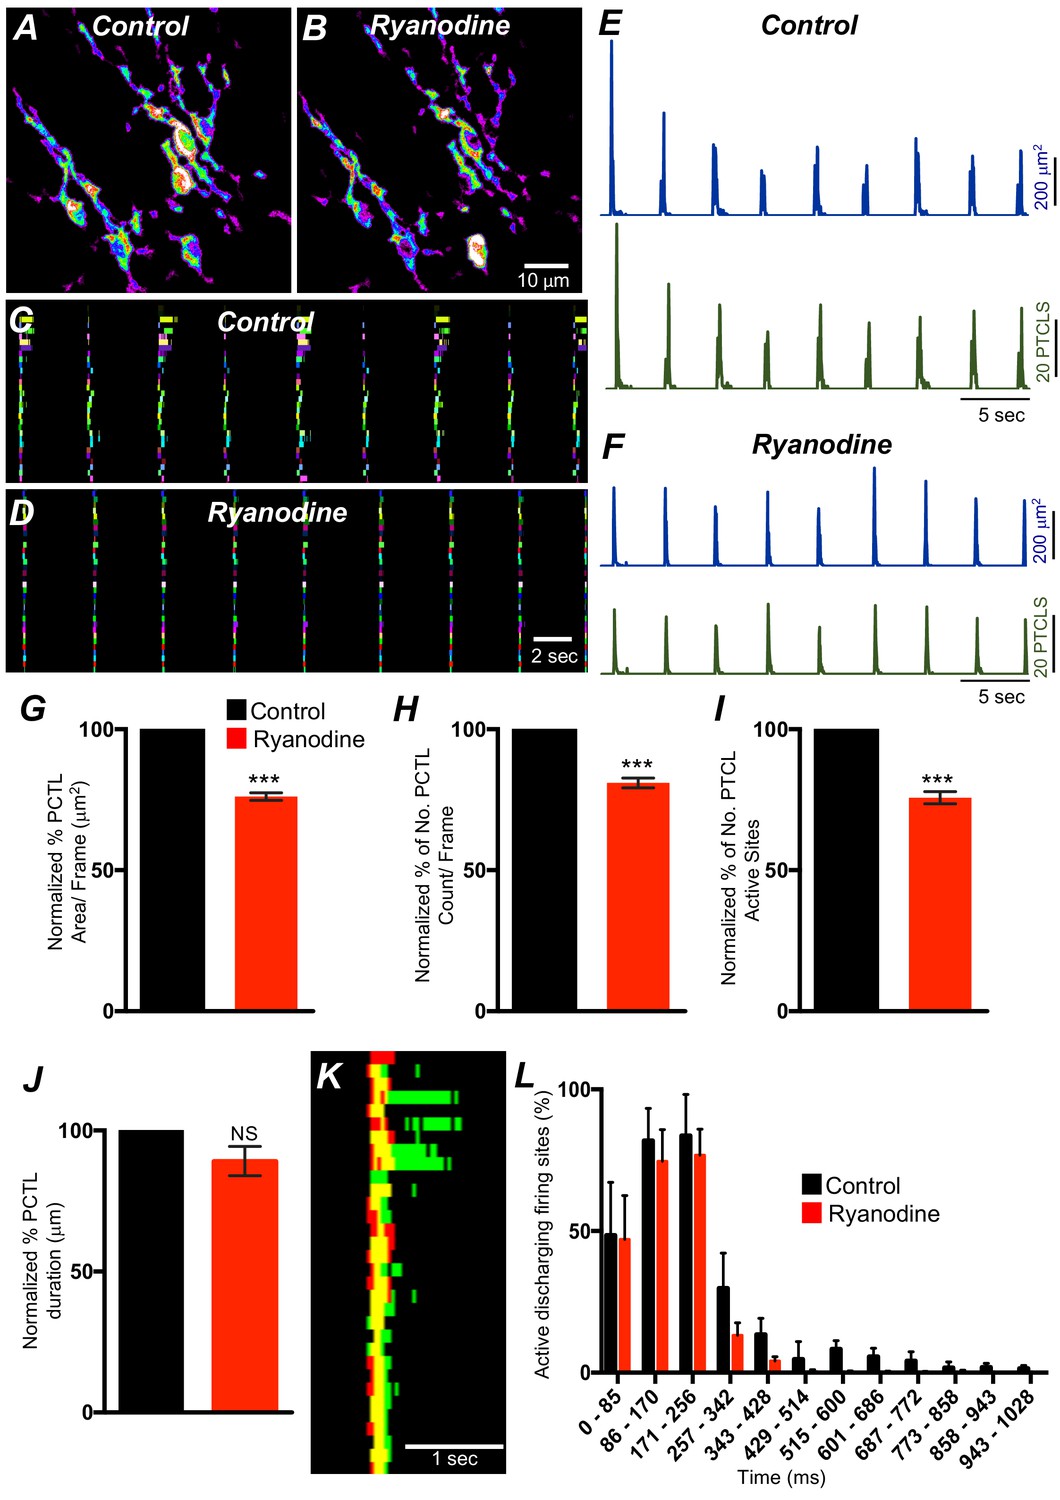
Ryanodine receptors (RyRs) contributing to Ca2+ release in submucosal interstitial cells of Cajal (ICC-SM).
(A) Representative heat-map image of an ICC-SM network from proximal colon showing total active Ca2+ PTCLs under control conditions and in the presence of ryanodine (100 μM) (B). C and D Ca2+-firing sites are color coded and plotted in occurrence maps showing the effect of the ryanodine (100 μM), on Ca2+ transient clusters (CTCs) in ICC-SM. Traces of firing sites PTCL area (E; blue) and PTCL count (E; green) under control conditions and in the presence of ryanodine, PTCL area (F; blue) and PTCL count (F; green). Summary graphs of Ca2+ PTCL activity in ICC-SM in the presence of ryanodine are shown in G (PTCL area), (H) (PTCL count), (I) the number of PTCL active sites and J (PTCL duration; n = 4). (K) Overlaid occurrence maps showing Ca2+ firing during control conditions (all firing sites are in green) and in the presence of ryanodine (all firing sites are in red). Note how ryanodine shortened the duration of the total Ca2+ transient cluster (CTC). (L) Distribution plot of average percentages of firing sites during a Ca2+ wave, calculated for 1 s duration and plotted in 85 ms bins showing that ryanodine mainly blocked Ca2+ transients occurring after the first 257 ms intervals (n = 4). Data were normalized to controls and expressed as percentages (%). Significance determined using unpaired t-test, *** = p<0.001. All data graphed as mean ± SEM.
Figure 13—figure supplement 1

IP3 receptors (IP3Rs) contribution to Ca2+ transients in submucosal interstitial cells of Cajal (ICC-SM).
A and B Representative images of heat-maps of the summated Ca2+ transient particles of ICC-MY under control conditions A and in xestospongin C (10 μM; B). C and D Ca2+-firing sites are color coded and plotted in occurrence maps showing the effect of the xestospongin C (1 μM) on Ca2+ transient clusters (CTCs). Traces of firing sites PTCL area (E; blue) and PTCL count (E; green) under control conditions and in the presence of xestospongin C, PTCL area (F; blue) and PTCL count (F; green). Summary graphs of Ca2+ PTCL activity in ICC-SM in the presence of xestospongin C are shown in G (PTCL area), (H) (PTCL count) and the number of PTCL active sites I (n = 4). (J) overlaid images of Ca2+ event firing in control (all firing sites are in green) and in the presence of xestospongin C (all firing sites are in red). Note how ryanodine shortened the duration of the CTC. (K) Distribution plot of average percentages of firing sites during a Ca2+ wave, calculated for 1 s duration and plotted in 85 ms bins showing that xestospongin C mainly blocked Ca2+ transients occurring after the 257–342 ms intervals (n = 4). Data were normalized to controls and expressed as percentages (%). Significance determined using unpaired t-test, * = p<0.1 and Not significant (NS) = p>0.05. All data graphed as mean ± SEM.
Figure 13—figure supplement 2
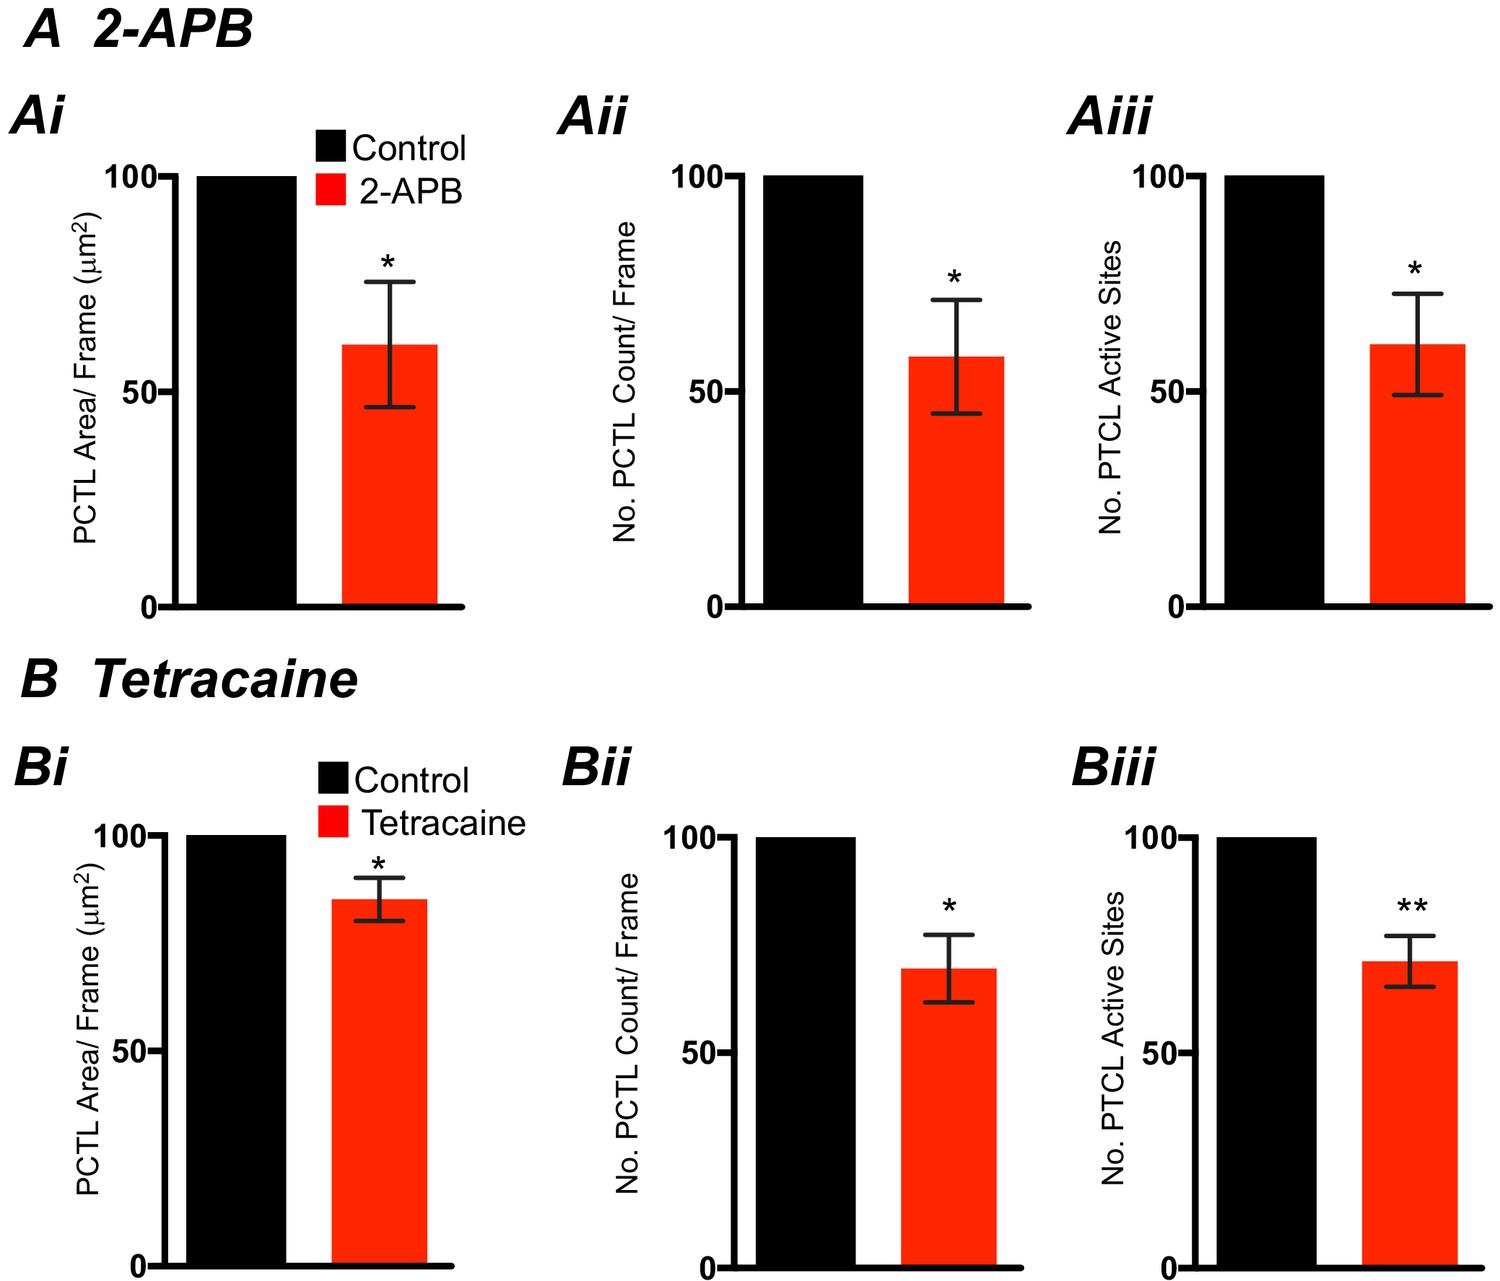
Effects of 2-APB and Tetracaine on submucosal interstitial cells of Cajal (ICC-SM) Ca2+ transients.
(A) Summary graphs of Ca2+ activity in ICC-SM in the presence of 2-APB (100 μM) are shown in Ai (PTCL area), Aii (PTCL count), and Aiii the number of PTCL active sites (n = 5). (B) Summary graphs of Ca2+ activity in ICC-SM in the presence of tetracaine (100 μM) are shown in Bi (PTCL area), Bii (PTCL count), and Biii the number of PTCL active sites (n = 5). Significance determined using unpaired t-test, * = p<0.1,** = p<0.01. All data graphed as mean ± SEM.
Figure 14

SOCE role in maintaining submucosal interstitial cells of Cajal (ICC-SM) Ca2+ transients.
(A) Representative Heat-map image of an ICC-SM network showing total active Ca2+ PTCLs under control conditions and in the presence of GSK-7975A (10 μM, for 20 min) B. C and D Ca2+-firing sites are color coded and plotted in occurrence maps showing the effect of the SOCE channel antagonist, GSK-7975A (100 μM), on ICC-SM Ca2+ transients. Traces of PTCL area (E; blue) and PTCL count (E; green) under control conditions and in the presence of GSK-7975A, PTCL area (F; blue) and PTCL count (F; green). Summary graphs of Ca2+ PTCL activity in ICC-SM in the presence of GSK-7975A are shown in G (PTCL area), (H) (PTCL count), (I) the number of PTCL active sites, and J (PTCL duration; n = 7). Significance determined using unpaired t-test, **** = p<0.0001. All data graphed as mean ± SEM.
Figure 15 with 1 supplement
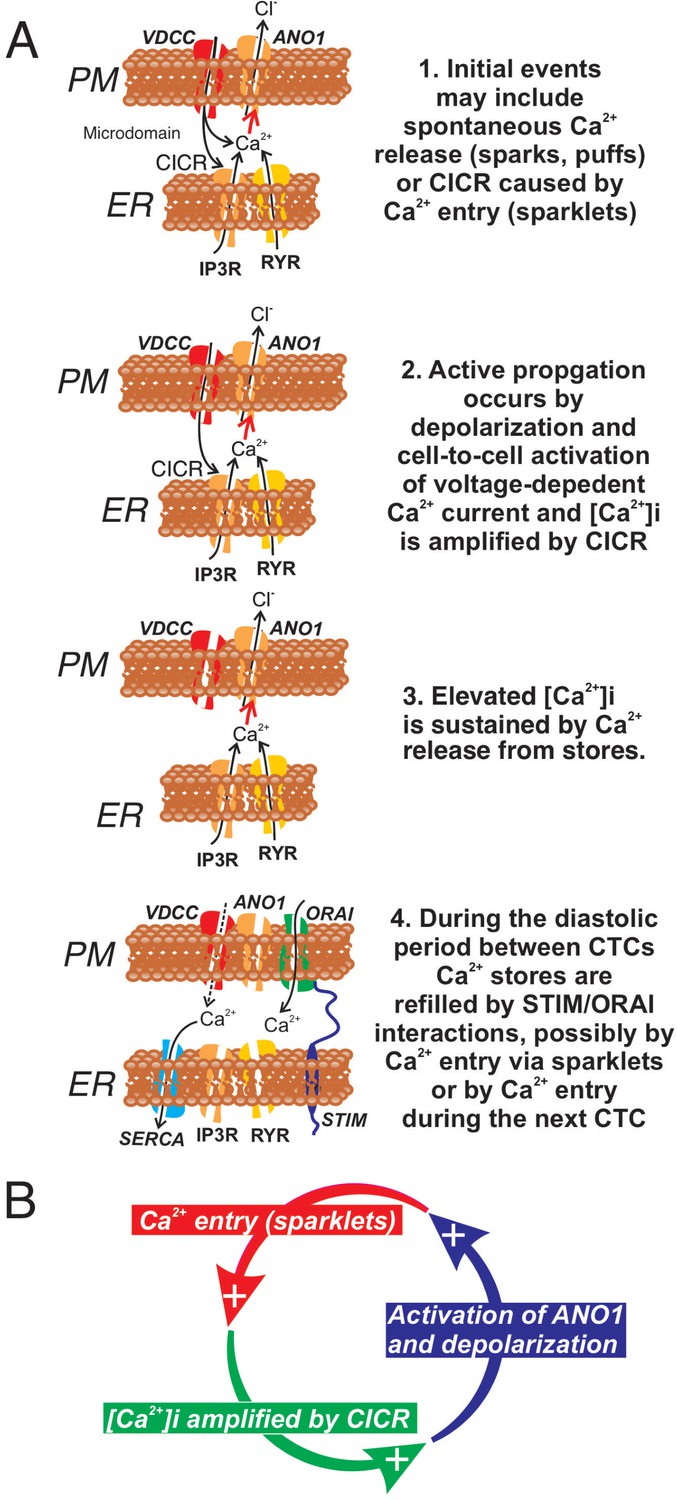
Role of voltage-dependent Ca2+ entry in the pacemaker function of submucosal interstitial cells of Cajal (ICC-SM).
(A) Shows segments of plasma membrane (PM) and endoplasmic reticulum membrane (ER) that form PM-ER junctions and microdomains. At least three types of voltage-dependent Ca2+ channels (VDCC) are expressed in ICC-SM, CaV1.2, CaV1.3, and CaV3.2. These conductances, with voltage-dependent activation and inactivation properties spanning a broad range of negative potentials, insure maintenance of pacemaker activity under conditions of hyperpolarization or depolarization in ICC-SM. Pacemaker activity (1. Initial events) in ICC-SM could be due to spontaneous release of Ca2+ from stores in the ER and utilize either IP3R or RYR receptors or both (Ca2+ sparks and puffs). However, our data cannot rule out the possibility that transient openings of voltage-dependent Ca2+ channels (sparklets) and amplification of Ca2+ in microdomains by CICR constitute the initial events of pacemaker activity. In this case, Ca2+ release from stores is not the primary pacemaker event but a secondary response to Ca2+ entry. Inhibition of Ca2+ release from stores would lead to reduced probability of CICR and decrease the frequency of CTCs. Our hypothesis is that Ca2+ entry and/or release from stores activates Ca2+-dependent Cl- current due to ANO1 channels in the plasma membrane. Active propagation between cells in interstitial cells of Cajal (ICC) networks (Phase 2) was inhibited by blocking voltage-dependent Ca2+ channels. Active propagation may also require or depend upon amplification of Ca2+ in microdomains by CICR. The duration of Ca2+ entry is likely to be brief due to voltage-dependent inactivation of L- and T-type Ca2+ channels. The duration of CTCs appears to be enhanced by CICR (Phase 3). Our data show that the duration of CTCs is reduced by several manipulations known to inhibit Ca2+ release from stores. In Phase four store reloading may occur by multiple mechanisms and may include: (i) transient Ca2+ entry via sparklets, (ii) activation of SOCE via STIM/ORAI interactions, and (iii) the increase in Ca2+ entry that occurs via depolarization and activation of Ca2+ entry at the onset of each CTC. (B) A novel hypothesis emerges from this study suggesting that the pacemaker mechanism in non-voltage-clamped cells includes a cyclical, positive-feedback phenomenon that may be responsible for initiation of CTCs and relies on: (i) Ca2+ entry through voltage-dependent Ca2+ channels. Openings of clusters of these channels would generate sparklets; (ii) Ca2+ entry initiates CICR which amplifies [Ca2+]i within microdomains; (iii) the rise in [Ca2+]i activates ANO1 channels in the PM causing depolarization; (iv) depolarization enhances the open probability of voltage-dependent Ca2+ channels, increasing Ca2+ entry. This cycle creates positive feedback for Ca2+ entry, clustering of localized Ca2+ transients due to Ca2+ entry during the first 350–450 ms of CTCs and development of slow wave depolarizations in ICC-SM.
Figure 15—figure supplement 1

Schematic showing how Ca2+ signaling in the pacemaker function of submucosal interstitial cells of Cajal (ICC) is coupled to smooth muscle cells (SMCs).
Videos
Video 1
Simultaneous dual-color imaging of submucosal interstitial cells of Cajal (ICC-SM) and smooth muscle cells (SMCs) in the colon.
A video of propagating Ca2+ waves through an ICC-SM network in the proximal colon of Kit-iCre-GCaMP6f/Acta2-RCaMP1.07 strain imaged with a ×20 objective. simultaneous imaging of two optogenetic Ca2+ sensors: GCaMP6f in ICC-SM (left field of view [FOV]; green) and RCaMP1.07 in SMCs (right FOV; red) with different fluorescence characteristics (ensuring minimal spectral overlap). The signal coordination between ICC and SMCs showing the correlation between Ca2+ transients in the ICC-SM network and activation of SMCs adjacent to ICC-SM. ICC-SM transients (green trace) preceded Ca2+ signals in SMCs (red trace). The scale bar (yellow) is 25 µm.
Video 2
High spatial resolution ICC-SM Ca2+ signals composed of multiple Ca2+-firing sites.
A video showing subcellular Ca2+ transients in ICC-SM at high resolution imaged with a ×60 objective. Ca2+ signals were monitored using the genetically encoded Ca2+ indicator GCaMP6f. The left panel shows typical stellate-shaped ICC-SM with multiple interconnected processes. The scale bar (yellow) is 10 µm. The middle panel shows the Ca2+ particle (PTCL) activity, color coded in blue for raw PTCLs, and the centroids of particles are indicated in purple and green indicates Ca2+-firing sites. Note the multiple-site firing of Ca2+ transients in ICC-SM. The right panel shows initiation/firing sites accumulation map. The pattern of firing sites Ca2+ activity was temporally clustered as Ca2+ wave oscillations swept through ICC-SM networks.
Tables
Key resources table
| Reagent type (species) or resource | Designation | Source or reference | Identifiers | Additional information |
|---|---|---|---|---|
| Antibody | Anti- c-Kit (Goat polyclonal) | R and D Systems | Cat# AF1356, RRID:AB_354750 | IHC (1:500) |
| Antibody | Alexa-488 (donkey anti-goat IgG) | Invitrogen/ Thermo Fisher Scientific | (Cat# A32814, RRID:AB_2762838) | IHC (1:1000) |
| Sequence-based reagent | Kit, Ano1, Myh11,Uchl1, Cacna1c Cacna1d, Cacna1g Cacna1h Orai1,Orai Orai3 | This paper | PCR primers | Suppl. Table 1 |
| Chemical compound, drug | NNC 55–0396, TTA-A2 | Alomone Labs | Cat# N-206 Cat# T-140 | |
| Chemical compound, drug | 2-APB, tetracaine, nicardipine, pinacidil, EGTA | Millipore-Sigma | Cat# D9754; Cat# T7508; Cat# N7510; Cat# P154; Cat# E4378 | |
| Chemical compound, drug | Thapsigargin, isradipine, Z-944, CPA, ryanodine | Tocris Bioscience | Cat# 1138/1; Cat# 2004/10; Cat# 6367/10; Cat# 1235/10; Cat# 1329/1 | |
| Chemical compound, drug | GSK 7975A | Aobious | Cat# AOB4124 | |
| Chemical compound, drug | Xestospongin C (XeC) | Cayman Chemical | Cat# 64950 | |
| Software, algorithm | STMapAuto, Ca2+ Analysis Software | https://github.com/gdelvalle99/STMapAuto | https://doi.org/10.1016/j.ceca.2020.102260 |
Additional files
-
Supplementary file 1
Table summary of gene primers sequences of Kit, Ano1, Myh11, Uchl1, Cacna1c, Cacna1d, Cacna1g, Cacna1h, and Orai1-3.
- https://cdn.elifesciences.org/articles/64099/elife-64099-supp1-v2.docx
-
Transparent reporting form
- https://cdn.elifesciences.org/articles/64099/elife-64099-transrepform-v2.docx
Download links
A two-part list of links to download the article, or parts of the article, in various formats.
Downloads (link to download the article as PDF)
Open citations (links to open the citations from this article in various online reference manager services)
Cite this article (links to download the citations from this article in formats compatible with various reference manager tools)
Ca2+ signaling driving pacemaker activity in submucosal interstitial cells of Cajal in the murine colon
eLife 10:e64099.
https://doi.org/10.7554/eLife.64099


