Introgression shapes fruit color convergence in invasive Galápagos tomato
- Department of Biology, Indiana University, United States
- Universidad San Francisco de Quito (USFQ). Colegio de Ciencias Biológicas y Ambientales, Laboratorio de Biotecnología Vegetal. Campus Cumbayá, Ecuador
- Galapagos Science Center, Universidad San Francisco de Quito and University of North Carolina at Chapel Hill, Ecuador
- Department of Plant Biology, University of Minnesota-Twin Cities, United States
Figures
Figure 1 with 1 supplement
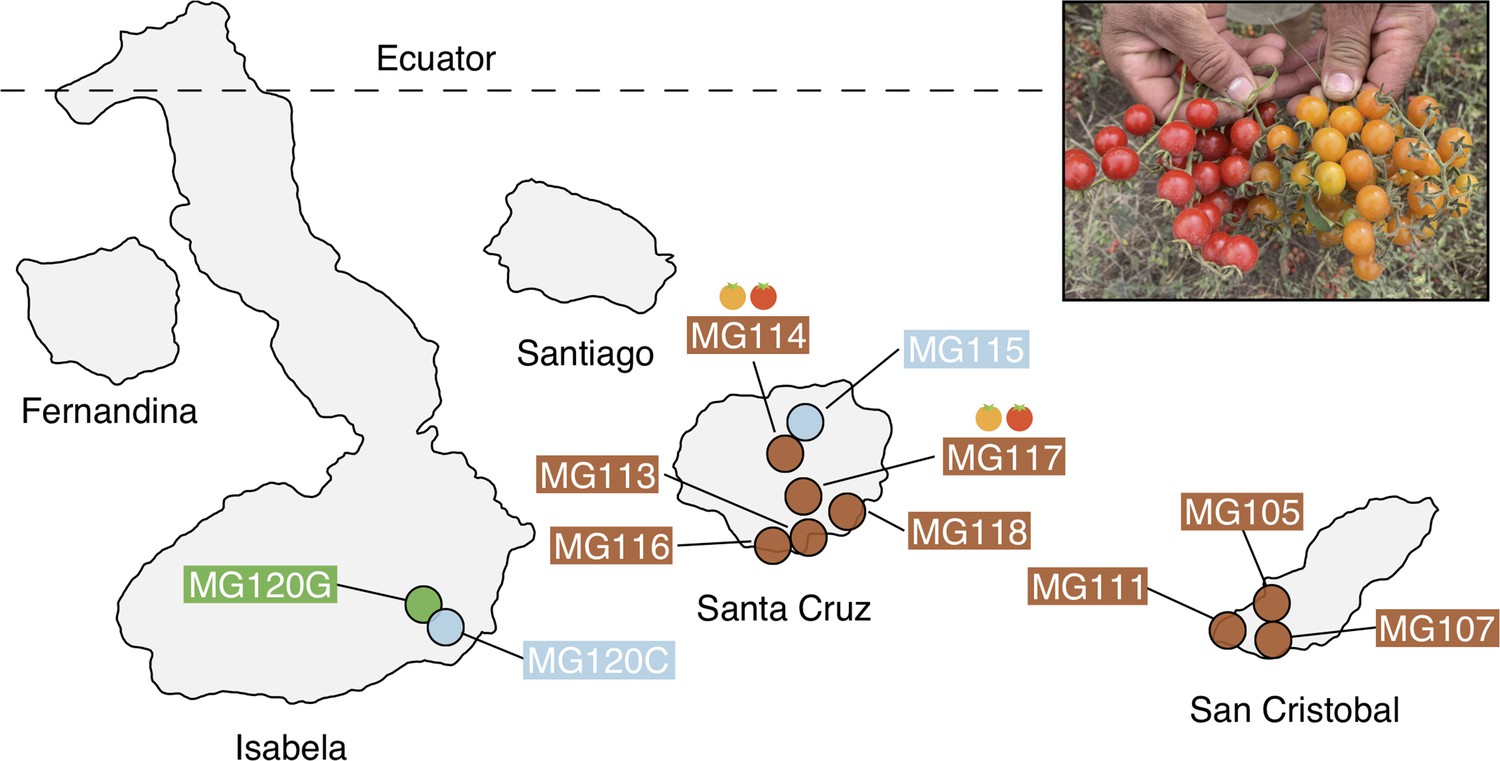
Geographic distribution of focal sampling sites on the Galápagos Islands.
Inset: Photograph of polymorphic (red/orange) PIM fruits representative of populations MG114 and MG117. For simplicity, LYC populations as well as sampling sites with <8 individuals are not included here. Refer to Supplementary file 1a for a full list of collection localities and sample sizes.
Figure 1—figure supplement 1
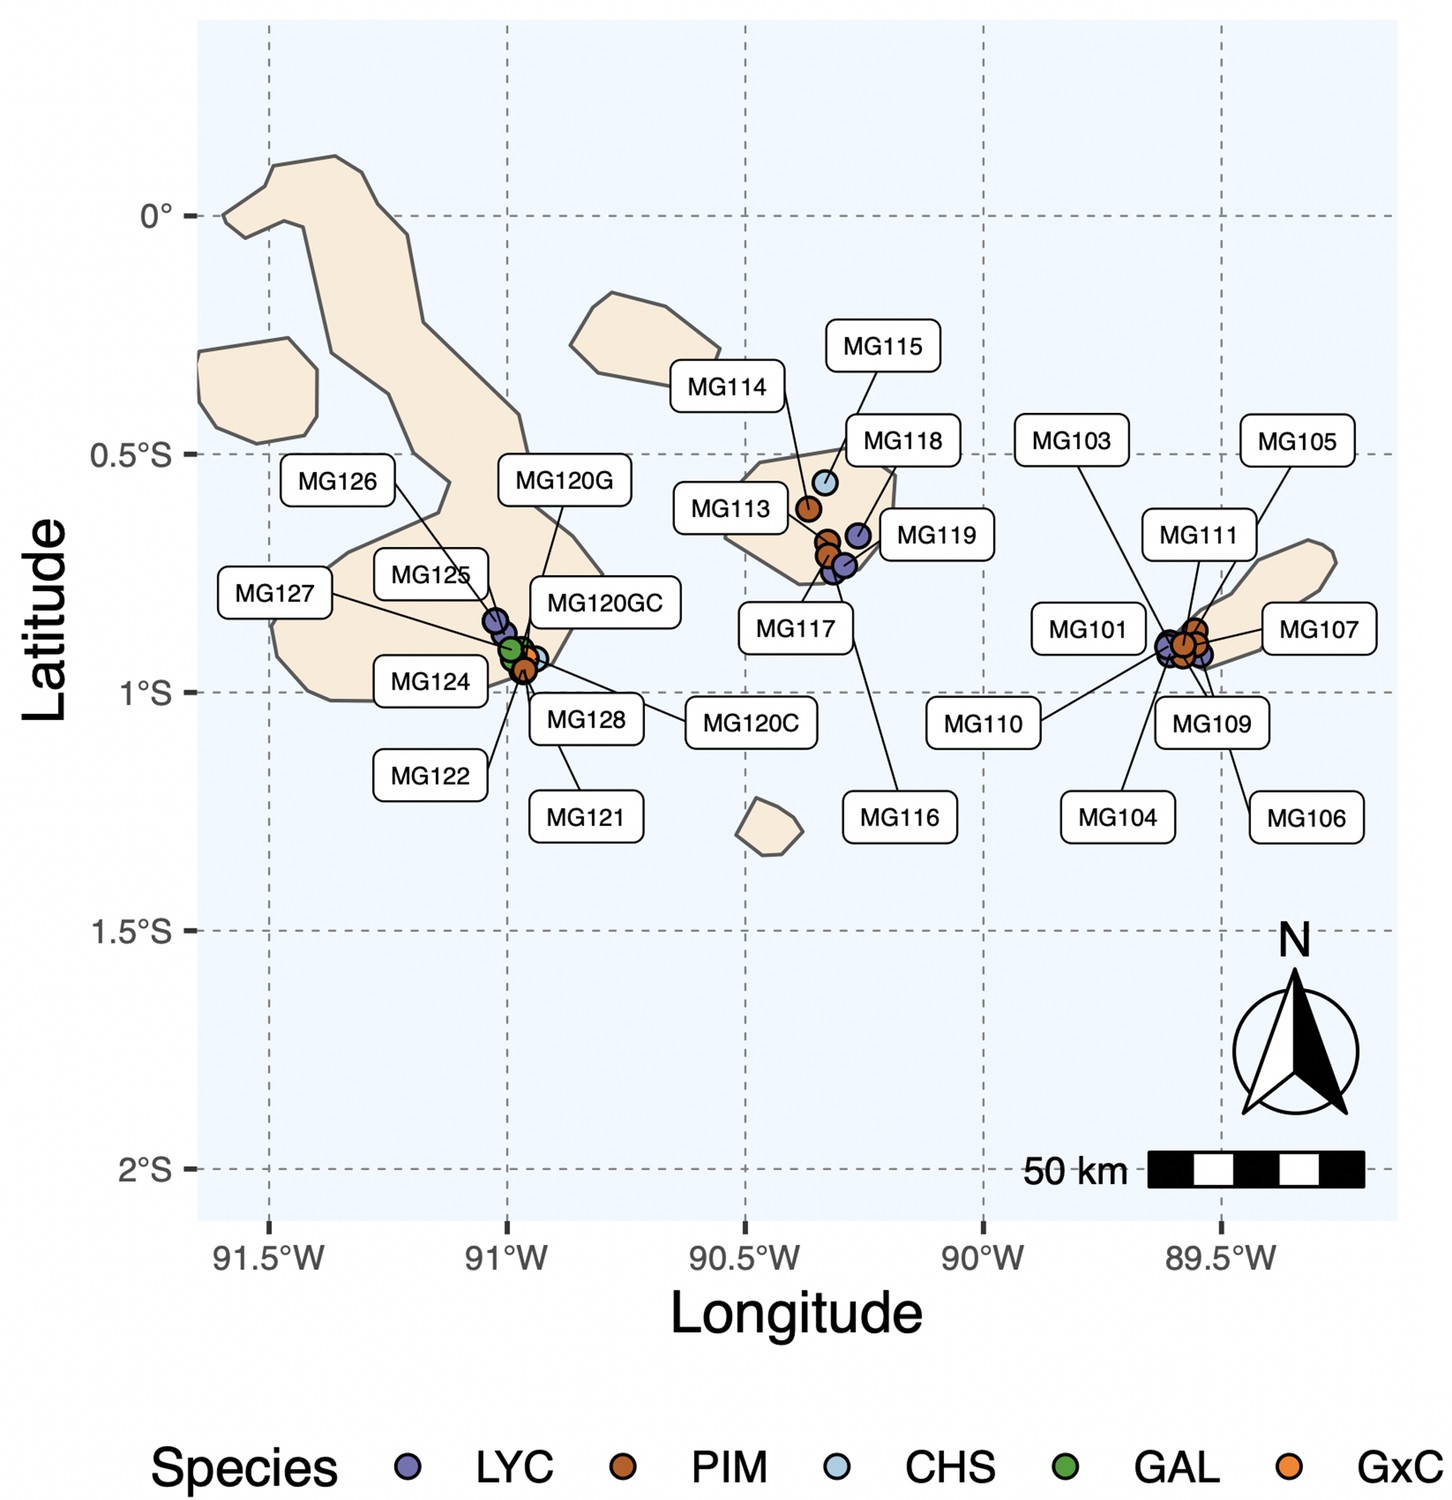
Map of all island collection locations.
Refer to Supplementary file 1a for details.
Figure 2 with 6 supplements
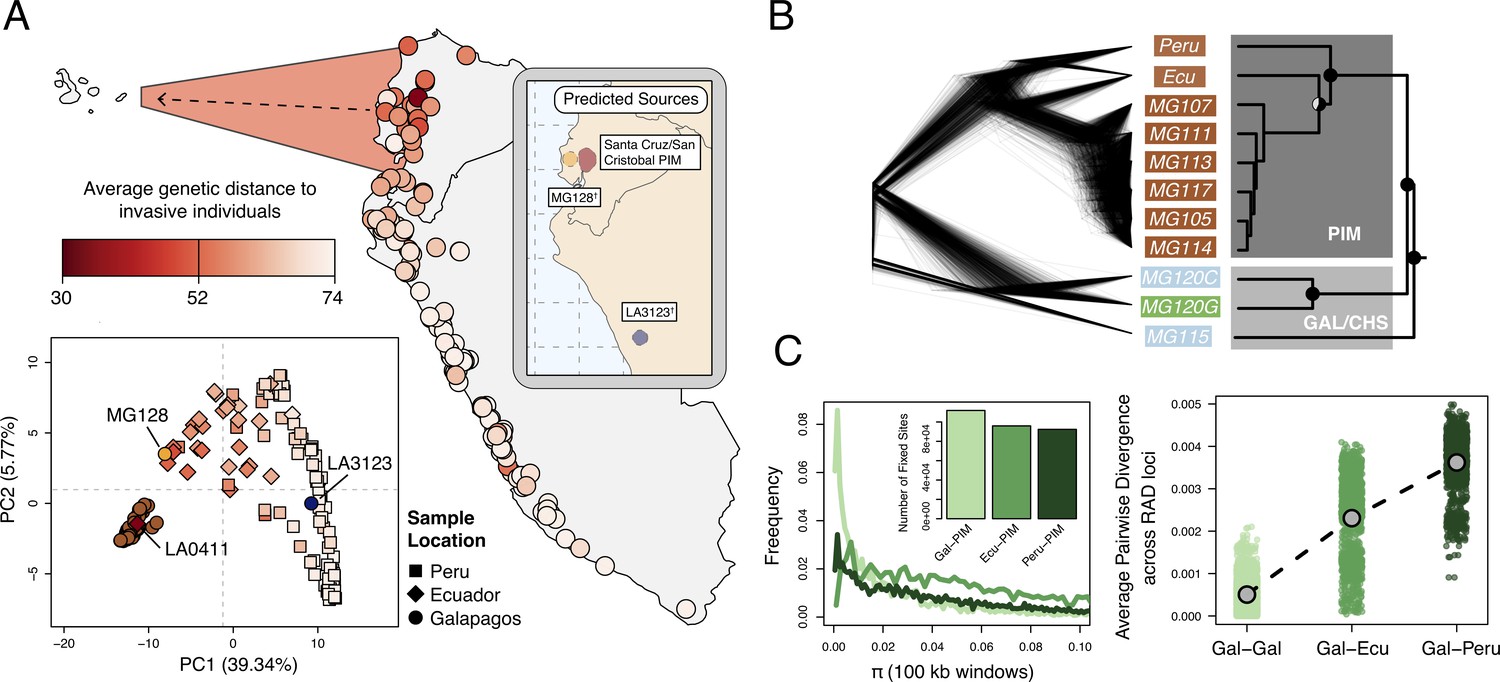
Galápagos PIM is the result of a recent invasion from Ecuador.
(A) Map: average genetic distance between Galápagos PIM collections and each of the 132 mainland accessions. Plot: multi-locus principal components analysis (PCA). Squares, diamonds, and circles indicate Peruvian, Ecuadorian, and Galápagos collections, respectively. Inset: Predicted continental origins for Galápagos PIM collections. Colors are same as shown in the multi-locus PCA (†Exact locations vary substantially between runs. Results from a single run are shown). (B) Maximum likelihood relationships among focal populations calculated with Treemix (allowing no migration). Left: inferred trees of 1000 resampled datasets (500 SNPs, with replacement). Right: consensus topology. All trees were rate-smoothed (λ = 1). (C) Diversity and divergence metrics. Left: nucleotide diversity (π) calculated for Galápagos PIM, Ecuador-PIM, and Peru PIM in overlapping 100 kb windows. Invariant windows (π = 0) are truncated and are instead shown in the inset bar plot. Right: average pairwise sequence divergence for three PIM comparisons: Gal×Gal, Gal×Ecu, and Gal×Peru. Each point represents a comparison between individuals, averaged over all loci.
Figure 2—figure supplement 1
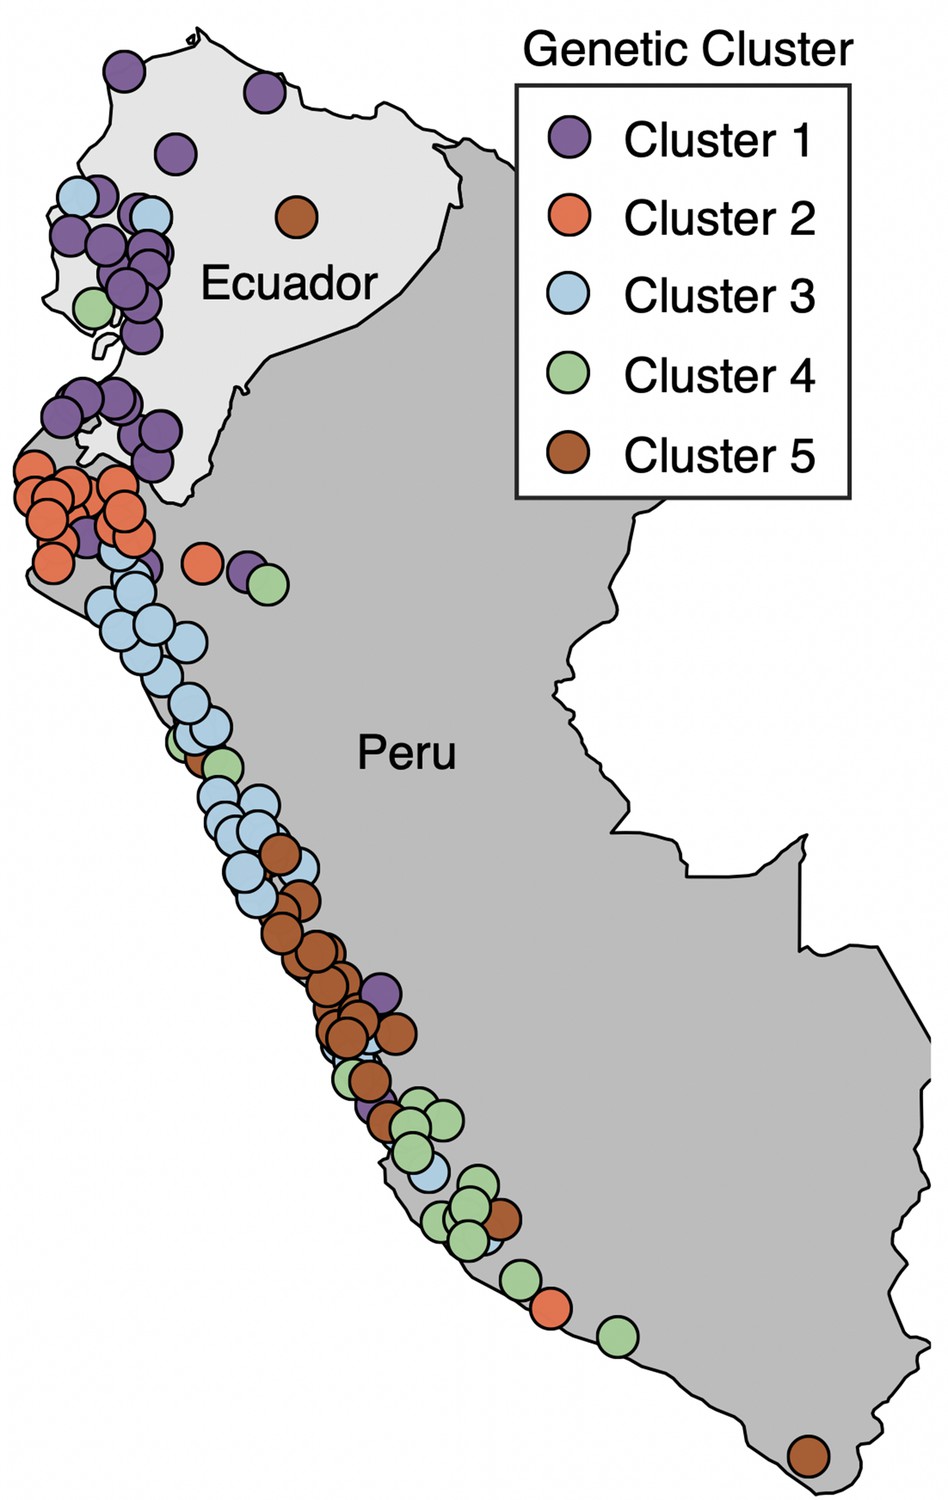
Map of mainland collection sites, colored by genetic ancestry cluster as determined in Gibson and Moyle, 2020.
Figure 2—figure supplement 2
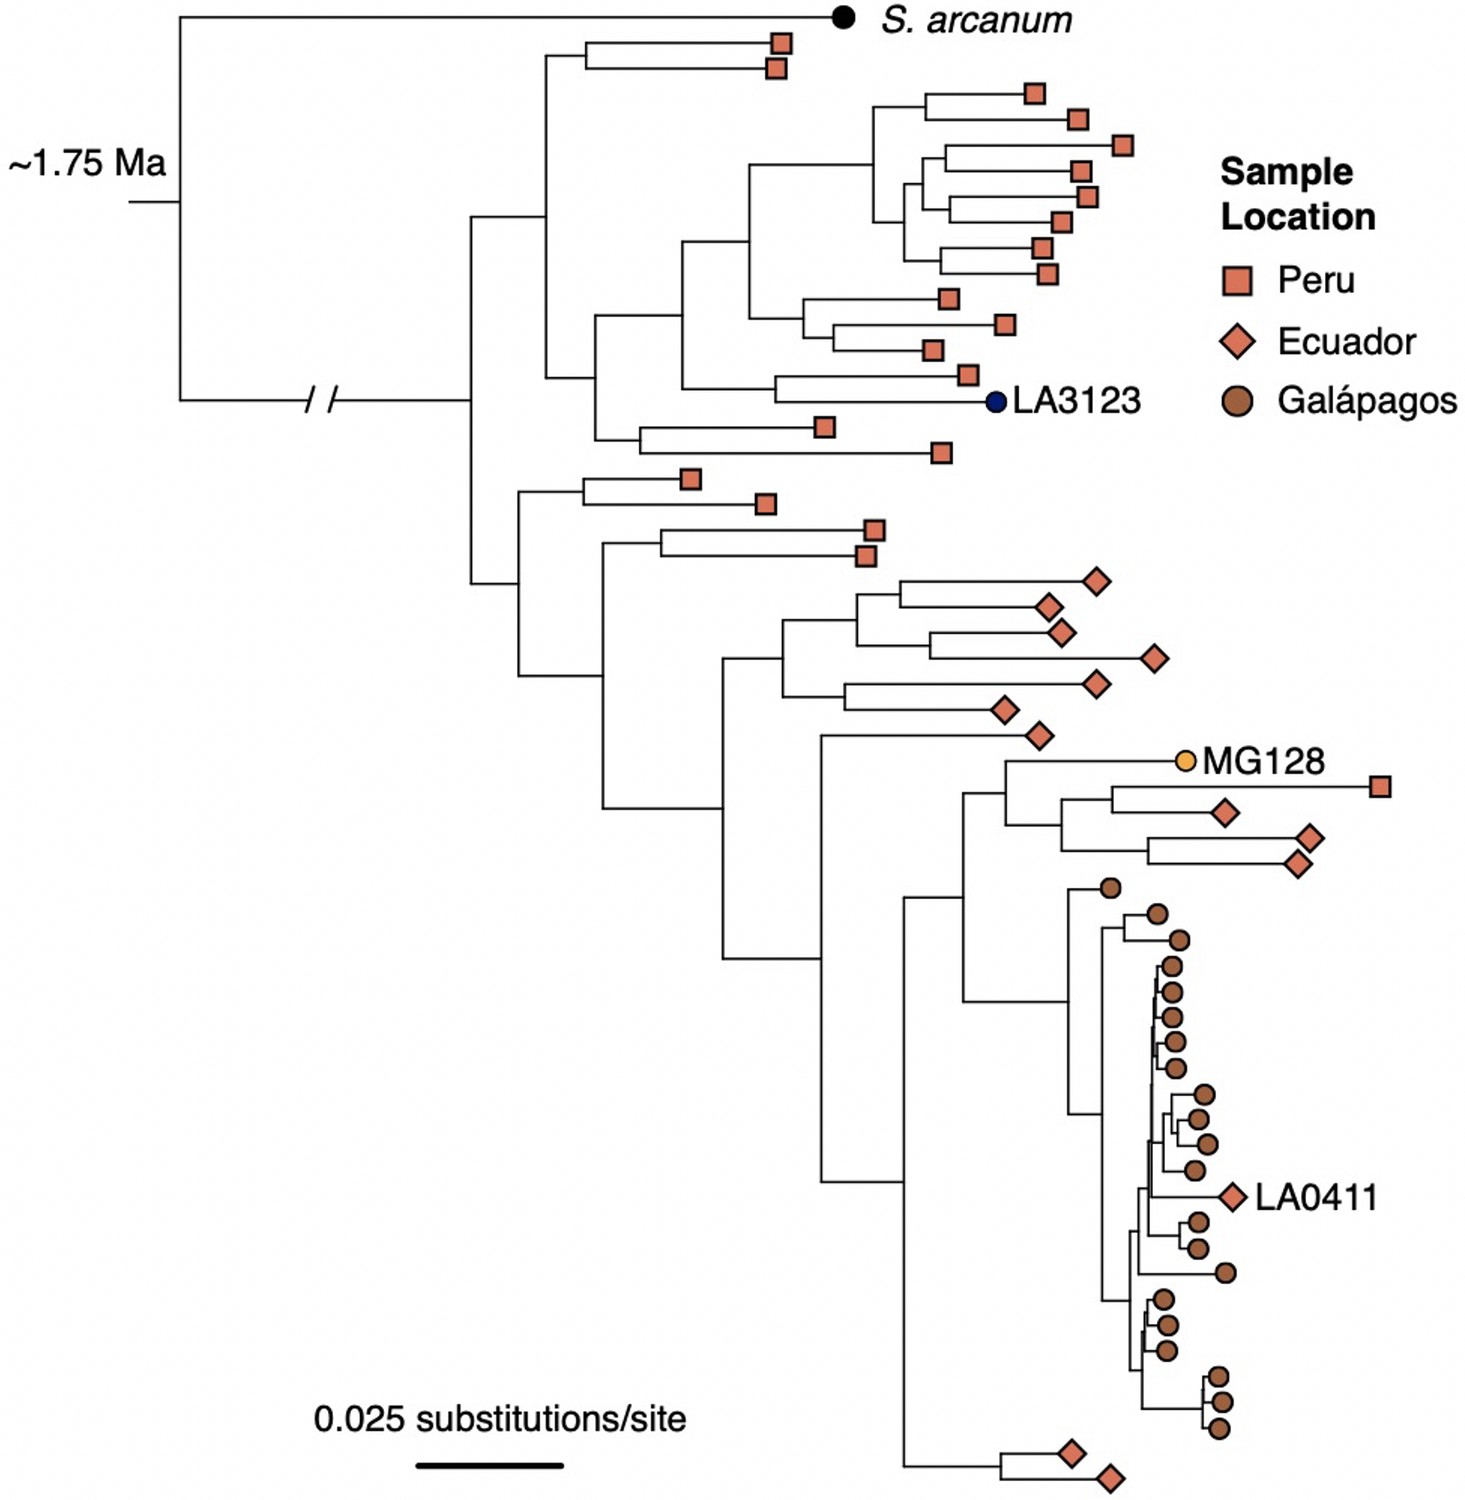
ML tree of individual samples inferred with RA×ML, using data concatenated across all RAD loci.
Samples were subset by population (for Galápagos collections, 1–2 individuals/population) and by geographic region (for mainland accessions; 20 individuals from Peru, 14 individuals from Ecuador) to limit redundancy and increase computation speed.
Figure 2—figure supplement 3
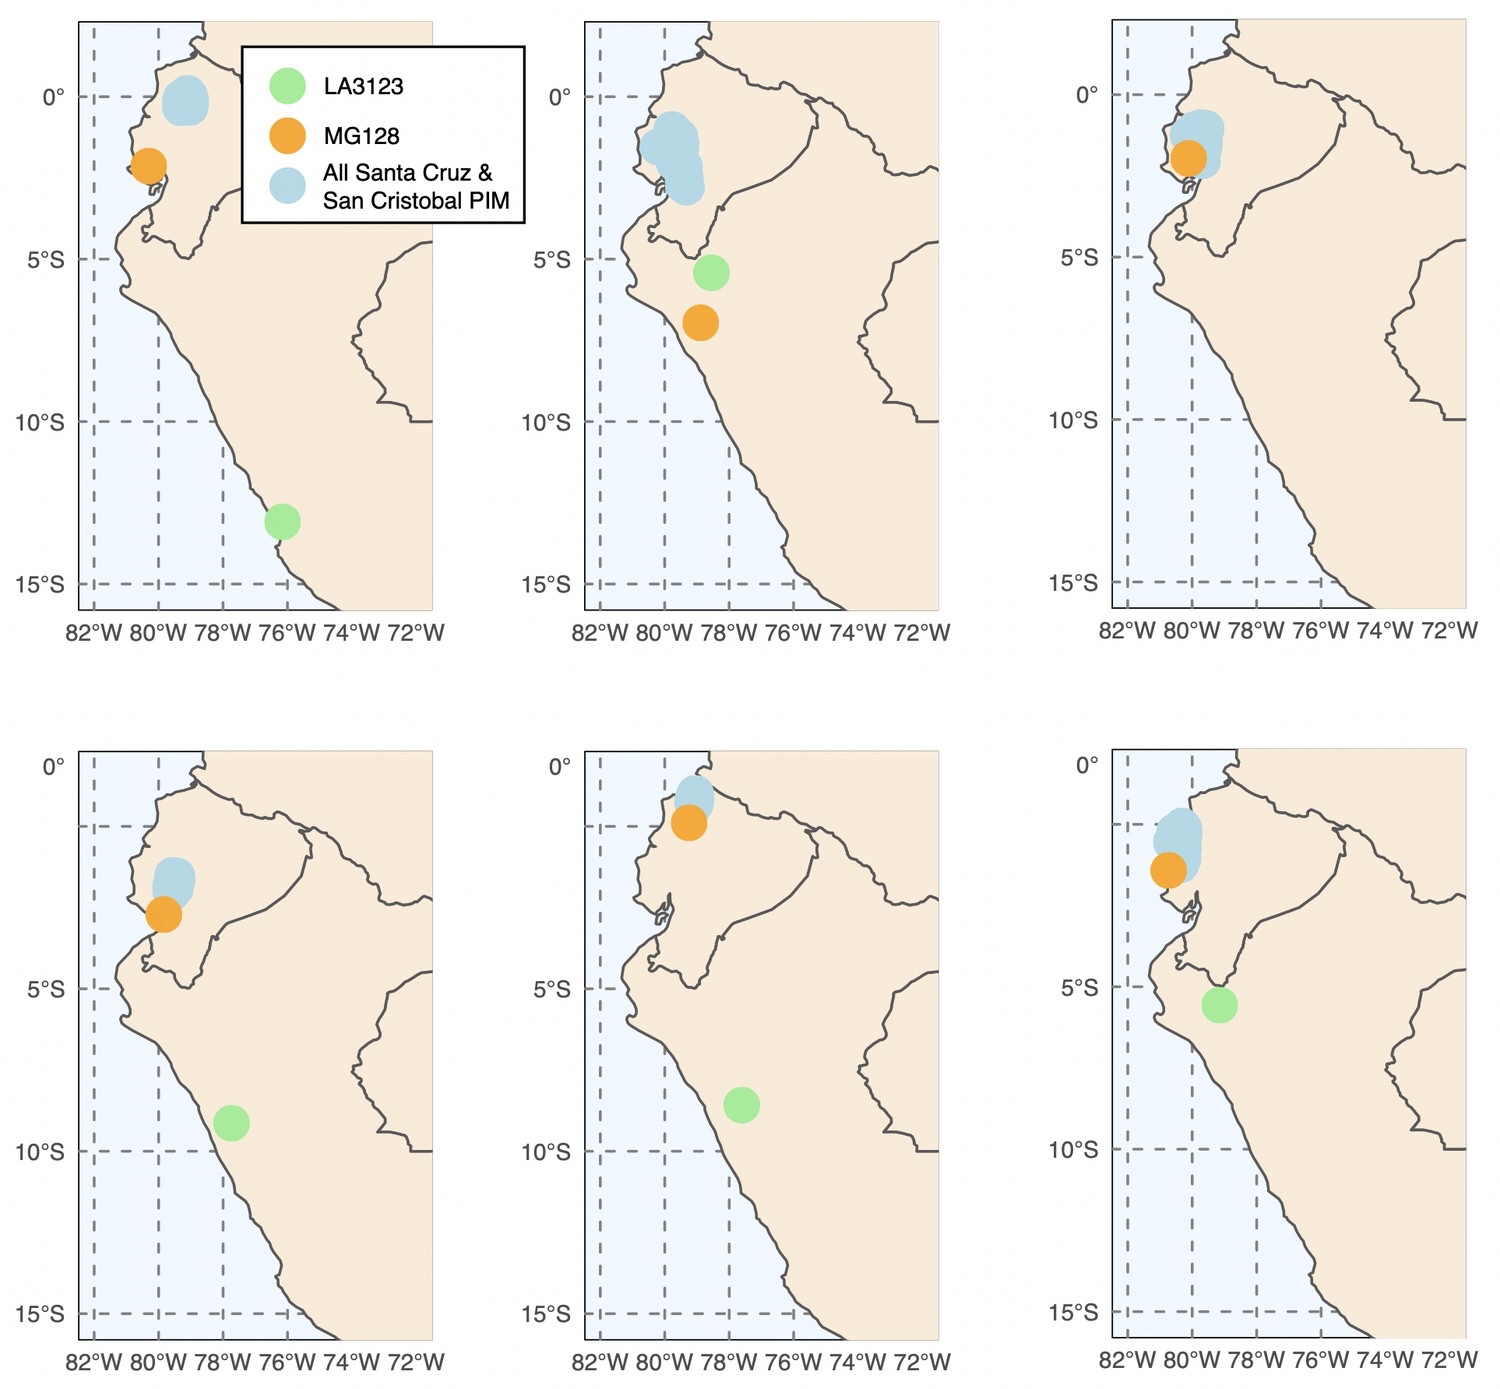
Six runs of Locator (Battey et al., 2020) generally support a three-invasion scenario.
Exact source localities for MG128-1 and LA3123 varied substantially across run.
Figure 2—figure supplement 4
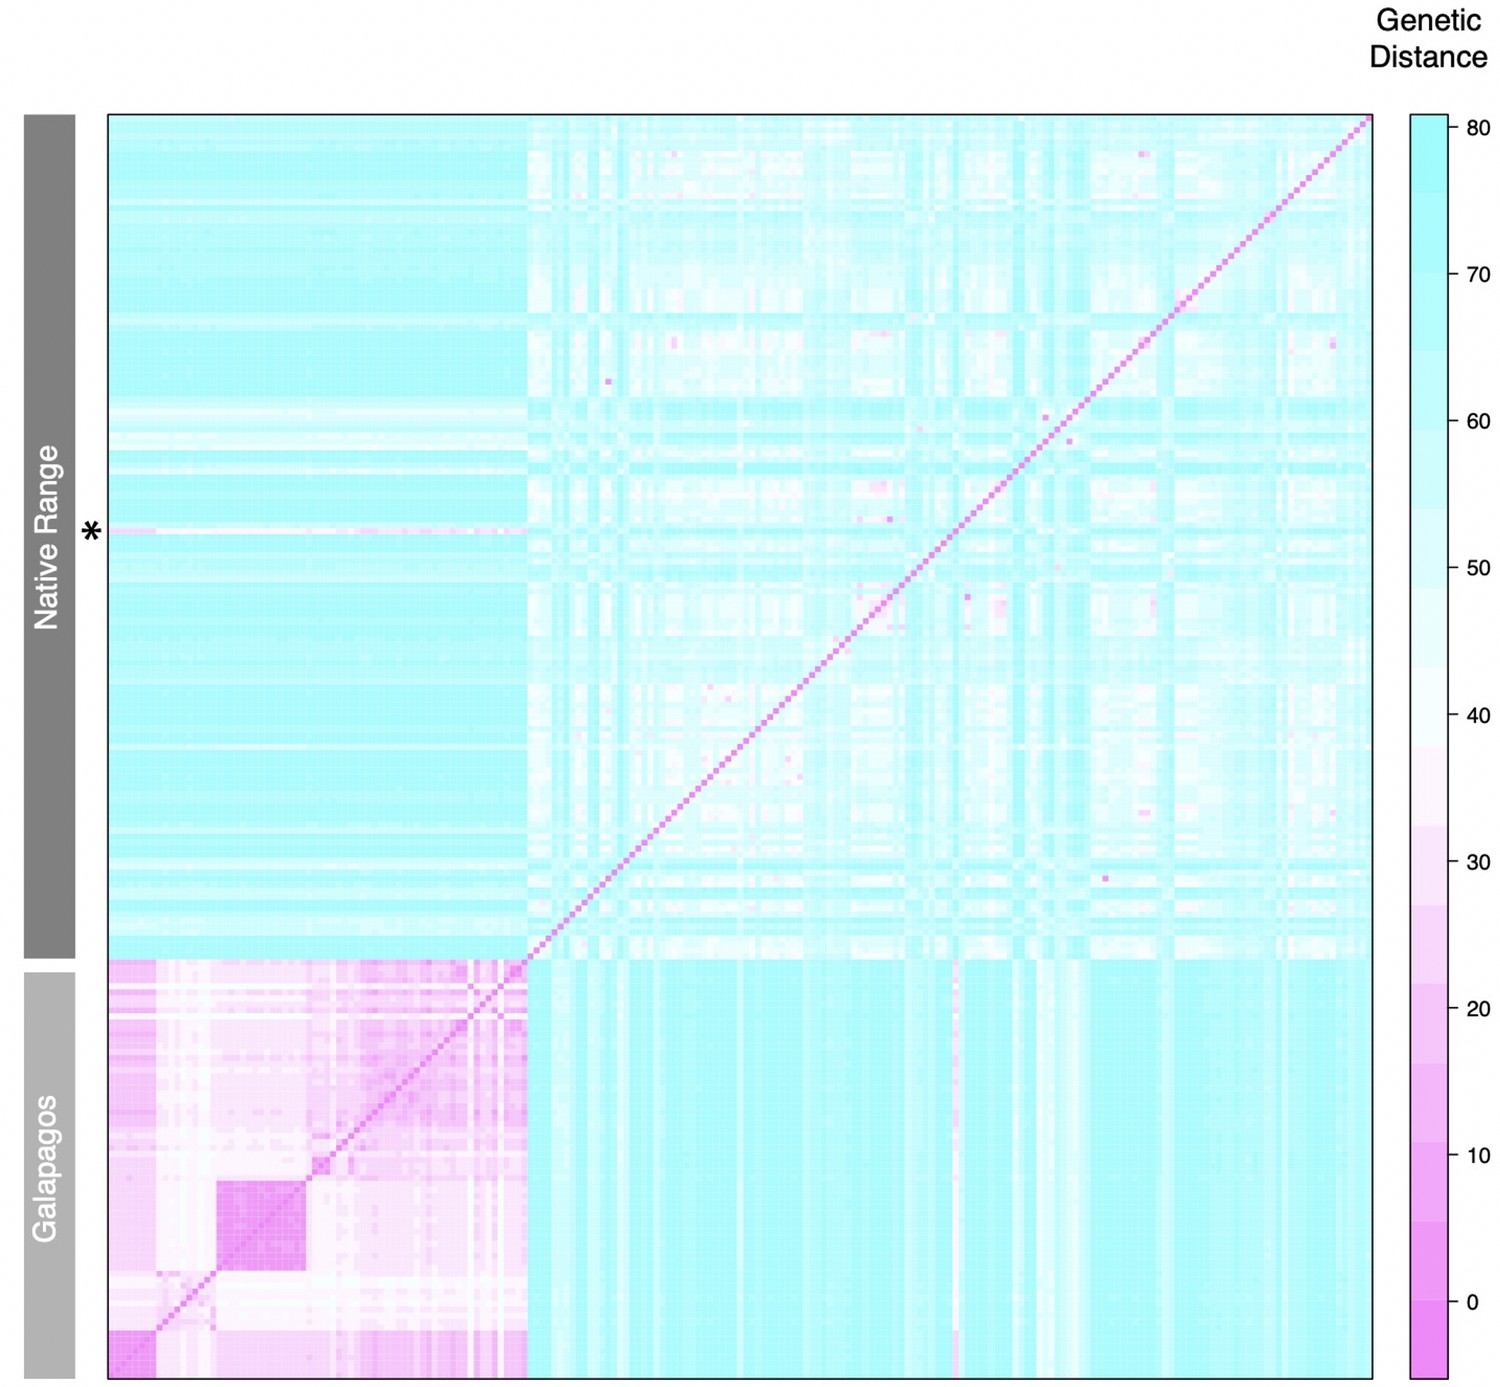
Pairwise genetic distances at all polymorphic loci.
Row indicated with an asterisk is LA0411, a sample putatively reintroduced to mainland Ecuador from Galápagos.
Figure 2—figure supplement 5
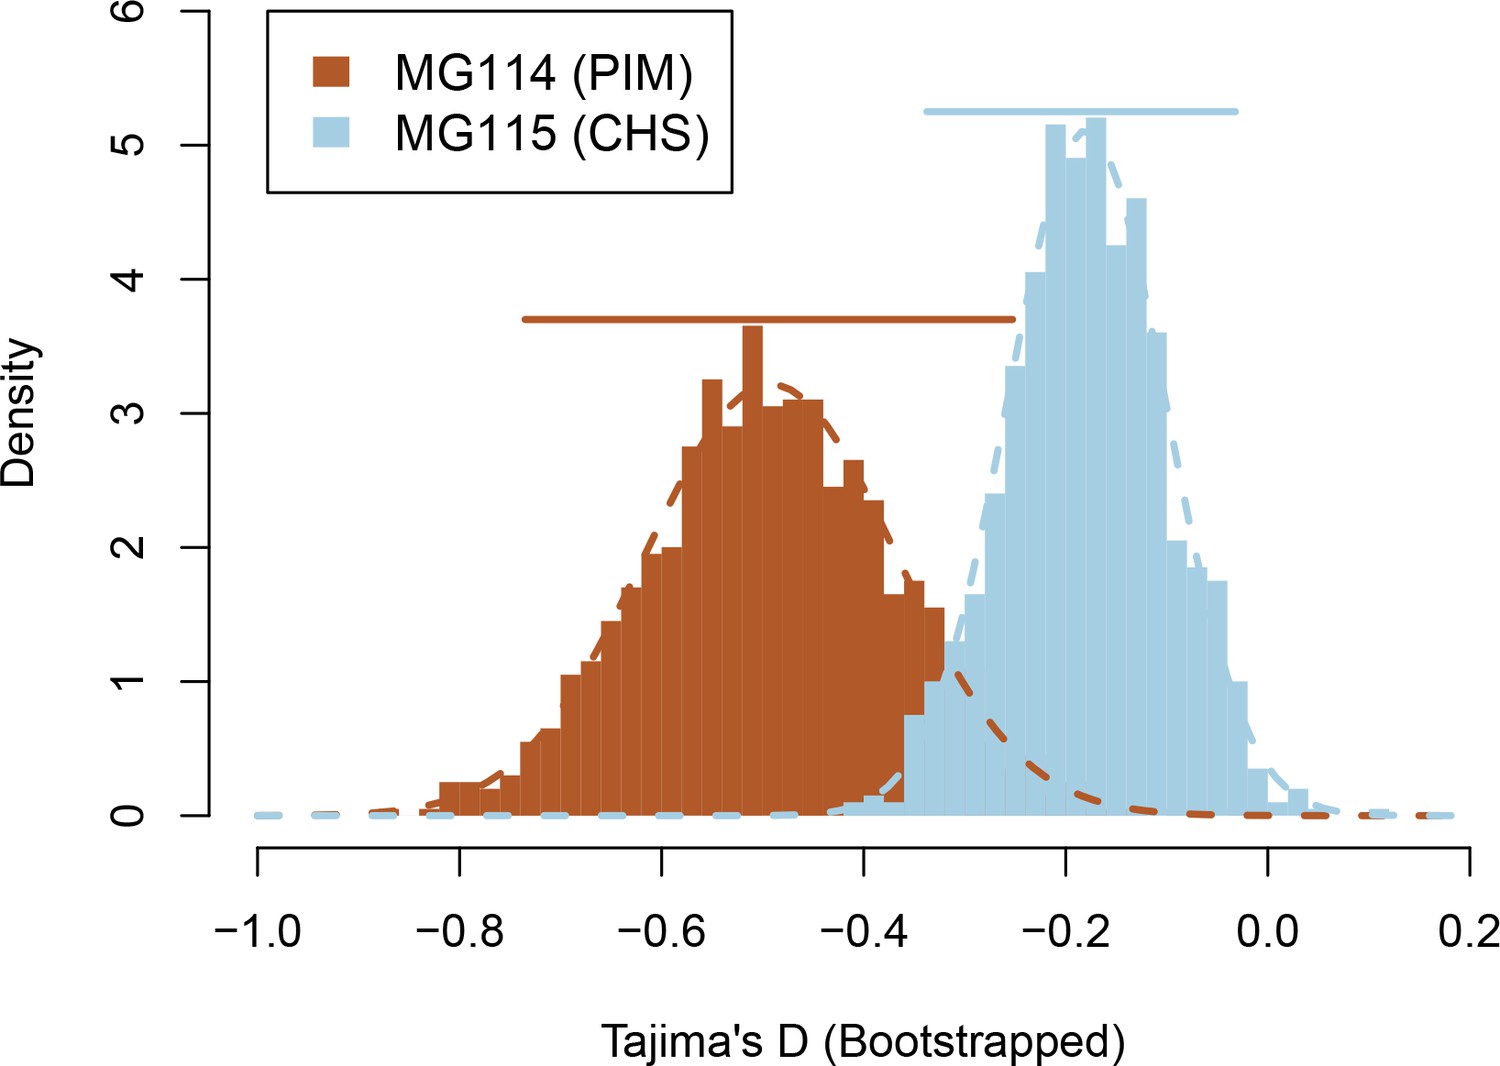
Bootstrapped sampling distributions of Tajima’s D for populations MG114 and MG115.
Colored bars represent 95% CIs. Data were generated from 1000 bootstrap replicates of the site frequency spectrum (SFS).
Figure 2—figure supplement 6
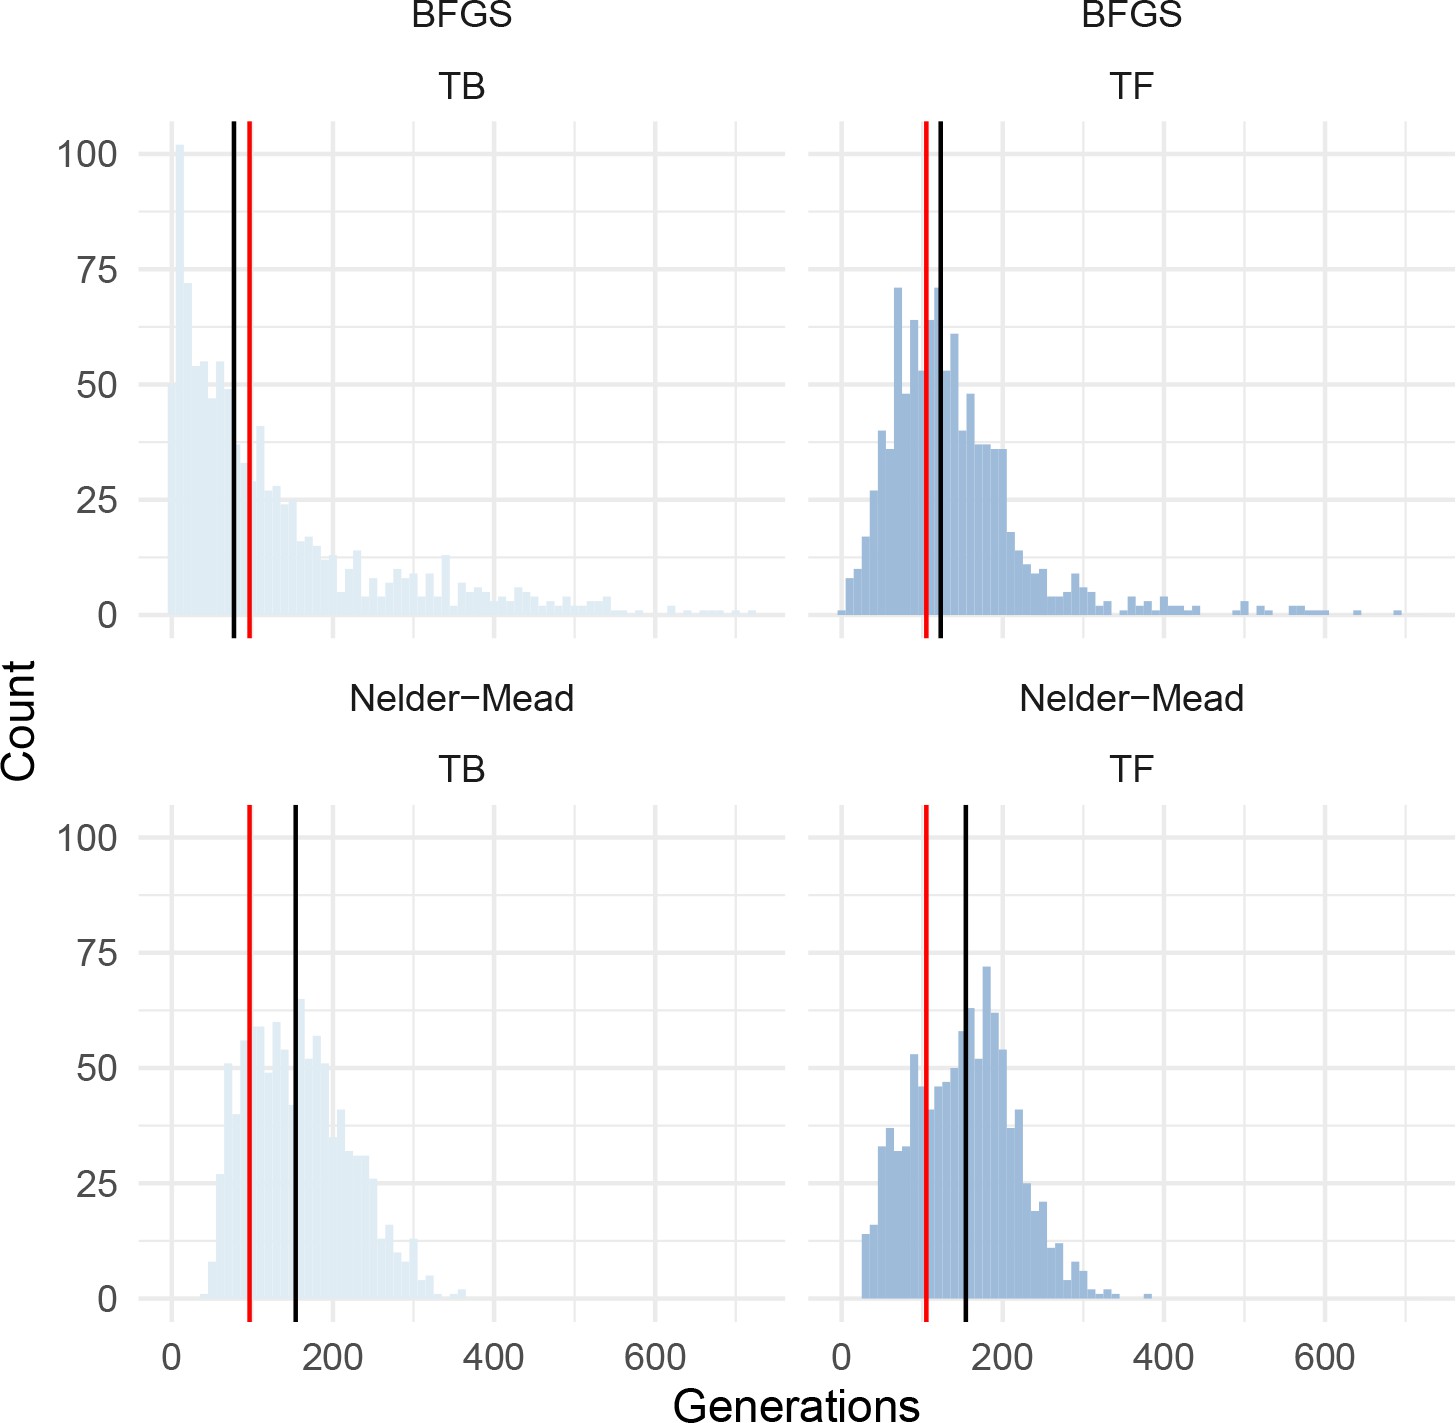
Histograms of bootstrapped parameter estimates from dadi for PIM population MG114, using the introgression-masked site frequency spectrum.
Red bars indicate the optimum value inferred. Black bars indicate the bootstrapped median value. Results from two optimization algorithms are shown; BFGS (top panels) and Nelder-Mead (bottom panels). TB = length of bottleneck; TF = time since end of bottleneck.
Figure 3 with 2 supplements
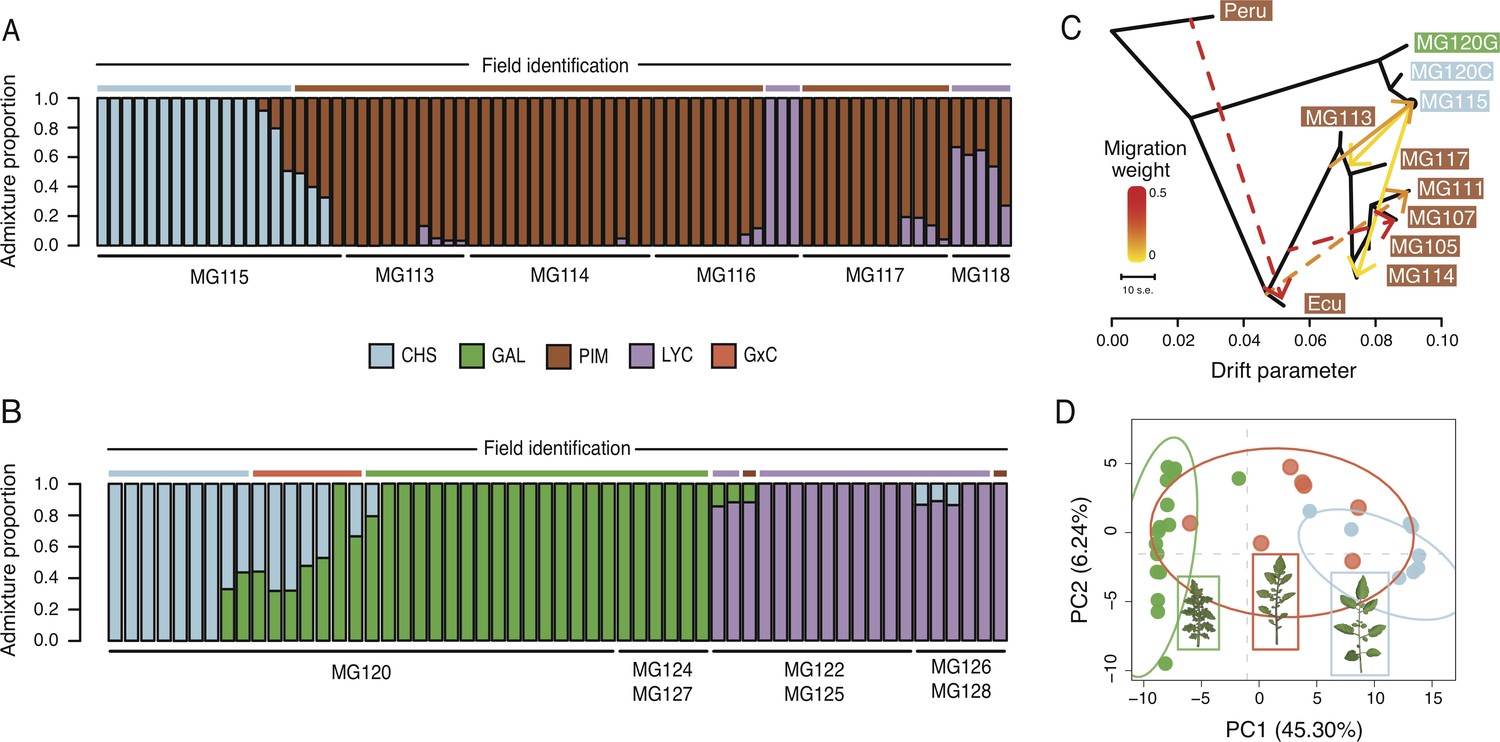
Patterns of population genetic structure and admixture on Santa Cruz and Isabela.
(A) fastStructure inference for all Santa Cruz samples (N = 74). K = 3. (B) fastStructure inference for all Isabela samples (N = 57). K = 3. (C) Treemix analysis summary (m = 6; ln[L]=395.08). Solid lines indicate interspecific events and dashed lines indicate intraspecific events. (D) Principal components analysis for samples at site MG120, a hybrid zone between CHS and GAL.
Figure 3—figure supplement 1
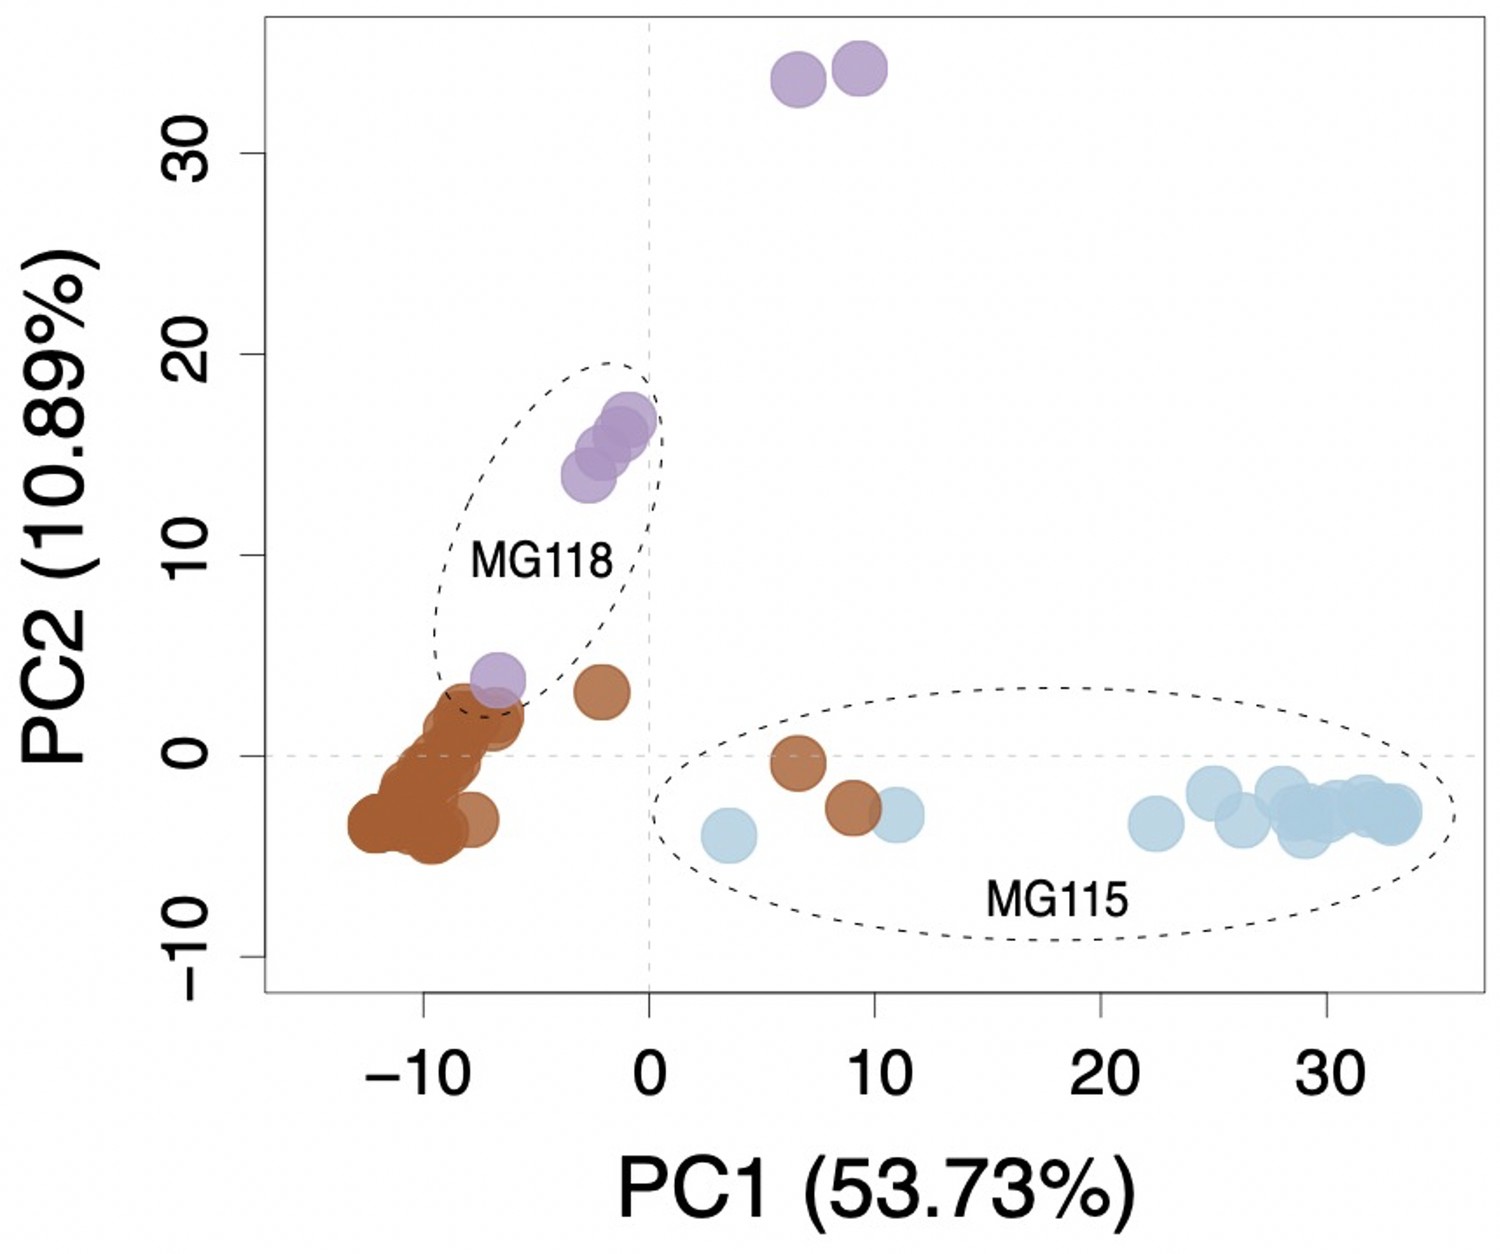
Multi-locus principal components analysis (PCA) for Santa Cruz collections.
Brown, purple, and blue points correspond to PIM, LYC, and CHS, respectively.
Figure 3—figure supplement 2
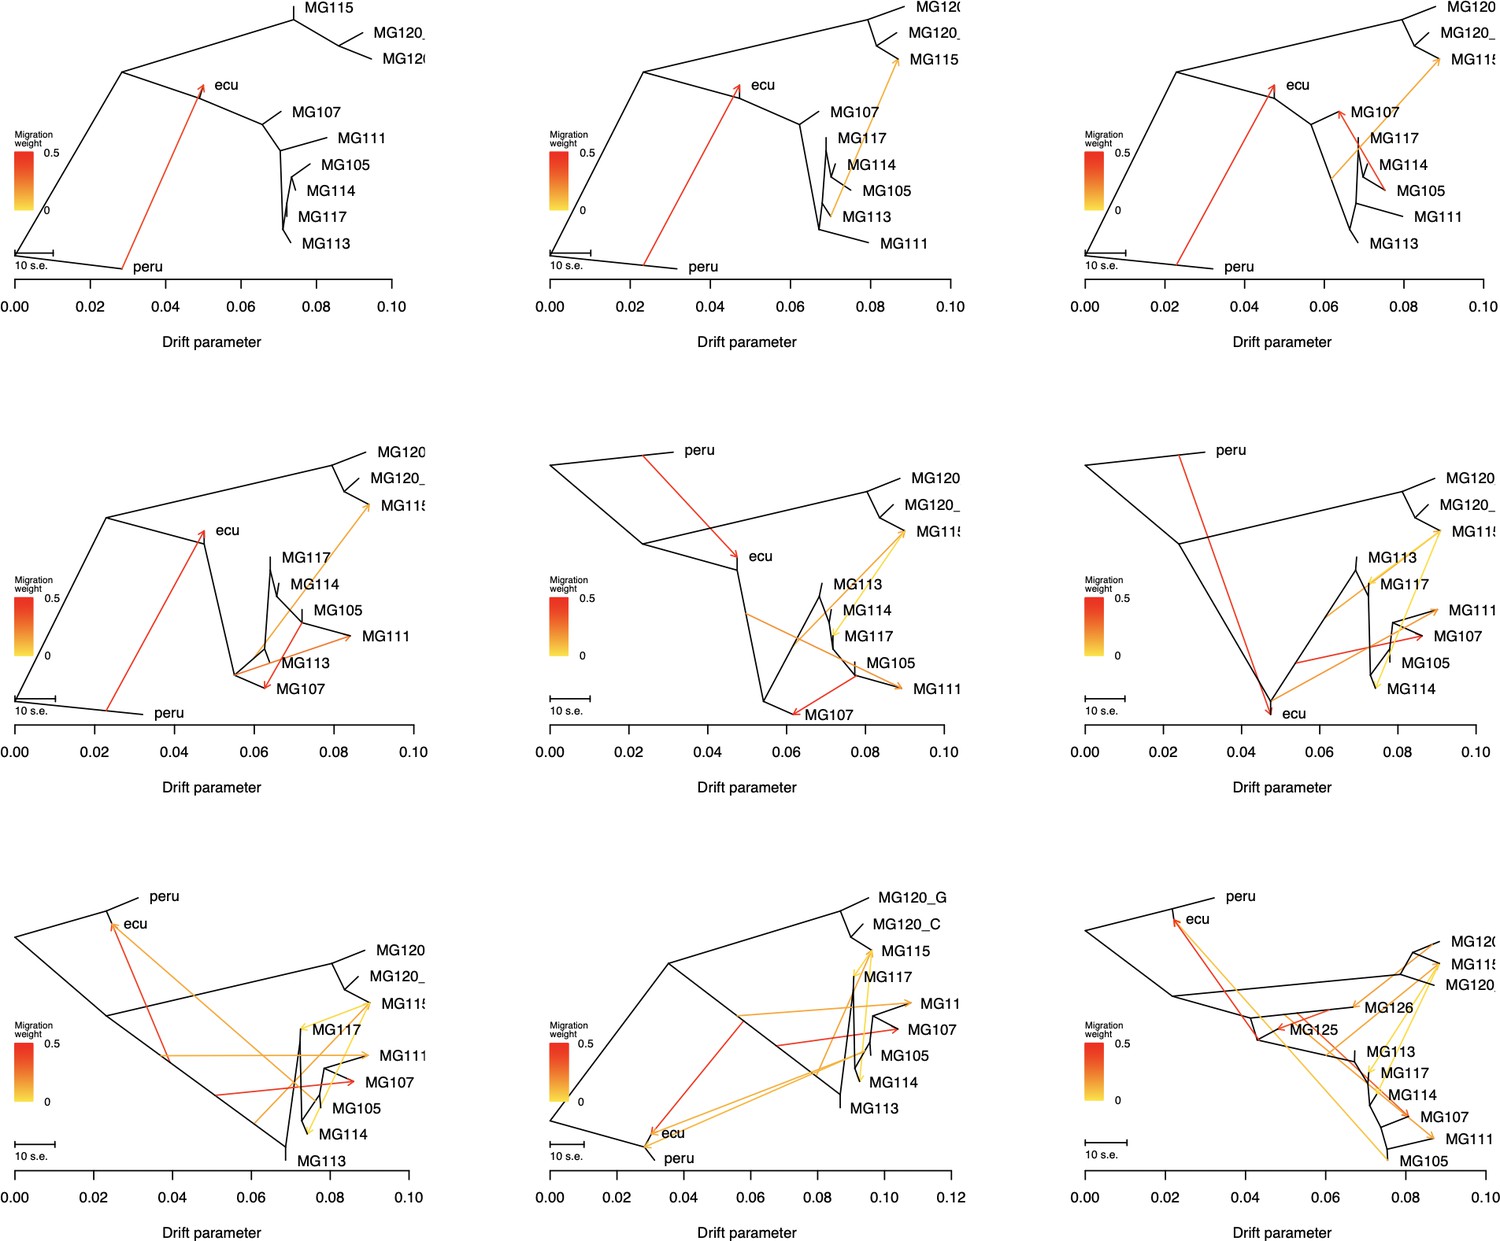
Treemix summary figures for all tested values for m (migration events: 1–8).
Figure 4 with 14 supplements
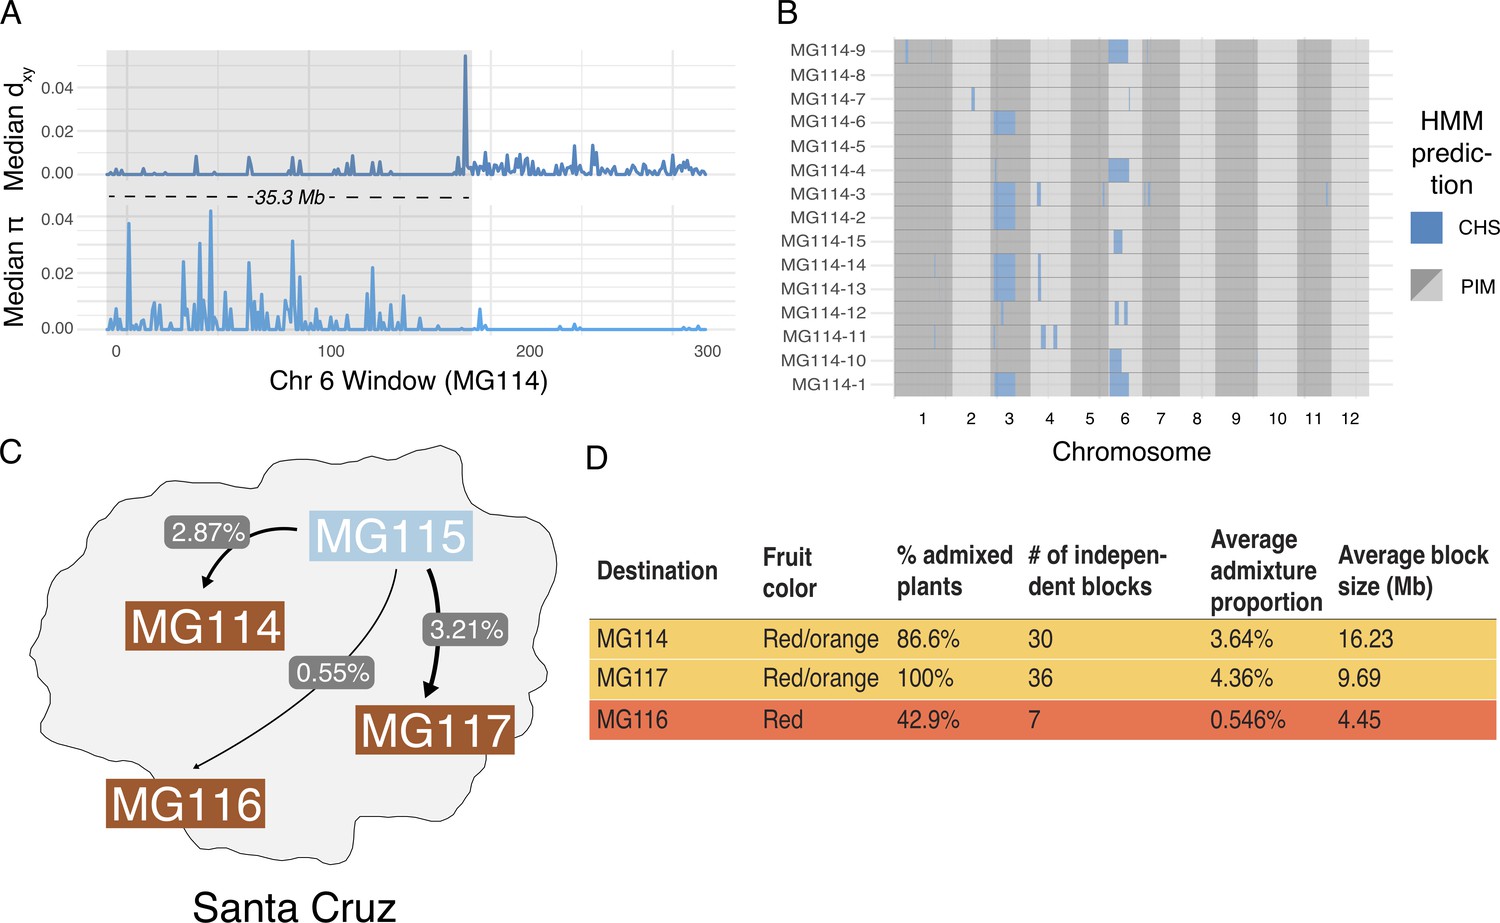
Local ancestry assignment using hidden Markov model (HMM) characterizes a history of endemic × invasive introgression.
(A) Patterns of diversity and divergence along chromosome 6 for an MG114 individual. The region of recent coalescence (low divergence; high diversity) with CHS is annotated in gray. This 20.2 kb block segregates at 20% in MG114. (B) Genome-wide HMM predictions for all individuals in MG114. The x-axis is ordered by chromosome and y-axis is ordered by individual. Two large CHS haplotypes segregate at high frequency on chromosomes 3 (40%) and 6 (20%). (C) Visual summary of admixture proportions from CHS into three PIM populations. (D) Summary of HMM assignment for each PIM population. Populations displaying variation in fruit color (MG114 and MG117) have more CHS ancestry than those which are fixed for the ancestral red state (MG116).
Figure 4—figure supplement 1
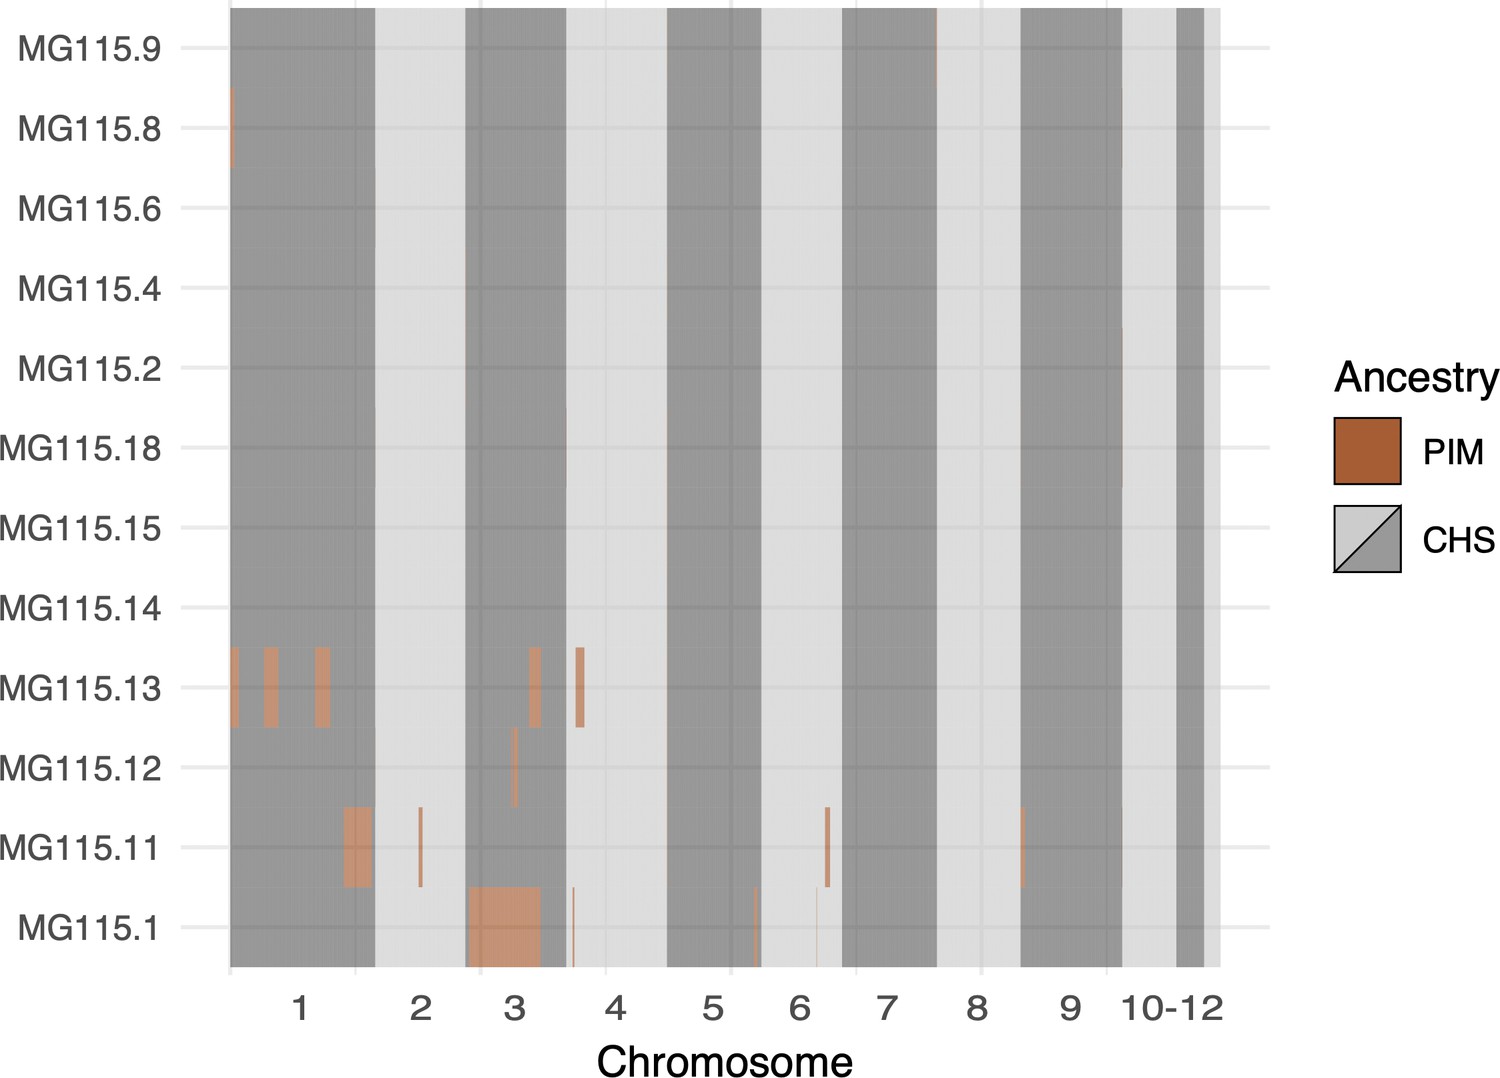
Local ancestry assignment throughout the genomes of CHS plants from population MG115 (Santa Cruz), using MG114 as the PIM reference population.
These data represent the opposite direction of gene flow (PIM → CHS) from that shown in Figure 5B (CHS → PIM). Admixture in the PIM → CHS direction was markedly lower than CHS → PIM.
Figure 4—figure supplement 2
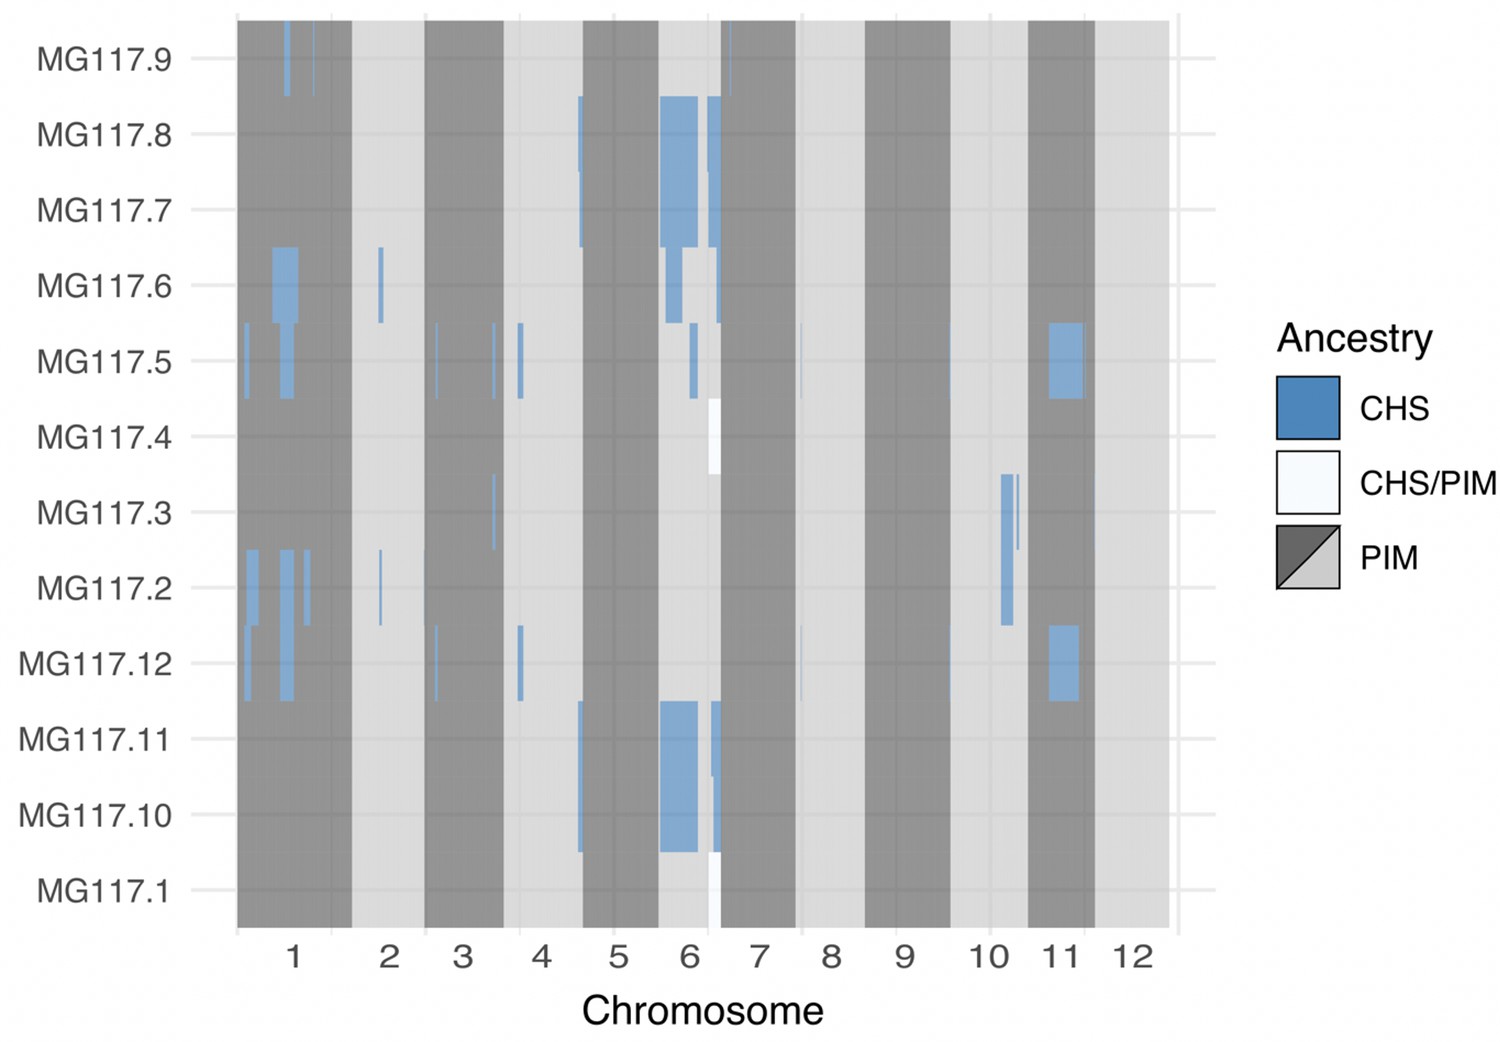
Genome-wide local ancestry in population MG117 as inferred by the hidden Markov model (HMM).
Figure 4—figure supplement 3
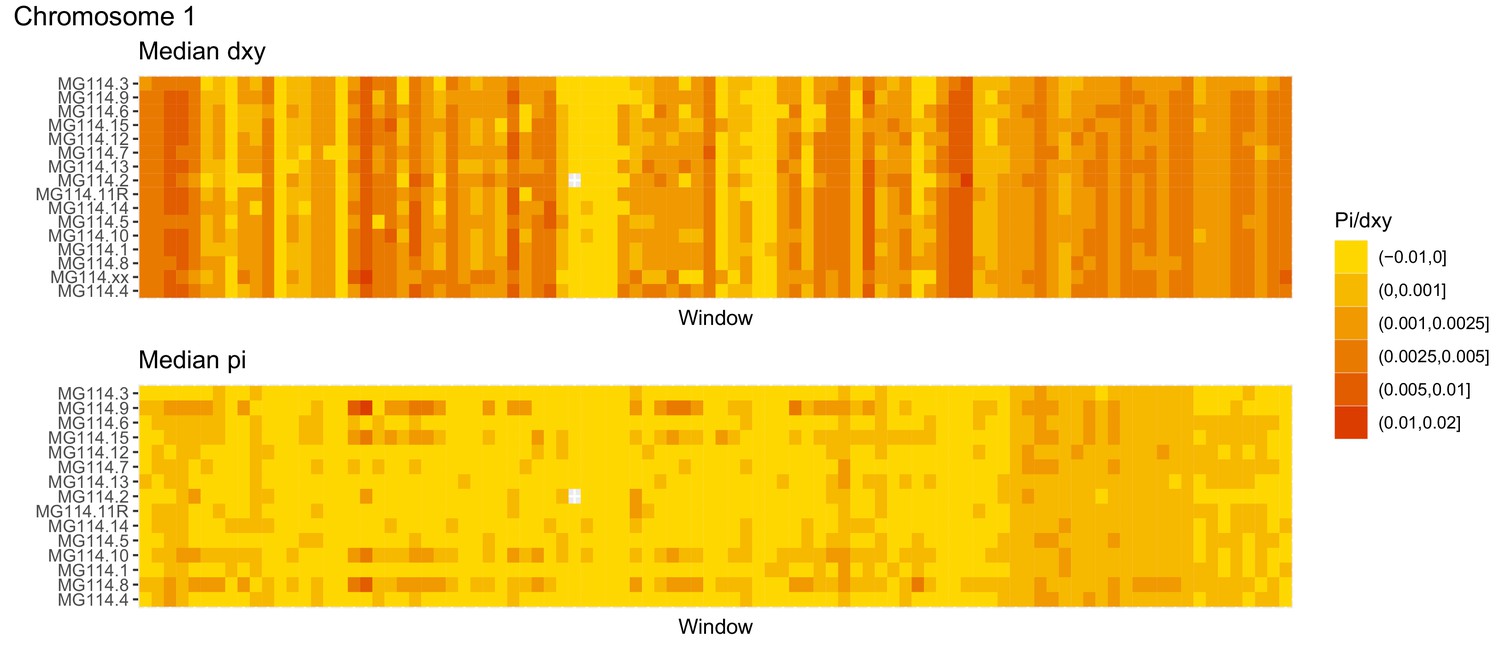
Diversity and divergence across the genomes of MG114 individuals (Chromosome 1).
Each cell represents 1 Mb and colors correspond to median π or dXY (to CHS population MG115). Black dots show regions of CHS ancestry predicted by the hidden Markov model (HMM). HMM predictions were done in 100 kb windows. Annotations here reflect the consensus prediction of all windows within each 1 Mb cell.
Figure 4—figure supplement 4
Diversity and divergence across the genomes of MG114 individuals (Chromosome 2).
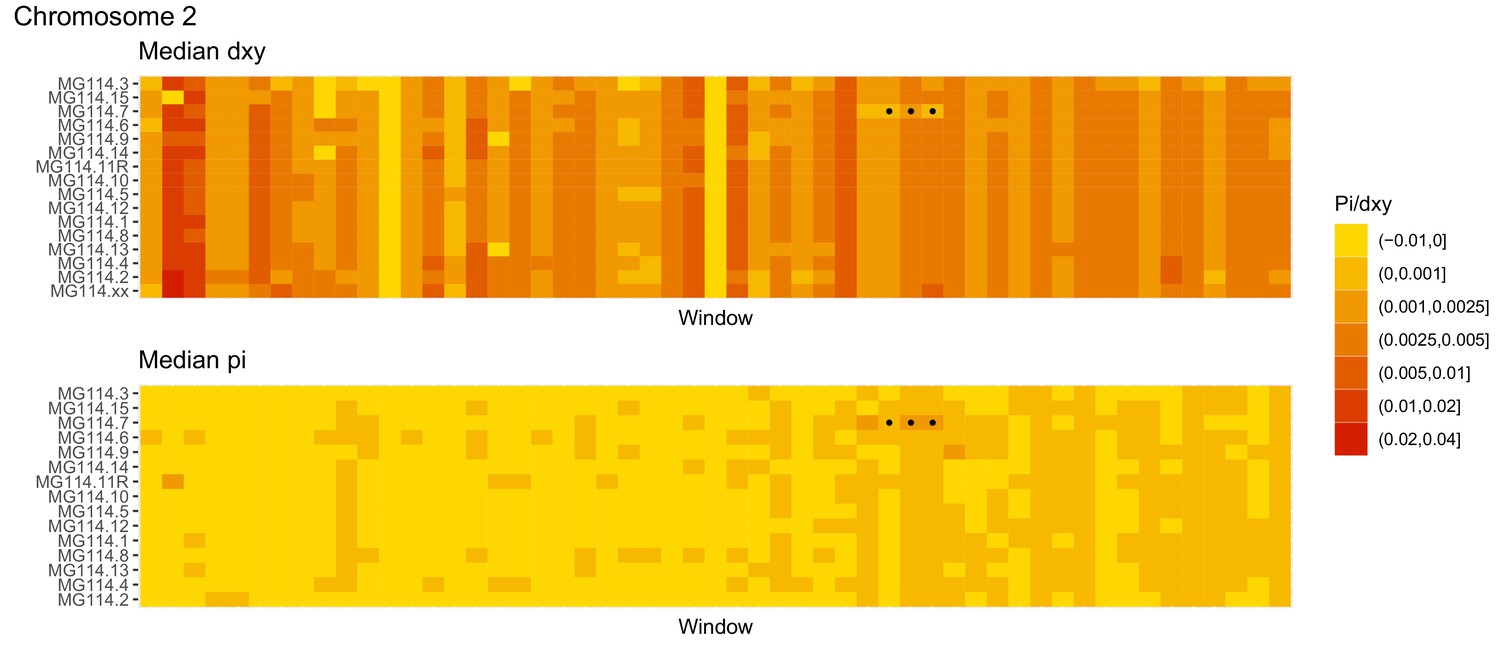
Each cell represents 1 Mb and colors correspond to median π or dXY (to CHS population MG115). Black dots show regions of CHS ancestry predicted by the hidden Markov model (HMM). HMM predictions were done in 100 kb windows. Annotations here reflect the consensus prediction of all windows within each 1 Mb cell.
Figure 4—figure supplement 5
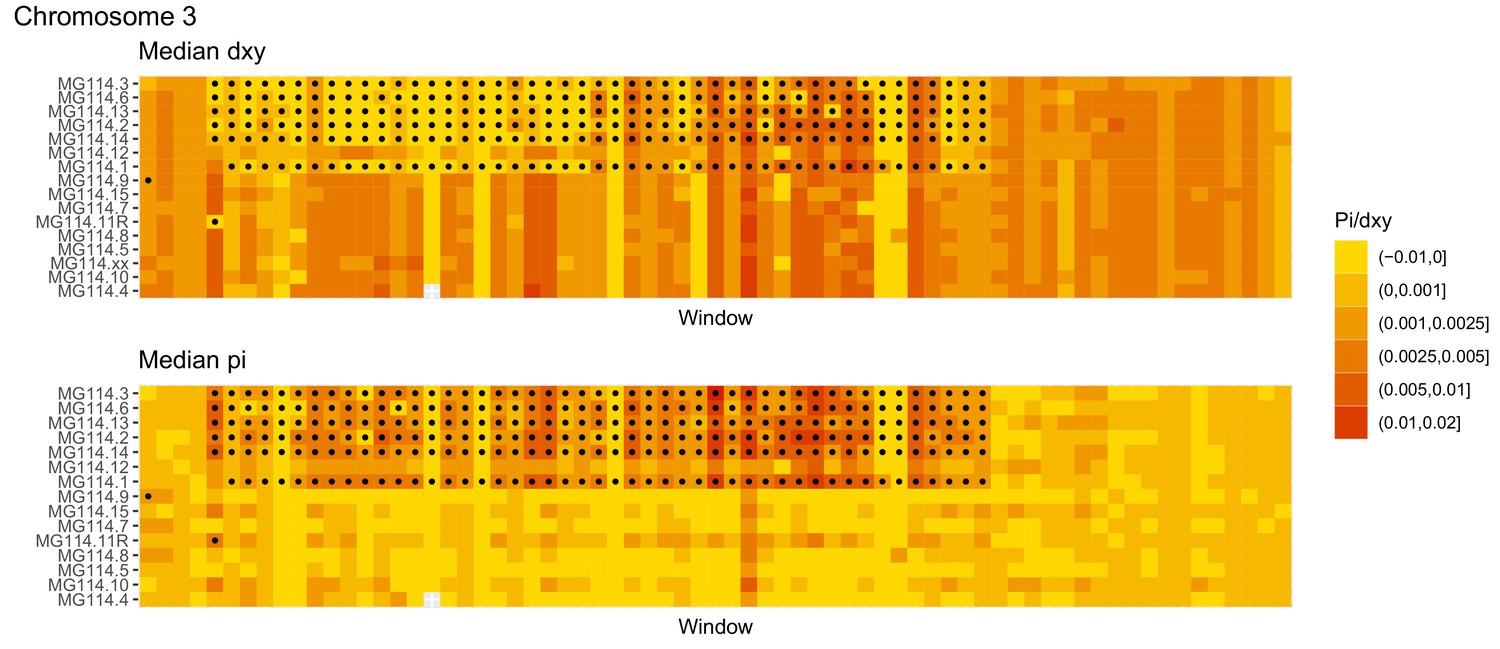
Diversity and divergence across the genomes of MG114 individuals (Chromosome 3).
Each cell represents 1 Mb and colors correspond to median π or dXY (to CHS population MG115). Black dots show regions of CHS ancestry predicted by the hidden Markov model (HMM). HMM predictions were done in 100 kb windows. Annotations here reflect the consensus prediction of all windows within each 1 Mb cell.
Figure 4—figure supplement 6
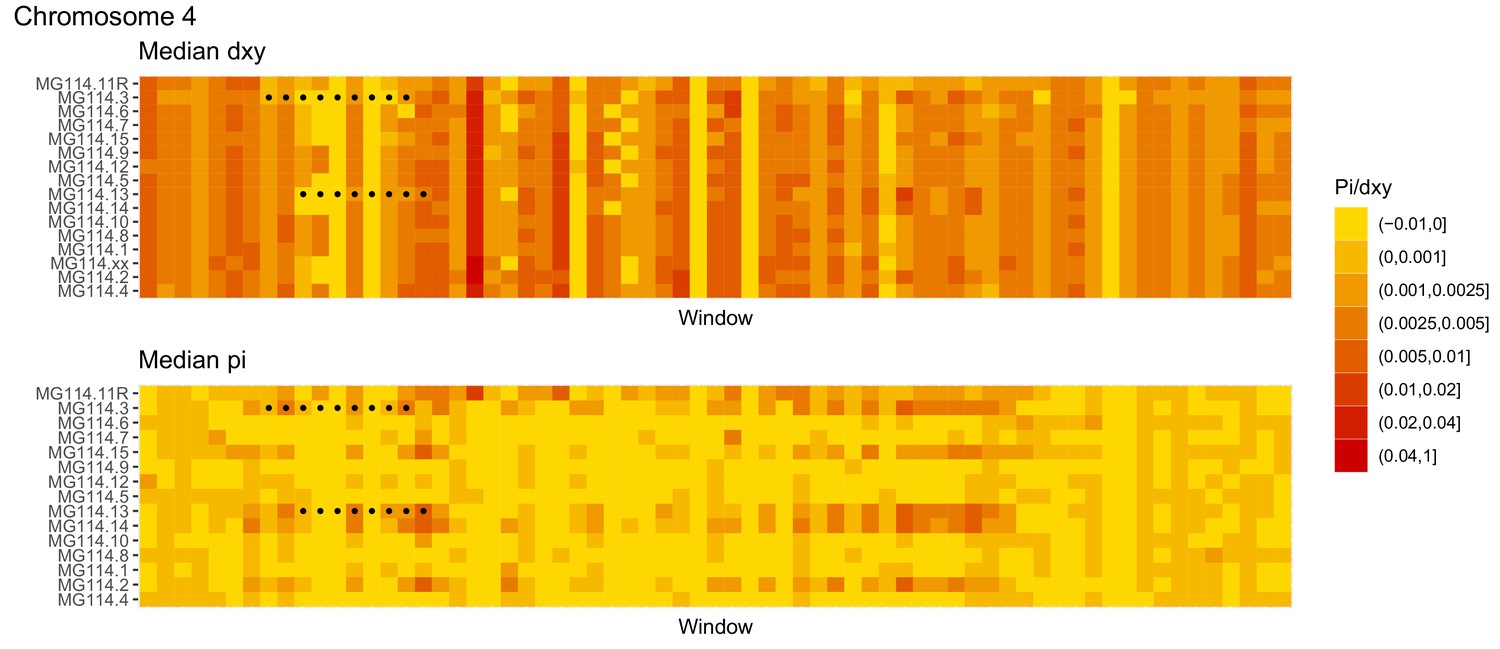
Diversity and divergence across the genomes of MG114 individuals (Chromosome 4).
Each cell represents 1 Mb and colors correspond to median π or dXY (to CHS population MG115). Black dots show regions of CHS ancestry predicted by the hidden Markov model (HMM). HMM predictions were done in 100 kb windows. Annotations here reflect the consensus prediction of all windows within each 1 Mb cell.
Figure 4—figure supplement 7
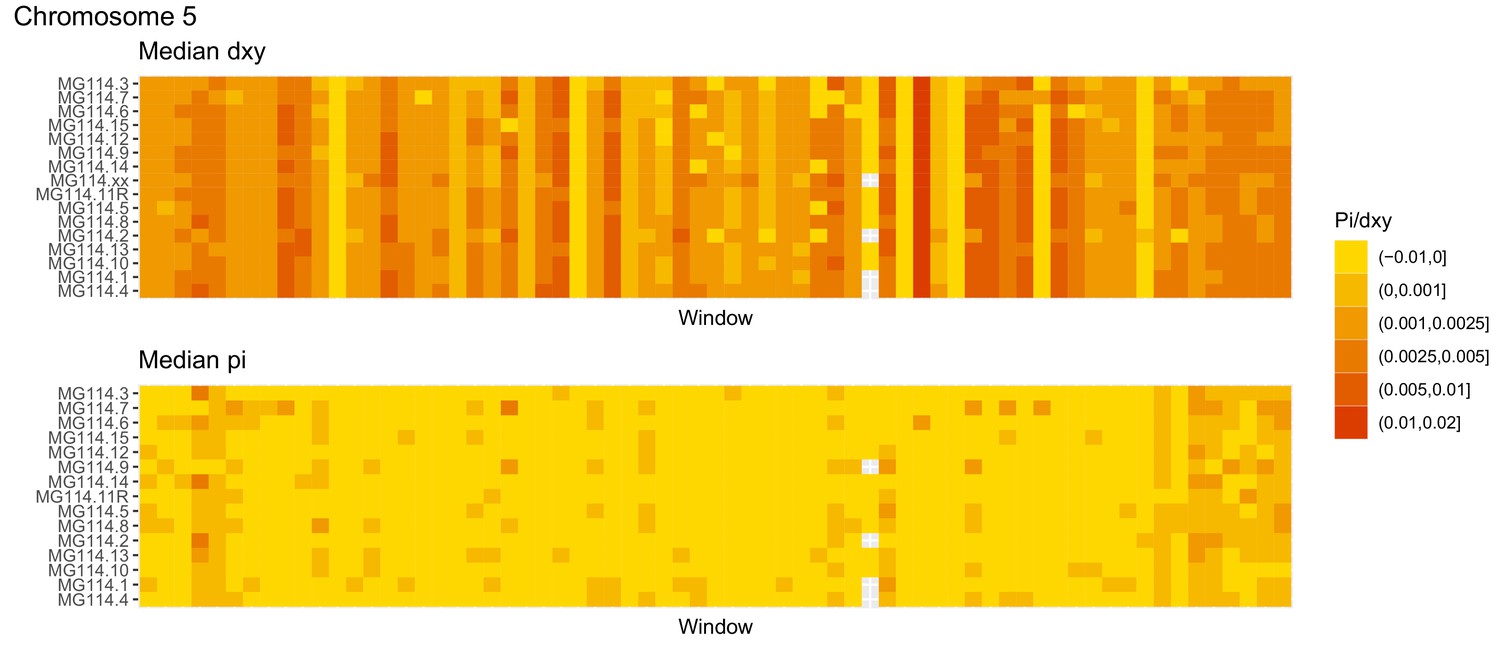
Diversity and divergence across the genomes of MG114 individuals (Chromosome 5).
Each cell represents 1 Mb and colors correspond to median π or dXY (to CHS population MG115). Black dots show regions of CHS ancestry predicted by the hidden Markov model (HMM). HMM predictions were done in 100 kb windows. Annotations here reflect the consensus prediction of all windows within each 1 Mb cell.
Figure 4—figure supplement 8
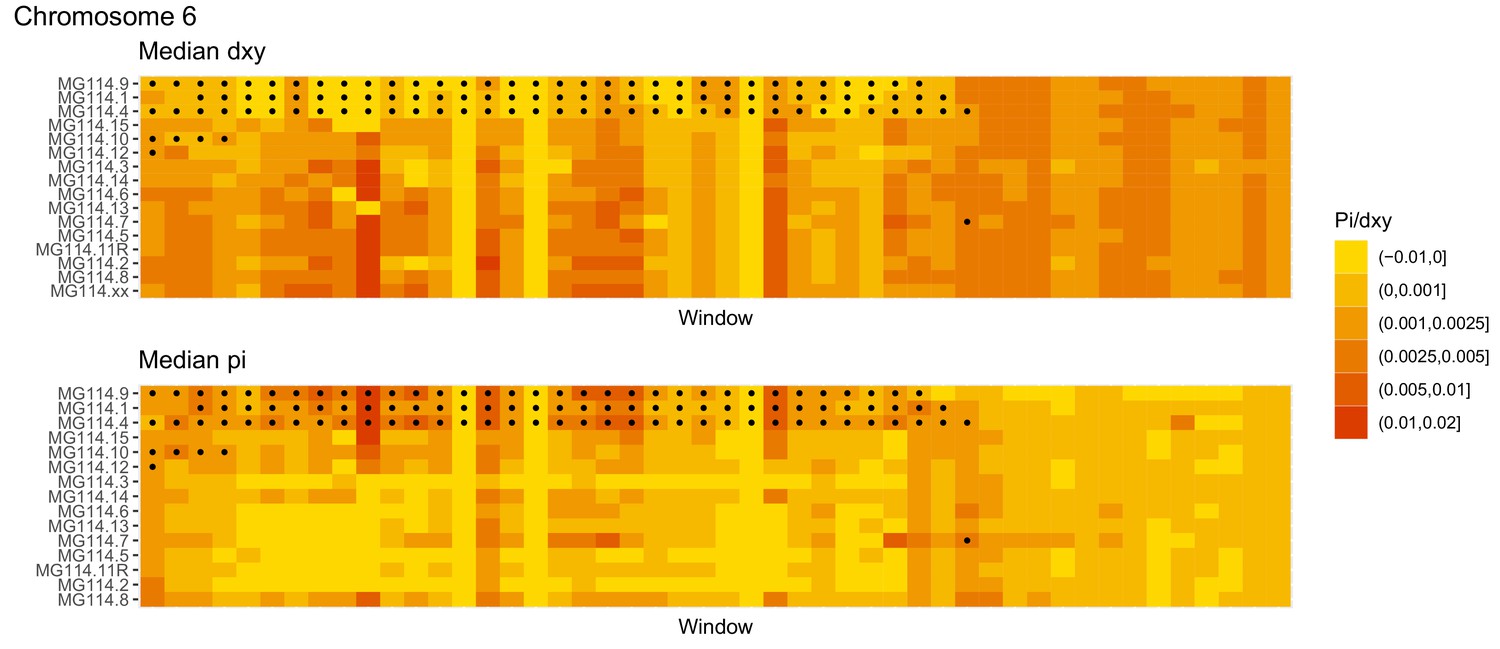
Diversity and divergence across the genomes of MG114 individuals (Chromosome 6).
Each cell represents 1 Mb and colors correspond to median π or dXY (to CHS population MG115). Black dots show regions of CHS ancestry predicted by the hidden Markov model (HMM). HMM predictions were done in 100 kb windows. Annotations here reflect the consensus prediction of all windows within each 1 Mb cell.
Figure 4—figure supplement 9
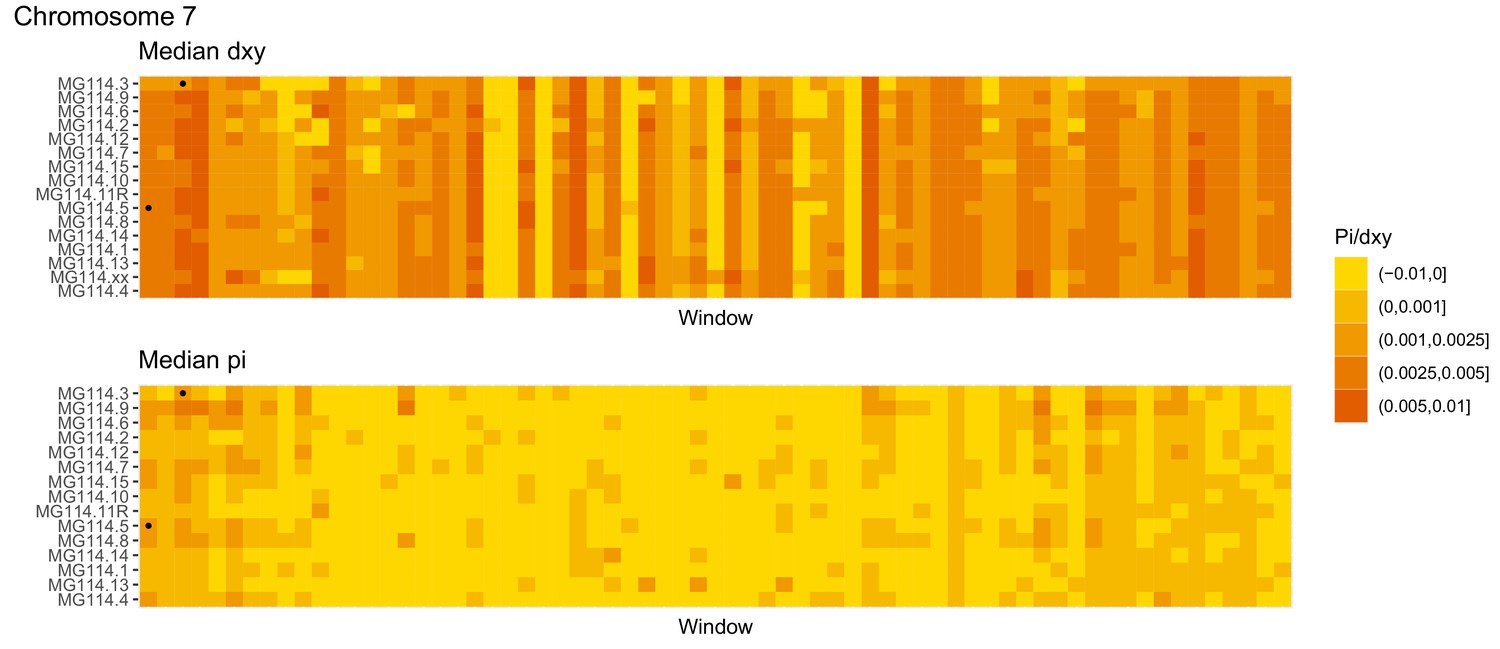
Diversity and divergence across the genomes of MG114 individuals (Chromosome 7).
Each cell represents 1 Mb and colors correspond to median π or dXY (to CHS population MG115). Black dots show regions of CHS ancestry predicted by the hidden Markov model (HMM). HMM predictions were done in 100 kb windows. Annotations here reflect the consensus prediction of all windows within each 1 Mb cell.
Figure 4—figure supplement 10
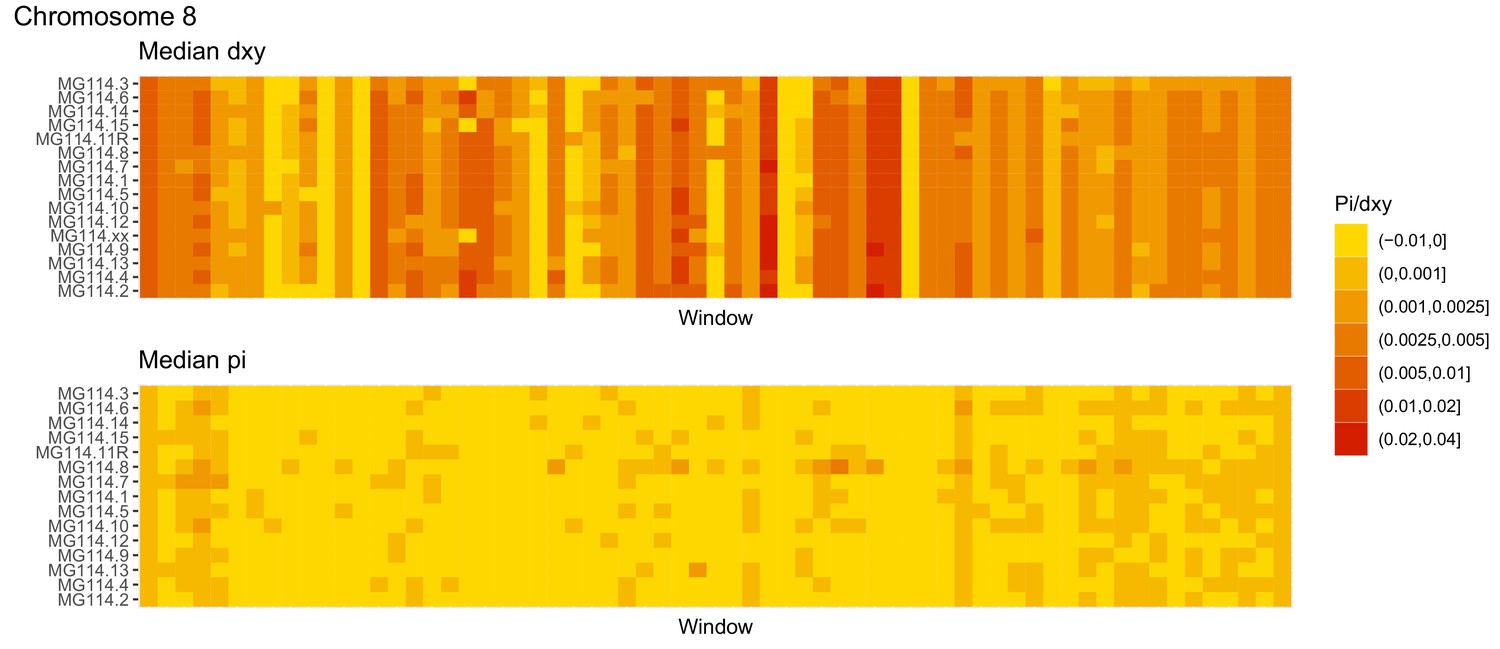
Diversity and divergence across the genomes of MG114 individuals (Chromosome 8).
Each cell represents 1 Mb and colors correspond to median π or dXY (to CHS population MG115). Black dots show regions of CHS ancestry predicted by the hidden Markov model (HMM). HMM predictions were done in 100 kb windows. Annotations here reflect the consensus prediction of all windows within each 1 Mb cell.
Figure 4—figure supplement 11
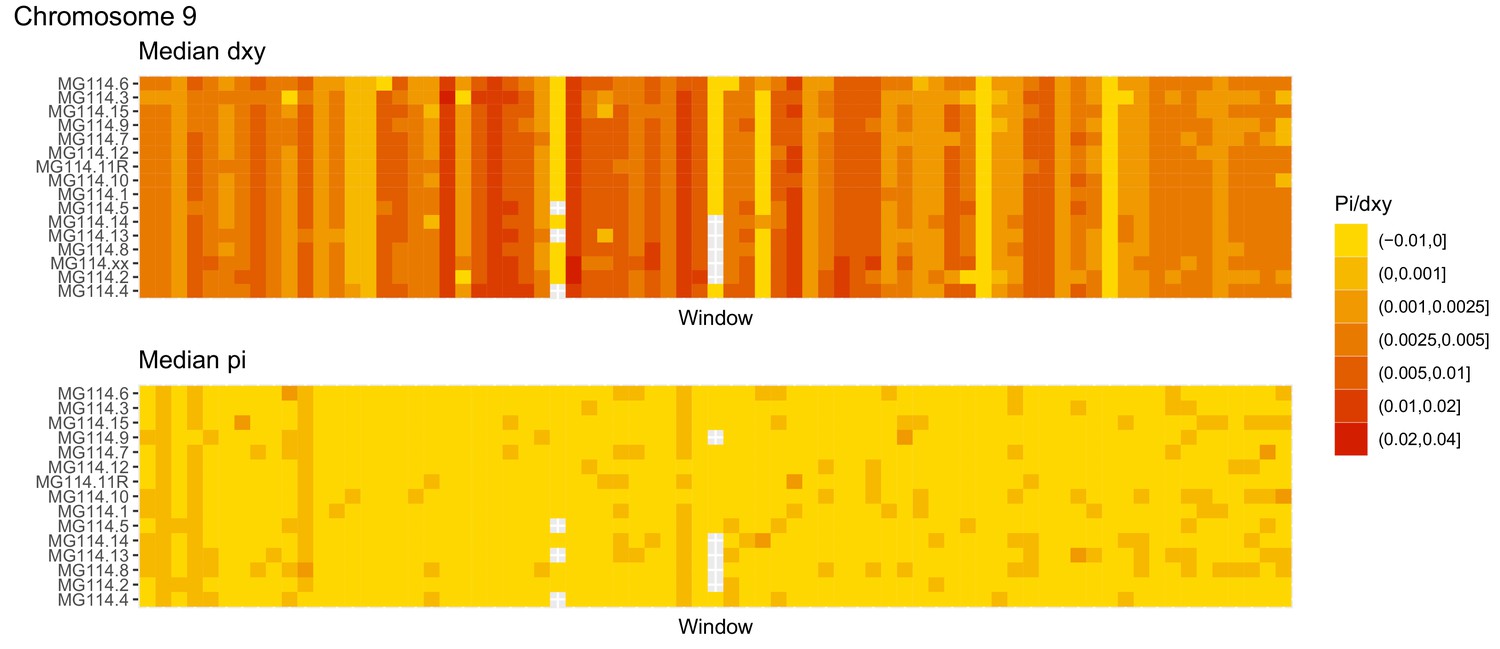
Diversity and divergence across the genomes of MG114 individuals (Chromosome 9).
Each cell represents 1 Mb and colors correspond to median π or dXY (to CHS population MG115). Black dots show regions of CHS ancestry predicted by the hidden Markov model (HMM). HMM predictions were done in 100 kb windows. Annotations here reflect the consensus prediction of all windows within each 1 Mb cell.
Figure 4—figure supplement 12
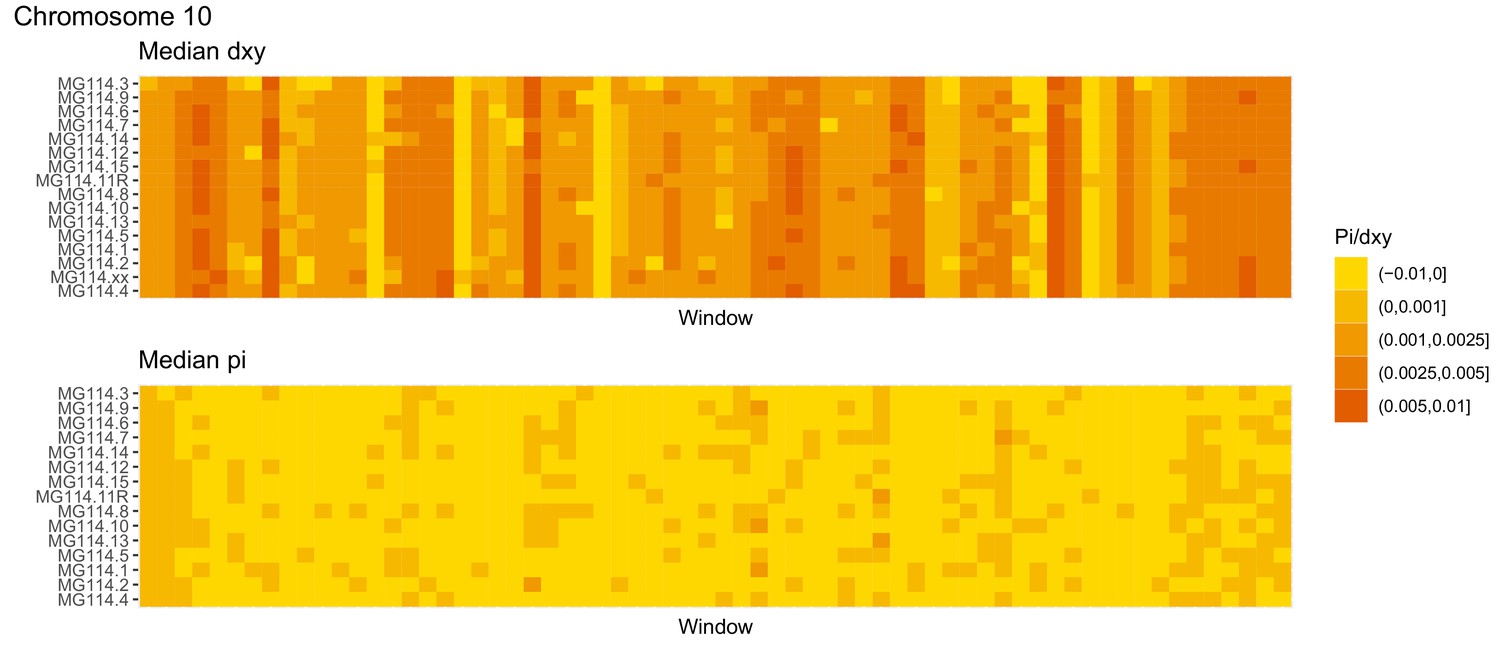
Diversity and divergence across the genomes of MG114 individuals (Chromosome 10).
Each cell represents 1 Mb and colors correspond to median π or dXY (to CHS population MG115). Black dots show regions of CHS ancestry predicted by the hidden Markov model (HMM). HMM predictions were done in 100 kb windows. Annotations here reflect the consensus prediction of all windows within each 1 Mb cell.
Figure 4—figure supplement 13
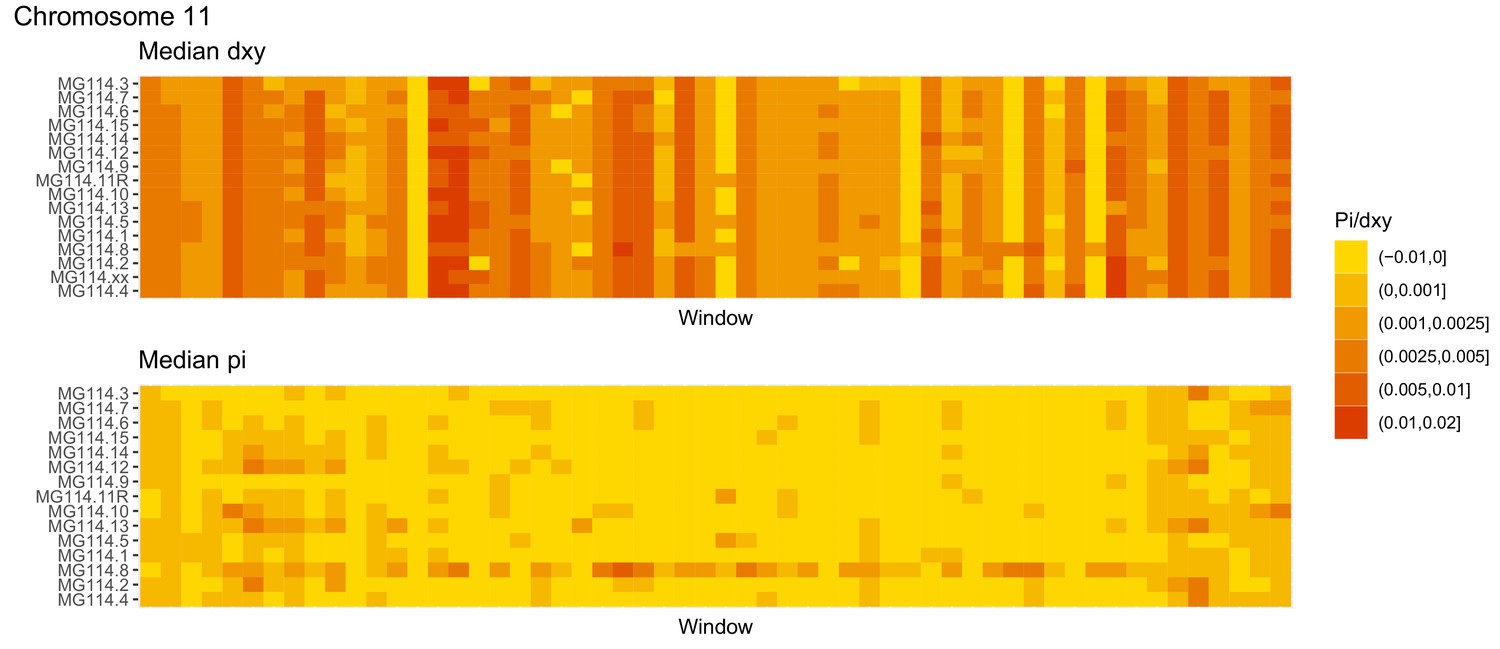
Diversity and divergence across the genomes of MG114 individuals (Chromosome 11).
Each cell represents 1 Mb and colors correspond to median π or dXY (to CHS population MG115). Black dots show regions of CHS ancestry predicted by the hidden Markov model (HMM). HMM predictions were done in 100 kb windows. Annotations here reflect the consensus prediction of all windows within each 1 Mb cell.
Figure 4—figure supplement 14
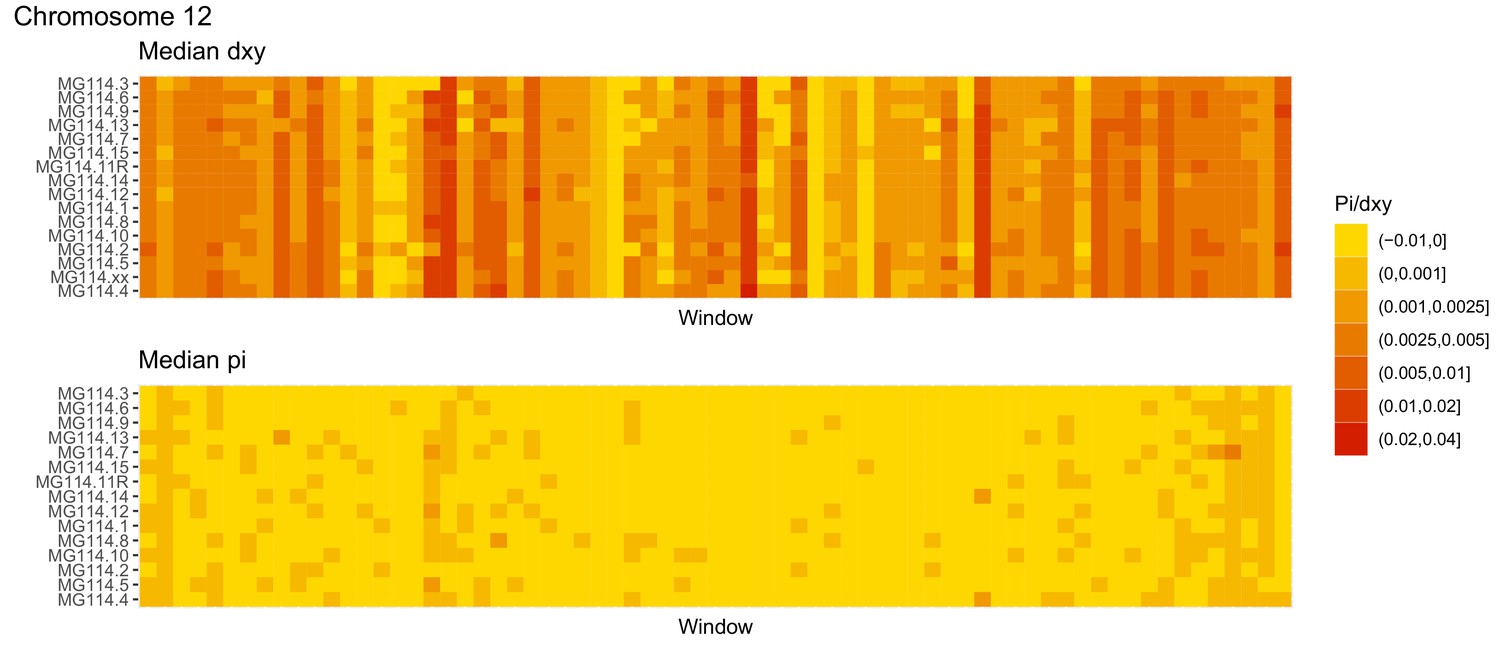
Diversity and divergence across the genomes of MG114 individuals (Chromosome 12).
Each cell represents 1 Mb and colors correspond to median π or dXY (to CHS population MG115). Black dots show regions of CHS ancestry predicted by the hidden Markov model (HMM). HMM predictions were done in 100 kb windows. Annotations here reflect the consensus prediction of all windows within each 1 Mb cell.
Figure 5 with 3 supplements

Patterns of local ancestry across focal chromosome regions of MG114 and MG117, enlarged to show variation in introgression block break points at color pathway genes.
(A) CHS ancestry at carotenoid biosynthesis gene PSY1 on chromosome 3 correlates with observed fruit color variation in MG114. (B) CHS ancestry at carotenoid biosynthesis gene CYC-B on chromosome 6 correlates with fruit color variation in MG117. Each cell represents 100 kb. Empty cells indicate windows with no sequence data. Empty cells are ghost shaded with each ancestry color based on neighboring assignments.
Figure 5—figure supplement 1
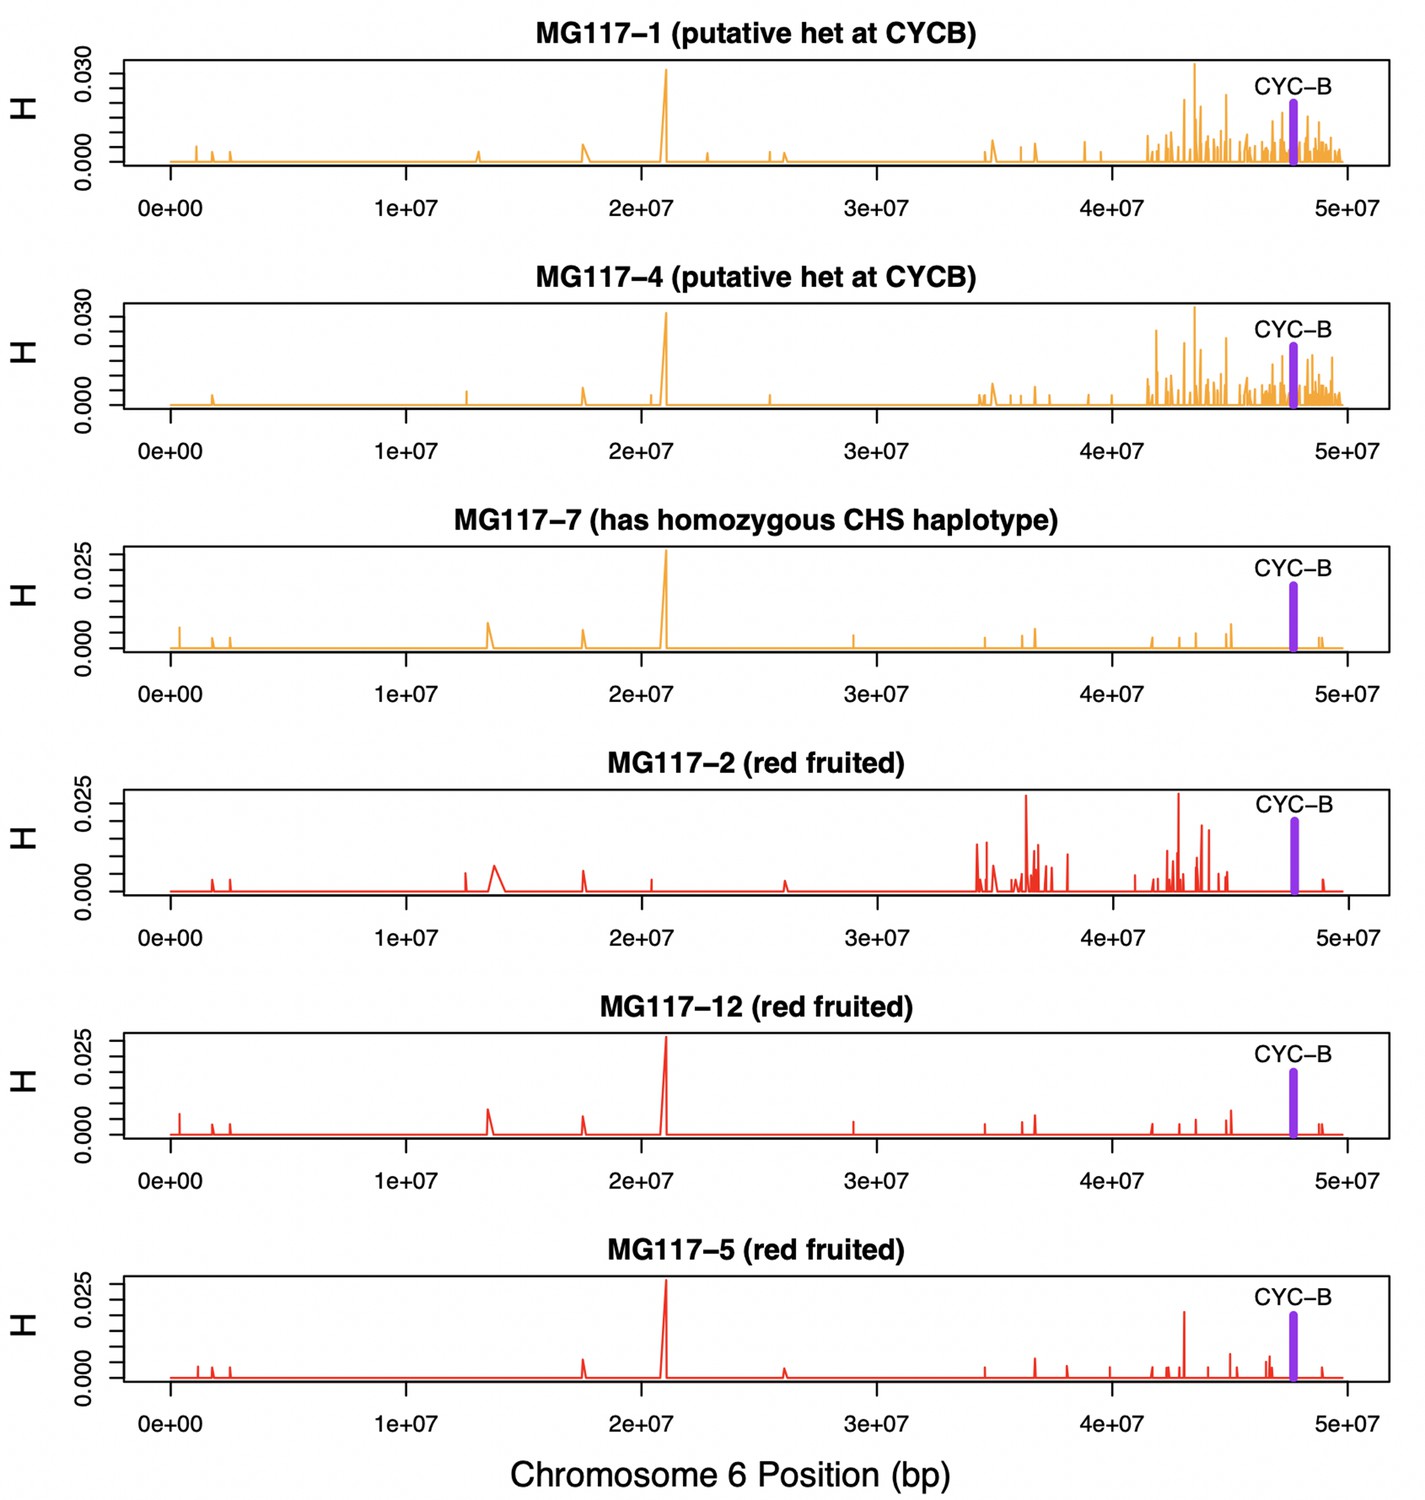
Heterozygosity along chromosome 6 of population MG117.
CHS ancestry at CYC-B (dashed line) in MG117-1 and MG117-4 is heterozygous, as shown by elevated heterozygosity estimates at that location in these individuals.
Figure 5—figure supplement 2
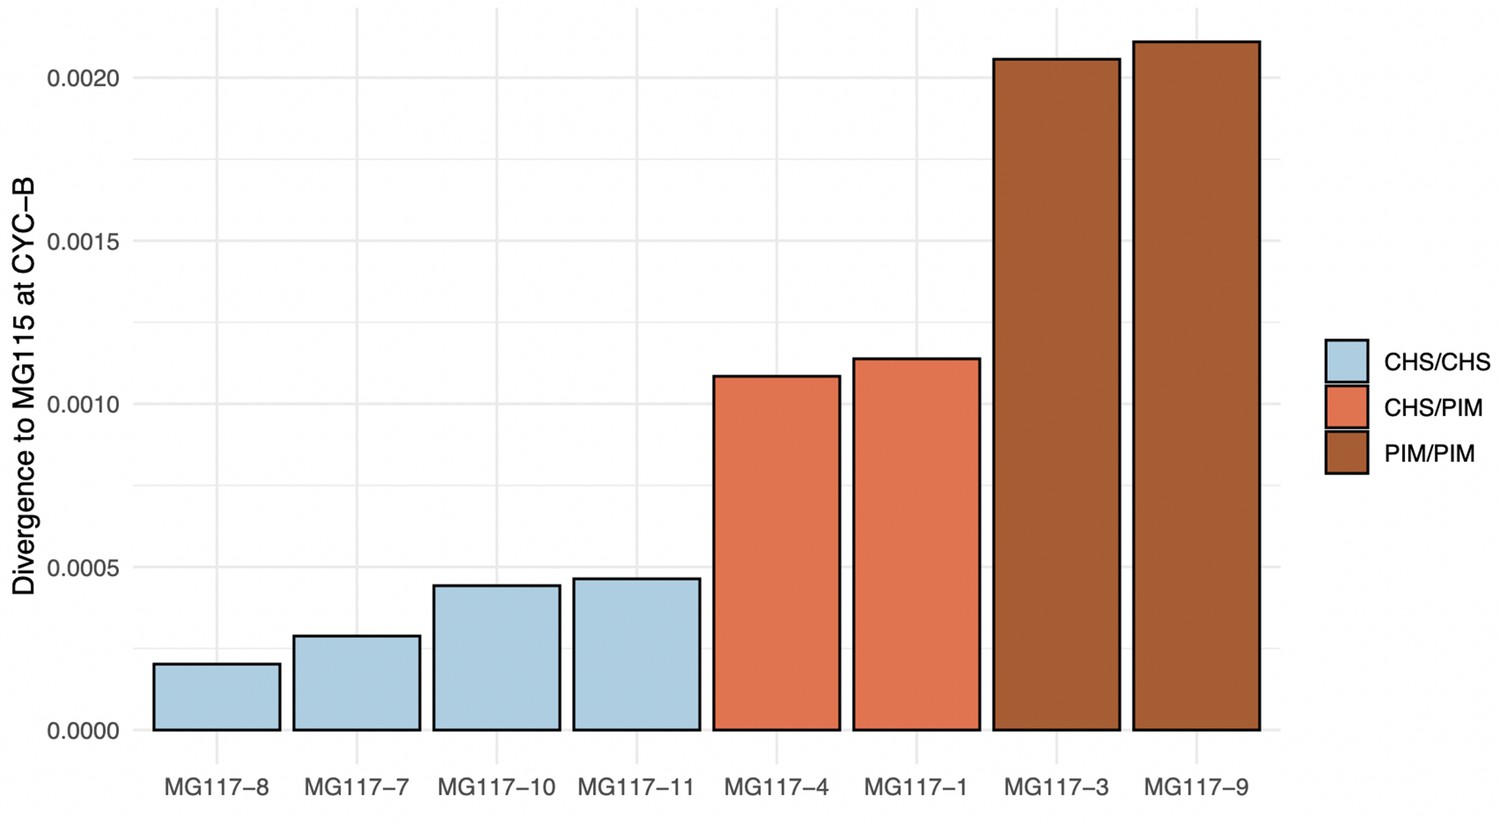
Median divergence estimates between MG117 individuals and MG115 at CYC-B.
The hidden Markov model (HMM) correctly classifies intermediately diverged regions as heterozygous.
Figure 5—figure supplement 3
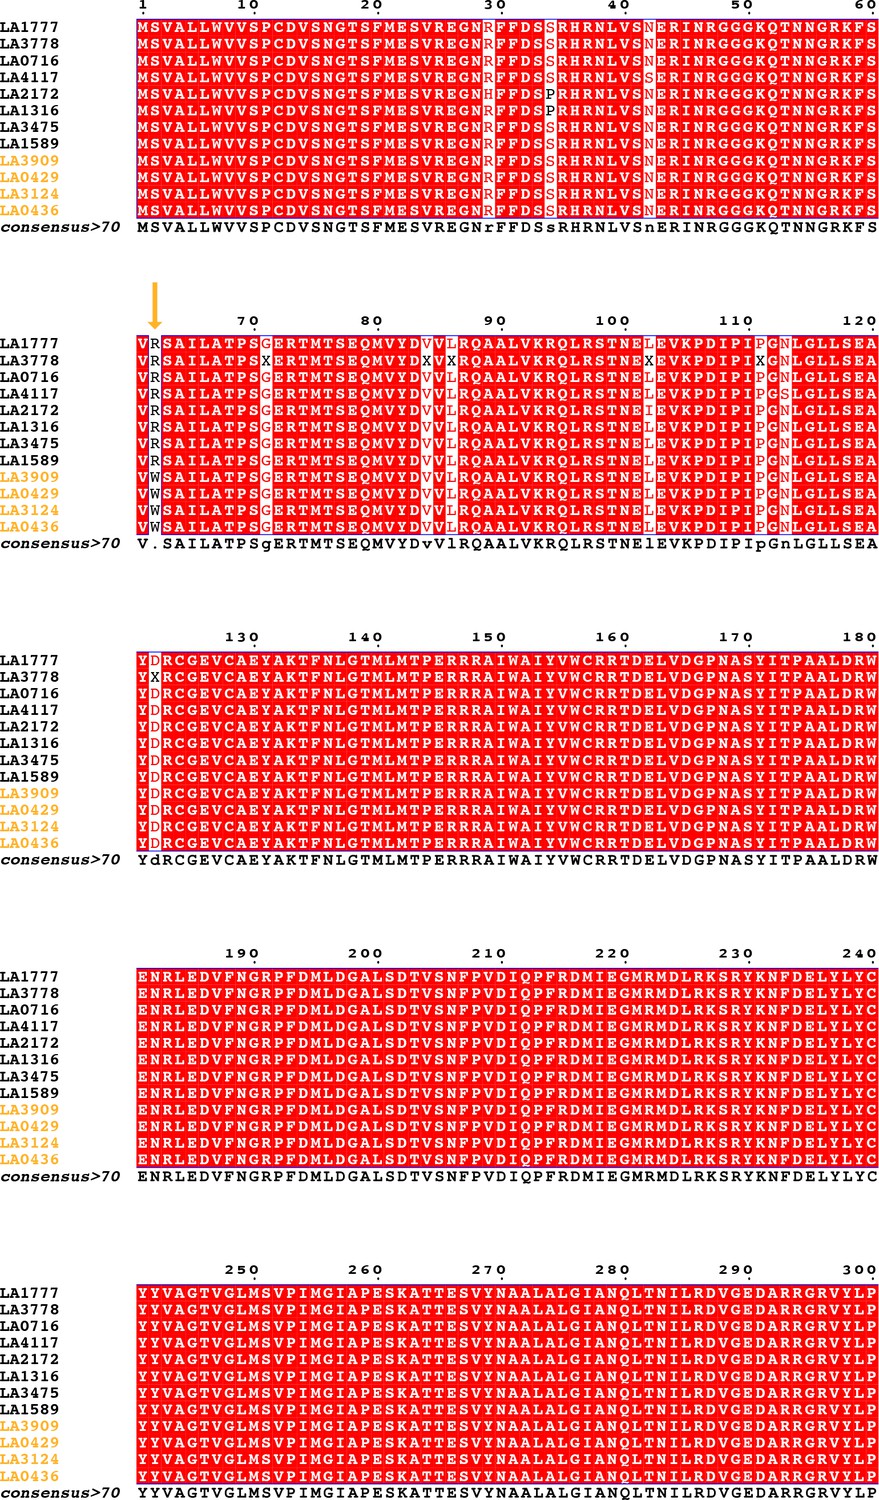
Coding sequence alignment of PSY1 for nine wild tomato species (12 accessions).
Endemic accessions are colored orange. The nonsynonymous substitution which defines the endemic clade is indicated with an orange arrow. Data were obtained from Pease et al., 2016.
Appendix 1—figure 1

Sequencing depth (average number of reads per individual) across loci.
Panel (A) histogram of depth values. Panel (B) relationship between sequencing depth and observed heterozygosity.
Appendix 1—figure 2
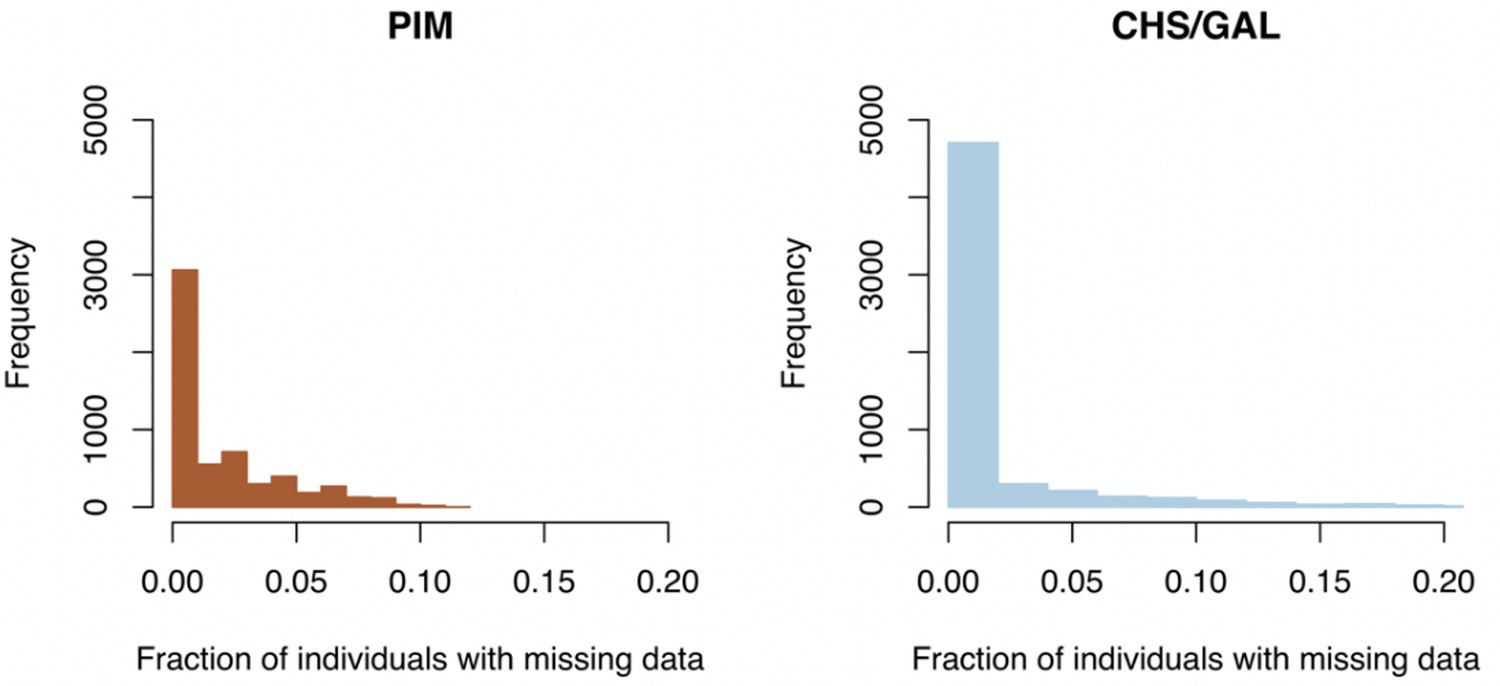
Clade-specific distributions of missing data fractions across loci.
Left panel: histogram of missing data fractions for all PIM populations. Right panel: histogram of missing data fractions for all endemic (CHS/GAL) populations.
Appendix 1—figure 3
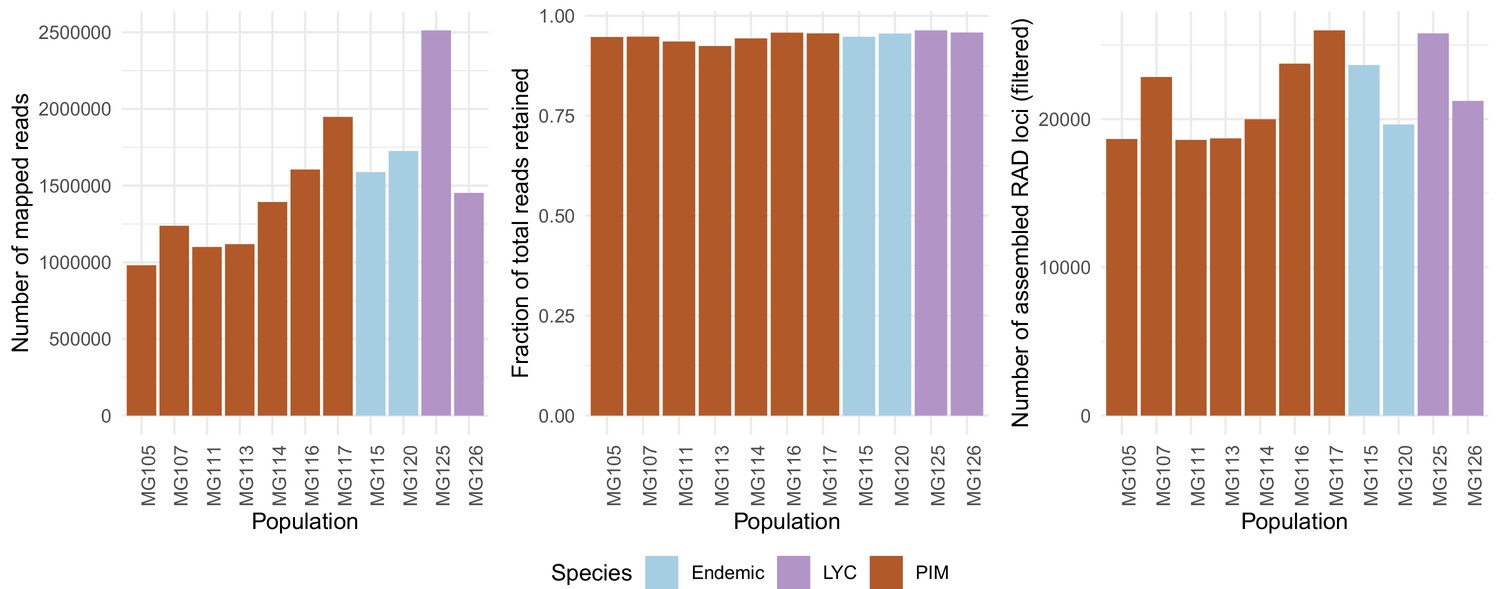
Population-specific estimates of the total number of assembled RAD loci (left panel), fractions of total reads retained after assembly (center panel), and total number of reads mapped with BWA (right panel).
The total number of mapped reads was on average lower in PIM, yet the average fractions of mapped reads assembled into loci (or ‘stacks’) and the total number of final RAD loci were roughly equal across populations and species. The differences in numbers of mapped reads point to substantial variation in total sequencing output rather than an inability to map in PIM.
Tables
Table 1
Diversity statistics for focal population samples (S = number of segregating sites; θW = Watterson’s theta; H = observed heterozygosity; π = genome-wide nucleotide diversity).
| Taxa | Population | Island | Endemic | S | θW | H | π |
|---|---|---|---|---|---|---|---|
| PIM | Peru | N | N | 32820 | 6302.96 | 0.00025 | 0.00094 |
| Ecuador | N | N | 21773 | 5544.20 | 0.00033 | 0.00130 | |
| MG105 | Y | N | 1520 | 586.23 | 0.00011 | 0.00009 | |
| MG107 | Y | N | 4434 | 1567.36 | 0.0002 | 0.00034 | |
| MG111 | Y | N | 2562 | 787.93 | 0.00012 | 0.00010 | |
| MG113 | Y | N | 3763 | 1330.17 | 0.00015 | 0.00029 | |
| MG114 | Y | N | 4730 | 1454.69 | 0.00016 | 0.00023 | |
| MG116 | Y | N | 4929 | 1632.189 | 0.00024 | 0.00024 | |
| MG117 | Y | N | 4776 | 1581.52 | 0.00016 | 0.00028 | |
| CHS | MG115 | Y | Y | 8540 | 2407.17 | 0.00023 | 0.00045 |
| MG120C | Y | Y | 854 | 314.22 | 0.0001 | 0.00008 | |
| GAL | MG120G | Y | Y | 3282 | 1032.03 | 0.00013 | 0.00014 |
| GAL×CHS | MG120GC | Y | Y | 2857 | 1166.12 | 0.00023 | 0.00026 |
| LYC | MG125 | Y | N | 7219 | 2551.81 | 0.00035 | 0.00063 |
| MG126 | Y | N | 4567 | 2192.16 | 0.00018 | 0.00052 |
Table 2
Demographic model estimates for PIM population MG114 inferred using BFGS optimization in δaδi.
95% CI values were obtained from 1000 bootstrap replicates of the site frequency spectrum (SFS). Each estimate is shown in rescaled units (rescaled by NRef for NB and NF; and by 2NRef for TB and TF).
| Parameter | Optimum | Bootstrap median | 95% CI |
|---|---|---|---|
| NB | 408.32 | 551.52 | 56.32–9325.16 |
| NF | 4041.63 | 2044.06 | 442.09–26614.5 |
| TB | 96.52 | 77.15 | 2.37–492.68 |
| TF | 105.14 | 123.02 | 29.95–401.15 |
| F | 0.23 | 0.17 | 0.01–0.41 |
Additional files
-
Supplementary file 1
Supplementary tables.
(a) Full list of population collection sites and their geographic coordinates. (b) List of mainland collection sites. (c) Stacks ref_map assembly summary. (d) Stacks per-sample assembly summary. (e) Summary of sequence and genotype filters. (f) Mean Fst between focal island populations and mainland groups. (g) Demographic model estimates for PIM population MG115. Values inferred using δaδi. 95% CI values were obtained from 1000 bootstrap replicates of the site frequency spectrum (SFS). Each estimate is shown in rescaled units (rescaled by NRef for NB and NF; and by 2NRef for TB and TF). (h) Full likelihoods for NewHybrids classifications of CHS×PIM admixture on Santa Cruz. MCMC was run for 6000 steps. The most likely classification for each individual is shown in bold. (i) Full likelihoods for NewHybrids classifications of CHS×GAL admixture on Isabela. MCMC was run for 6000 steps. The most likely classification for each individual is shown in bold. (j) NewHybrids MCMC summary. Only the most likely genotype category classifications are shown. Refer to (e) for alternative class probabilities. (k) Likelihoods for different Treemix runs. (l) Summary of inferred introgression blocks for population MG114 (polymorphic). Shaded groups indicate blocks that are likely the same age/the result of the same hybridization event based on break points. (m) Summary of inferred introgression blocks for population MG117 (polymorphic). Shaded groups indicate blocks that are likely the same age/the result of the same hybridization event based on break points. (n) Summary of inferred introgression blocks for population MG116 (fixed, red fruited). (o) Population MG117 ancestry at carotenoid biosynthesis loci, as inferred by the hidden Markov model (HMM). The genomic location of each locus was determined based on the Solanum lycopersicum reference build SL3.0 and ITAG3.0 annotation. The association between ancestry and fruit color at CYC-B is significant based on a χ2 test of independence (χ2 = 8.333; df = 1; p=0.00389). The association at LCY-B is not statistically significant (χ2 = 0.6; df = 1; p=0.4386). (p) Population MG114 ancestry at carotenoid biosynthesis loci, as inferred by the HMM. The genomic location of each locus was determined based on the S. lycopersicum reference build SL3.0 and ITAG3.0 annotation. The association between ancestry and fruit color at PSY1 is significant based on a χ2 test of independence (χ2 = 11.123; df = 1; p=0.00085). The association at LCY-B is not statistically significant (χ2 = 2.934; df = 1; p=0.08673).
- https://cdn.elifesciences.org/articles/64165/elife-64165-supp1-v2.xlsx
-
Transparent reporting form
- https://cdn.elifesciences.org/articles/64165/elife-64165-transrepform-v2.pdf
Download links
A two-part list of links to download the article, or parts of the article, in various formats.
Downloads (link to download the article as PDF)
Open citations (links to open the citations from this article in various online reference manager services)
Cite this article (links to download the citations from this article in formats compatible with various reference manager tools)
Introgression shapes fruit color convergence in invasive Galápagos tomato
eLife 10:e64165.
https://doi.org/10.7554/eLife.64165


