scAAVengr, a transcriptome-based pipeline for quantitative ranking of engineered AAVs with single-cell resolution
- Department of Ophthalmology, University of Pittsburgh, United States
- Computational Biology, School of Computer Science, Carnegie Mellon University, United States
- Department of Neurobiology, University of Pittsburgh, United States
- Eye Center of Xiangya Hospital, Hunan Key Laboratory of Ophthalmology, Central South University, China
- Helen Wills Neuroscience Institute, University of California, Berkeley, United States
- Division of Experimental Retinal Therapies, Department of Clinical Sciences & Advanced Medicine, School of Veterinary Medicine, University of Pennsylvania, United States
- Chemical Engineering, University of California, Berkeley, United States
- Vision Science, Herbert Wertheim School of Optometry, University of California Berkeley, United States
- Department of Bioengineering, University of Pittsburgh, United States
Figures
Figure 1 with 4 supplements

scAAVengr pipeline.
(A) Overview of scAAVengr experimental workflow. An AAV library, consisting of variants packaged with a GFP transgene fused to unique barcodes (AAV-barcodes), was packaged, pooled, quantified by deep sequencing, and injected. Viruses are either noninfectious (1), bind or enter into cells but do not mediate gene expression (2), or traffic to the nucleus resulting in expression of tagged mRNA transcripts (3). Analysis took into account only viruses leading to transgene expression as in (3). Single cell suspensions of the tissue were then created, and a single cell microfluidics system was used to produce single-cell cDNA libraries. Cell types were identified by marker gene expression, and simultaneously, the ability of AAV variants to drive gene expression was evaluated based on quantification of AAV-barcodes in GFP transcripts. (B–E) GFP-Barcoded AAV library expression in marmosets and macaques. Intravitreal injection of GFP-barcoded libraries resulted in GFP expression in the retina 8 weeks after injection. (B) GFP expression in the perifoveal ring in marmoset retina. (C) Axons from retinal ganglion cells in same injected eye as (B). (D) GFP expression in the perifoveal ring in macaque retina. (E) Axons from retinal ganglion cells in same injected eye as (D). (F) Diagram of primate retinal flatmount. Retinal tissue was collected from macula, and superior and inferior peripheral retina. (G) Retinal tissue samples were dissociated into single cell suspensions which were counted using Trypan blue. Trypan blue exclusion is also a test for cell viability. Cell suspensions were then processed through a 10x Chromium scRNA-seq controller.
Figure 1—figure supplement 1
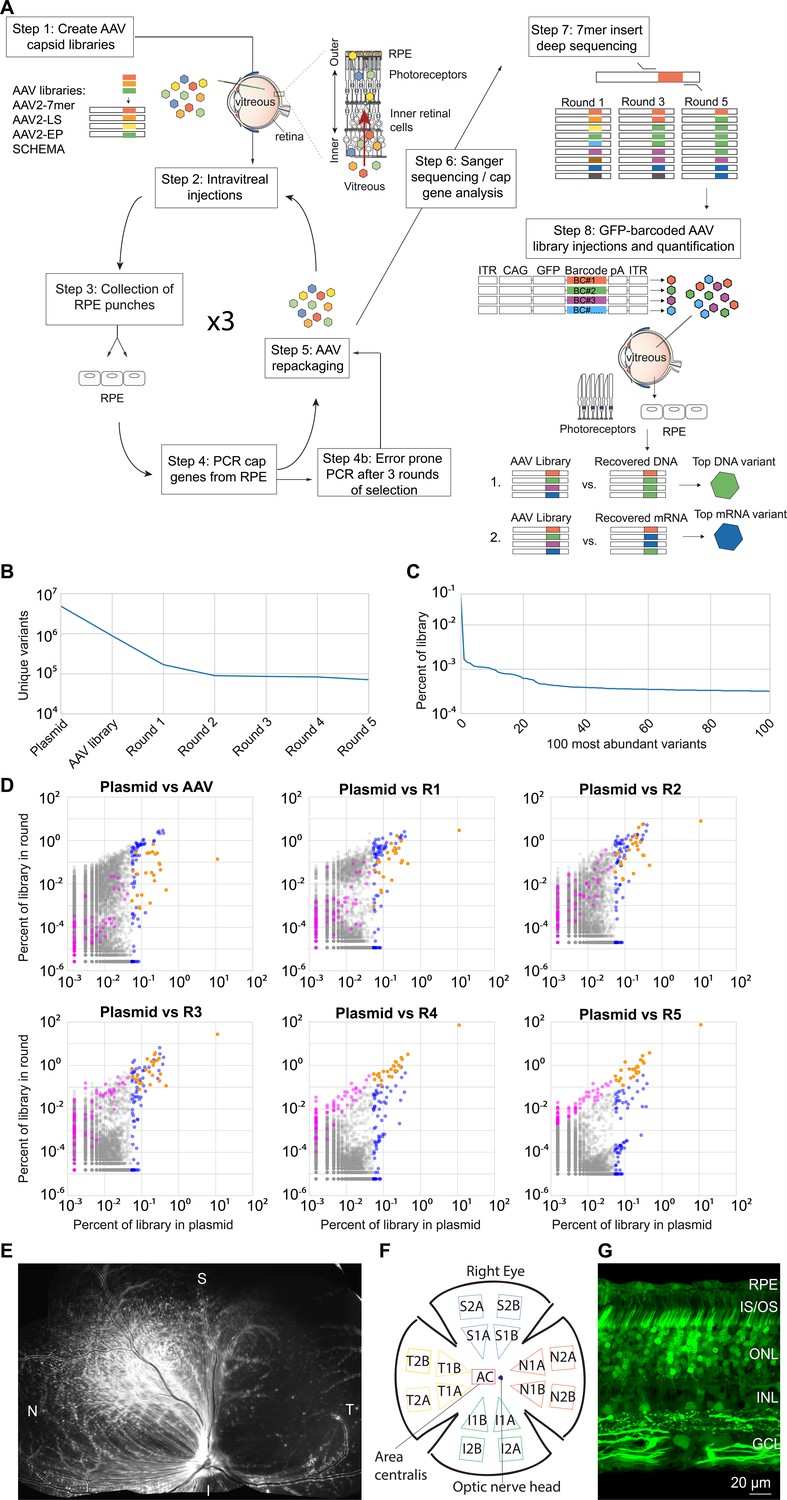
Directed evolution performed in dogs.
(A) Highly diverse (~1E + 7) libraries of AAV capsid variants were packaged such that each virus contained a genome encoding its own capsid. Libraries were pooled and injected intravitreally in canines. After AAV infection had occurred, RPE punches were collected, and cap gene variants were PCR amplified, recloned, and repackaged for the subsequent round of injection. Five rounds of selection were performed, and error prone PCR was performed after the third round to introduce additional diversity into the library. Following the selections, the AAV2-7mer library was found to give rise to the majority of resulting variants. Each round of selection from the AAV2-7mer was then subjected to deep sequencing in order to analyze the dynamics of each individual variant and overall convergence of the library. Based on their increase in representation relative to the original library, individual variant capsids were chosen and used to package a scCAG-eGFP genome also containing a unique DNA barcode sequence. These barcoded vectors were then pooled in equal amounts and injected intravitreally. Punches of neuroretina and RPE were harvested, AAV-barcodes were PCR amplified from the collected tissue, and deep sequencing was used to quantify the relative abundance of barcodes. The top-performing variants were identified as those with the greatest fold increase of barcodes recovered from collected tissue relative to the injected library. (B) Deep sequencing revealed ~4.8E + 6 variants in the AAV2-7mer library, which converged to ~7.1E + 4 variants in the final round of selection. (C) Analysis of variant copy number in the plasmid library revealed that variants were not equally represented, with some variants having 100-fold more copies than others. (D) Scatterplots illustrate the behavior of individual variants through each round of selection. Each dot represents an individual variant. Variants overrepresented in the original library are colored blue. Variants with the greatest fold increase in representation in the final round of selection are colored magenta. Variants that were both overrepresented in the original library and increased significantly in representation over rounds of selection (an overlap of blue and magenta) are colored orange. (E) The scCAG-eGFP-barcoded AAV library composed of 20 top variants, and co-injected intravitreally into a WT dog eye, resulted in robust GFP fluorescence in the retina 3 weeks after injection. (F) A map illustrates the location of samples collected from the GFP-barcoded library-injected retinas. (G) Confocal imaging of canine retina (superior quadrant) showed GFP expression in all retinal layers after injection of GFP-barcoded AAV libraries. RPE = Retinal pigment epithelium; IS/OS = inner and outer segments; ONL = outer nuclear layer; INL = inner nuclear layer; GCL = ganglion cell layer.
Figure 1—figure supplement 2
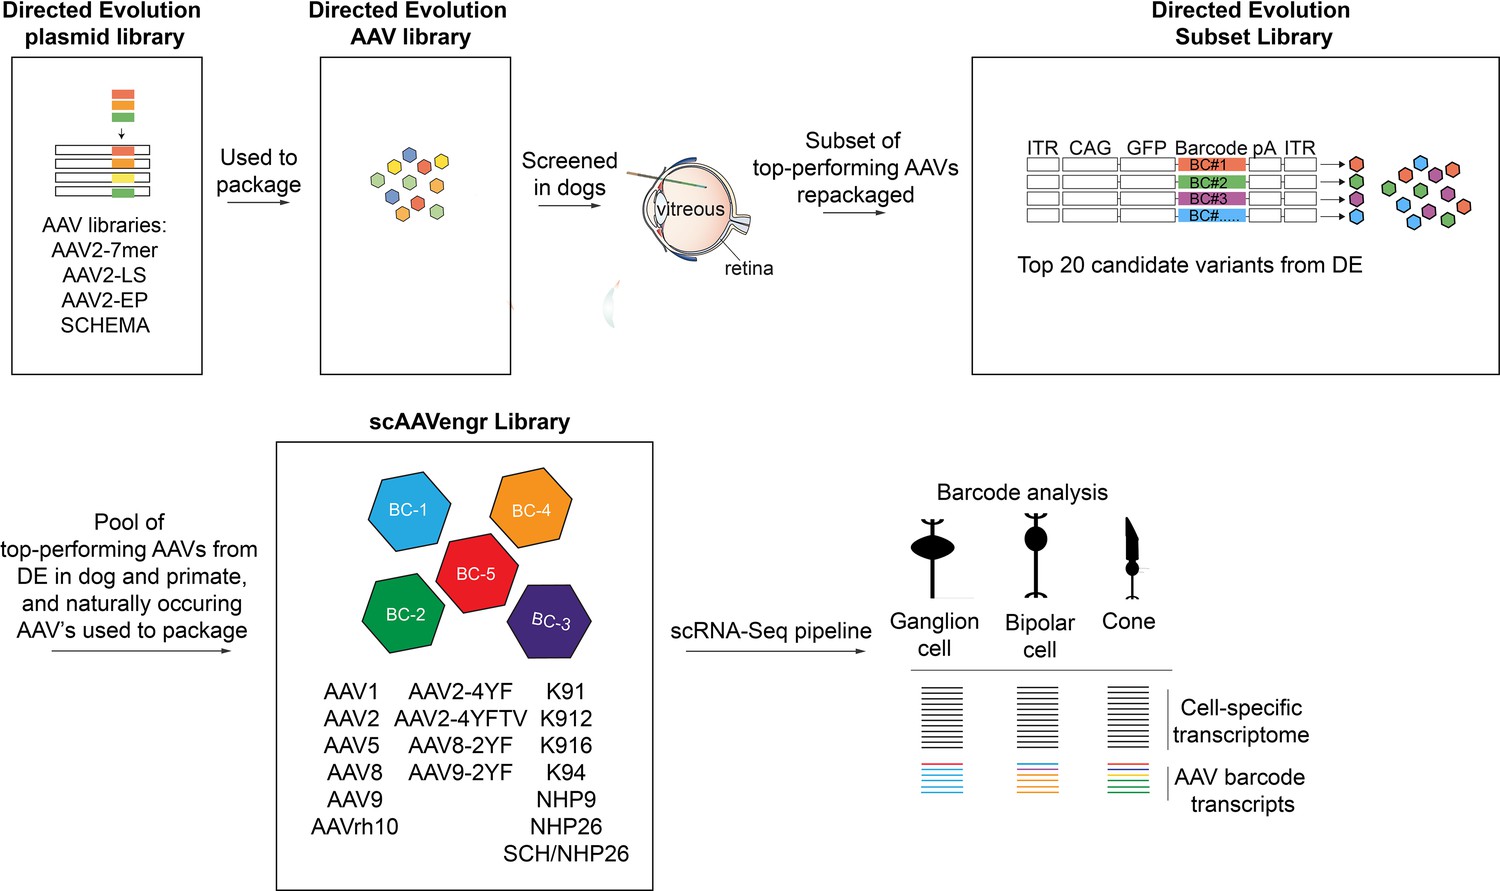
Description of libraries used in the study.
The directed evolution plasmid library was used to package the directed evolution AAV library. Following screening in dogs, a subset of top-performing AAVs was repackaged as the DE subset library. A pool of top-performing AAVs from DE screens performed in dogs and primates, along with naturally occurring AAV’s and tyrosine modified AAVs were packaged into the 17-member scAAVengr library, which was used in the scRNA-Seq scAAVengr workflow.
Figure 1—figure supplement 3
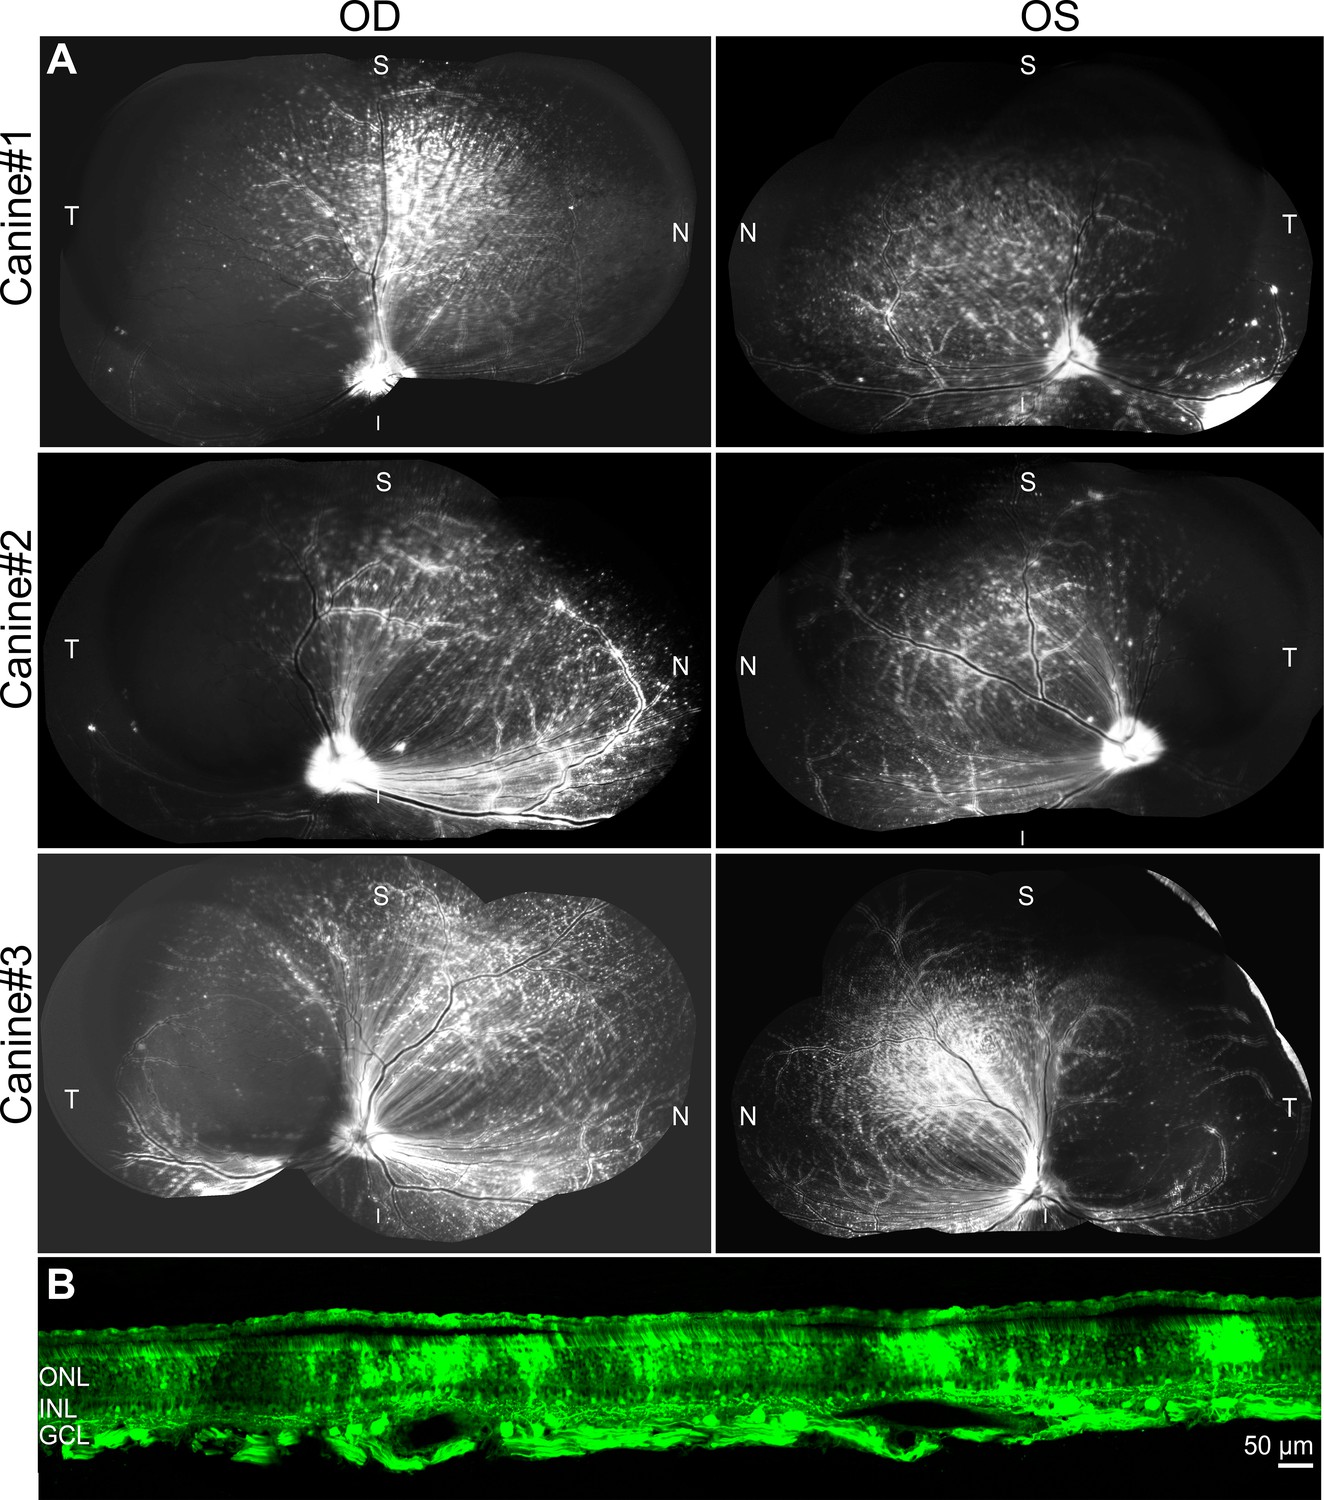
Injection of GFP-barcoded AAV library of top AAV variants in dogs.
(A) Intravitreal injection of GFP-barcode library in three dogs resulted in transgene expression 3 weeks after injection. (B) Imaging of GFP in a cross-section through the superior quadrant of the retina revealed GFP expression in all retinal layers.
Figure 1—figure supplement 4
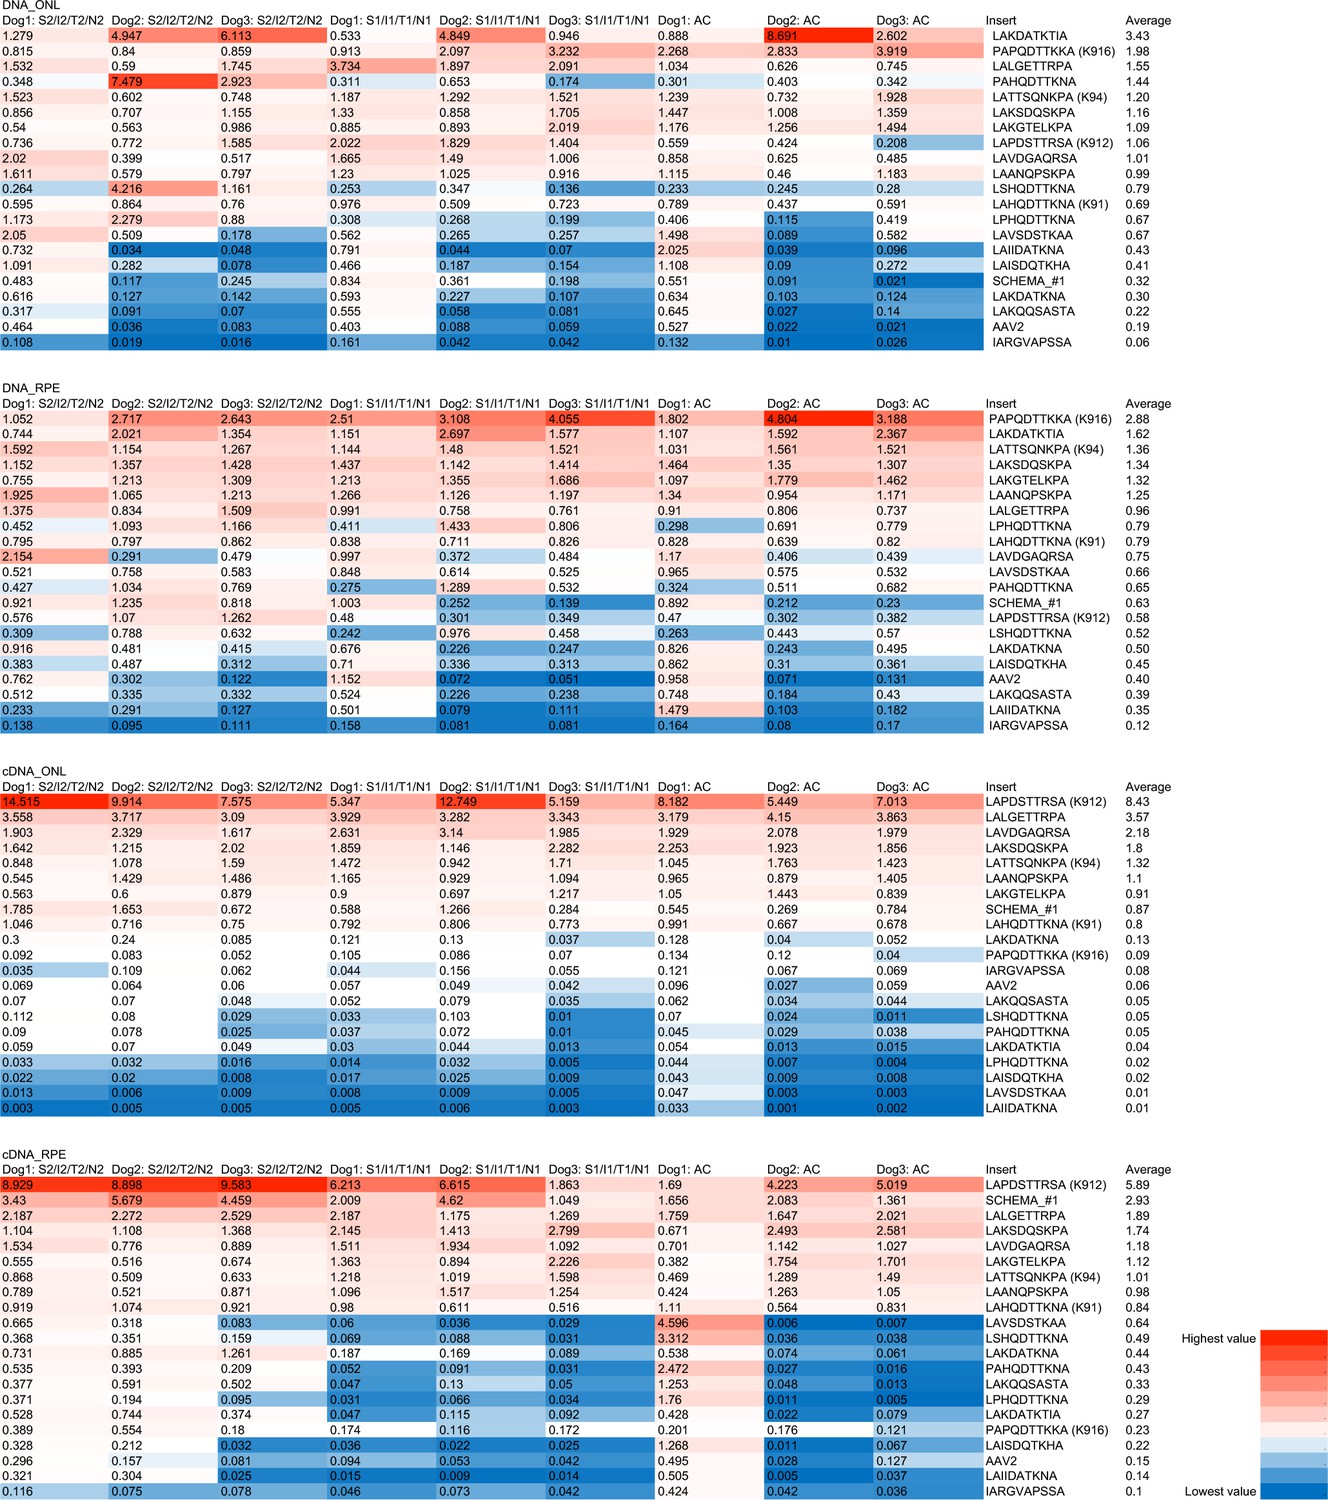
Performance of AAV variants following intravitreal injection of DE subset library in dog.
AAV-barcodes amplified from the ONL and RPE were subjected to Illumina sequencing to quantify the representation of each of the variants. Heat maps show the performance of variants, ranked on the basis of the normalized change in frequency of their representation in the recovered genomes relative to the injected AAV library (% of total in recovered AAV library / % of total in injected library). Best performing variants recovered from DNA and mRNA are shown, across pooled samples from three retinal regions in three dogs.
Figure 2 with 1 supplement
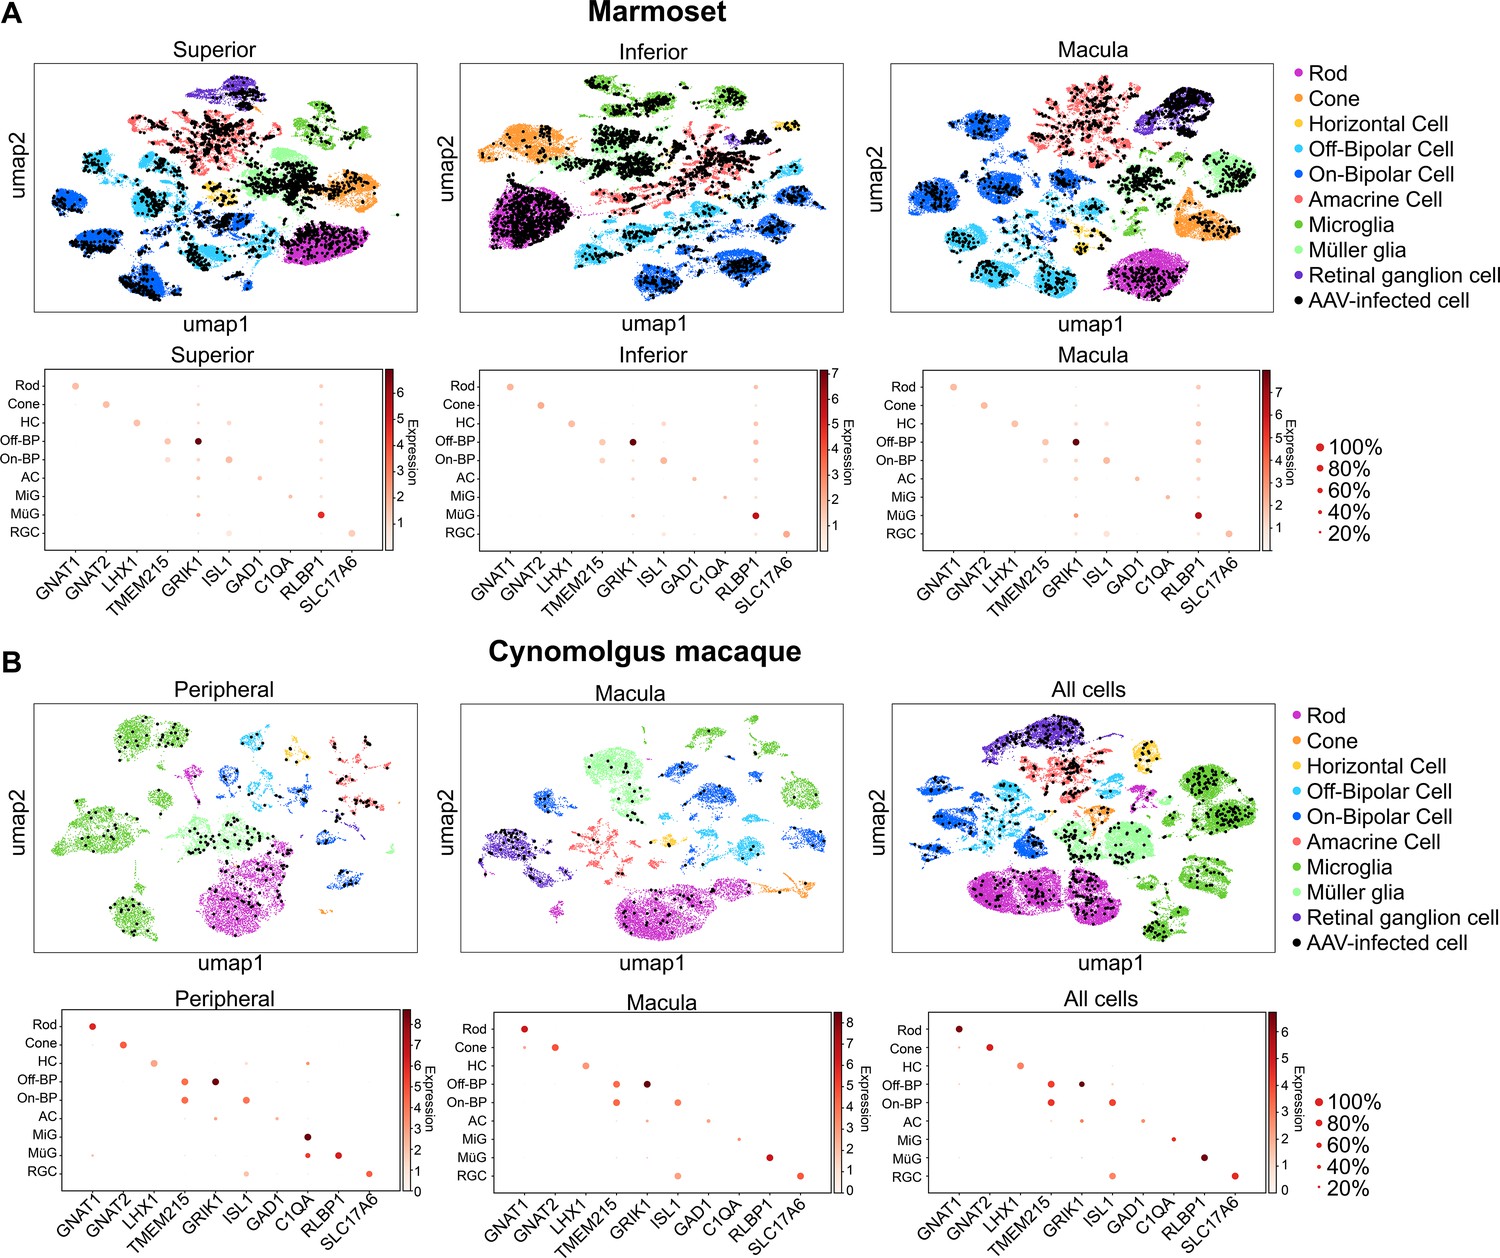
Clustering and quantification of AAV-infected retinal cells.
(A) AAV-infected marmoset retinal cells. Maps of clustered cells from superior, inferior or macular retina show AAV infection. Cells of similar type cluster together. The cell type of each cluster is indicated by color. AAV-infected cells are shown in black. Below each cluster plot, heat maps show the marker genes used to identify cell clusters. The size of the dot indicates the percent of cells in the cluster expressing the marker gene, and the color indicates the level of marker gene expression. Data is pooled from n = 2 marmosets. (B) AAV-infected cynomolgus macaque retinal cells. Data is from n = 1 cynomolgus macaque retina, collected from peripheral or macular retina, or from the total pool of retinal cells including GFP+ FACS-sorted cells.
Figure 2—figure supplement 1
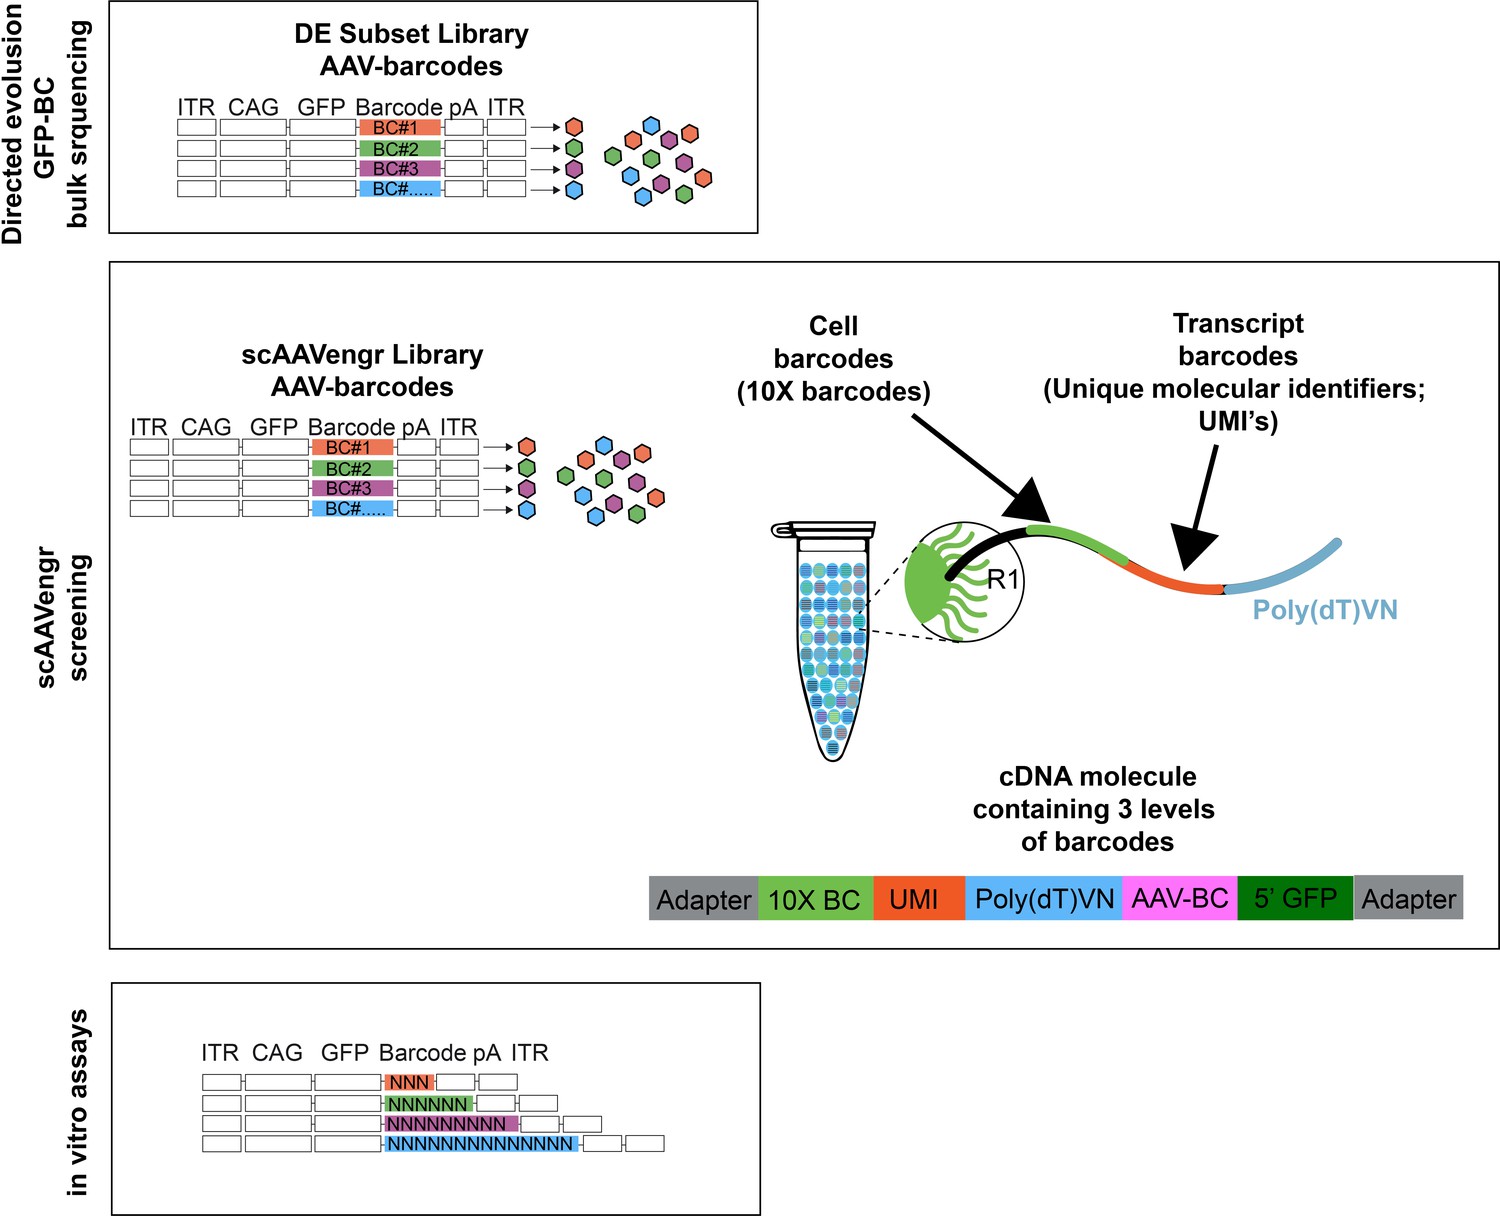
Illustration of barcoding strategies.
For directed evolution secondary screening experiments, performed in bulk tissue from dogs, 20 vectors, along with an AAV2 control, were packaged individually with a ubiquitous CAG promoter driving expression of GFP fused to a unique DNA barcode. Each virus thus expressed a unique AAV-barcode with which AAV expression could be tracked (AAV-barcodes). For scAAVengr screening experiments, a set of 17 AAV vectors were packaged individually with GFP constructs fused to unique barcodes (AAV-barcodes). Viruses were then used to infect primate retina. 10x processing results in the addition of a 10x barcode, indicating the cell from which a transcript originated, as well as a unique molecular identifier for each mRNA transcript. The resulting cDNA molecule, from a GFP-expressing cell, carries three levels of barcodes: a cell barcode, a molecule barcode and an AAV-barcode. For in vitro scAAVengr experiments, AAV was packaged with a construct containing GFP fused to a 3,6,9, or 14 bp barcode containing random nucleotides.
Figure 3 with 1 supplement

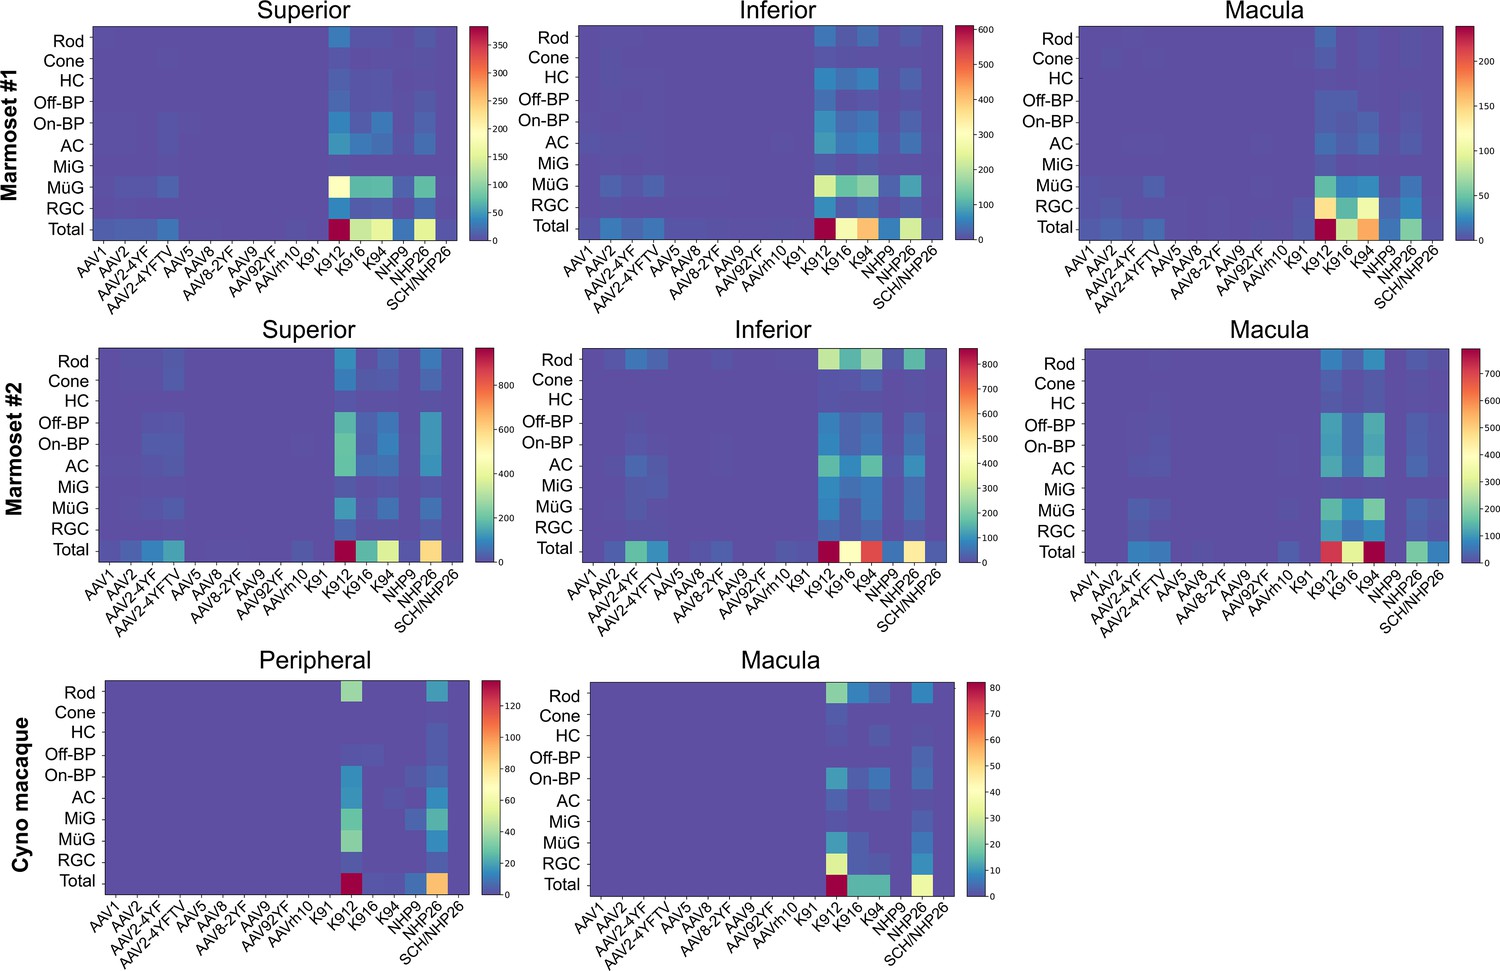
Quantitative comparison of variant infection across retinal cell types.
(A) Percent of cells infected by AAV serotypes in marmoset and cynomolgus macaque retina. Heat maps show the percent of identified cells infected by each serotype in the screen, corrected by the AAV dilution factor, for each retinal cell type. Total = the percent cells infected from the total pool of identified cells. Data is shown for each primate analyzed, across superior, inferior and macular retina. (B) Level of expression in infected cells. The mean level of GFP-barcoded transcript expression in cells infected with AAV is shown in heatmaps, for all retinal cell types. Cell types are arranged from outermost cells in the retina (rods and cones) to innermost cells (RGCs). Data is averaged across all infected cells and corrected by the AAV dilution factor. Data is shown as mean transcripts per cell/100,000 transcripts. HC = Horizontal Cell; Off-BP = Off-Bipolar Cell; On-BP = On-Bipolar cell; AC = Amacrine Cell; MiG = Microglia; MG = Müller Glia; RGC = Retinal Ganglion Cell.
-
Figure 3—source data 1
Marmoset 1-Superior-Percent cells.
- https://cdn.elifesciences.org/articles/64175/elife-64175-fig3-data1-v2.csv
-
Figure 3—source data 2
Marmoset 1-Inferior-Percent cells.
- https://cdn.elifesciences.org/articles/64175/elife-64175-fig3-data2-v2.csv
-
Figure 3—source data 3
Marmoset 1-Macula cells.
- https://cdn.elifesciences.org/articles/64175/elife-64175-fig3-data3-v2.csv
-
Figure 3—source data 4
Marmoset 1-Superior-Transcripts.
- https://cdn.elifesciences.org/articles/64175/elife-64175-fig3-data4-v2.csv
-
Figure 3—source data 5
Marmoset 1-Inferior-Transcripts.
- https://cdn.elifesciences.org/articles/64175/elife-64175-fig3-data5-v2.csv
-
Figure 3—source data 6
Marmoset 1-Macula-Transcripts.
- https://cdn.elifesciences.org/articles/64175/elife-64175-fig3-data6-v2.csv
-
Figure 3—source data 7
Marmoset 2-Superior-Percent cells.
- https://cdn.elifesciences.org/articles/64175/elife-64175-fig3-data7-v2.csv
-
Figure 3—source data 8
Marmoset 2-Inferior-Percent cells.
- https://cdn.elifesciences.org/articles/64175/elife-64175-fig3-data8-v2.csv
-
Figure 3—source data 9
Marmoset 2-Macula cells.
- https://cdn.elifesciences.org/articles/64175/elife-64175-fig3-data9-v2.csv
-
Figure 3—source data 10
Marmoset 2-Superior-Transcripts.
- https://cdn.elifesciences.org/articles/64175/elife-64175-fig3-data10-v2.csv
-
Figure 3—source data 11
Marmoset 2-Inferior-Transcripts.
- https://cdn.elifesciences.org/articles/64175/elife-64175-fig3-data11-v2.csv
-
Figure 3—source data 12
Marmoset 2-Macula-Transcripts.
- https://cdn.elifesciences.org/articles/64175/elife-64175-fig3-data12-v2.csv
-
Figure 3—source data 13
Cyno-Peripheral-Percent cells.
- https://cdn.elifesciences.org/articles/64175/elife-64175-fig3-data13-v2.csv
-
Figure 3—source data 14
Cyno-Macula cells.
- https://cdn.elifesciences.org/articles/64175/elife-64175-fig3-data14-v2.csv
-
Figure 3—source data 15
Cyno-Peripheral-Transcripts.
- https://cdn.elifesciences.org/articles/64175/elife-64175-fig3-data15-v2.csv
-
Figure 3—source data 16
Cyno-Macula-Transcripts.
- https://cdn.elifesciences.org/articles/64175/elife-64175-fig3-data16-v2.csv
Figure 3—figure supplement 1
Numbers of AAV-infected cells.
Heat maps show the number of cells infected by each serotype of virus, across retinal regions, in marmosets and cynomolgus macaque. Percent of cells infected is shown in Figure 3. Numbers are corrected by dilution factor of the virus.
Figure 4
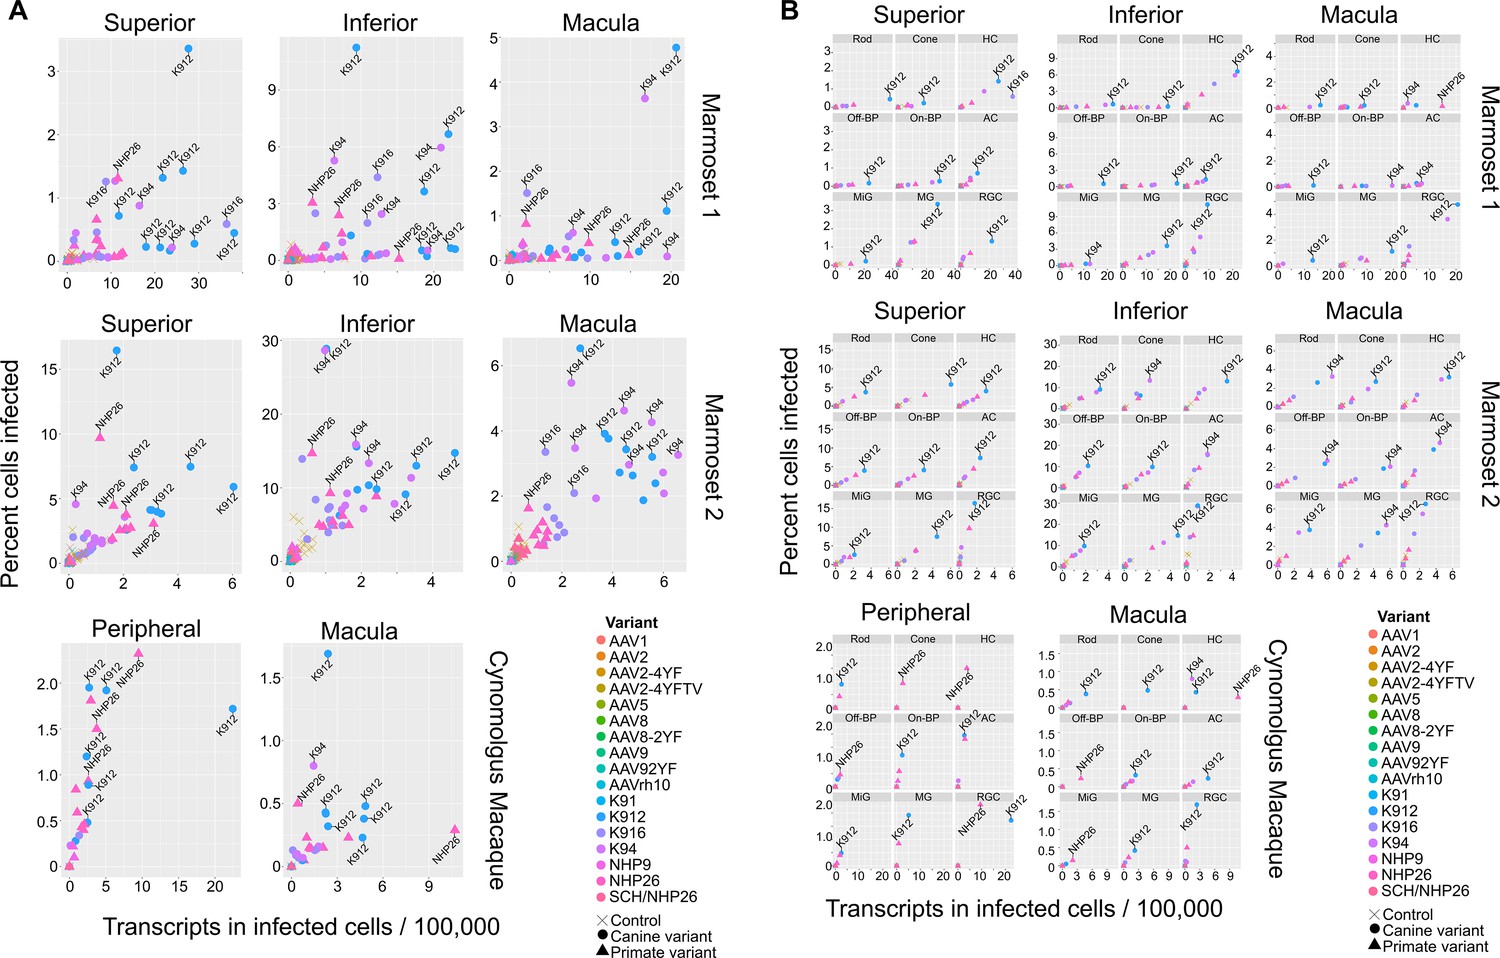
Serotype performance across retinal regions.
(A) Scatter plots reveal that K912 is the overall best performing canine variant across retinal regions, while NHP26 is the best performing primate DE variant. Plots show the number of transcripts in infected cells per 100,000 transcripts vs the percent of cells infected for each serotype. Nine data points are plotted for each variant, one data point for each cell type. Serotypes are indicated by color. Data is from n = 2 marmosets and n = 1 cynomolgus macaque. A subset of the top performing variants, according to each variable, are labeled. Control vectors are shown as X’s. Canine-derived variants are shown as circles. Primate-derived variants are shown as triangles. Best performing variants appear toward the upper right hand corner of each plot. (B) AAV variant performance in each cell type. Scatter plots reveal that K912 is the overall best performing variant across most retinal cell types and across retinal regions, while NHP26 is the best performing primate-derived variant. Plots show the number of transcripts in infected cells per 100,000 transcripts vs the percent of cells infected. Individual plots show the performance for AAV serotypes (in different colors) in individual cell types, across retinal regions. A subset of the top performing variants, according to each variable, are labeled. HC = Horizontal Cell; Off-BP = Off-Bipolar Cell; On-BP = On-Bipolar cell; AC = Amacrine Cell; MiG = Microglia; MG = Müller Glia; RGC = Retinal Ganglion Cell.
Figure 5
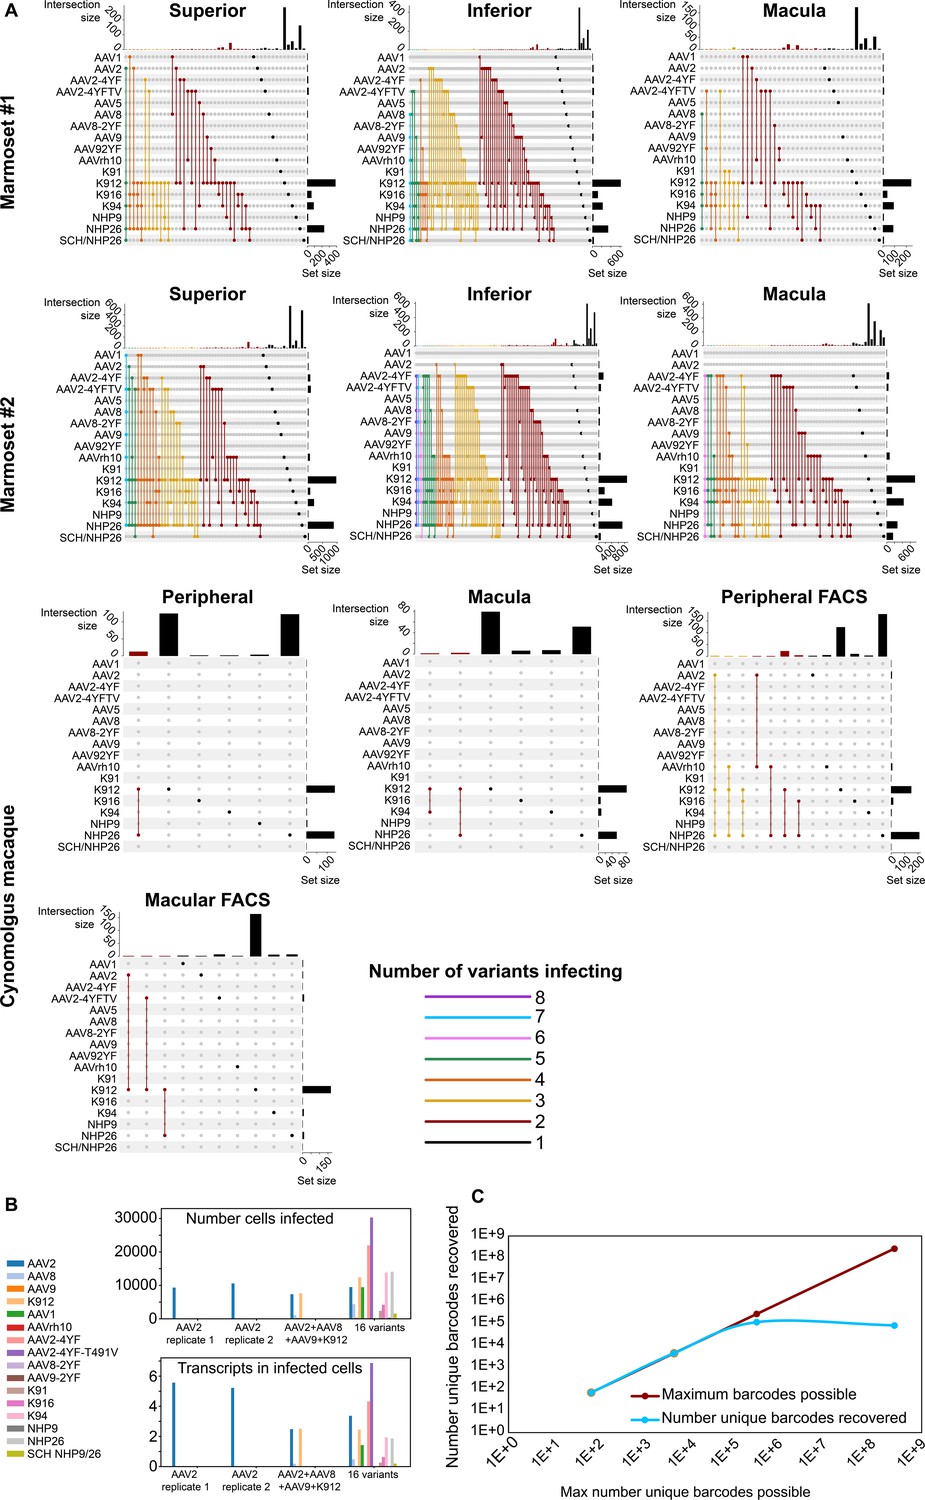
Dynamics of infection from multiple AAV serotypes.
(A) Upset plots show that multiple AAV serotypes can infect the same retinal cell, although the majority of retinal cells are infected by the top performing variants. Plots are shown across multiple regions in marmoset and cynomolgus macaque retina. Dots and connecting vertical lines indicate the serotype and number of variants infecting single cells. The number of cells infected by a particular combination of AAVs (the intersection size) is illustrated in the bar graph across the top of the plot. The number of cells infected by a particular serotype (the set size) is shown across the right-hand Y-axis. Lines are colored according to the number of AAV variants in the subset. (B) scAAVengr screening performed in HEK293 cells shows that pooling of AAV variants does not impede infection of other library members, either in terms of the number of cells infected or expression levels. AAV2, or a 4-member pool of AAV’s, or a 16-member pool of AAV’s was used to infect HEK293 cells. The scAAVengr pipeline was then used to quantify infectivity. In all preparations, AAV2 infected similar numbers of cells, and similar levels of expression were observed. K912 infected similar numbers of cells, and similar expression levels were observed in both the four variant and the 16 variant pools. (C) At least~ E + 5 AAV variants can be quantified using the scAAVengr pipeline. Libraries containing AAV2, packaged with barcodes of 3,6,9 or 14 base pairs in length (with a maximum possible diversity of 64, 4,096, 262,144, or 268,435,456), were used to infect HEK293 cells. scAAVengr was then used to quantify the number of barcodes recovered. From samples containing 8000 cells, all possible barcodes were recovered from libraries with 3- and 6 bp barcodes. ~ 100,000 unique barcodes were recovered from 9- and 14 bp barcodes, indicating that at least E + 5 variants could be quantified using the scAAVengr pipeline.
Figure 6 with 1 supplement
K912 expression in primate retina.
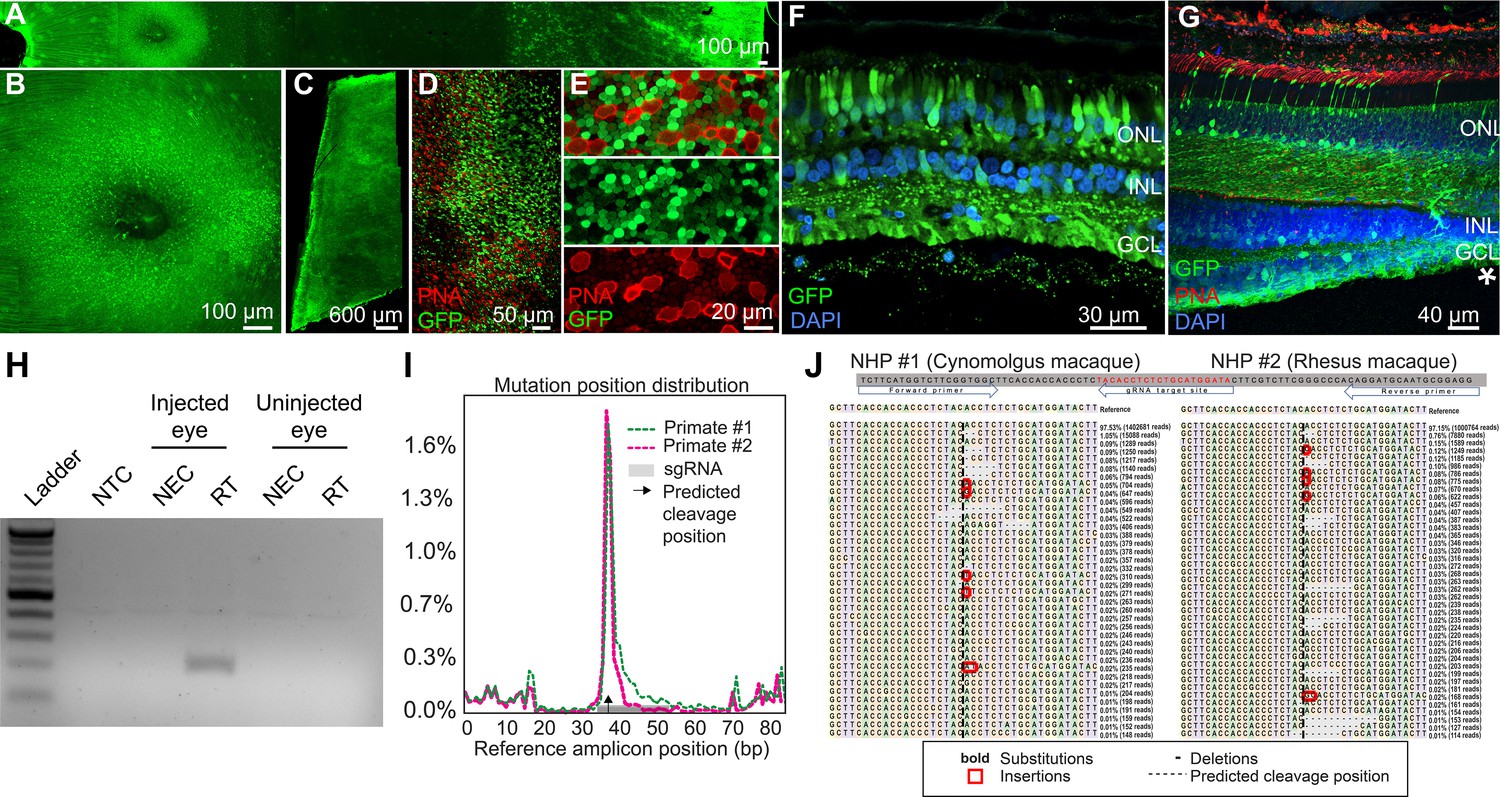
(A–G) GFP expression in a cynomolgus macaque injected with ~2.6E + 12 vg of K912-scCAG-GFP. (A) GFP expression in a flatmounted cynomolgus macaque retina 2.5 months after injection. (B) GFP expression in the perifoveal ring. (C) GFP expression in peripheral retina. (D) Flatmount imaged through the photoreceptor layer in peripheral retina showing GFP expression and PNA labeling of cones. (E) Higher resolution image of peripheral photoreceptors, labeled with PNA. (F) Cross section of peripheral retina showing GFP expression and DAPI labeling of nuclei. (G) Cross-section through the foveal edge showing GFP expression. Cone outer segments are labeled with PNA. Nuclei are labeled with DAPI. (H) RT-PCR of cDNA from injected and uninjected eyes. RT-PCR shows Cas9 expression in macula of the cynomolgus macaque retina injected with K912-saCas9-gRNA-RHO but not in a control uninjected eye. (I) Percent of genome editing and location of editing relative to guide RNA sequence in two macaques injected with K912-scCAG-saCA9-gRNA-RHO. (J) Deep sequencing reads showing deletions, insertions and base substitutions in the cynomolgus macaque and rhesus macaque following injection with K912-saCas9-gRNA-RHO.
Figure 6—figure supplement 1
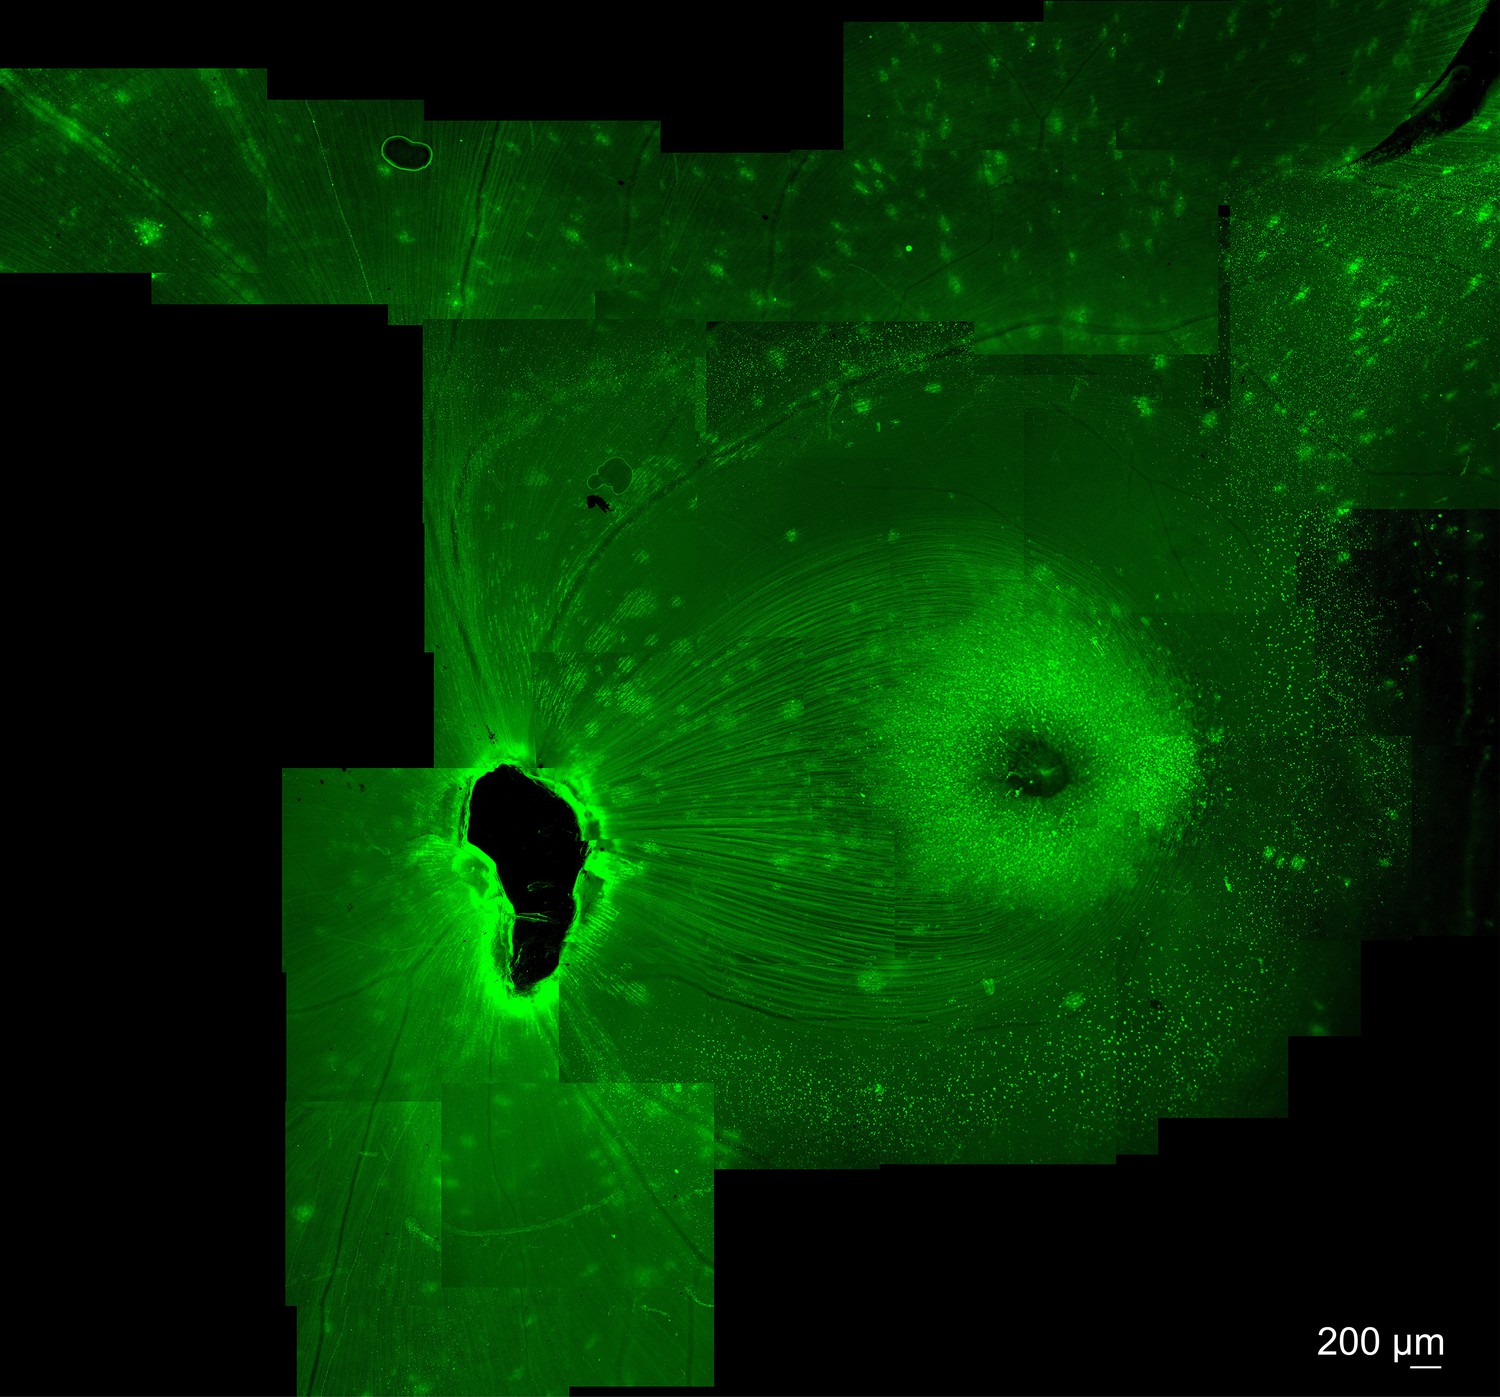
Expression of K912-CAG-GFP in cynomolgus macaque retina.
Intravitreal injection of K912-scCAG-GFP results in GFP expression in the central macaque retina. Expression results in bright expression in a perifoveal ring, and in punctate regions around retinal blood vessels. Imaging was performed 10 weeks after injection.
Figure 7
scAAVengr quantified the performance of AAV variants in mouse brain, heart, and liver following systemic injection of libraries.
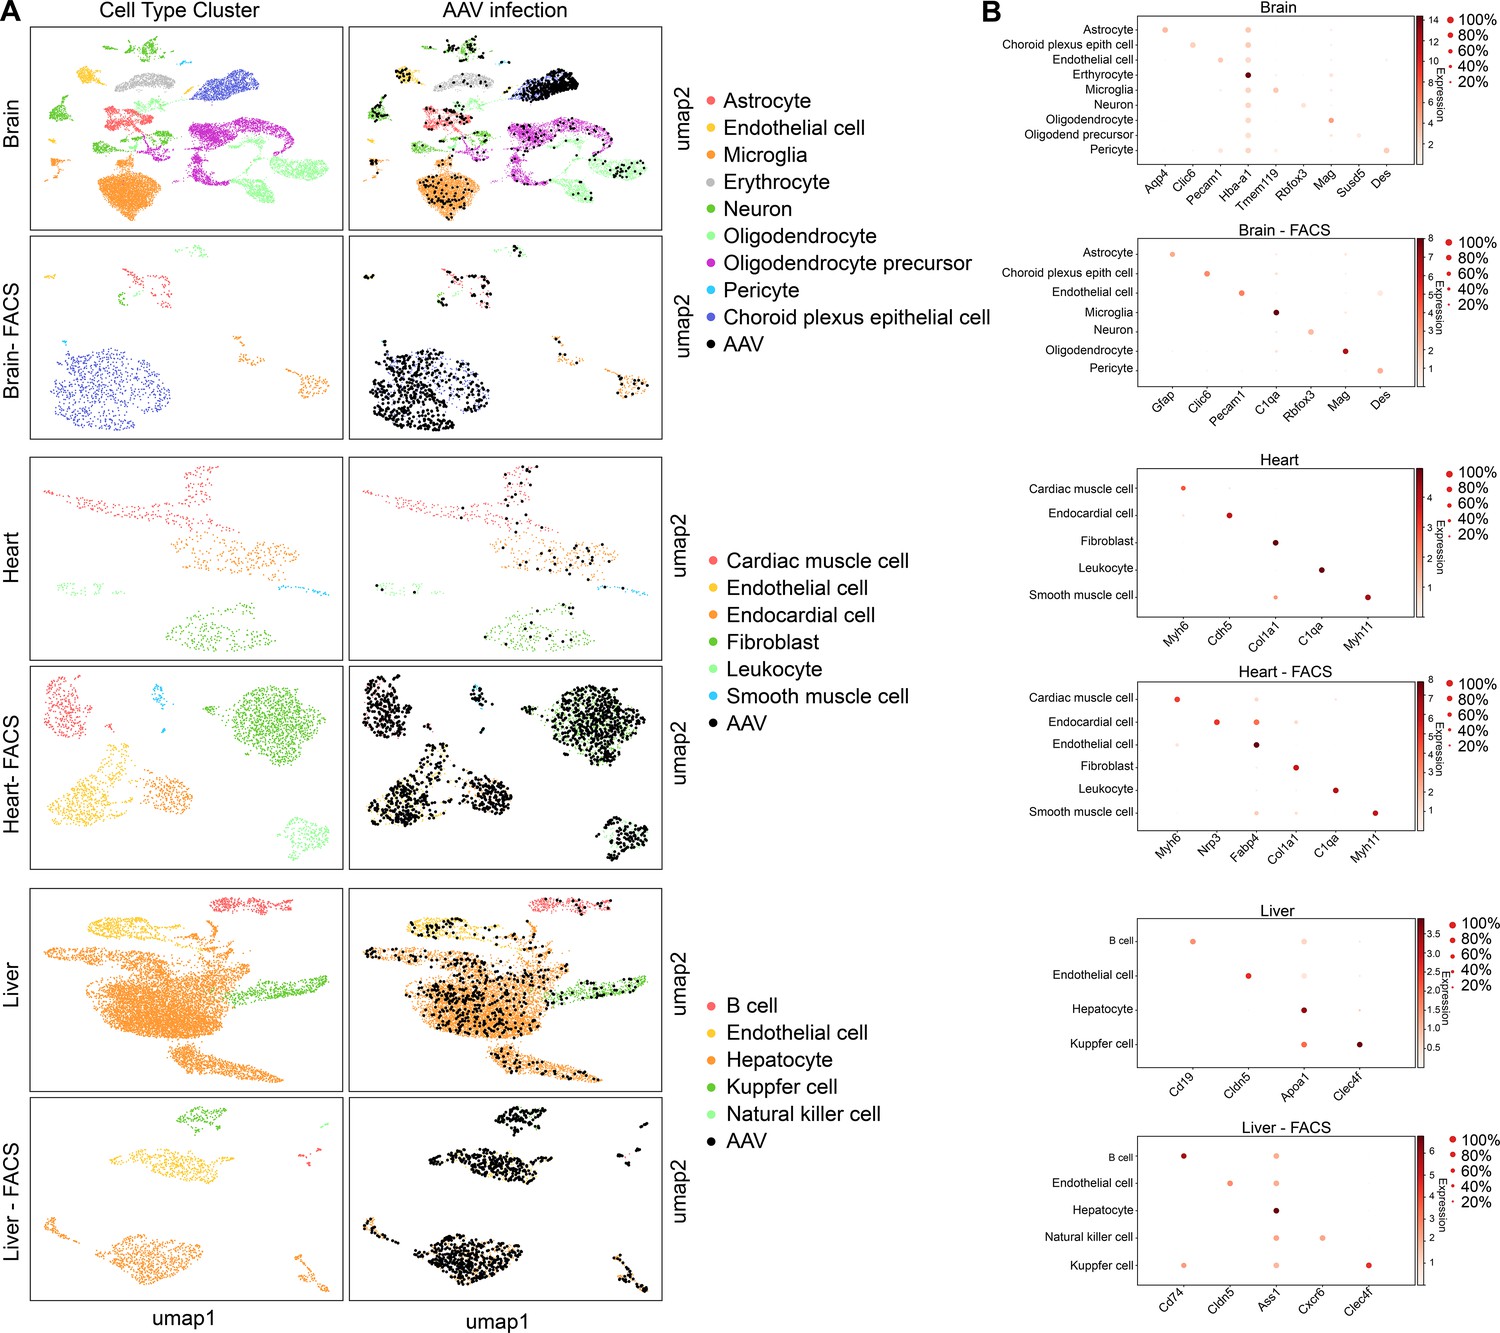
(A) Maps of clustered AAV-infected cells from brain, heart, and liver. The cell type of each cluster is indicated by color. AAV-infected cells are shown in black. Maps are shown for cells processed directly following single-cell dissociation, or following FACS sorting to enrich for GFP+ cells. (B) Heat maps show the marker genes used to identify cell clusters in each sample. The size of the dot indicates the percent of cells in the cluster expressing the marker gene, and the color indicates the level of marker gene expression. Data is pooled from n = 2 mice.
Figure 8
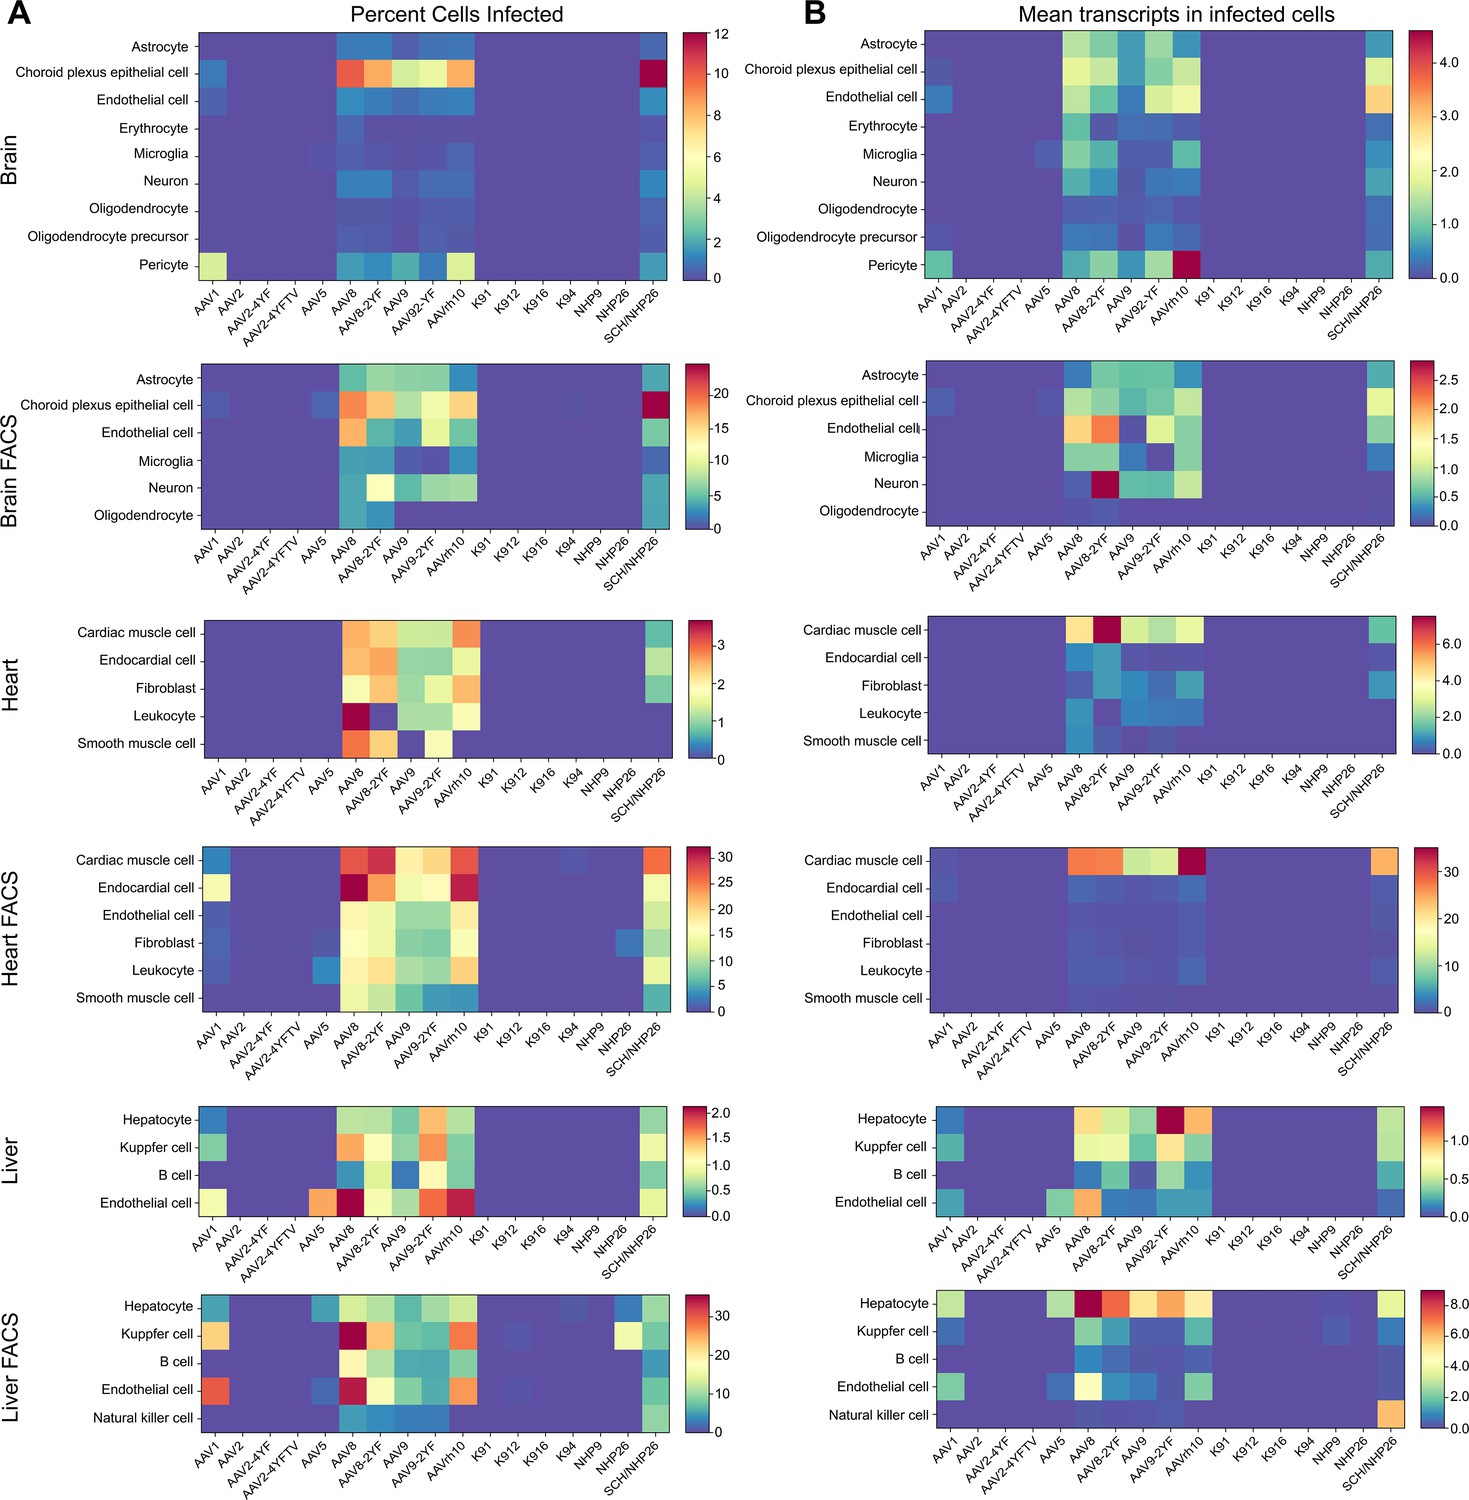
Quantitative comparison of variant infection across cell types in mouse brain, heart and liver.
(A) Percent of cells infected by AAV serotypes. Heat maps show the percent of identified cells infected by each serotype in the screen, corrected by the AAV dilution factor, for each retinal cell type. Data are from the tissues of 2 mice. (B) Level of expression in infected cells. The mean level of GFP-barcode transcript expression in cells infected with AAV is shown in heatmaps, for all identified cell types. Data is averaged across all infected cells and corrected by the AAV dilution factor. Data is shown as mean transcripts per cell/100,000 transcripts.
-
Figure 8—source data 1
Brain-Percent cells.
- https://cdn.elifesciences.org/articles/64175/elife-64175-fig8-data1-v2.csv
-
Figure 8—source data 2
Brain-Transcripts.
- https://cdn.elifesciences.org/articles/64175/elife-64175-fig8-data2-v2.csv
-
Figure 8—source data 3
Brain FACS-Percent cells.
- https://cdn.elifesciences.org/articles/64175/elife-64175-fig8-data3-v2.csv
-
Figure 8—source data 4
Brain FACS-Transcripts.
- https://cdn.elifesciences.org/articles/64175/elife-64175-fig8-data4-v2.csv
-
Figure 8—source data 5
Heart-Percent cells.
- https://cdn.elifesciences.org/articles/64175/elife-64175-fig8-data5-v2.csv
-
Figure 8—source data 6
Heart-Transcripts.
- https://cdn.elifesciences.org/articles/64175/elife-64175-fig8-data6-v2.csv
-
Figure 8—source data 7
Heart FACS-Percent cells.
- https://cdn.elifesciences.org/articles/64175/elife-64175-fig8-data7-v2.csv
-
Figure 8—source data 8
Heart FACS-Transcripts.
- https://cdn.elifesciences.org/articles/64175/elife-64175-fig8-data8-v2.csv
-
Figure 8—source data 9
Liver-Percent cells.
- https://cdn.elifesciences.org/articles/64175/elife-64175-fig8-data9-v2.csv
-
Figure 8—source data 10
Liver-Transcripts.
- https://cdn.elifesciences.org/articles/64175/elife-64175-fig8-data10-v2.csv
-
Figure 8—source data 11
Liver FACS-Percent cells.
- https://cdn.elifesciences.org/articles/64175/elife-64175-fig8-data11-v2.csv
-
Figure 8—source data 12
Liver FACS-Transcripts.
- https://cdn.elifesciences.org/articles/64175/elife-64175-fig8-data12-v2.csv
Tables
Key resources table
| Reagent type (species) or resource | Designation | Source or reference | Identifiers | Additional information |
|---|---|---|---|---|
| Strain, strain background (Escherichia coli) | NEB 5-alpha | NEB | C2987H | Competent cells |
| Strain, strain background (Escherichia coli) | MegaX DH10B T1 | ThermoFisher | C640003 | Electrocompetent cells |
| Strain, strain background (Mus musculus) | C57Bl/6 J | Jackson Laboratories | Stock No: 000664RRID:IMSR_JAX:000664 | |
| Cell line (Homo-sapiens) | 293AAV | Cell Biolabs | AAV-100RRID:CVCL_KA64 | |
| Cell line (Homo-sapiens) | HEK293T | ATCC | CRL-1573RRID:CVCL_0045 | |
| Antibody | Lectin PNA (Peanut agglutinin) | Molecular Probes | L32459RRID:AB_2315178 | (1:200) |
| Antibody | Anti-GFP, (rabbit polyclonal) | Thermofisher Scientific | A11122RRID:AB_221569 | (1:250) |
| Recombinant DNA reagent | pX601-AAV-CMV::NLS-SaCas9-NLS-3xHA-bGHpA;U6::BsaI-sgRNA | Addgene | Plasmid #61591RRID:Addgene_61591 | A single vector AAV-Cas9 system containing SaCas9 and its sgRNA |
| Recombinant DNA reagent | scCAG-eGFP-Barcode-bghPolyA | This paper | Byrne Lab, see materials and methods, under GFP barcoded AAV library construction. | |
| Recombinant DNA reagent | AAV libraries | References: ~ 588 peptide insertion library (Müller et al., 2003), AAV2-Loopswap library (Koerber et al., 2008) AAV2-ErrorProne library (Koerber et al., 2006) SCHEMA library (Ojala et al., 2018). | ||
| Commercial assay or kit | QuickTiter AAV Quantitation Kit | Cell biolabs | VPK-145 | AAV quantification kit |
| Commercial assay or kit | Qiagen DNeasy Blood and Tissue Kit | Qiagen | Cat. No. / ID: 69504 | DNA extraction kit |
| Commercial assay or kit | AllPrep DNA/RNA Micro Kit | Qiagen | Cat. No. / ID: 80284 | DNA/RNA extraction kit |
| Commercial assay or kit | Neural Tissue Dissociation Kit for postnatal neurons | MACS Miltenyi | 130-094-802 | Retina dissociation kit |
| Commercial assay or kit | Adult Brain Tissue Dissociation Kit | MACS Miltenyi | 130-107-677 | Brain dissociation kit |
| Commercial assay or kit | Multi Tissue Dissociation Kit 2 | MACS Miltenyi | 130-110-203 | Heart dissociation kit |
| Commercial assay or kit | Liver Dissociation Kit | MACS Miltenyi | 130-105-807 | Liver dissociation kit |
| Commercial assay or kit | ChromiumNext GEMSingle Cell 3‘Reagent Kits v3 | 10x Genomics | PN-1000075, PN-1000073, PN-120262 | |
| Commercial assay or kit | ChromiumNext GEMSingle Cell 3‘Reagent Kits v3.1 (Dual Index) | 10x Genomics | PN-1000268, PN-1000120, PN-1000215 | |
| Commercial assay or kit | Targeted Gene Expression Reagent Kit | 10x Genomics | PN-1000248, PN-1000249 | |
| Chemical compound, drug | Cyclosporine | GENGRAF | 6 mg/kg | |
| Chemical compound, drug | Meloxicam | Vivlodex | 0.2 mg/kg | |
| Chemical compound, drug | Triamcinolone Acetonide (Kenalog 40) | Bristol-Myers Squibb | ||
| Software, algorithm | STARsolo | A.Dobin et al., STAR: ultrafast universal RNA-seq aligner. Bioinformatics 29, 15–21 (2013). | RRID:SCR_021542 | v2.7 |
| Software, algorithm | Cell Ranger | 10x Genomics | RRID:SCR_017344 | v3 |
| Software, algorithm | DropletUtils | A.T. L. Lun et al., EmptyDrops: distinguishing cells from empty droplets in droplet-based single-cell RNA sequencing data. Genome Biol 20, 63 (2019). | v1.4.3 | |
| Software, algorithm | SoupX | M.D. Young, S. Behjati, SoupX removes ambient RNA contamination from droplet based single cell RNA sequencing data. bioRxiv, (2020). | RRID:SCR_019193 | v0.3.1 |
| Software, algorithm | SCDS | A.S. Bais, D. Kostka, scds: computational annotation of doublets in single-cell RNA sequencing data.Bioinformatics 36, 1150–1158 (2020). | RRID:SCR_021541 | v1.0.0 |
| Software, algorithm | Scran | Lun ATL, McCarthy DJ, Marioni JC. A step-by-step workflow for low-level analysis of single-cell RNA-seq data with Bioconductor. F1000Research 5: 2122 (2016). | RRID:SCR_016944 | v1.12.1 |
| Software, algorithm | ALRA | G.C. Linderman, J. Zhao, Y. Kluger, Zero-preserving imputation of scRNA-seq data using low-rank approximation. bioRxiv, (2018). | RRID:SCR_021540 | v1.0 |
| Software, algorithm | Scanpy | F.A. Wolf, P. Angerer, F. J. Theis, SCANPY: large-scale single-cell gene expression data analysis. GenomeBiol 19, 15 (2018). | RRID:SCR_018139 | v1.4.4.post1 |
| Software, algorithm | Scanorama | Hie B, Bryson B, Berger B. Efficient integration of heterogeneous single-cell transcriptomes using Scanorama. Nature Biotechnology 37: 685–691 (2019). | RRID:SCR_021539 | v1.2 |
| Software, algorithm | Salmon | R.Patro, G. Duggal, M. I. Love, R. A. Irizarry, C. Kingsford, Salmon provides fast and bias-aware quantification of transcript expression. Nat Methods 14, 417–419 (2017). | RRID:SCR_017036 | v0.9.1 |
| Software, algorithm | CRISPResso2 | Clement K, Rees H, Canver MC, Gehrke JM, Farouni R, Hsu JY, Cole MA, Liu DR, Joung JK, Bauer DE, Pinello L. CRISPResso2 provides accurate and rapid genome editing sequence analysis. Nature Biotechnology 37: 224–226 (2019). | RRID:SCR_021538 | v2.0.34 |
Additional files
-
Supplementary file 1
Table with Summary of injections performed in dogs and primates.
AAV selection rounds in canines 2b and 5b were repeated selections of the previous rounds, which did not result in the amplification of AAV variants.
- https://cdn.elifesciences.org/articles/64175/elife-64175-supp1-v2.docx
-
Supplementary file 2
Statistical Analysis.
A. Friedman’s test was conducted to determine differences across AAV variants. The test was run separately for each cell type as well as total cells combined. Marmoset and cynomolgus macaque samples were both used in the analysis (n = 8). Significant P-values < 0.05 are shown in bold red. S2.1 p-values resulting from a Friedman’s test using percent cells infected as the data points. Significant P-values < 0.05 are shown in bold red. S2.2 p-values resulting from a Friedman’s test using average transcripts per infected cell as the data points. Significant P-values < 0.05 are shown in bold red.
- https://cdn.elifesciences.org/articles/64175/elife-64175-supp2-v2.docx
-
Supplementary file 3
p-values from a Wilcoxon signed-rank test.
A one-sided Wilcoxon signed-rank test was used for a pairwise comparison between K912 or NHP26 and the other variants. P-values were corrected using Benjamini-Hochberg correction method. Significant P-values < 0.05 are shown in bold red. S3.1 p-values resulting from a one-sided Wilcoxon signed-rank test using percent cells infected as the data points, comparing NHP12 and other variants. S3.2 p-values resulting from a one-sided Wilcoxon signed-rank test using percent cells infected as the data points, comparing NHP26 and other variants. S3.3 p-values resulting from a one-sided Wilcoxon signed-rank test using average transcripts per infected cell as the data points, comparing K912 and other variants. S3.4 p-values resulting from a one-sided Wilcoxon signed-rank test using average transcripts per infected cell as the data points, comparing NHP26 and other variants.
- https://cdn.elifesciences.org/articles/64175/elife-64175-supp3-v2.docx
-
Supplementary file 4
List of primers used in the study.
- https://cdn.elifesciences.org/articles/64175/elife-64175-supp4-v2.docx
-
Transparent reporting form
- https://cdn.elifesciences.org/articles/64175/elife-64175-transrepform1-v2.pdf
Download links
A two-part list of links to download the article, or parts of the article, in various formats.
Downloads (link to download the article as PDF)
Open citations (links to open the citations from this article in various online reference manager services)
Cite this article (links to download the citations from this article in formats compatible with various reference manager tools)
scAAVengr, a transcriptome-based pipeline for quantitative ranking of engineered AAVs with single-cell resolution
eLife 10:e64175.
https://doi.org/10.7554/eLife.64175


