Time-resolved phosphoproteomics reveals scaffolding and catalysis-responsive patterns of SHP2-dependent signaling
- Department of Cancer Biology, Dana-Farber Cancer Institute Boston, United States
- Department of Biological Chemistry & Molecular Pharmacology, Blavatnik Institute, Harvard Medical School, United States
- Laboratory of Systems Pharmacology, Harvard Medical School, United States
- Department of Cell Biology, Harvard Medical School, United States
- Novo Nordisk Foundation Center for Protein Research, University of Copenhagen, Denmark
- Department of Pediatric Oncology, Dana Farber Cancer Institute, United States
- Novartis Institutes for Biomedical Research, United States
Figures
Figure 1 with 3 supplements
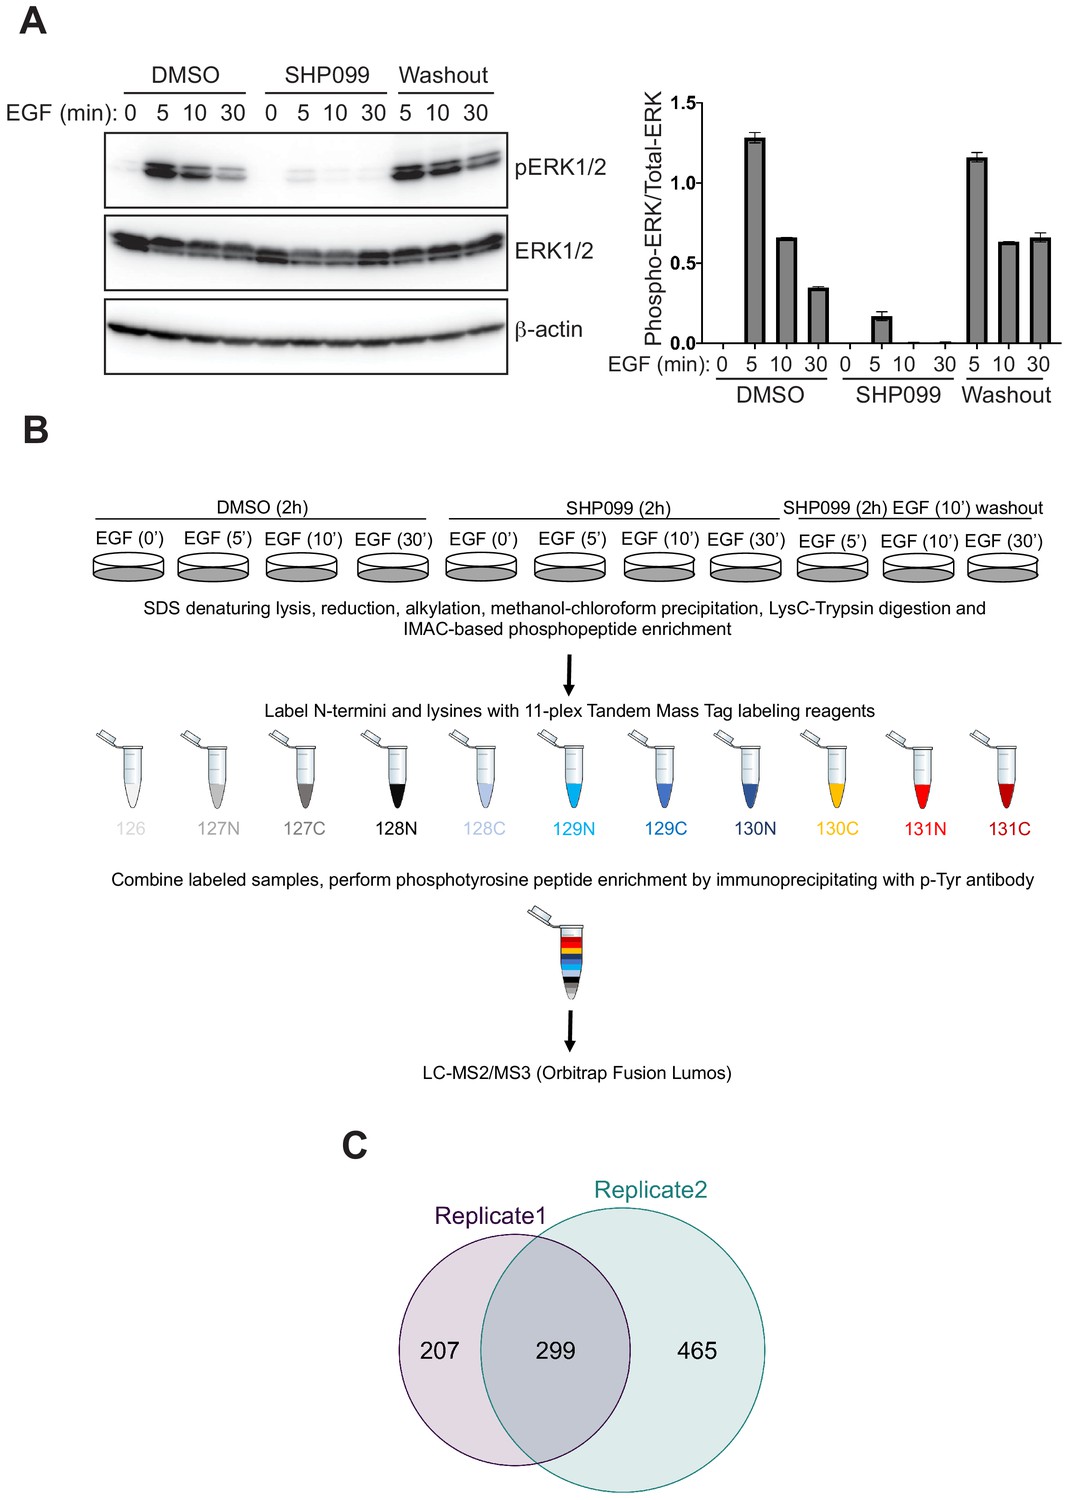
Phosphoproteomic studies in MDA-MB-468 cells.
(A) Left: Western blot showing the phosphoERK1/2 abundance after EGF stimulation alone, EGF stimulation in the presence of SHP099, and EGF stimulation in the presence of SHP099, followed by drug washout 10 min after EGF stimulation. Right: quantification of the Western blot data, calculated from the ratio of [pERK1/2]/[ERK1/2] band intensities. (B) Schematic illustration of treatment conditions and mass spectrometry workflow. Western blot and phosphoproteomic data are both representative of two independent biological replicates (n = 2). (C) Venn diagram showing the overlap of phosphopeptides identified in biological replicates 1 and 2.
-
Figure 1—source data 1
Table showing Phospho-ERK1/2 levels normalized to total-ERK1/2 levels (as quantified by measuring band intensities using ImageJ) in MDA-MB-468 cells treated with SHP099 and EGF as indicated.
- https://cdn.elifesciences.org/articles/64251/elife-64251-fig1-data1-v2.xlsx
Figure 1—figure supplement 1
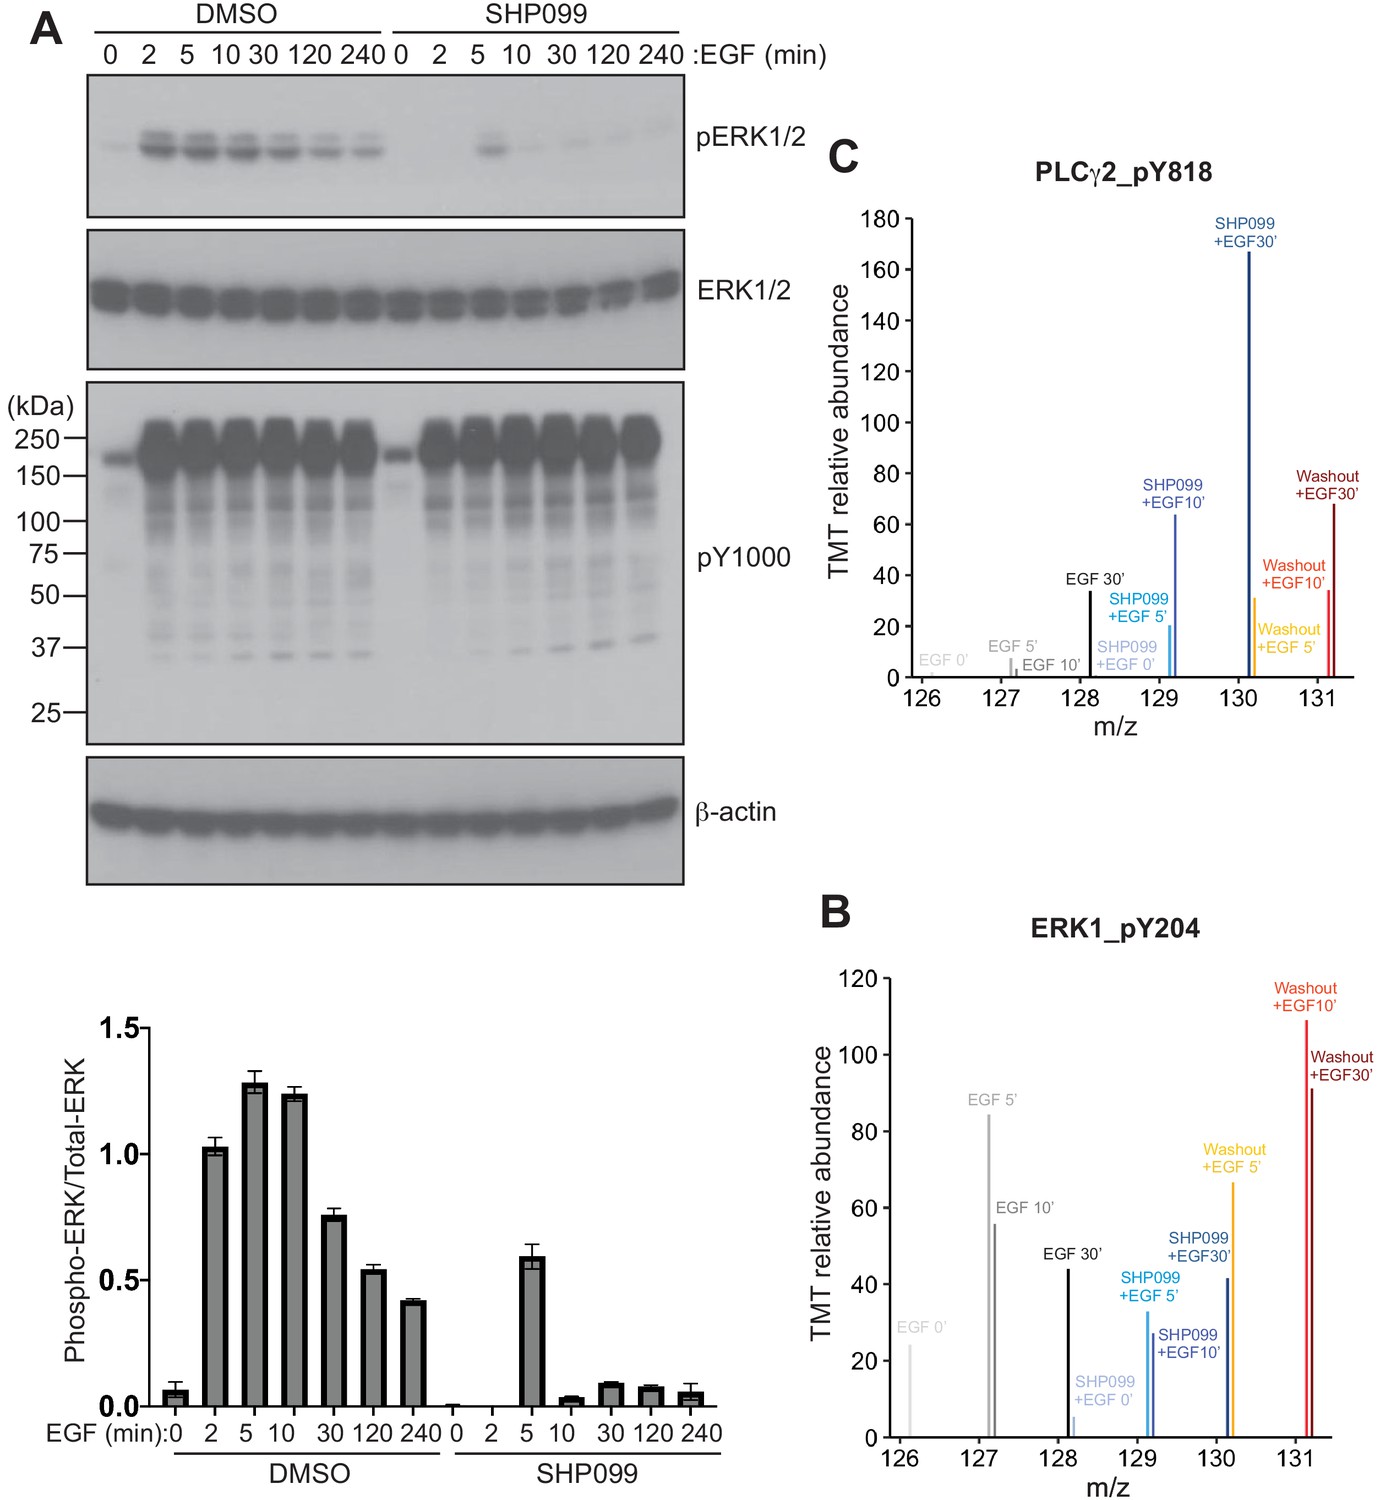
Time course of ERK induction after EGF stimulation and phosphoproteomic data for ERK1 and PLCG2.
(A) Top: Western blot showing the time course of the phosphoERK1/2 response after EGF stimulation. Bottom: Quantification of the ratio of pERK/ERK band intensities, relative to the ratio at t = 2 min. (B, C) TMT relative abundance plotted as a function of peptide m/z values from MS3 spectra, showing quantification of ERK1 (B) and PLCG2 (C) phosphopeptides.
-
Figure 1—figure supplement 1—source data 1
Table showing phospho-ERK1/2 levels normalized to total-ERK1/2 levels (as quantified by measuring band intensities using ImageJ) in MDA-MB-468 cells treated with SHP099 and EGF as indicated.
- https://cdn.elifesciences.org/articles/64251/elife-64251-fig1-figsupp1-data1-v2.xlsx
-
Figure 1—figure supplement 1—source data 2
Table showing peptide m/z values and TMT relative abundance values from MS3 spectrum of ERK1 phosphopeptide.
- https://cdn.elifesciences.org/articles/64251/elife-64251-fig1-figsupp1-data2-v2.xlsx
-
Figure 1—figure supplement 1—source data 3
Table showing peptide m/z values and TMT relative abundance values from MS3 spectrum of PLCγ2 phosphopeptide.
- https://cdn.elifesciences.org/articles/64251/elife-64251-fig1-figsupp1-data3-v2.xlsx
Figure 1—figure supplement 2
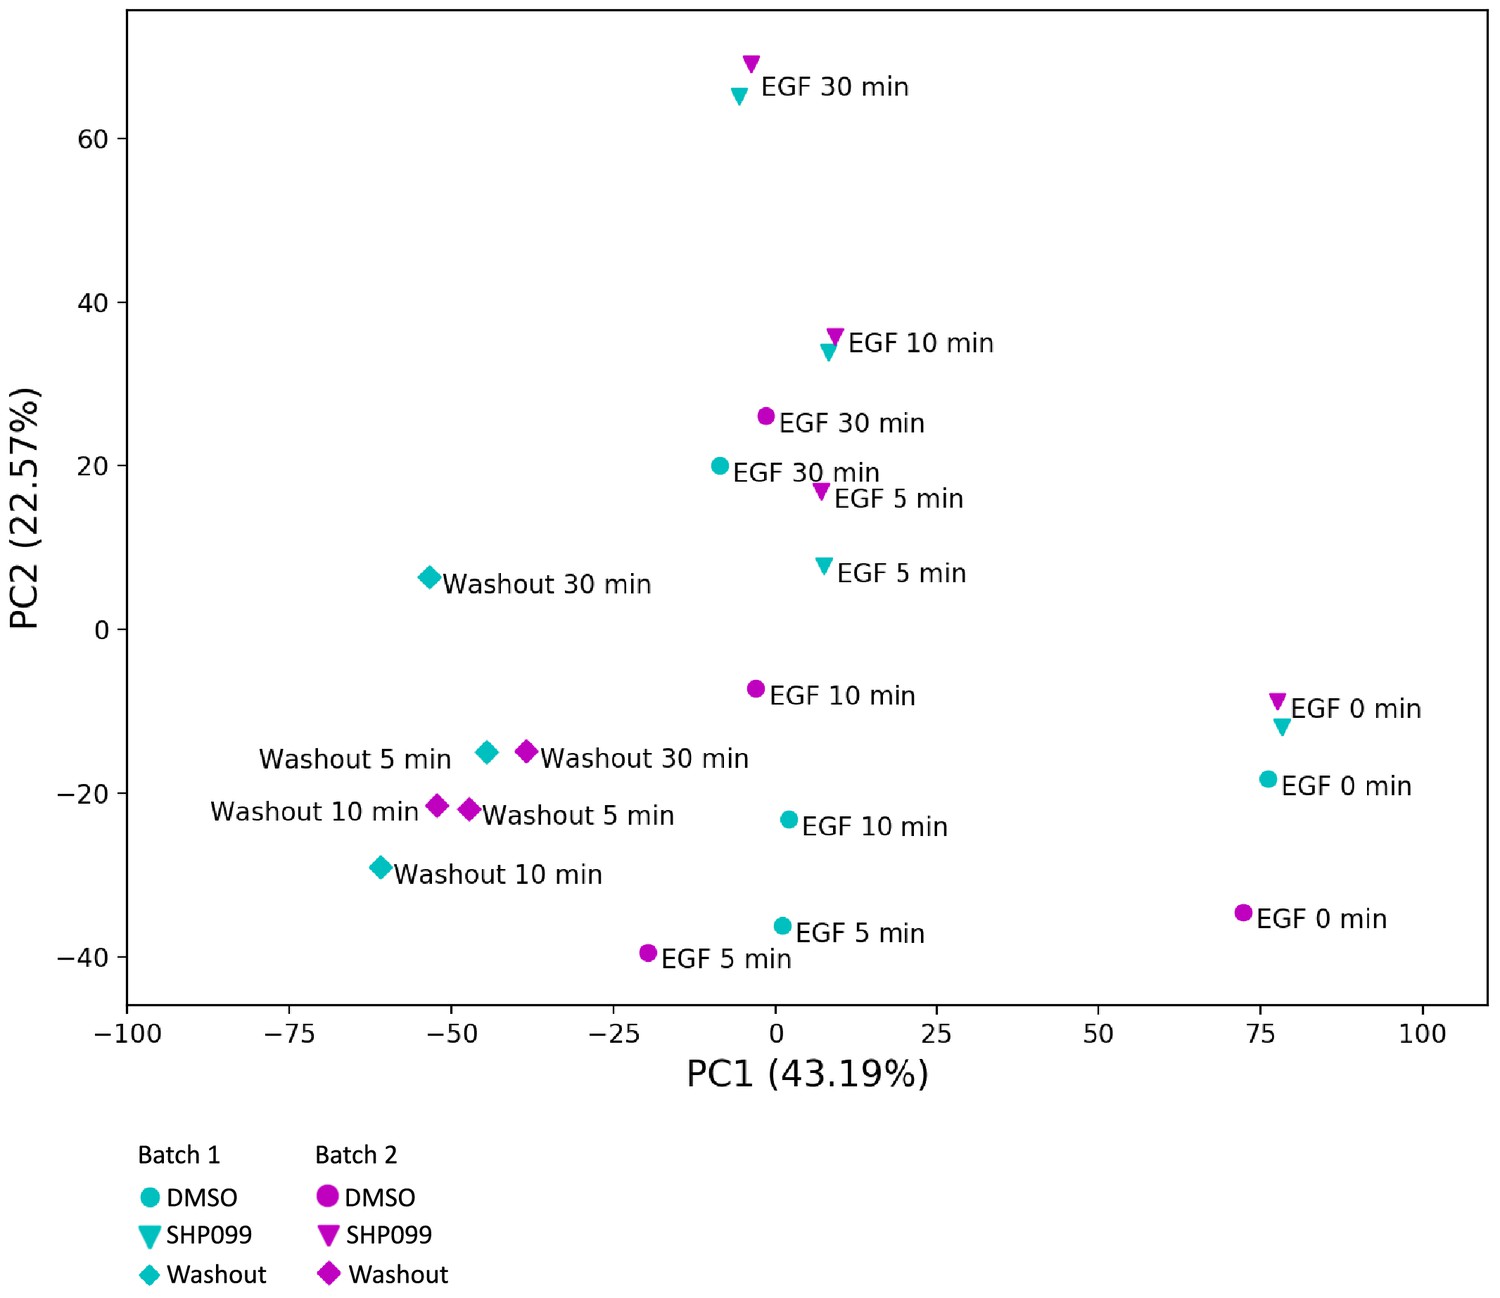
Principal component analysis.
Paired samples from two independent biological replicates are shown. Each datapoint represents a treatment condition in the TMT 11-plex experiment as indicated in the legend. The first two principal components are plotted, and the explained variance of each component is indicated in parentheses.
Figure 1—figure supplement 3
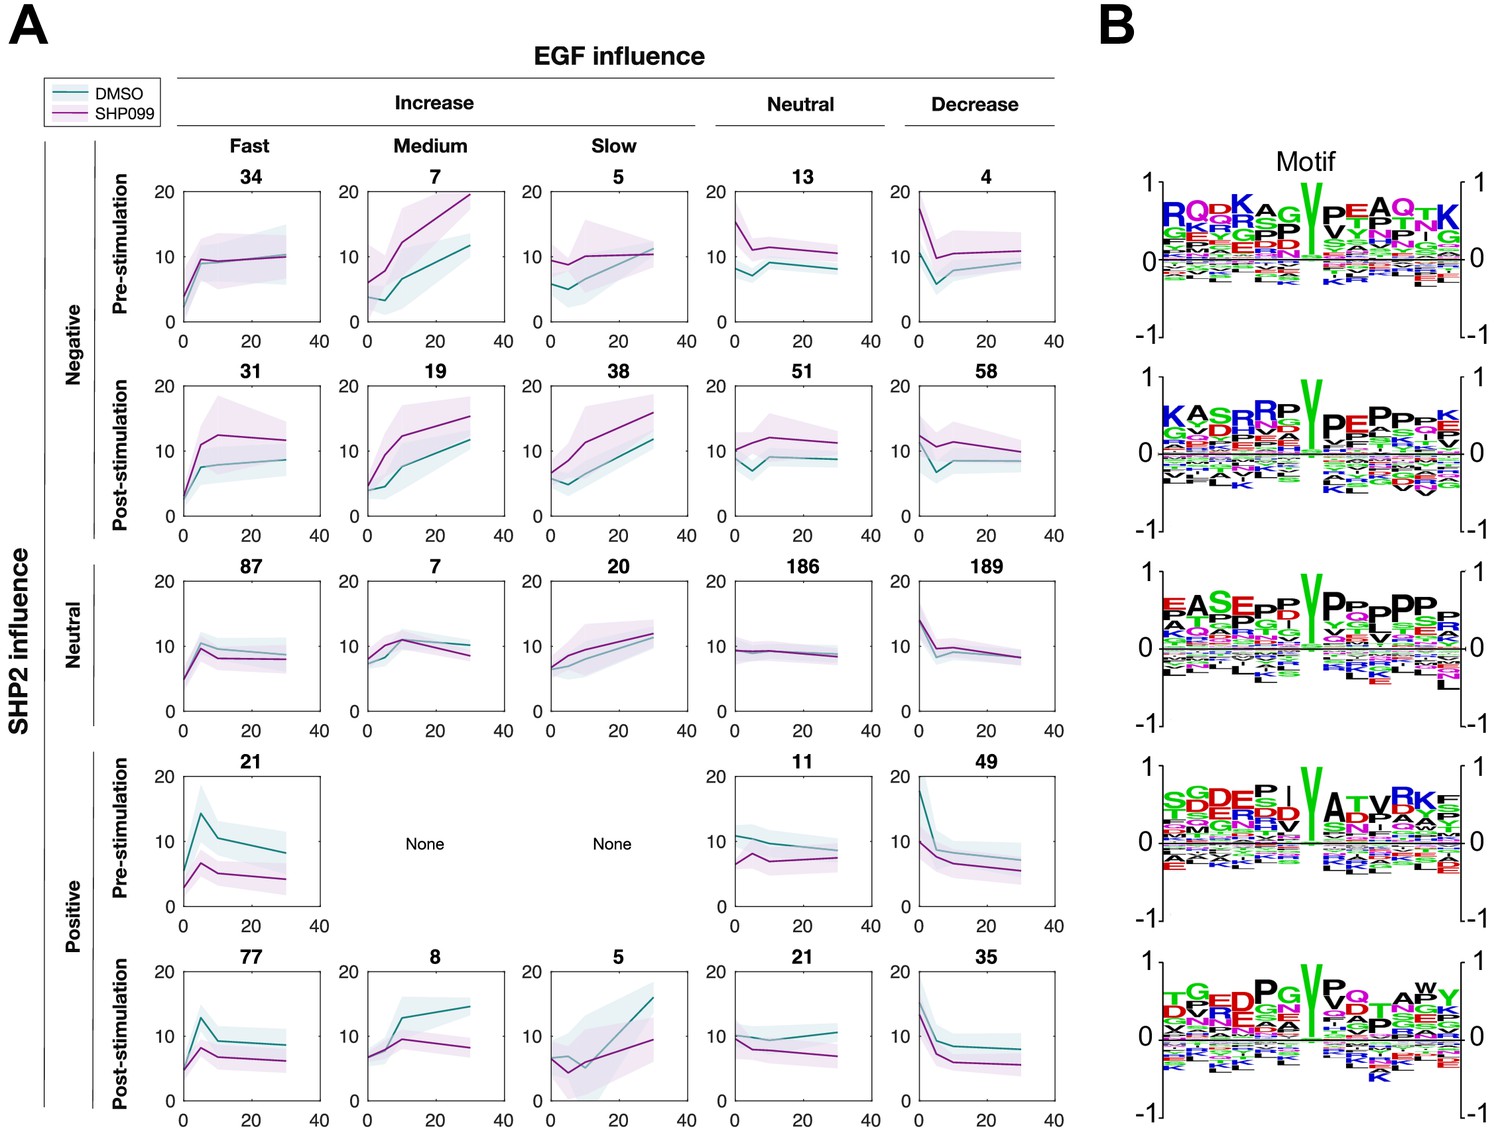
Global analysis of the SHP2 regulated phosphotyrosine proteome.
(A) Classification of phosphorylation time courses based on EGFR and SHP2 dependence. Numbers above each plot indicate the number of phosphopeptides within each class combination. (B) Sequence logos (WebLogo, RRID:SCR_010236) showing amino acid preferences at positions flanking the phosphorylated tyrosine residue for each cluster.
Figure 2 with 2 supplements
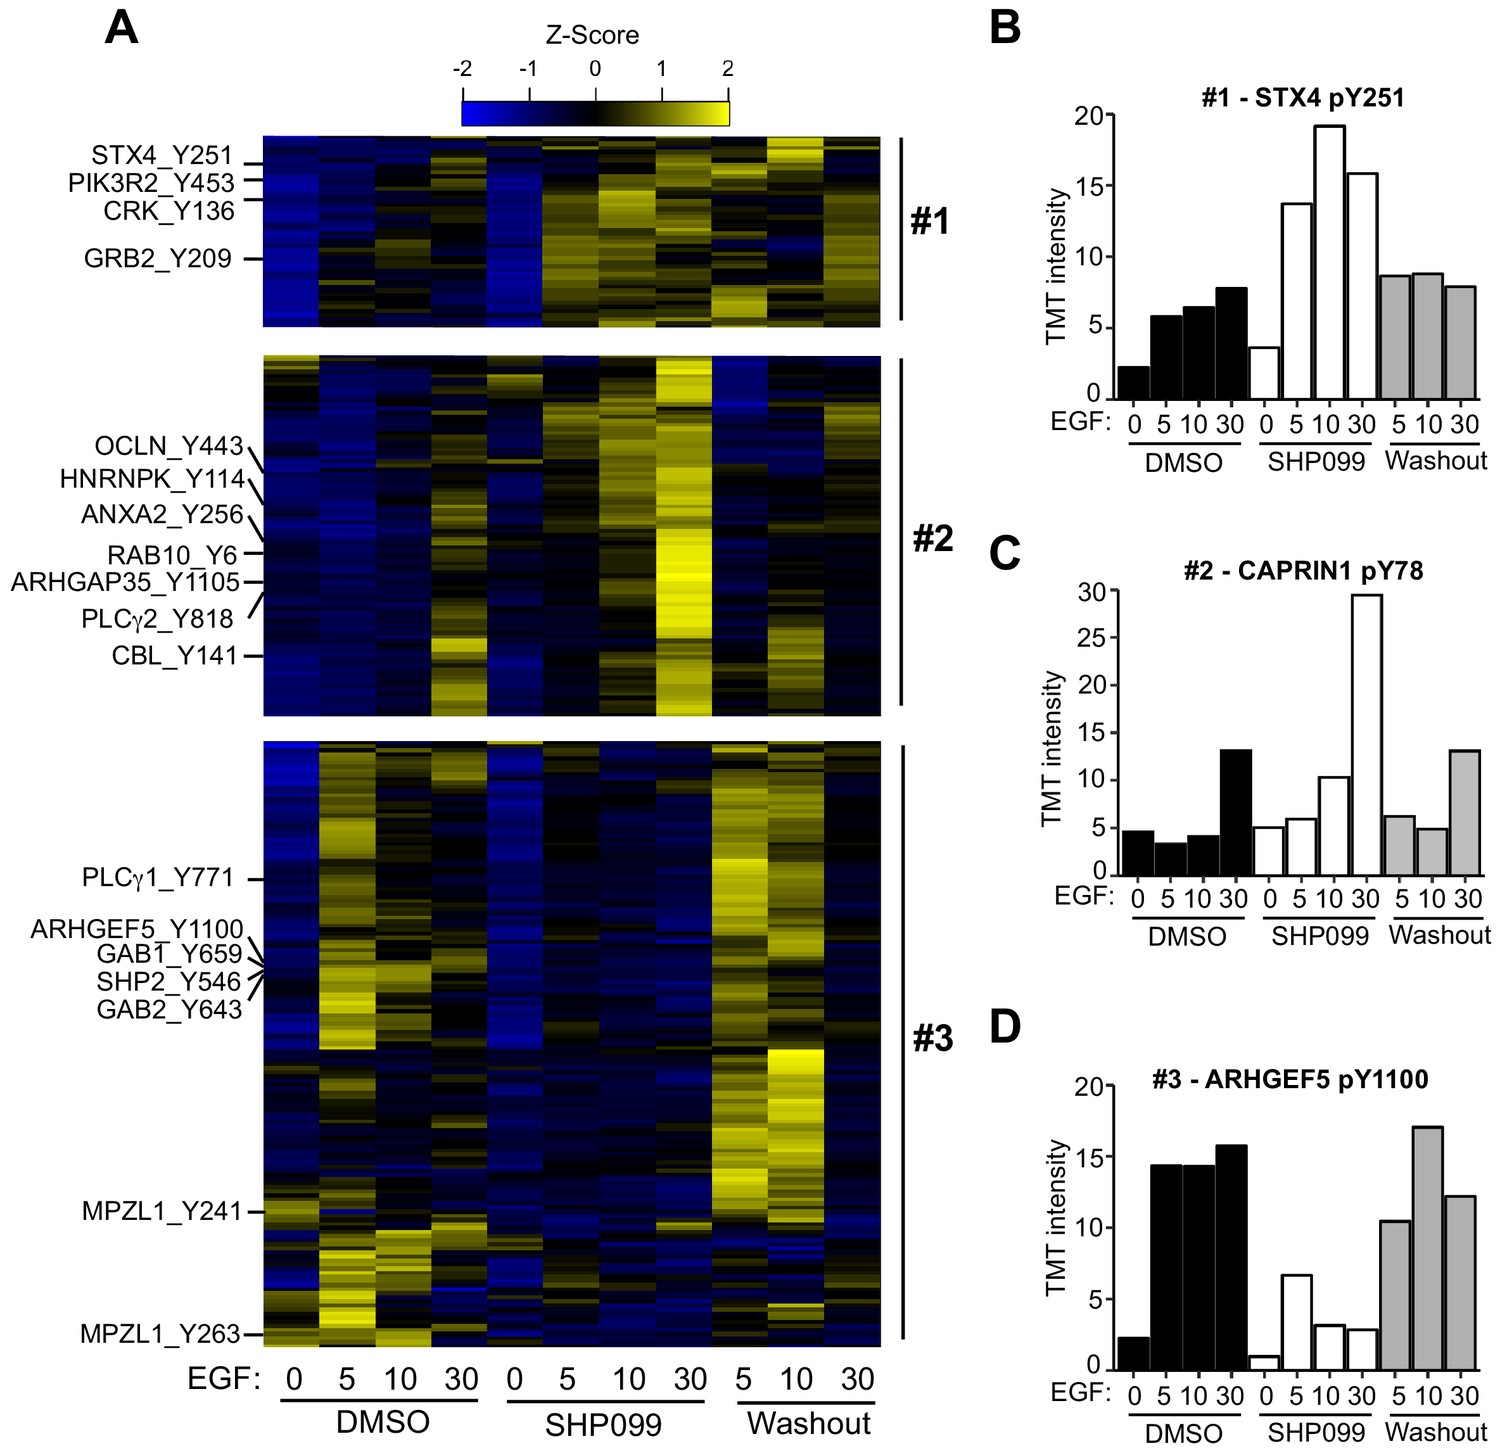
Quantitative phosphoproteomics reveals distinct dynamic responses to SHP2 inhibition.
(A) Heatmap showing three classes of dynamic response in which inhibition of SHP2 modulates the effect of EGF stimulation on pY abundance. Specific examples from each cluster are indicated to the left of the heatmap. (B) Plot of pY abundance as a function of treatment condition for Y251 of STX4, an example of an early substrate-like response pattern to SHP2 inhibition. (C) Plot of pY abundance as a function of treatment condition for Y818 of PLCG2, an example of a late substrate-like response pattern to SHP2 inhibition. (D) Plot of pY abundance as a function of treatment condition for Y1100 of ARHGEF5, an example of a site where the abundance of the mark decreases when SHP2 is inhibited, and rebounds after compound washout.
-
Figure 2—source data 1
Table showing TMT relative abundance values for Y251 of STX4.
- https://cdn.elifesciences.org/articles/64251/elife-64251-fig2-data1-v2.xlsx
-
Figure 2—source data 2
Table showing TMT relative abundance values for Y78 of CAPRIN1.
- https://cdn.elifesciences.org/articles/64251/elife-64251-fig2-data2-v2.xlsx
-
Figure 2—source data 3
Table showing TMT relative abundance values for Y1100 of ARHGEF5.
- https://cdn.elifesciences.org/articles/64251/elife-64251-fig2-data3-v2.xlsx
Figure 2—figure supplement 1
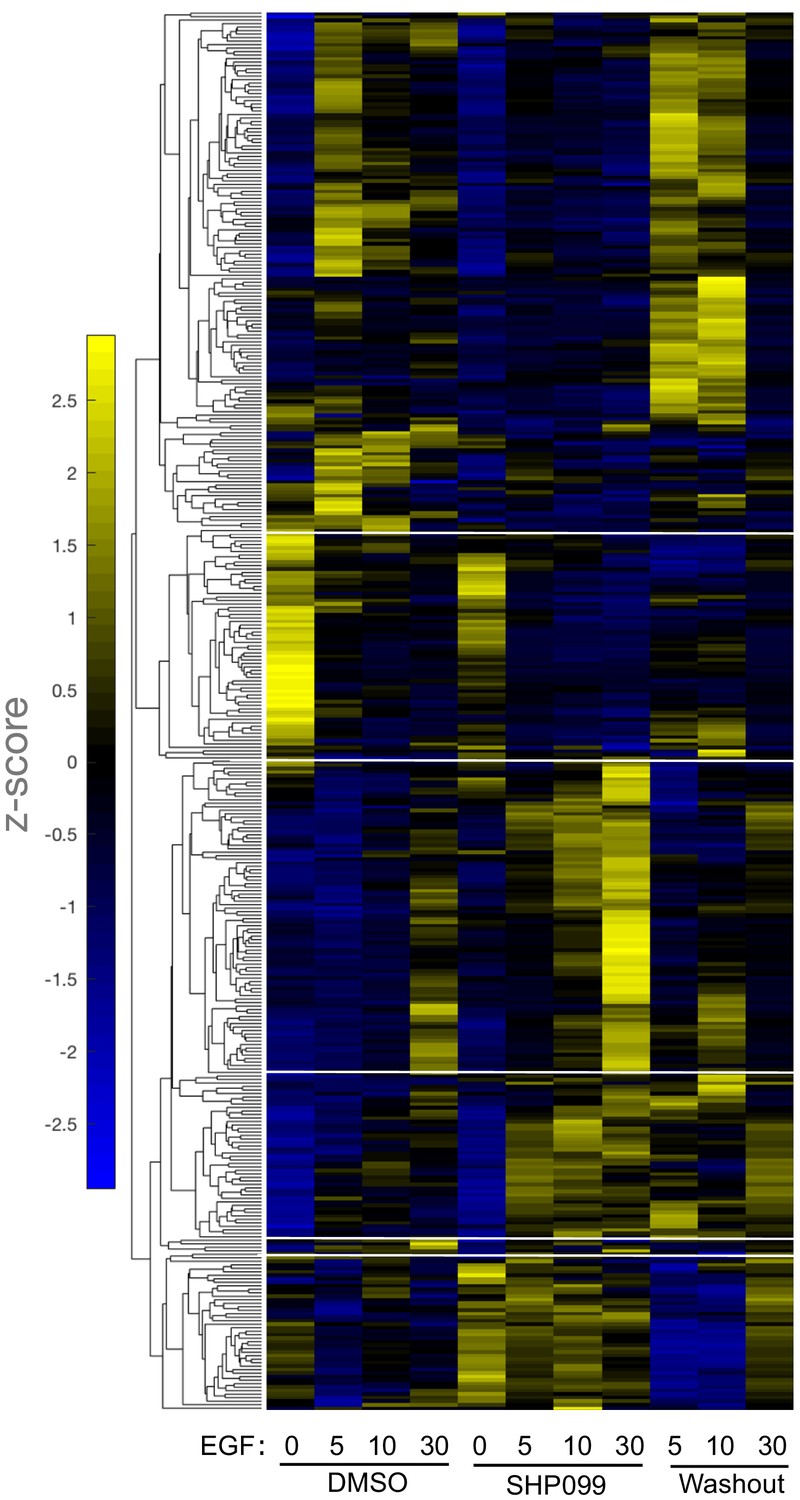
Kinetic pattern of pY response to EGF stimulation under DMSO, SHP099, and washout conditions.
The heatmap shows six different response patterns, based on hierarchical clustering. Source data listing pY sites present in each hierarchical cluster are provided.
-
Figure 2—figure supplement 1—source data 1
Annotated heat maps for proteins in cluster 1.
- https://cdn.elifesciences.org/articles/64251/elife-64251-fig2-figsupp1-data1-v2.pdf
-
Figure 2—figure supplement 1—source data 2
Annotated heat maps for proteins in cluster 2.
- https://cdn.elifesciences.org/articles/64251/elife-64251-fig2-figsupp1-data2-v2.pdf
-
Figure 2—figure supplement 1—source data 3
Annotated heat maps for proteins in cluster 3.
- https://cdn.elifesciences.org/articles/64251/elife-64251-fig2-figsupp1-data3-v2.pdf
-
Figure 2—figure supplement 1—source data 4
Annotated heat maps for proteins in cluster 4.
- https://cdn.elifesciences.org/articles/64251/elife-64251-fig2-figsupp1-data4-v2.pdf
-
Figure 2—figure supplement 1—source data 5
Annotated heat maps for proteins in cluster 5.
- https://cdn.elifesciences.org/articles/64251/elife-64251-fig2-figsupp1-data5-v2.pdf
-
Figure 2—figure supplement 1—source data 6
Annotated heat maps for proteins in cluster 6.
- https://cdn.elifesciences.org/articles/64251/elife-64251-fig2-figsupp1-data6-v2.pdf
-
Figure 2—figure supplement 1—source data 7
Alphabetical list of proteins in cluster 1, with pY sites as indicated.
- https://cdn.elifesciences.org/articles/64251/elife-64251-fig2-figsupp1-data7-v2.csv
-
Figure 2—figure supplement 1—source data 8
Alphabetical list of proteins in cluster 2, with pY sites as indicated.
- https://cdn.elifesciences.org/articles/64251/elife-64251-fig2-figsupp1-data8-v2.csv
-
Figure 2—figure supplement 1—source data 9
Alphabetical list of proteins in cluster 3, with pY sites as indicated.
- https://cdn.elifesciences.org/articles/64251/elife-64251-fig2-figsupp1-data9-v2.csv
-
Figure 2—figure supplement 1—source data 10
Alphabetical list of proteins in cluster 4, with pY sites as indicated.
- https://cdn.elifesciences.org/articles/64251/elife-64251-fig2-figsupp1-data10-v2.csv
-
Figure 2—figure supplement 1—source data 11
Alphabetical list of proteins in cluster 5, with pY sites as indicated.
- https://cdn.elifesciences.org/articles/64251/elife-64251-fig2-figsupp1-data11-v2.csv
-
Figure 2—figure supplement 1—source data 12
Alphabetical list of proteins in cluster 6, with pY sites as indicated.
- https://cdn.elifesciences.org/articles/64251/elife-64251-fig2-figsupp1-data12-v2.csv
Figure 2—figure supplement 2
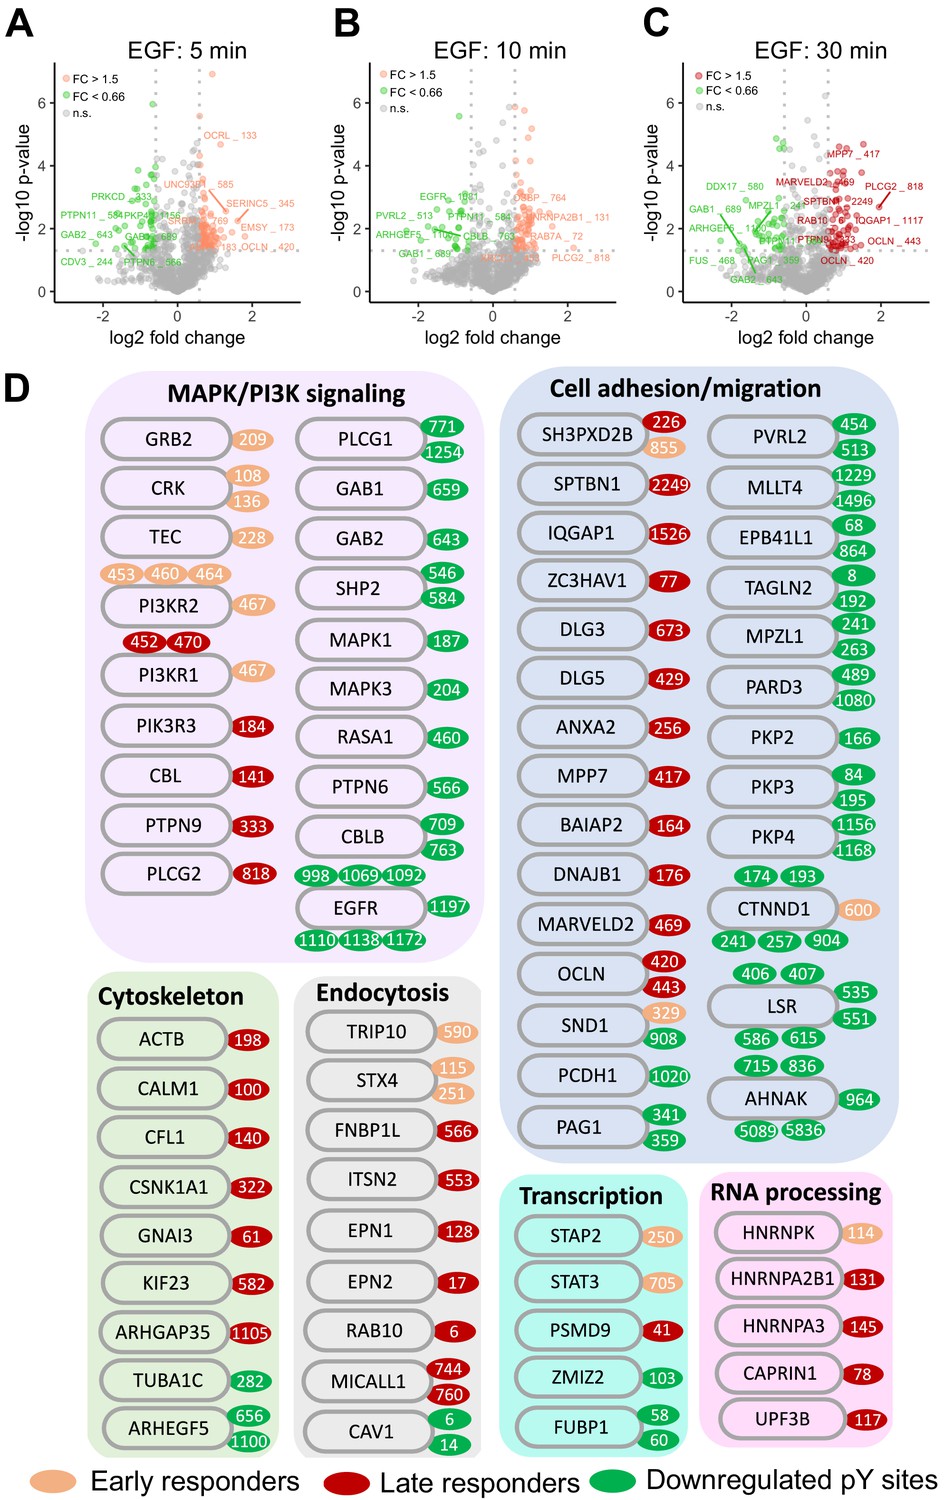
Classification of SHP099-responsive phosphotyrosine sites based on EGF temporal dynamics and function.
(A–C) Semi-log volcano plots of p-value as a function of pY fold-change after EGF stimulation for 5 min (A), 10 min (B), and 30 min (C). Sites exhibiting biologically significant increases (p<0.05, two independent biological replicates of the phosphoproteomics experiment, and an increase >1.5-fold) are colored salmon (A, B) or red (C). Sites exhibiting statistically biologically significant decreases (p<0.05, two independent biological replicates of the phosphoproteomics experiment, and a decrease >1.5-fold) are green. (D) Functional classification of proteins whose pY sites display statistically significant changes in response to SHP099 treatment. Classes were assigned using Gene Ontology categories and literature curation.
-
Figure 2—figure supplement 2—source data 1
Table showing p-values and fold-changes in TMT relative abundance signal for all pY sites in untreated- or SHP099-treated-MDA-MB-468 cells after EGF stimulation for 5 min.
- https://cdn.elifesciences.org/articles/64251/elife-64251-fig2-figsupp2-data1-v2.xlsx
-
Figure 2—figure supplement 2—source data 2
Table showing p-values and fold-changes in TMT relative abundance signal for all pY sites in untreated- or SHP099-treated-MDA-MB-468 cells after EGF stimulation for 10 min.
- https://cdn.elifesciences.org/articles/64251/elife-64251-fig2-figsupp2-data2-v2.xlsx
-
Figure 2—figure supplement 2—source data 3
Table showing p-values and fold-changes in TMT relative abundance signal for all pY sites in untreated- or SHP099-treated-MDA-MB-468 cells after EGF stimulation for 30 min.
- https://cdn.elifesciences.org/articles/64251/elife-64251-fig2-figsupp2-data3-v2.xlsx
Figure 3 with 1 supplement
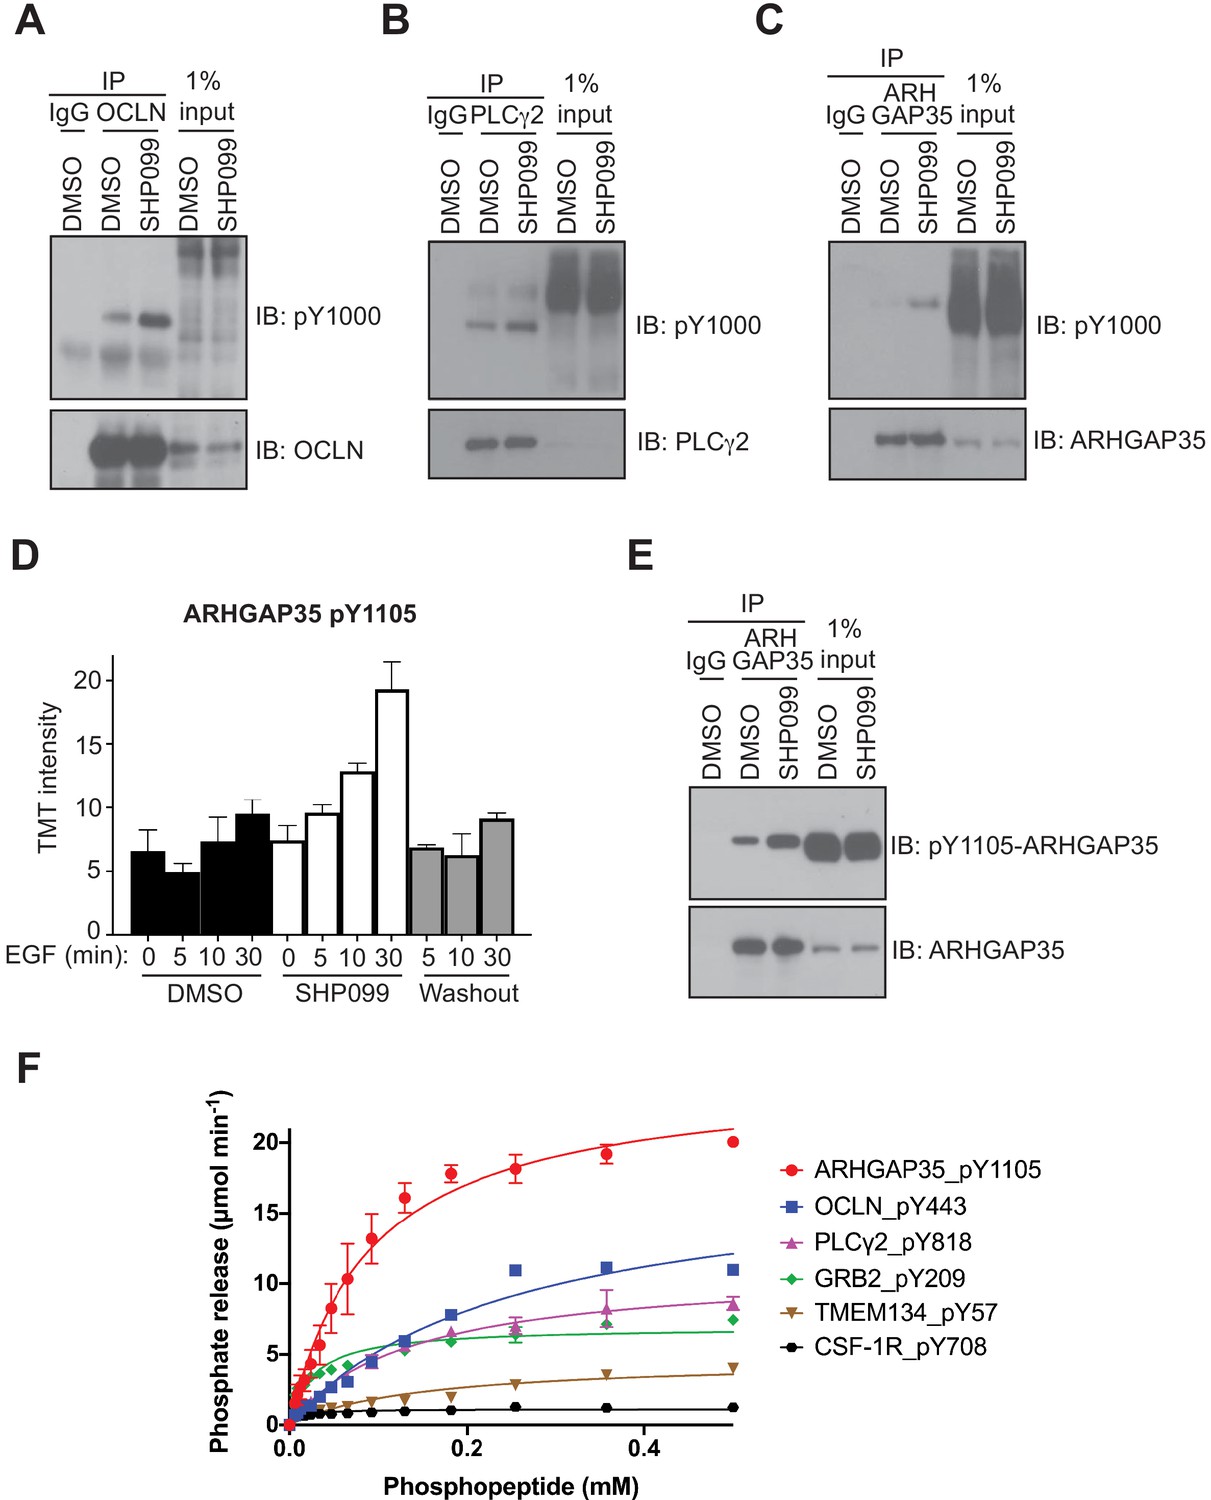
Evaluation of occludin, ARHGAP35, and PLCγ2 as SHP2 substrates.
MDA-MB-468 cells pre-treated with DMSO carrier or SHP099 (10 µM) for 2 hr were mock treated or stimulated with EGF (10 nM) for 10 min (A) or 30 min (B, C, and E). Total cell lysates were immunoprecipitated with occludin (A), PLCγ2 (B), or ARHGAP35 (C, E) antibodies and the eluted samples were subjected to Western blotting with the phosphotyrosine antibody pY1000 (A–C), pY1105-ARHGAP35 (E), and anti-protein antibodies as indicated (A–C, E). Input samples represent 1% of total cell lysate. Non-specific IgG was used as a negative control. (D) Plot of pY abundance as a function of treatment condition for Y1105 of ARHGAP35. (F) Dephosphorylation activity of full-length wild-type SHP2, activated with 6 µM bisphosphorylated IRS-1 peptide [SLNY(p)IDLDLVKdPEG8-LSTY(p)ASINFQK], toward synthetic phosphopeptides (OCLN_pY443, PLCG2_pY818, GRB2_pY209, ARHGAP35_1105, TMEM134_pY57, CSF-1R_pY708). Immunoprecipitation – Western blot assays are representative of at least two independent biological replicates.
-
Figure 3—source data 1
Table showing TMT relative abundance values for Y1105 of ARHGAP35.
- https://cdn.elifesciences.org/articles/64251/elife-64251-fig3-data1-v2.xlsx
-
Figure 3—source data 2
Table showing micromoles of phosphate released per minute for all phosphopeptides tested for dephosphorylation by IRS1-activated wild-type SHP2.
- https://cdn.elifesciences.org/articles/64251/elife-64251-fig3-data2-v2.xlsx
Figure 3—figure supplement 1
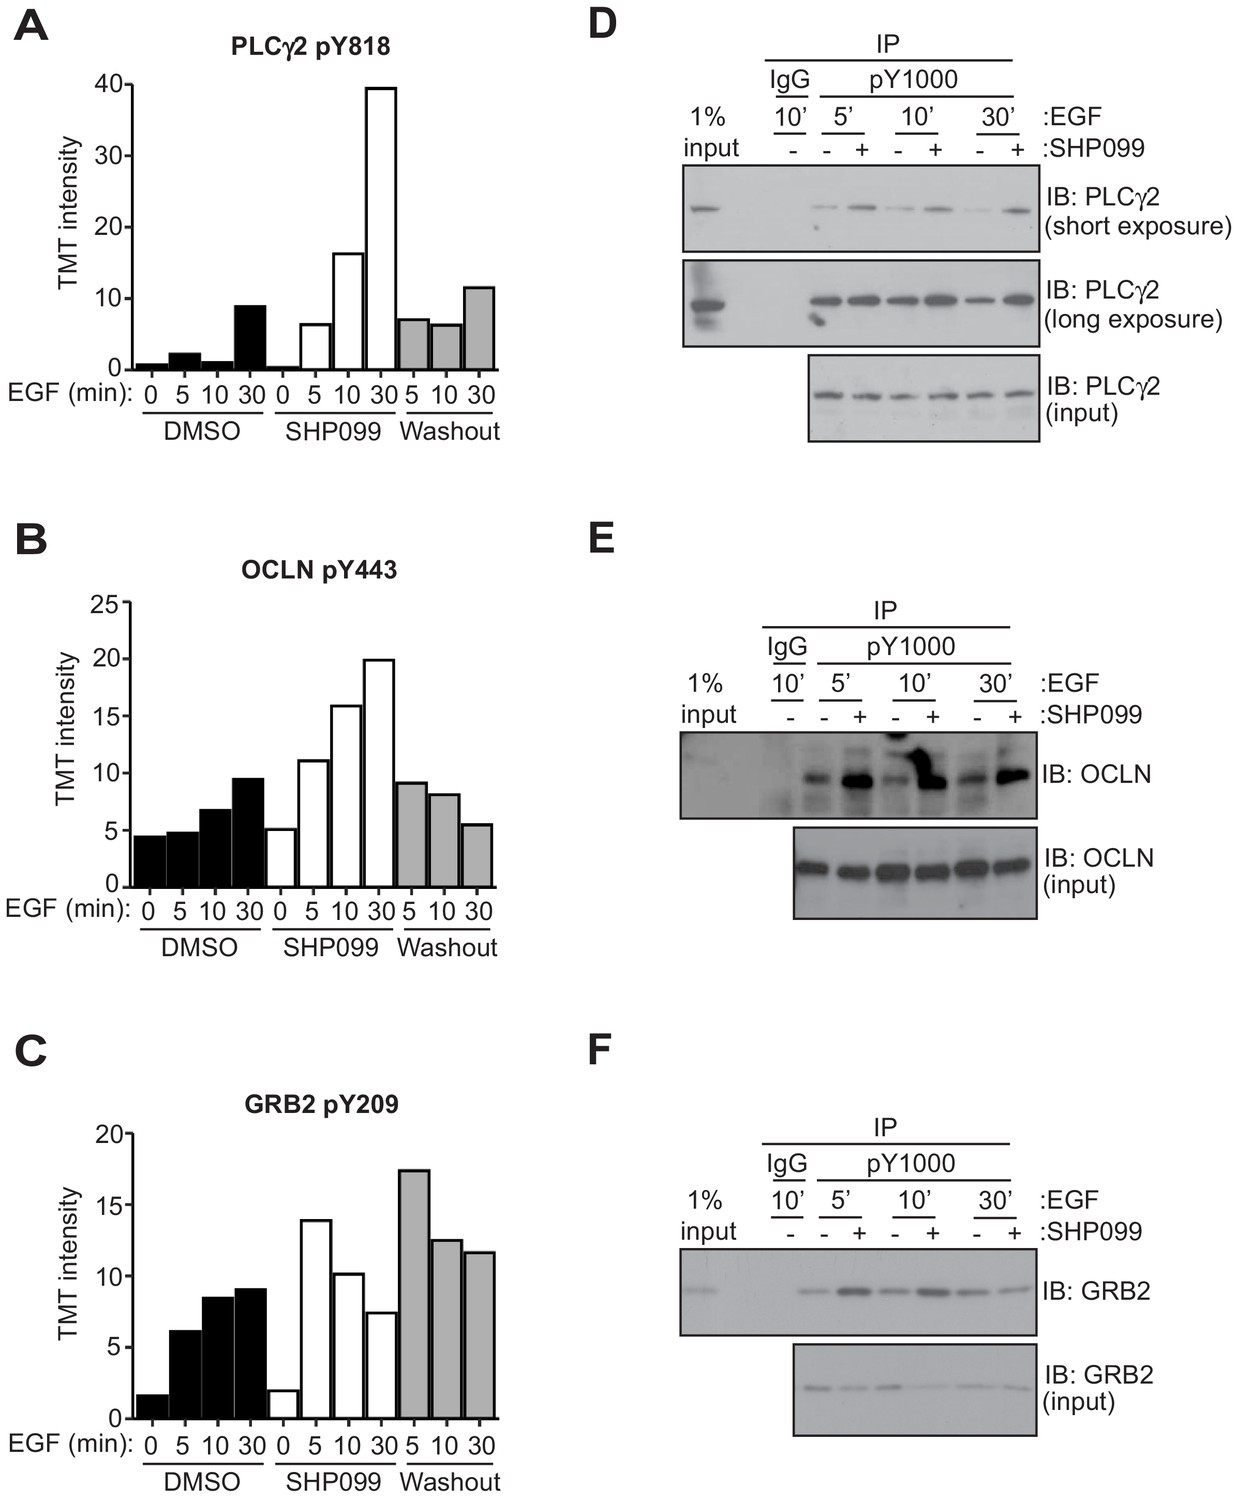
Evaluation of GRB2, occludin, and PLCγ2 as SHP2 substrates.
Tandem mass tag (TMT) intensity plots of pY phophsphopeptide abundance as a function of treatment condition for Y818 of PLCγ2 (A), pY443 of OCLN (B) and pY209 of GRB2 (C). (D, E, and F) MDA-MB-468 cells pre-treated with DMSO carrier or SHP099 (10 µM) for 2 hr were mock treated or stimulated with EGF (10 nM) for 5 min, 10 min, or 30 min. Total cell lysates were immunoprecipitated with the anti-phosphotyrosine antibody, pY1000, and the eluted samples were subjected to Western blotting with anti-PLCγ2 (D), anti-OCLN (E), or anti-GRB2 (F) antibodies. Input samples represent 1% of total cell lysate. Non-specific IgG was used as a negative control. Western blot results are representative of at least n = 2 independent biological replicates.
-
Figure 3—figure supplement 1—source data 1
Table showing TMT relative abundance values for Y818 of PLCG2.
- https://cdn.elifesciences.org/articles/64251/elife-64251-fig3-figsupp1-data1-v2.xlsx
-
Figure 3—figure supplement 1—source data 2
Table showing TMT relative abundance values for Y443 of OCLN.
- https://cdn.elifesciences.org/articles/64251/elife-64251-fig3-figsupp1-data2-v2.xlsx
-
Figure 3—figure supplement 1—source data 3
Table showing TMT relative abundance values for Y209 of GRB2.
- https://cdn.elifesciences.org/articles/64251/elife-64251-fig3-figsupp1-data3-v2.xlsx
Figure 4 with 1 supplement
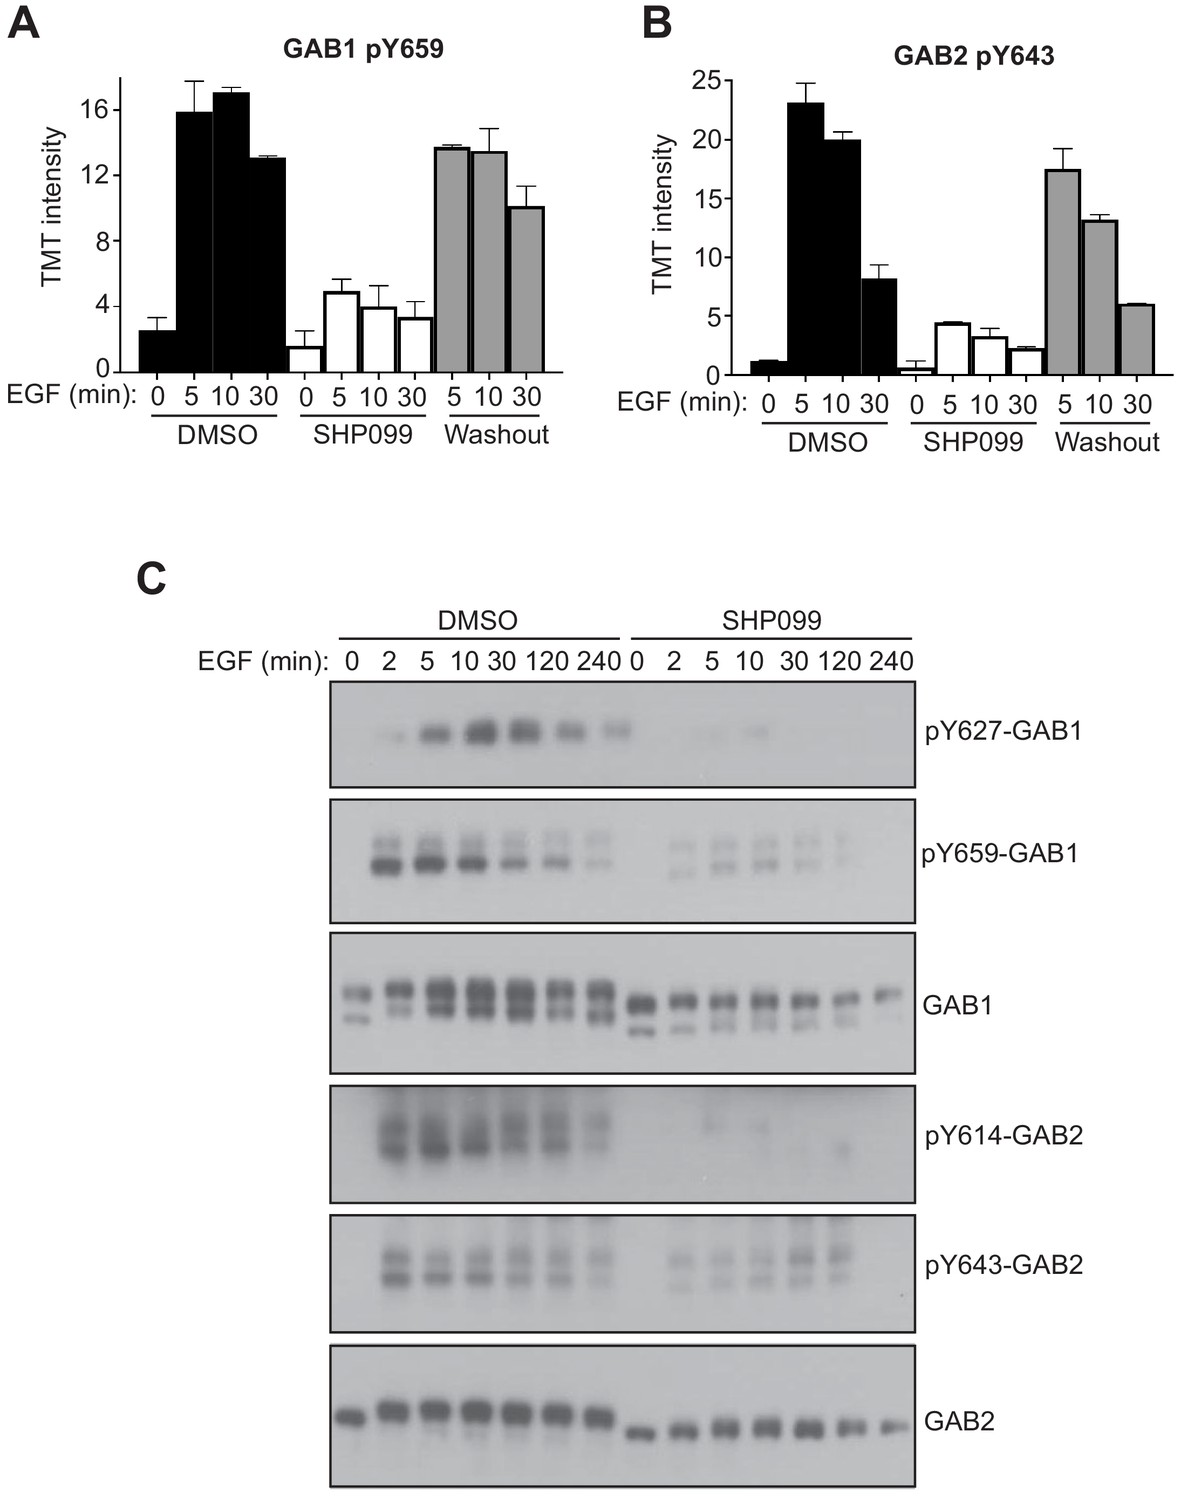
SHP2 inhibition results in reduced pY abundance at its interaction motifs.
(A, B) TMT signal-to-noise intensities of GAB1 pY659 (A) and GAB2 pY643 (B) peptides showing dynamic changes in phosphorylation under DMSO- (solid line) and SHP099-treated (dotted line) conditions. (C) MDA-MB-468 cells pre-treated with DMSO carrier or SHP099 (10 µM) for 2 hr were mock treated or stimulated with EGF (10 nM). Total GAB1, total GAB2, GAB1 pY659, and GAB2 pY643 were analyzed by Western blot with both anti-protein and phosphospecific antibodies as a function of time after EGF addition. Western blot results are representative of at least two independent biological replicates.
-
Figure 4—source data 1
Table showing TMT relative abundance values for Y659 of GAB1.
- https://cdn.elifesciences.org/articles/64251/elife-64251-fig4-data1-v2.xlsx
-
Figure 4—source data 2
Table showing TMT relative abundance values for Y643 of GAB2.
- https://cdn.elifesciences.org/articles/64251/elife-64251-fig4-data2-v2.xlsx
Figure 4—figure supplement 1
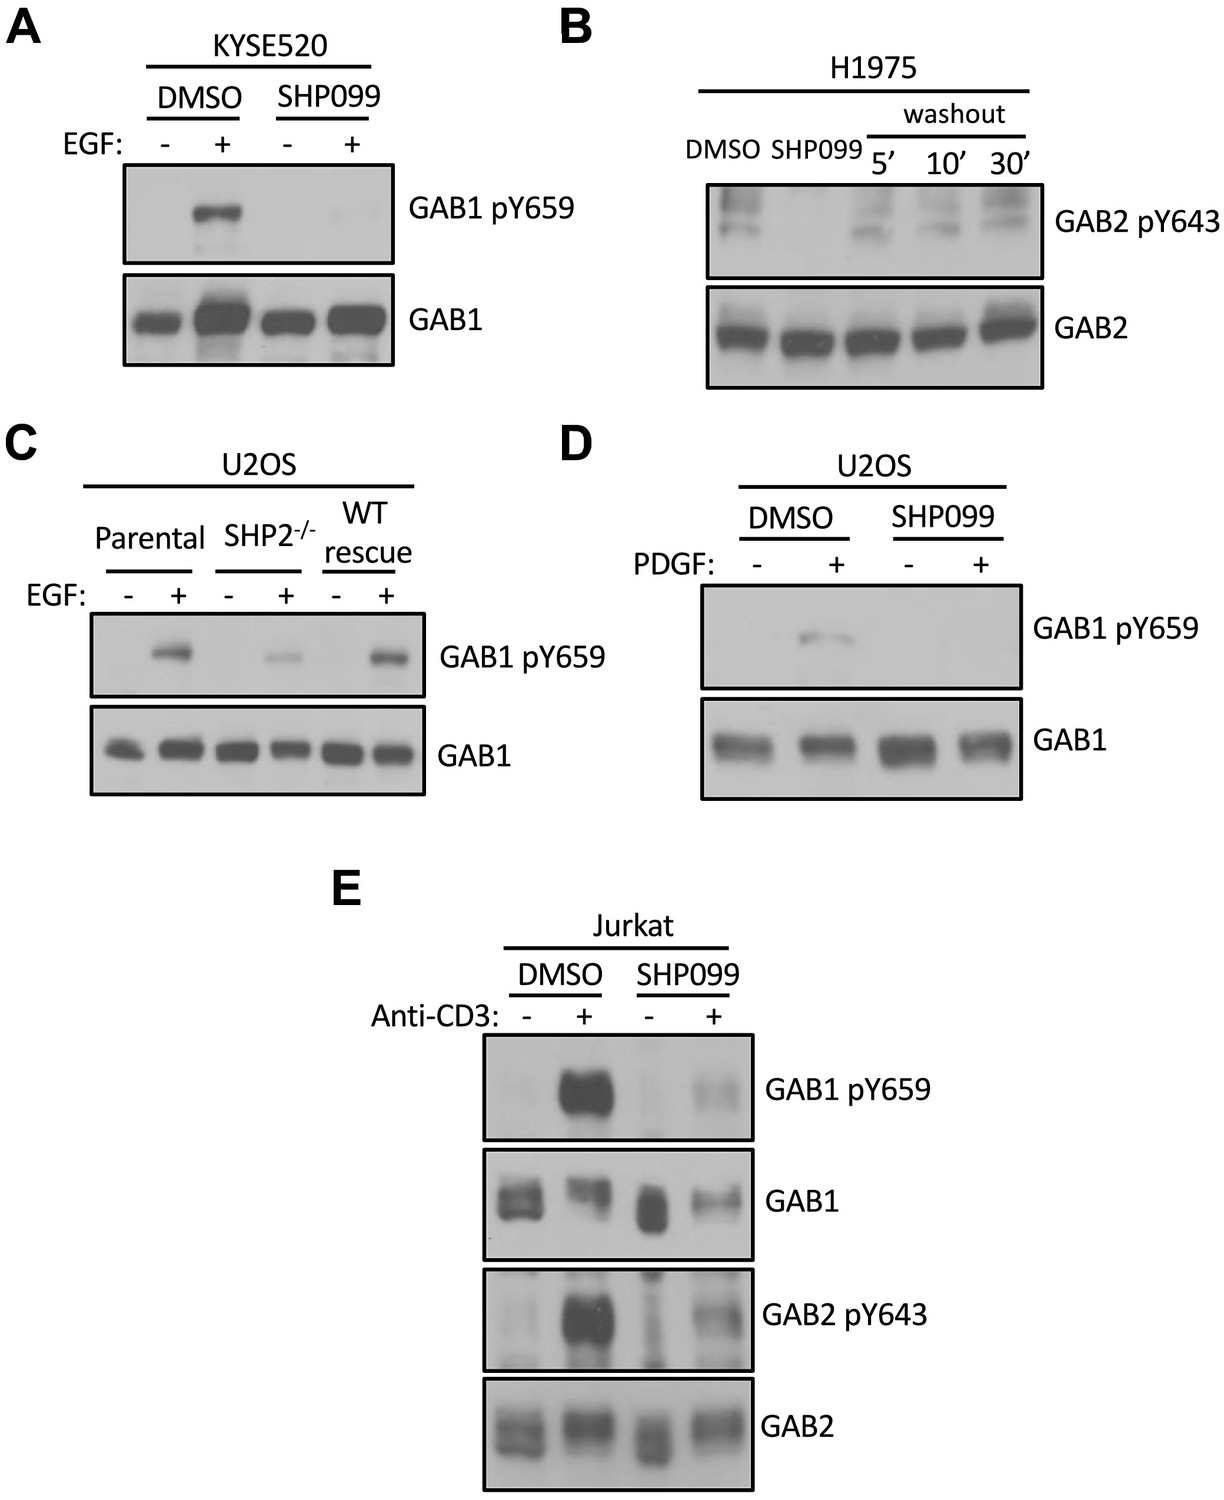
SHP2 regulates GAB1 and GAB2 phosphorylation in multiple cellular contexts.
(A) KYSE520 cells pre-treated with DMSO carrier or SHP099 (10 uM) for 2 hr were left uninduced or induced with EGF (10 nM) for 10 min. Whole-cell lysates were then subjected to immunoblotting with GAB1-pY659 and GAB1 antibodies. (B) H1975 cells were treated with SHP099 (10 uM) for 2 hr, washed three times with warm HBSS buffer, and cultured in full growth medium (RPMI-1640 supplemented with 10% FBS) for the indicated time periods. Lysates were then blotted with pY643-GAB2 and GAB2 antibodies. (C) Whole-cell extracts from parental-, SHP2 knockout-, and SHP2 knockout stably expressing wild-type SHP2 U2OS cell lines were blotted with pY659-GAB1 and GAB1 antibodies. (D) DMSO- and SHP099-treated U2OS cells were stimulated with PDGF (5 nM) and probed for pY659-GAB1 and GAB1. (E) DMSO- and SHP099-treated Jurkat cells were stimulated with anti-CD3 antibody (10 µg/ml) and subjected to immunoblotting with pY659-GAB1, pY643-GAB2, GAB1, and GAB2 antibodies. Western blot results are representative of at least n = 2 independent biological replicates.
Figure 5 with 3 supplements
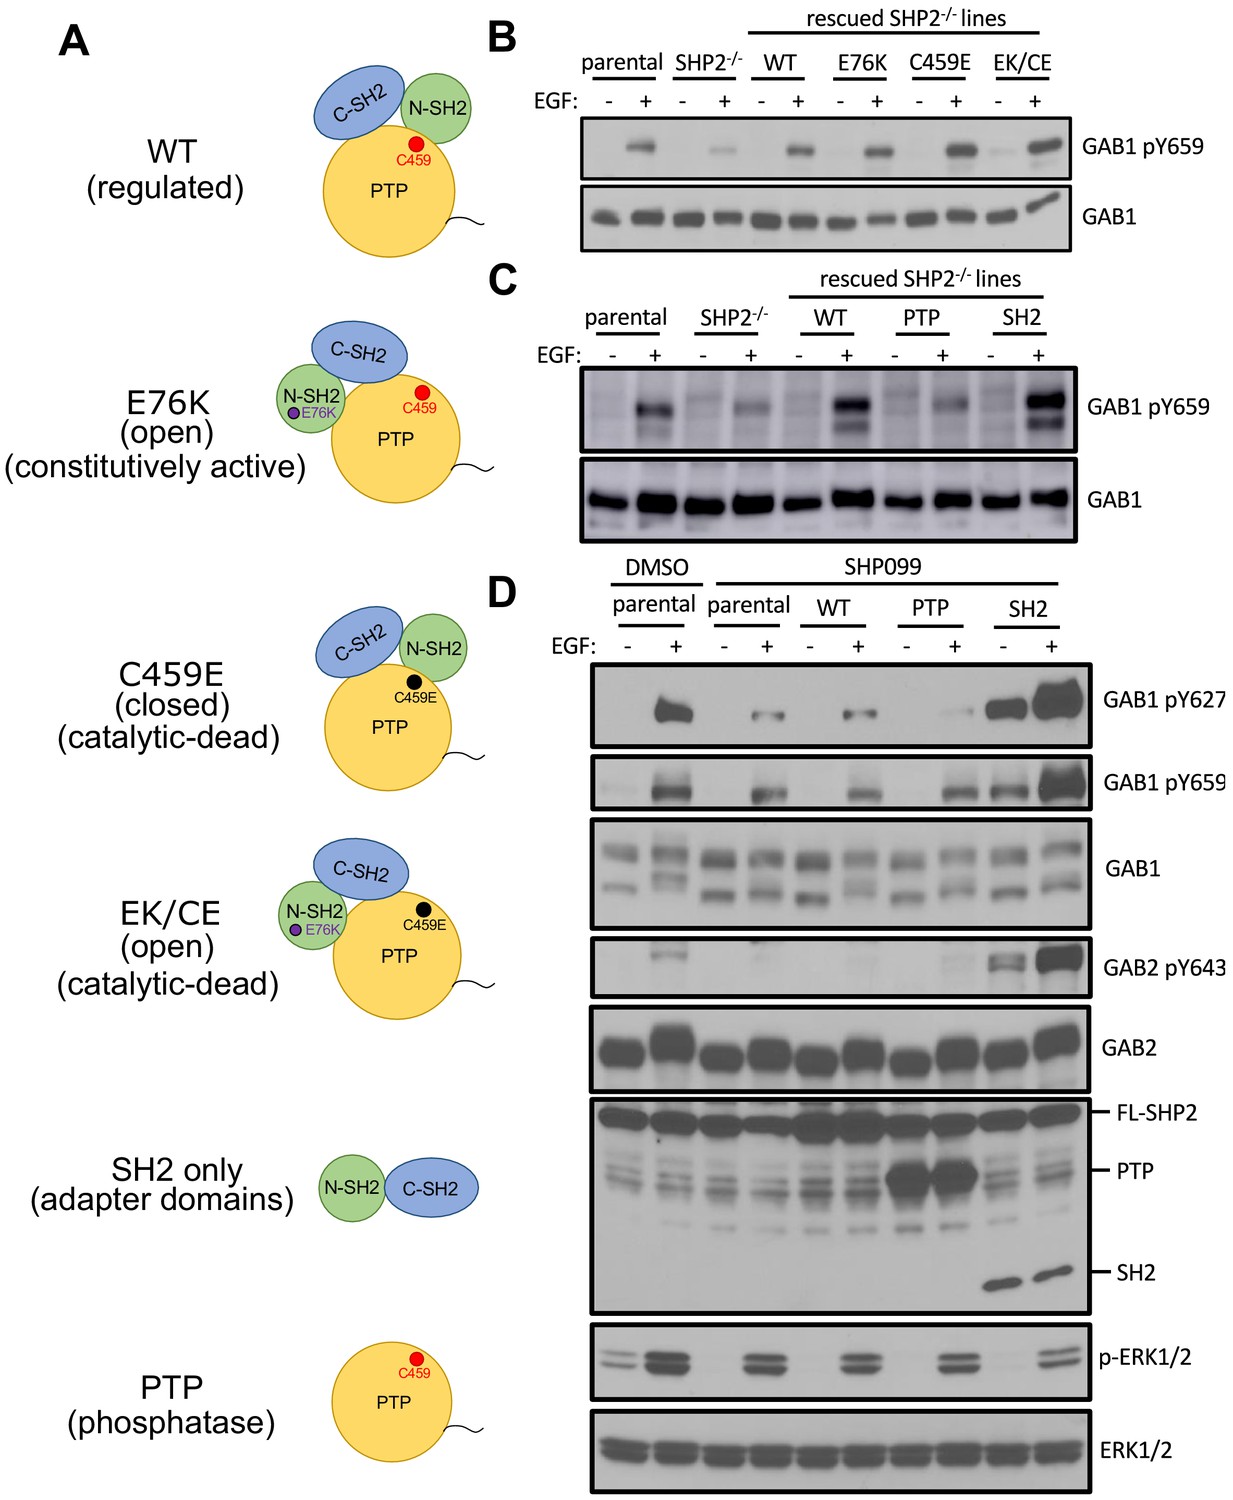
The SH2 domains of SHP2, but not its PTP domain, protect specific GAB1 and GAB2 pY marks.
(A) Schematic representation of wild-type, point mutants, and deletion constructs of SHP2 tested. (B, C) Parental-, SHP2 knockout-, or SHP2 knockout U2OS cells stably expressing various SHP2 ‘rescue’ constructs were cultured with or without EGF stimulation (10 nM) for 10 min. Cells were lysed and subjected to Western blotting using anti-pY659-GAB1 and anti-GAB1 antibodies. (D) MDA-MB-468 cells stably expressing wild-type, PTP, or SH2 domains pre-treated with SHP099 were stimulated with EGF and immunoblotted after lysis using the specified antibodies. Western blot results are representative of at least n = 2 independent biological replicates.
Figure 5—figure supplement 1
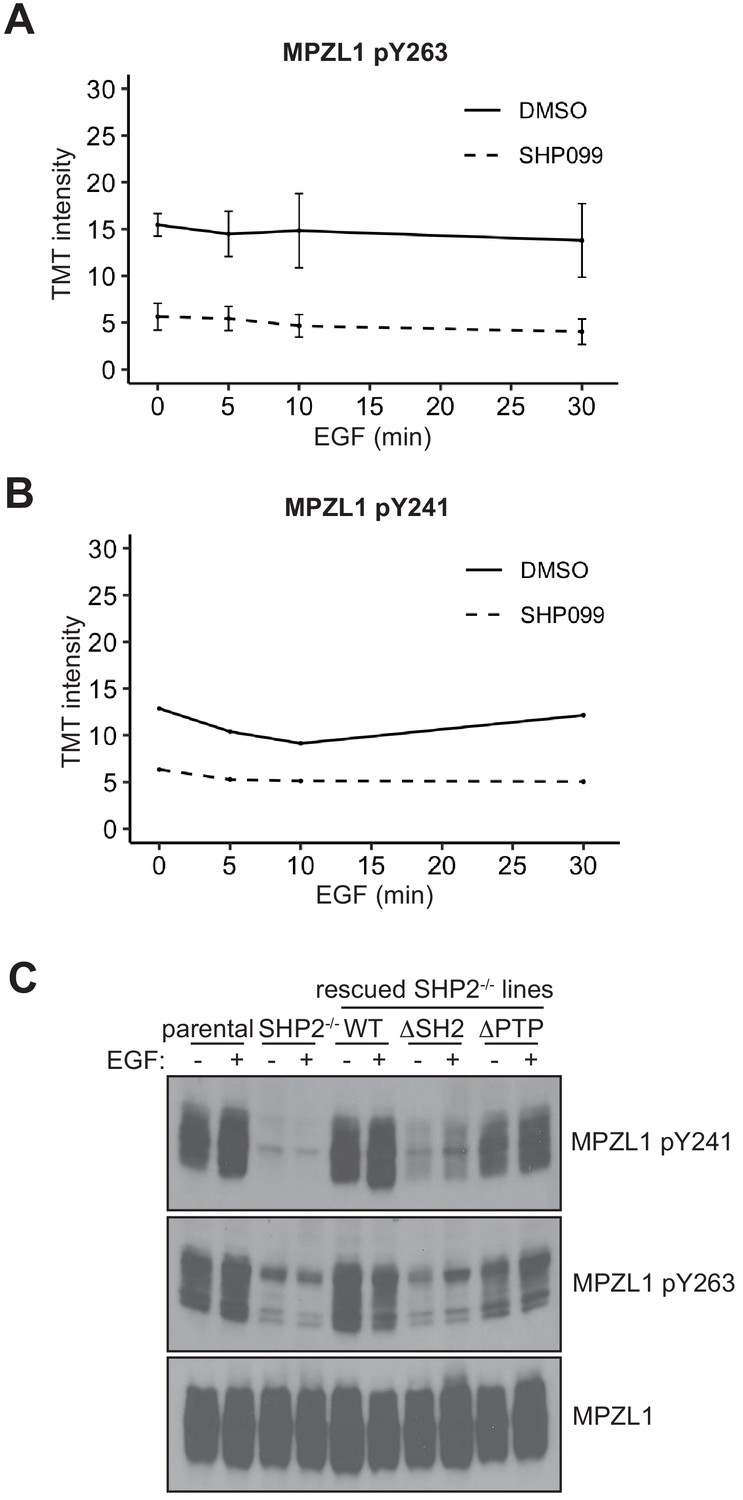
SHP2 protects MPZL1 phosphotyrosine residues.
(A, B) TMT signal-to-noise intensities of MPZL1 peptides showing phosphorylation changes between DMSO- (solid line) and SHP099-treated (dotted line) groups. (C) Unstimulated or EGF-stimulated parental-, SHP2 knockout-, and SHP2 knockout stably expressing wild-type, PTP, and SH2 U2OS cell lines were blotted for pY263-MPZL1, pY241-MPZL1, and MPZL1. Western blot results are representative of at least two independent biological replicates.
-
Figure 5—figure supplement 1—source data 1
Table showing TMT relative abundance values for Y263 of MPZL1.
- https://cdn.elifesciences.org/articles/64251/elife-64251-fig5-figsupp1-data1-v2.xlsx
-
Figure 5—figure supplement 1—source data 2
Table showing TMT relative abundance values for Y241 of MPZL1.
- https://cdn.elifesciences.org/articles/64251/elife-64251-fig5-figsupp1-data2-v2.xlsx
Figure 5—figure supplement 2
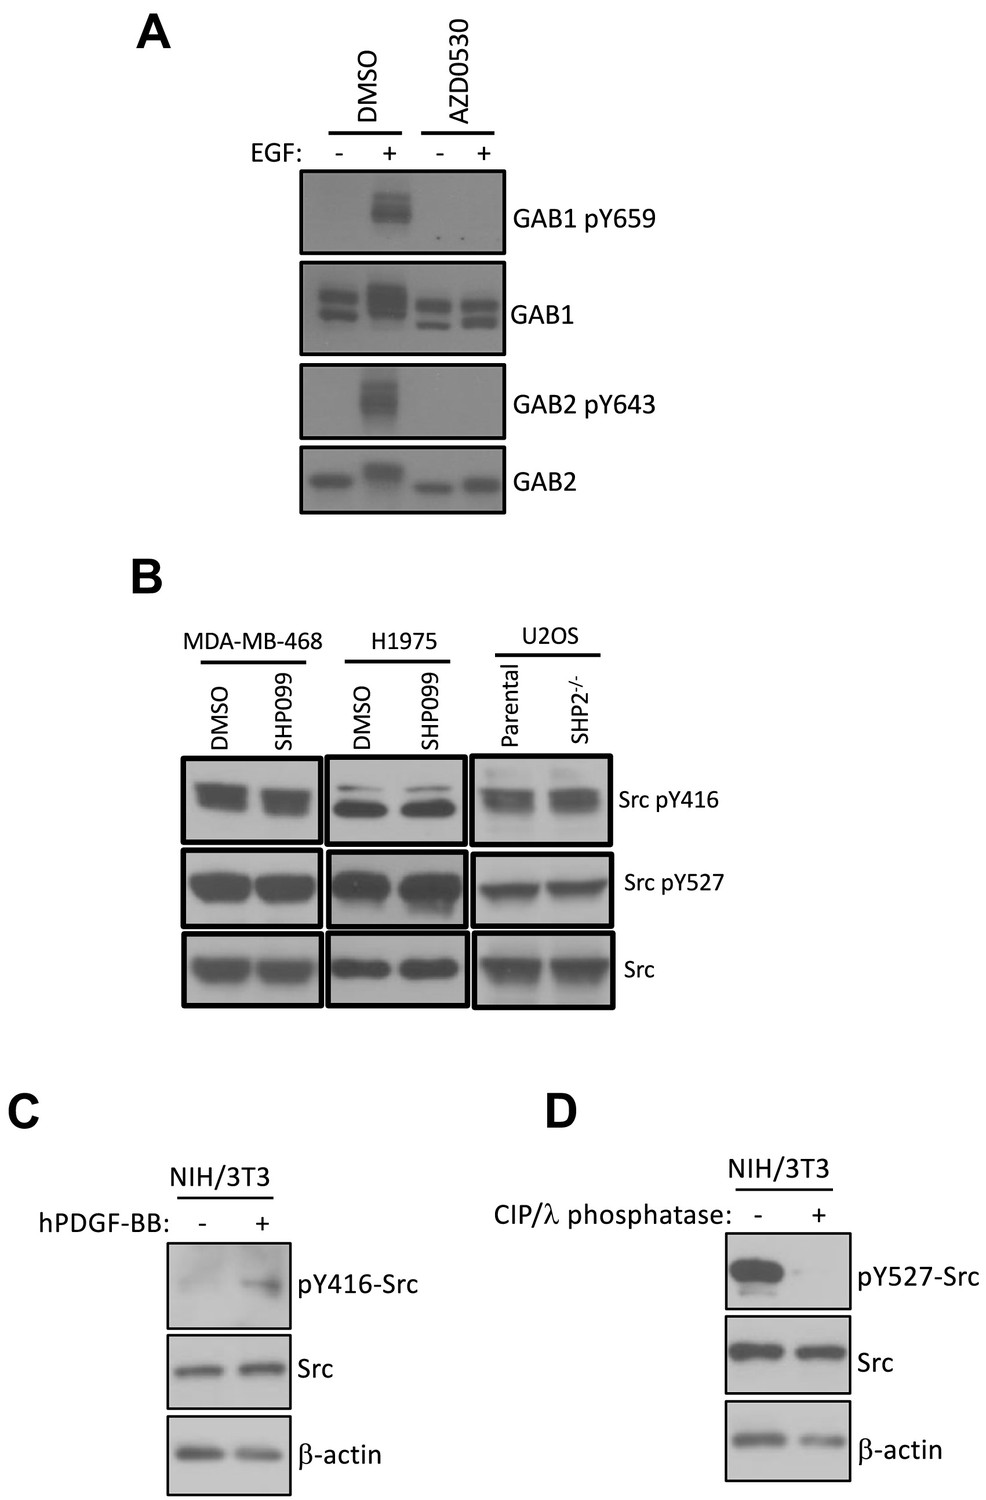
SHP2 does not affect the deposition of phosphate marks on GAB1/2 by SFKs.
(A) MDA-MB-468 cells pre-treated with DMSO carrier or AZD0530 (10 µM) were left unstimulated or stimulated with EGF (10 nM) for 10 min and subjected to western analysis with pY659-GAB1 and pY643-GAB2 antibodies. Total protein levels were detected using antibodies for GAB1 and GAB2. (B) MDA-MB-468 and H1975 cells were treated with DMSO and SHP099 (10 µM) for 2 hr and subjected to immunoblotting with Src-pY416, Src-pY527, and Src antibodies. Parental and SHP2 deficient U2OS cells were probed for Src-pY416, Src-pY527, and total Src levels. Western blot results are representative of at least two independent biological replicates. (C) Control Western blot with anti-pY416-Src antibody showing induction of pY416 of Src in NIH/3T3 cells after stimulation with hPDGF. (D) Control Western blot with anti-pY527-Src antibody showing the elimination of pY527 reactivity after phosphatase treatment of resting cell lysates.
Figure 5—figure supplement 3
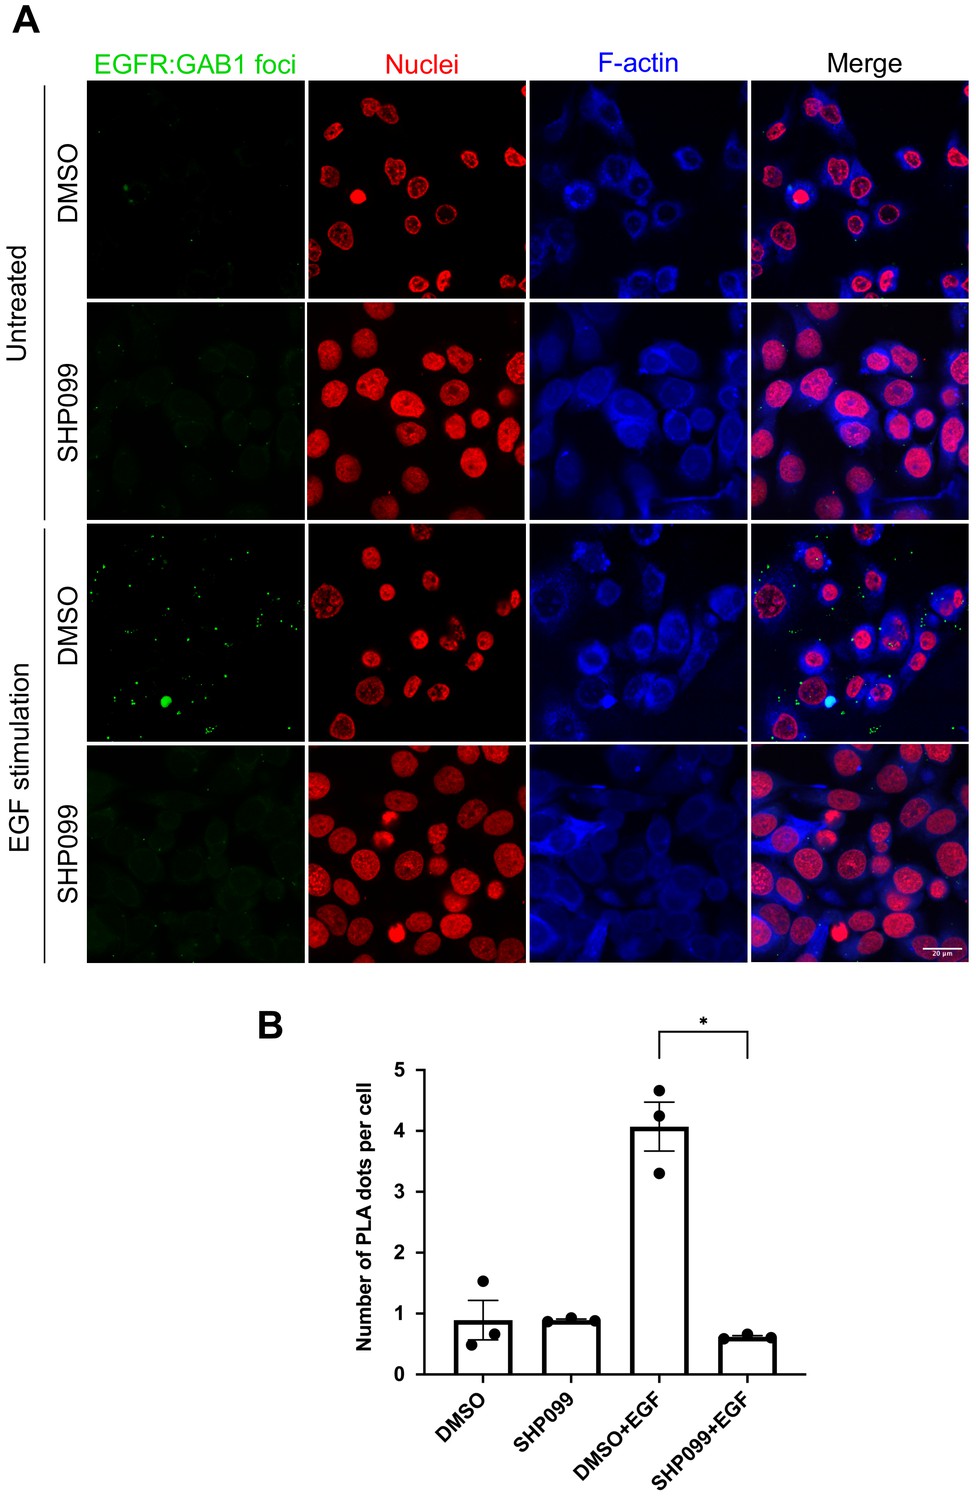
SHP2 regulates GAB1 association with activated EGFR.
(A) Confocal images of EGFR-GAB1 complexes in MDA-MB-468 cells. Cells were pre-treated with DMSO carrier or SHP099 for 2 hr, mock treated or stimulated with 1 nM EGF for 2 min, and then analyzed using a proximity ligation assay (PLA). Cells were identified with propidium iodide (nuclei) and phalloidin (F-actin). PLA foci appear as green dots. Images are representative of three independent experiments. (B) Plot of PLA dots per cell (mean ± SEM), quantifying the extent of EGFR-GAB1 complex formation under each treatment condition in (A) (n = 3, *p<0.05 using Kruskal–Wallis ANOVA test).
-
Figure 5—figure supplement 3—source data 1
Table showing quantified EGFR-GAB1 PLA signal in MDA-MB-468 cells with SHP099 and EGF as indicated.
- https://cdn.elifesciences.org/articles/64251/elife-64251-fig5-figsupp3-data1-v2.xlsx
Figure 6
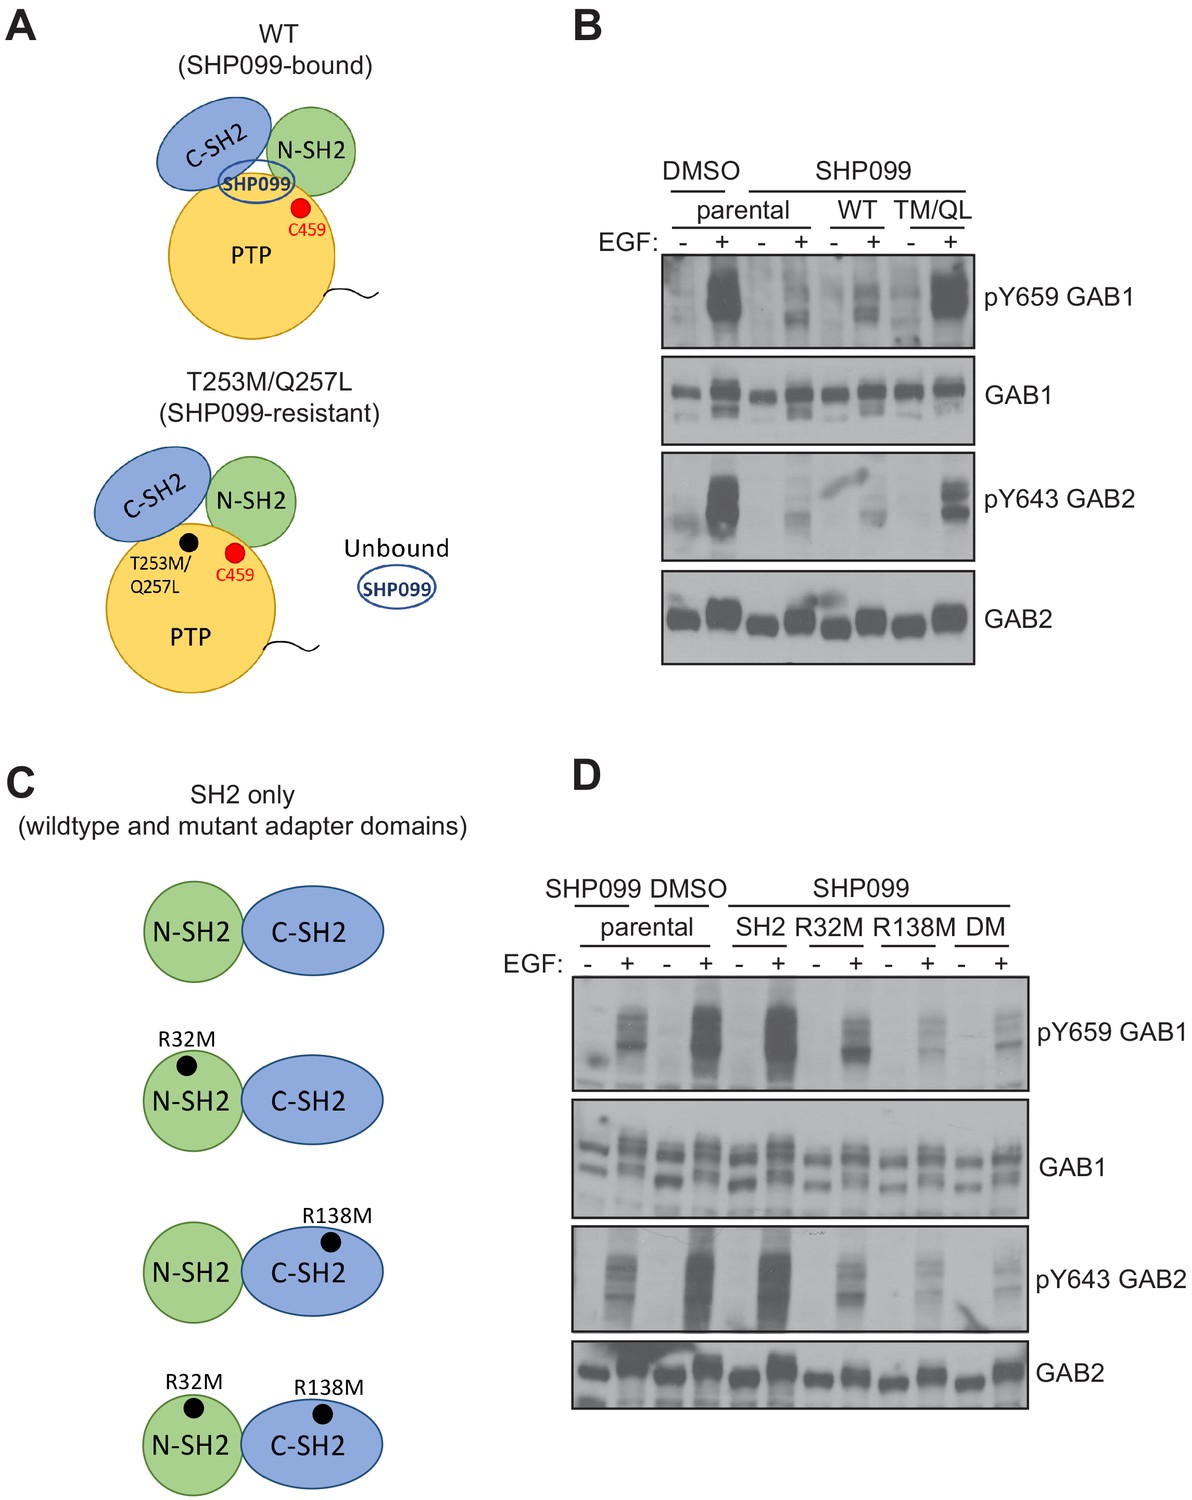
Effects of SHP099-resistance and pY binding-site mutations on pY abundance at protected sites on GAB1 and GAB2.
(A) Schematic illustrating wild-type and SHP099-resistant forms of SHP2. (B) Parental MDA-MB-468 cells or MDA-MB-468 cells stably expressing wild-type or T253M/Q257L SHP2 proteins were pre-treated with SHP099 (10 µM). The cells were then mock treated or stimulated with EGF (10 nM) for 10 min and immunoblotted after lysis using the specified antibodies. (C) Schematic illustrating wild-type and mutated forms of SH2-only tandem fragments of SHP2. (D) Parental MDA-MB-468 cells or MDA-MB-468 cells stably expressing wild-type or mutated tandem SH2 fragments of SHP2 (SH2) as indicated (R32M, R138M, and R32M/R138M, denoted DM here) were pre-treated with SHP099 (10 µM). The cells were then mock treated or stimulated with EGF (10 nM) for 10 min and immunoblotted after lysis using the specified antibodies. Western blot results are representative of at least n = 2 independent biological replicates.
Figure 7 with 1 supplement
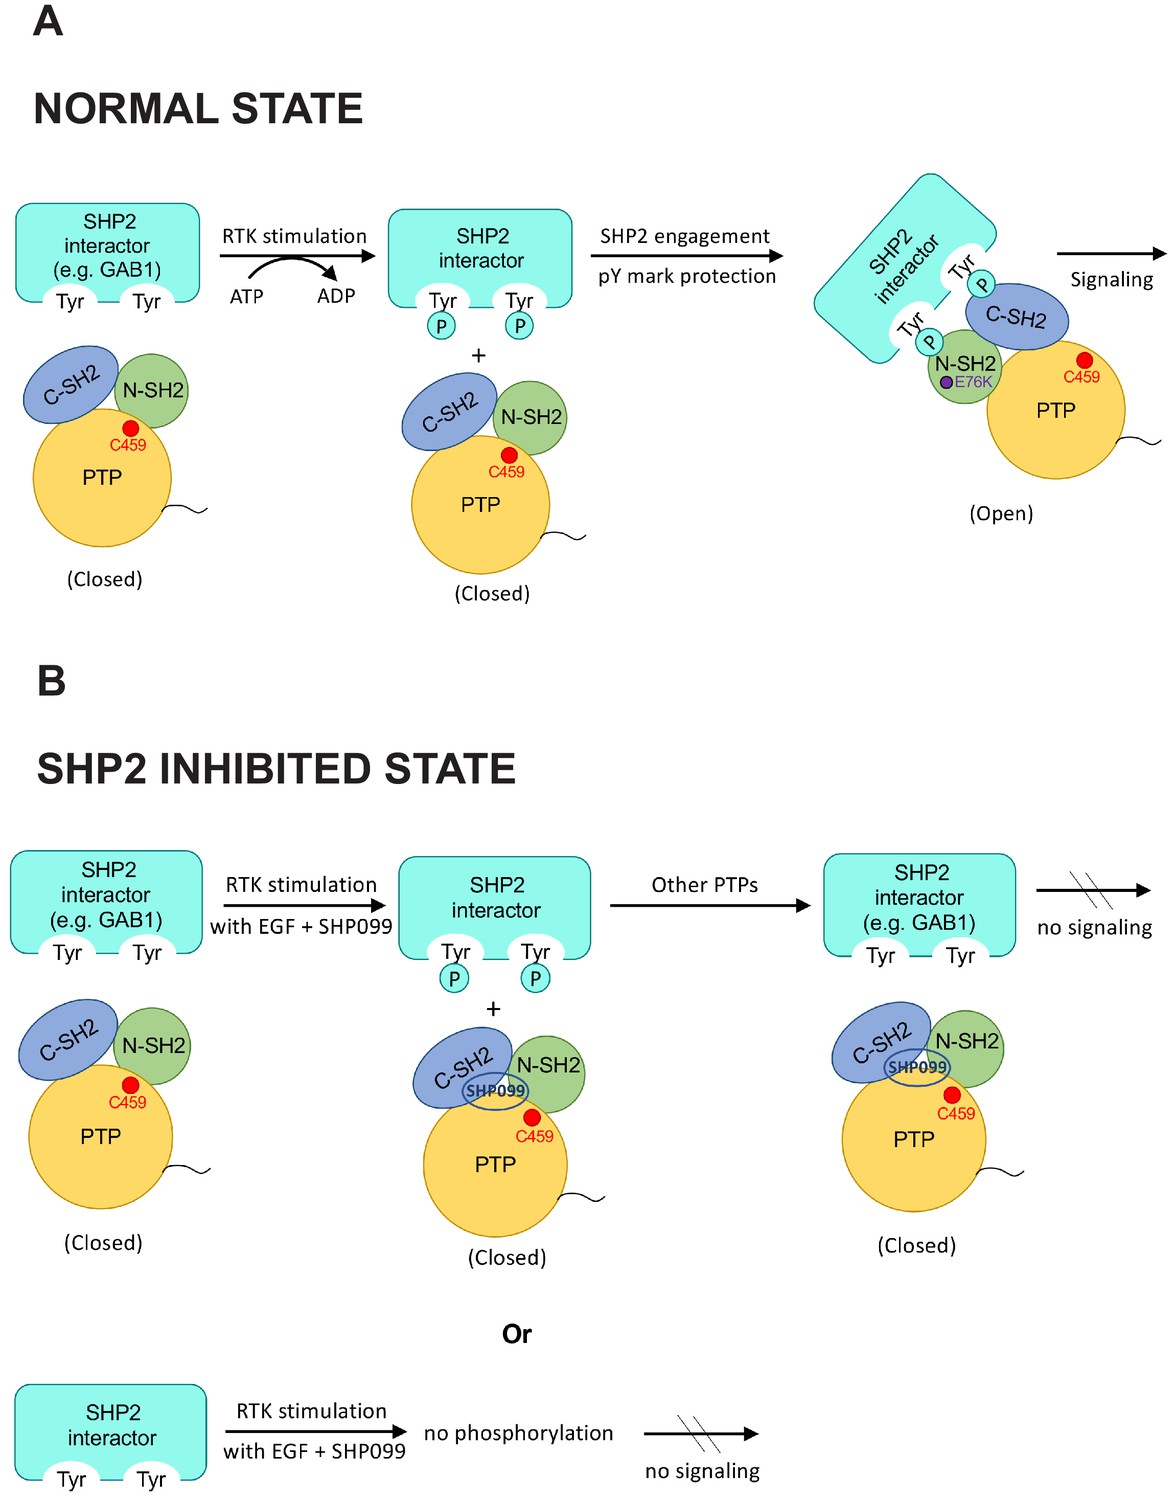
Model highlighting coordinated scaffolding and catalytic activities of SHP2.
(A) Schematic model showing pY mark protection by stable engagement of a partner protein (e.g. GAB1) with the tandem SH2 domains of SHP2. (B) In the presence of SHP099, pY marks on putative SHP2 interactors are vulnerable to dephosphorylation, and SHP099 is not recruited to sites of RTK signaling. It is also possible that deposition of certain phosphate marks is SHP2 dependent (lower panel).
Figure 7—figure supplement 1
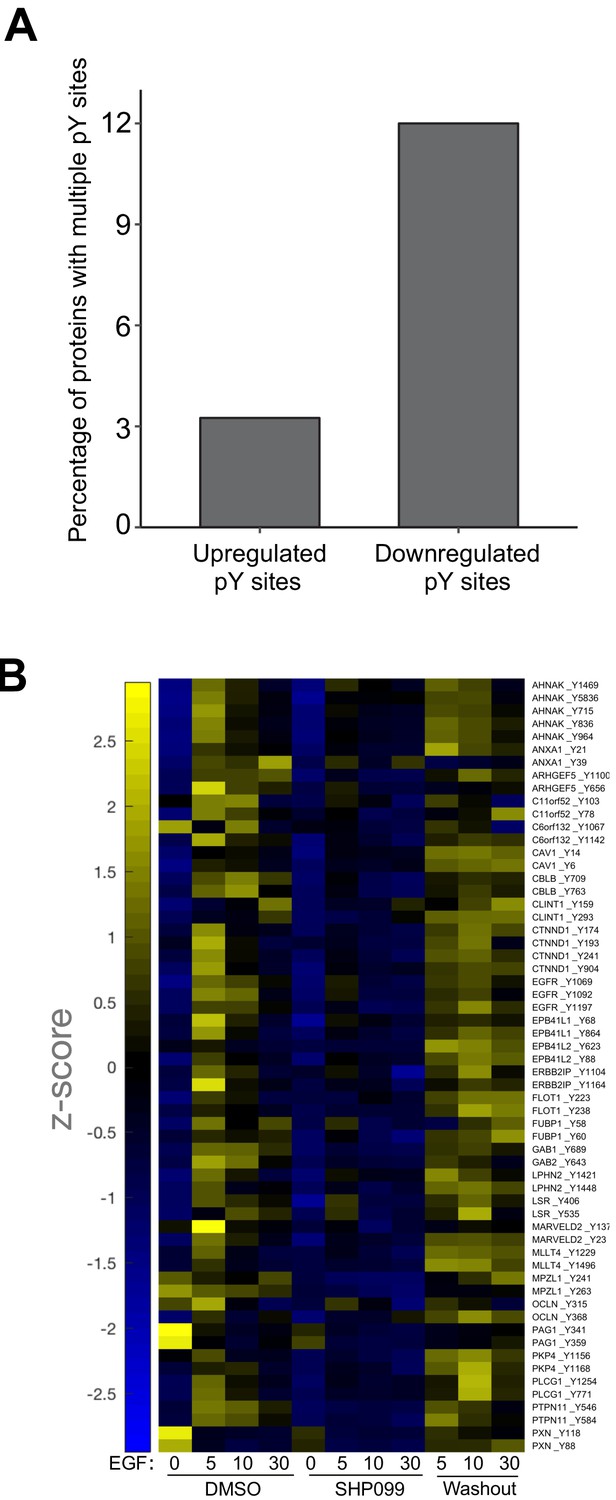
Proteins with SHP2-protected pY sites are enriched for multisite protein phosphorylation.
(A) Quantification showing the relative percentages of proteins displaying multisite phosphorylation in SHP099-responsive pY sites. (B) Heatmap visualization of multisite protein phosphorylation dynamics in the class of SHP2-protected pY sites.
-
Figure 7—figure supplement 1—source data 1
Table showing TMT relative abundance values for all SHP2-protected pY sites displaying multisite protein phosphorylation dynamics.
- https://cdn.elifesciences.org/articles/64251/elife-64251-fig7-figsupp1-data1-v2.xlsx
Author response image 1
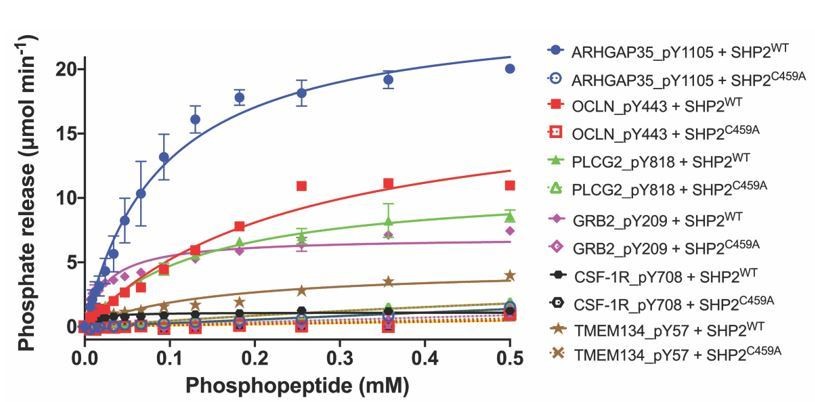
Dephosphorylation activity of wild-type or C459A SHP2, activated with 6 μM bisphosphorylated IRS-1 peptide [SLNY(p)IDLDLVKdPEG8-LSTY(p)ASINFQK], towards synthetic phosphopeptide substrates (OCLN_pY443, PLCG2_pY818, GRB2_pY209, ARHGAP35_1105, TMEM134_pY57, CSF-1R_pY708).
The C459A mutant is inactive in the dephosphorylation assay, as expected.
Tables
Key resources table
| Reagent type (species) or resource | Designation | Source or reference | Identifiers | Additional information |
|---|---|---|---|---|
| Recombinant DNA reagent | pCMV-SHP2-WT | Addgene | RRID:Addgene_8381, plasmid # 8381 | |
| Recombinant DNA reagent | migR1-IRES-GFP | Addgene | RRID:Addgene_27490, plasmid # 27490 | |
| Chemical compound, drug | SHP2 inhibitor (SHP099) | DC chemicals | Catalog # DC9737 | |
| Chemical compound, drug | Src inhibitor (AZD0530) | Dr. Nathanael Gray (Dana-Farber Cancer Institute) | ||
| Antibody | Mouse monoclonal CD3 (UCHT1) | Thermo Fisher Scientific | RRID:AB_468857; Catalog # 16-0038-85 | 10 µg/ml for TCR stimulation of Jurkat cells |
| Antibody | Rabbit monoclonal Phospho-Tyr-1000 | Cell Signaling Technology | RRID:AB_2687925; Catalog # 8954 | Western blot (1:2000); Immunoprecipitation (1:100) |
| Antibody | Rabbit polyclonal Phospho-Thr202/Tyr204-Erk1/2 | Cell Signaling Technology | RRID:AB_331646; Catalog # 9101 | Western blot (1:2000) |
| Antibody | Rabbit polyclonal Erk1/2 | Cell Signaling Technology | RRID:AB_330744; Catalog # 9102 | Western blot (1:2000) |
| Antibody | Rabbit polyclonal GAB1-pY659 | Cell Signaling Technology | RRID:AB_2798014; Catalog # 12745 | Western blot (1:1000) |
| Antibody | Rabbit polyclonal GAB1-pY627 | Cell Signaling Technology | RRID:AB_2305002; Catalog # 3231 | Western blot (1:500) |
| Antibody | Rabbit polyclonal GAB2-pY643 | Thermo Fisher Scientific | RRID:AB_2554386; Catalog # PA5-37778 | Western blot (1:1000) |
| Antibody | Rabbit polyclonal GAB1 | Cell Signaling Technology | RRID:AB_2304999; Catalog # 3232 | Western blot (1:2000) |
| Antibody | Rabbit monoclonal GAB2 | Cell Signaling Technology | RRID:AB_10698601; Catalog # 3239 | Western blot (1:2000) |
| Antibody | Rabbit polyclonal pY263-MPZL1 | Cell Signaling Technology | RRID:AB_10715080; Catalog # 5543 | Western blot (1:1000) |
| Antibody | Rabbit monoclonal pY241-MPZL1 | Cell Signaling Technology | RRID:AB_10891793; Catalog # 8131 | Western blot (1:1000) |
| Antibody | Rabbit polyclonal MPZL1 | Cell Signaling Technology | RRID:AB_1904189; Catalog # 4157 | Western blot (1:2000) |
| Antibody | Rabbit polyclonal pY1105-ARHGAP35 | Thermo Fisher Scientific | RRID:AB_2553676; Catalog # PA5-36713 | Western blot (1:1000) |
| Antibody | Rabbit polyclonal ARHGAP35 | Cell Signaling Technology | RRID:AB_2115740; Catalog # 2562 | Western blot (1:2000); Immunoprecipitation (1:100) |
| Antibody | Rabbit monoclonal SHP2 | Cell Signaling Technology | RRID:AB_2174959; Catalog # 3397 | Western blot (1:500) |
| Antibody | Rabbit polyclonal SHP2 | Bethyl | RRID:AB_1040019; Catalog # A301-544A | Western blot (1:1000) |
| Antibody | Mouse monoclonal SHP2 | Santa Cruz | RRID:AB_628252; Catalog # sc-7384 | Immunoprecipitation (2 µg antibody per500 µg cell lysate) |
| Antibody | Mouse monoclonal PLCG2 | Santa Cruz | RRID:AB_628120; Catalog # sc-5283 | Western blot (1:500); Immunoprecipitation (2 µg antibody per500 µg cell lysate) |
| Antibody | Rabbit polyclonal OCLN | Bethyl | RRID:AB_2631690; Catalog # A305-297A | Western blot (1:1000); Immunoprecipitation (5 µg antibody per1 mg cell lysate) |
| Antibody | Mouse monoclonal GRB2 | BD Transduction Laboratories | RRID:AB_397518; Catalog # 610112 | Western blot (1:2000) |
| Cell line (H. sapiens) | MDA-MB-468 | ATCC | RRID:CVCL_0419; HTB-132 | |
| Cell line (H. sapiens) | KYSE-520 | DSMZ | RRID:CVCL_1355; ACC 371 | |
| Cell line (H. sapiens) | U2OS | ATCC | RRID:CVCL_0042; HTB-96 | |
| Cell line (H. sapiens) | Jurkat | ATCC | RRID:CVCL_0367; TIB-152 | |
| Cell line (H. sapiens) | NCI-H1975 | ATCC | RRID:CVCL_UE30; CRL-5908 | |
| Cell line (H. sapiens) | SHP2 knockout U2OS cell line | LaRochelle et al., 2018 | ||
| Peptide, recombinant protein | Human EGF | Gibco | PHG0311 | |
| Peptide, recombinant protein | Human PDGF-BB | Peprotech | Catalog # 10771–922 | |
| Peptide, recombinant protein | IRS1_pY1172–PEG–pY1222 peptide | This paper | SLN{pY}IDLDLVK–dPEG8–LST{pY}ASINFQK; (custom synthesized by Genscript) | |
| Peptide, recombinant protein | OCLN_pY443 peptide | This paper | TGLQE{pY}KSLQS; (custom synthesized by Genscript) | |
| Peptide, recombinant protein | PLCG2_pY818 peptide | This paper | TRIQQ{pY}FPSNY (custom synthesized by Genscript) | |
| Peptide, recombinant protein | GRB2_pY209 peptide | This paper | MFPRN{pY}VTPVN; (custom synthesized by Genscript) | |
| Peptide, recombinant protein | ARHGAP35_pY1105 peptide | This paper | EENI{pY}SVPHDS; (custom synthesized by Genscript) | |
| Peptide, recombinant protein | CSF-1R_pY708 peptide | This paper | IHLEKK{pY}VRRDSGF; (custom synthesized by Genscript) | |
| Peptide, recombinant protein | TMEM134_pY57 peptide | This paper | KQSRLR{pY}QNLEND; (custom synthesized by Genscript) | |
| Peptide, recombinant protein | Lysyl Endopeptidase, Mass Spectrometry Grade (Lys-C) | FUJIFILM Wako Pure Chemical Corporation | Catalog # 125–05061 | Protein cleavage for mass spectrometry (10 µg per 1 mg total protein) |
| Peptide, recombinant protein | Sequencing Grade Modified Trypsin | Promega | Catalog # V511C | Protein cleavage for mass spectrometry (10 µg per 1 mg total protein) |
| Peptide, recombinant protein | Wild-type SHP2 purified protein | LaRochelle et al., 2016 | ||
| Commercial assay or kit | QuikChange II Site-Directed Mutagenesis kit | Agilent | Catalog # 200523 | |
| Commercial assay or kit | BCA protein assay | Pierce | Catalog # 23225 | |
| Commercial assay or kit | Malachite Green assay kit | Sigma–Aldrich | Catalog # MAK307 | |
| Commercial assay or kit | PLA kit | Sigma–Aldrich | Catalog # DUO92014 | |
| Other | NTA Magnetic Agarose beads | Qiagen | Catalog # 36113 | |
| Other | TMT 11-plex reagent | Thermo Scientific | Catalog # A37725 | |
| Software, algorithm | GraphPad Prism 9.0 | N/A | RRID:SCR_002798; https://www.graphpad.com/scientific-software/prism/ | |
| Software, algorithm | R 3.6.3 | N/A | RRID:SCR_001905; https://www.r-project.org/ | |
| Software, algorithm | CellProfiler | N/A | RRID:SCR_007358; https://cellprofiler.org/ | |
| Software, algorithm | Reactome database | N/A | RRID:SCR_003485; http://software.broadinstitute.org/gsea/msigdb/annotate.jsp | |
| Software, algorithm | Gene set enrichment analysis | Mootha et al., 2003; Subramanian et al., 2005 | RRID:SCR_003199 | |
| Software, algorithm | Hierarchical clustering | MATLAB | RRID:SCR_001622; https://www.mathworks.com/products/matlab.html | |
| Software, algorithm | Principal component analysis | Python | RRID:SCR_008394; https://www.python.org/ | |
| Software, algorithm | Dependence classification | This paper | See ‘Dependence classification of phosphorylation site time courses’ in Methods | |
| Software, algorithm | Logo analysis | Crooks, 2014 | RRID:SCR_010236 |
Additional files
-
Supplementary file 1
Tables showing all pY sites quantified in the first biological replicate of the phosphoproteomic screen.
- https://cdn.elifesciences.org/articles/64251/elife-64251-supp1-v2.xlsx
-
Supplementary file 2
Table showing all pY sites quantified in the second biological replicate of the phosphoproteomic screen.
- https://cdn.elifesciences.org/articles/64251/elife-64251-supp2-v2.xlsx
-
Supplementary file 3
Table displaying the 20 candidate substrate proteins tested.
- https://cdn.elifesciences.org/articles/64251/elife-64251-supp3-v2.xlsx
-
Transparent reporting form
- https://cdn.elifesciences.org/articles/64251/elife-64251-transrepform-v2.docx
Download links
A two-part list of links to download the article, or parts of the article, in various formats.
Downloads (link to download the article as PDF)
Open citations (links to open the citations from this article in various online reference manager services)
Cite this article (links to download the citations from this article in formats compatible with various reference manager tools)
Time-resolved phosphoproteomics reveals scaffolding and catalysis-responsive patterns of SHP2-dependent signaling
eLife 10:e64251.
https://doi.org/10.7554/eLife.64251


