Complex structures of Rsu1 and PINCH1 reveal a regulatory mechanism of the ILK/PINCH/Parvin complex for F-actin dynamics
- Department of Biology, Southern University of Science and Technology, China
- Faculty of Health Sciences, University of Macau, China
- Academy for Advanced Interdisciplinary Studies, Southern University of Science and Technology, China
- Department of Pathology, School of Medicine and University of Pittsburgh Cancer Institute, University of Pittsburgh, United States
- Guangdong Provincial Key Laboratory of Cell Microenvironment and Disease Research, and Shenzhen Key Laboratory of Cell Microenvironment, China
Figures
Figure 1 with 4 supplements
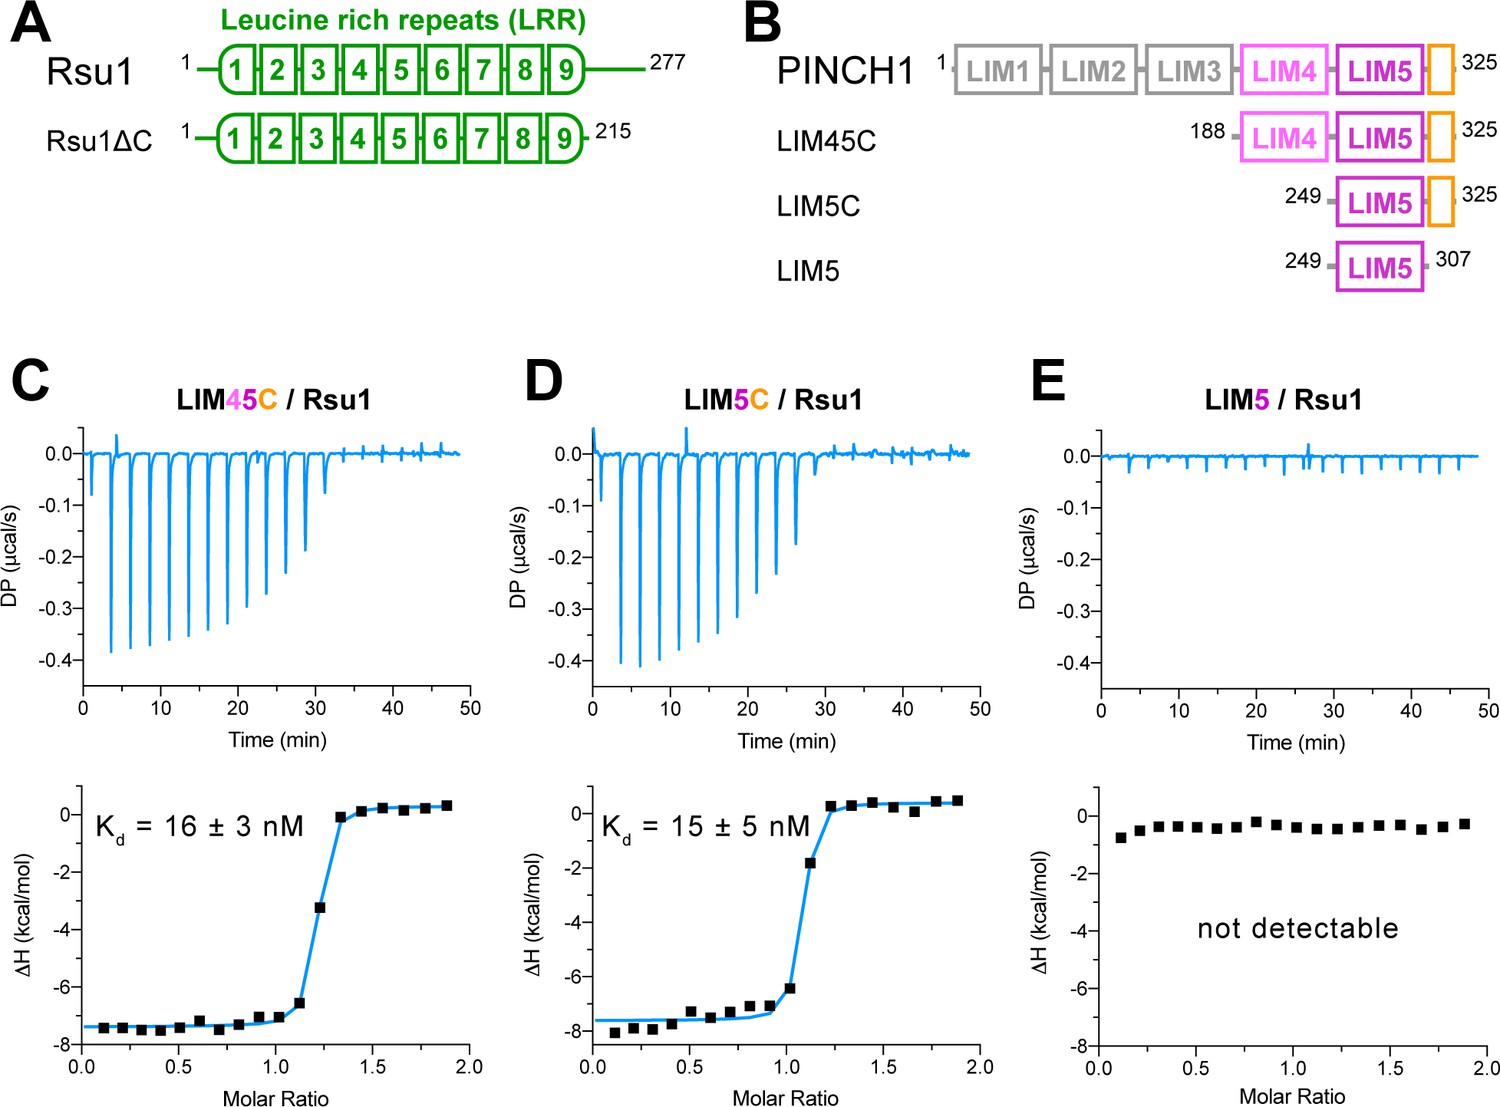
Biochemical characterization of the Rsu1/PINCH1 interaction.
(A and B) Schematic domain organization of Rsu1 (A) and PINCH1 (B). The fragments used in this study are indicated. The color coding of the regions is applied in all figures as otherwise indicated. (C–E) Isothermal titration calorimetry (ITC) analysis of the interactions between Rsu1 and different PINCH1 boundaries.
Figure 1—figure supplement 1
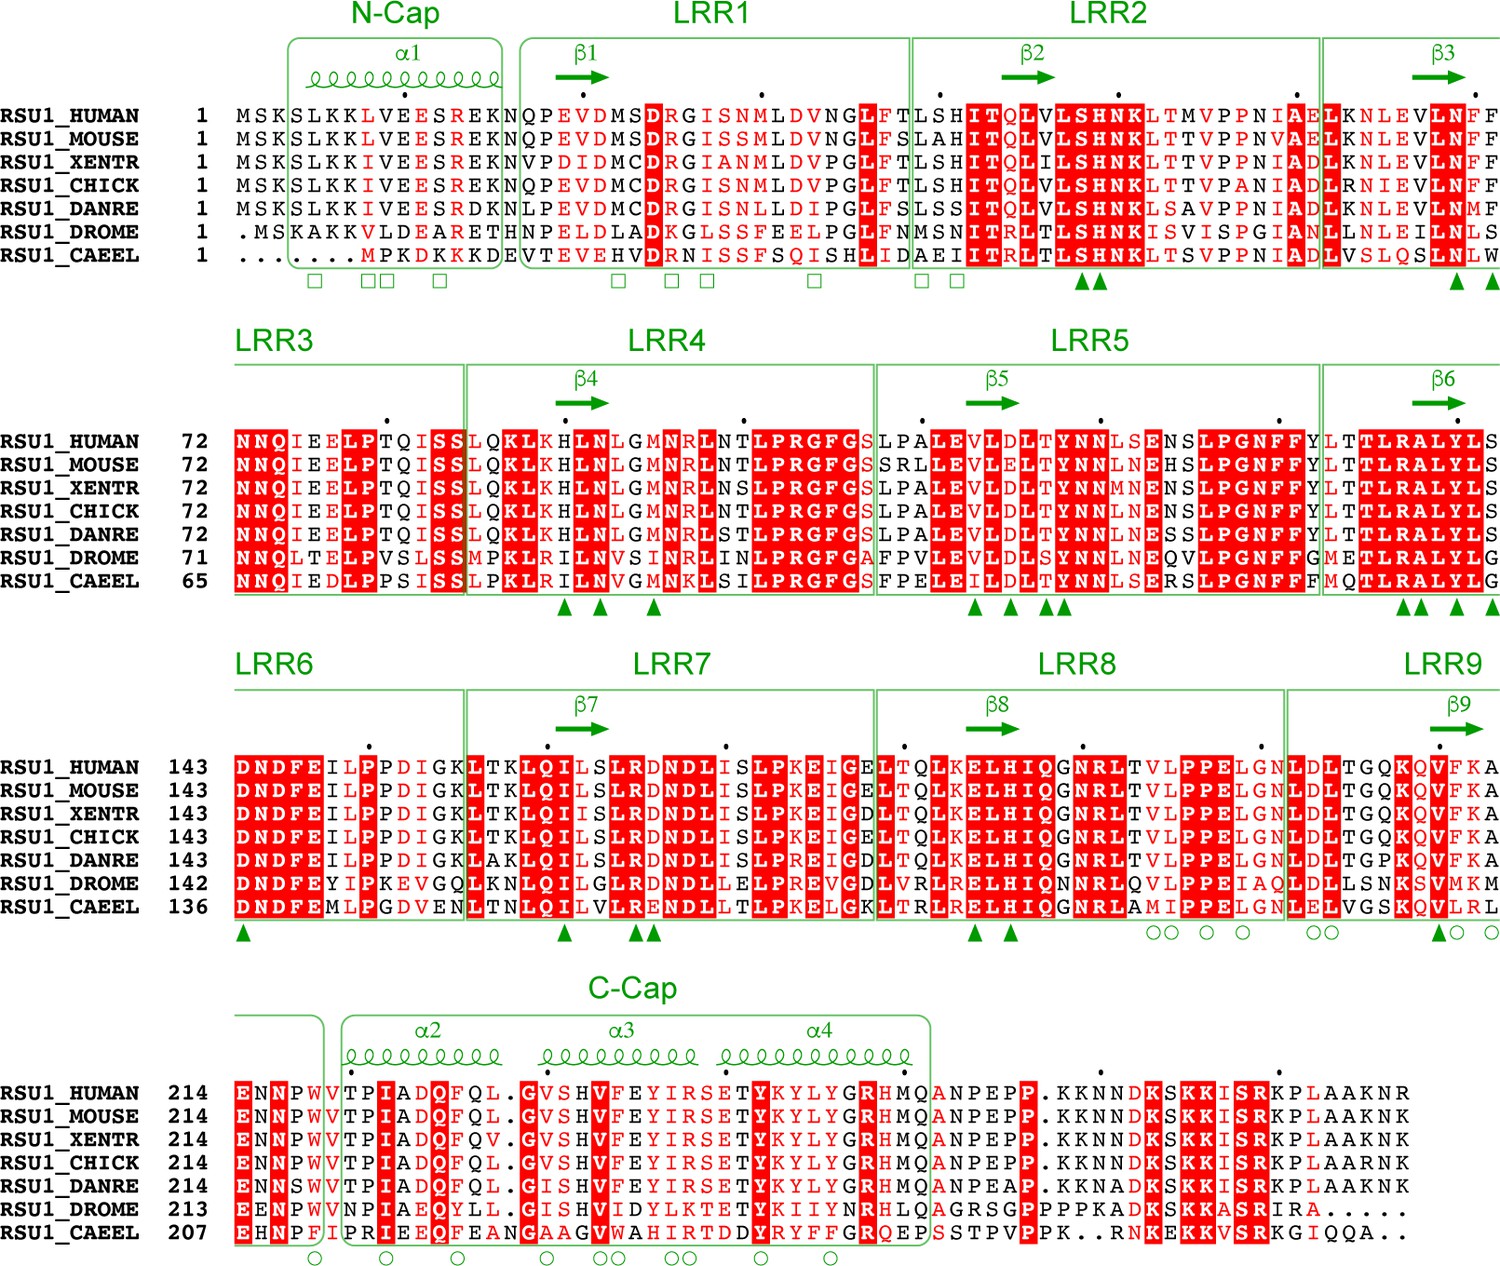
Multiple sequence alignment of Rsu1 proteins from different species.
‘XENTR’, ‘DANRE’, ‘DROME’, and ‘CAEEL’ indicate Xenopus tropicalis, Danio rerio, Drosophila melanogaster, and C. elegans, respectively. The secondary structure elements of Rsu1 are labeled above the alignment. Residues that are identical and highly similar are highlighted in red box and colored in red, respectively. Residues that are involved in the PINCH1-binding are indicated by triangles. Residues capping the LRR-solenoid at N- and C-caps are indicated by open rectangles and circles, respectively.
Figure 1—figure supplement 2

Multiple sequence alignment of PINCH1_LIM45C from different species.
The secondary structure elements are labeled above the alignment using the same color coding as used in Figure 1. Residues interacting with Rsu1 are indicated by triangles. Residues chelating Zn2+ ions are indicated by blue circles.
Figure 1—figure supplement 3

Analytical gel filtration analysis of the interaction between the variants of Rsu1 and PINCH.
(A - C) Rsu1 or Rsu1ΔC mixed with PINCH1_LIM45C, or LIM5C. (D) Rsu1 mixed with PINCH2_LIM5C. (E) Rsu1 mutant mixed with PINCH1_LIM45C. (F) Rsu1 mixed with PINCH1_LIM45C mutant. The concentration of each protein is around 70 μM.
Figure 1—figure supplement 4

Binding of LIM5C from PINCH2 or PINCH1 to Rsu1 analyzed by isothermal titration calorimetry (ITC).
The curves were captured by titrating 200 μM Rsu1 to 20 μM PINCH2_LIM5C or PINCH1_LIM5C on a PEAQ-ITC Microcal calorimeter (Malvern). The binding affinity between PINCH2 and Rsu1 was largely decreased compared with PINCH1.
Figure 2 with 1 supplement
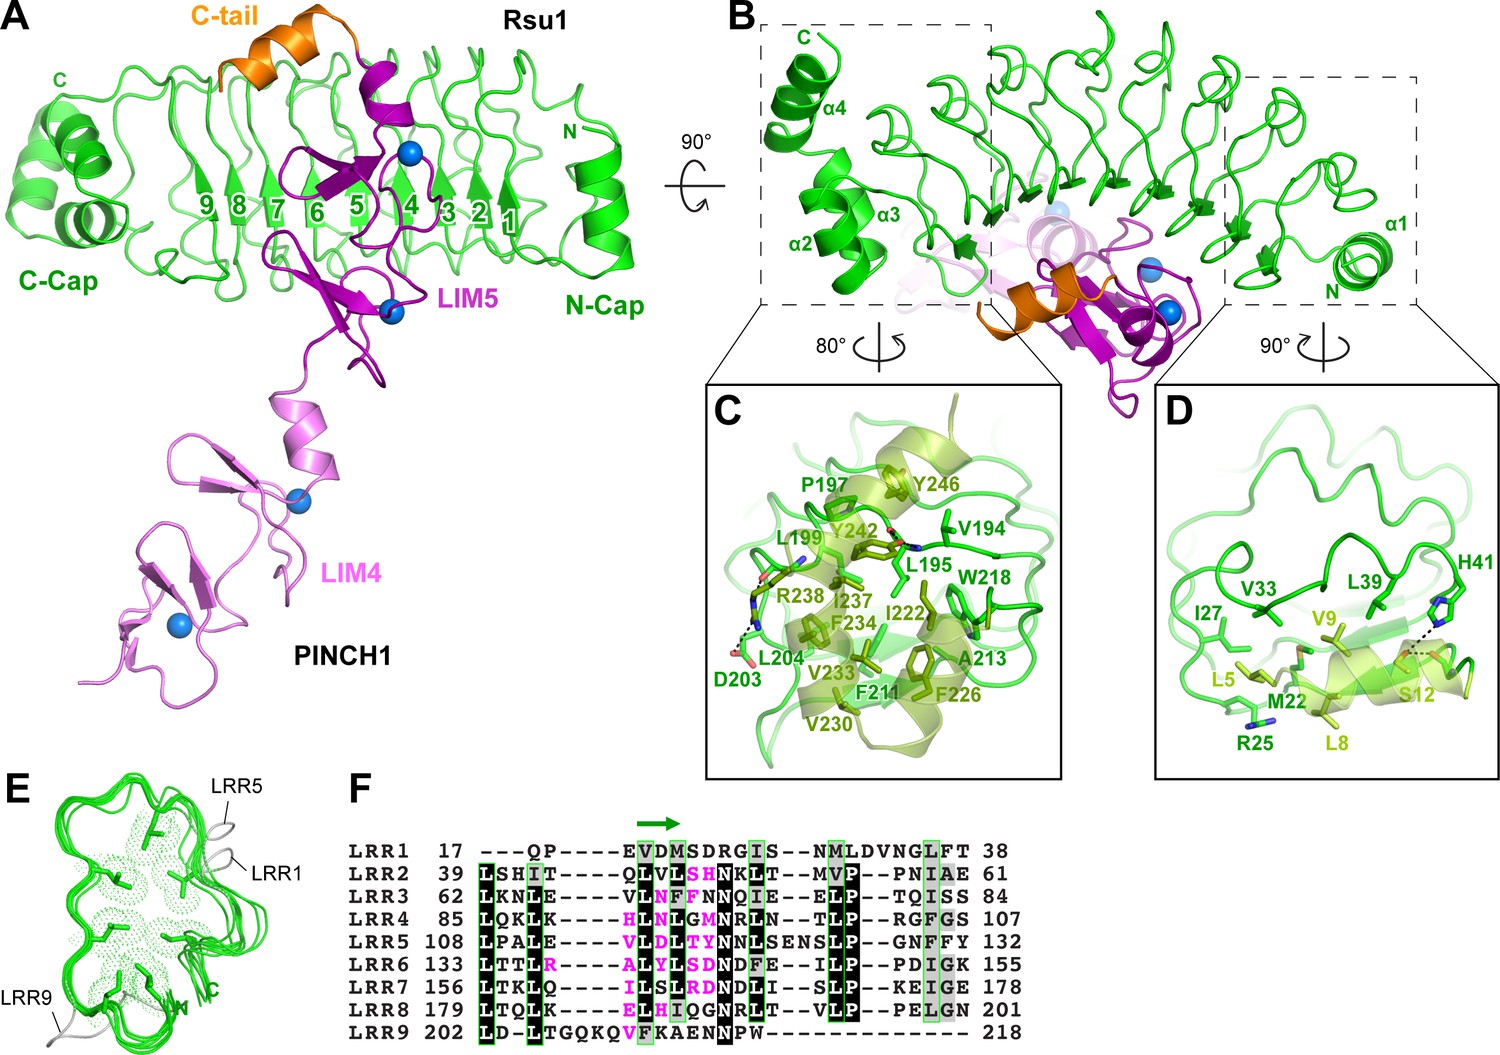
Structural analysis of the Rsu1/PINCH1_LIM45C complex.
(A and B) Ribbon representations of Rsu1/PINCH1-LIM45C complex structure with two different views. Four Zn2+ ions are indicated by blue spheres. (C and D) Molecular details of the C-terminal (C) and N-terminal (D) helices in Rsu1 capping the LRR-solenoid. Hydrogen bonds and salt bridges are indicated by dashed lines. (E) Structural alignment of the nine LRRs in Rsu1. The loops inserted in LRR1, LRR5, and LRR9 are indicated and the seven conserved hydrophobic residues that are mostly leucine and involved in forming the hydrophobic core of the LRR-solenoid are shown as sticks. (F) Sequence alignment of the nine LRRs in Rsu1. Identical and highly conserved residues are boxed in black and gray, respectively. The conserved hydrophobic residues are boxed in green and the amino acids involving in PINCH1 interaction are colored in magenta. The regions forming β-strands in the LRRs are indicated by a green arrow above the alignment.
Figure 2—figure supplement 1
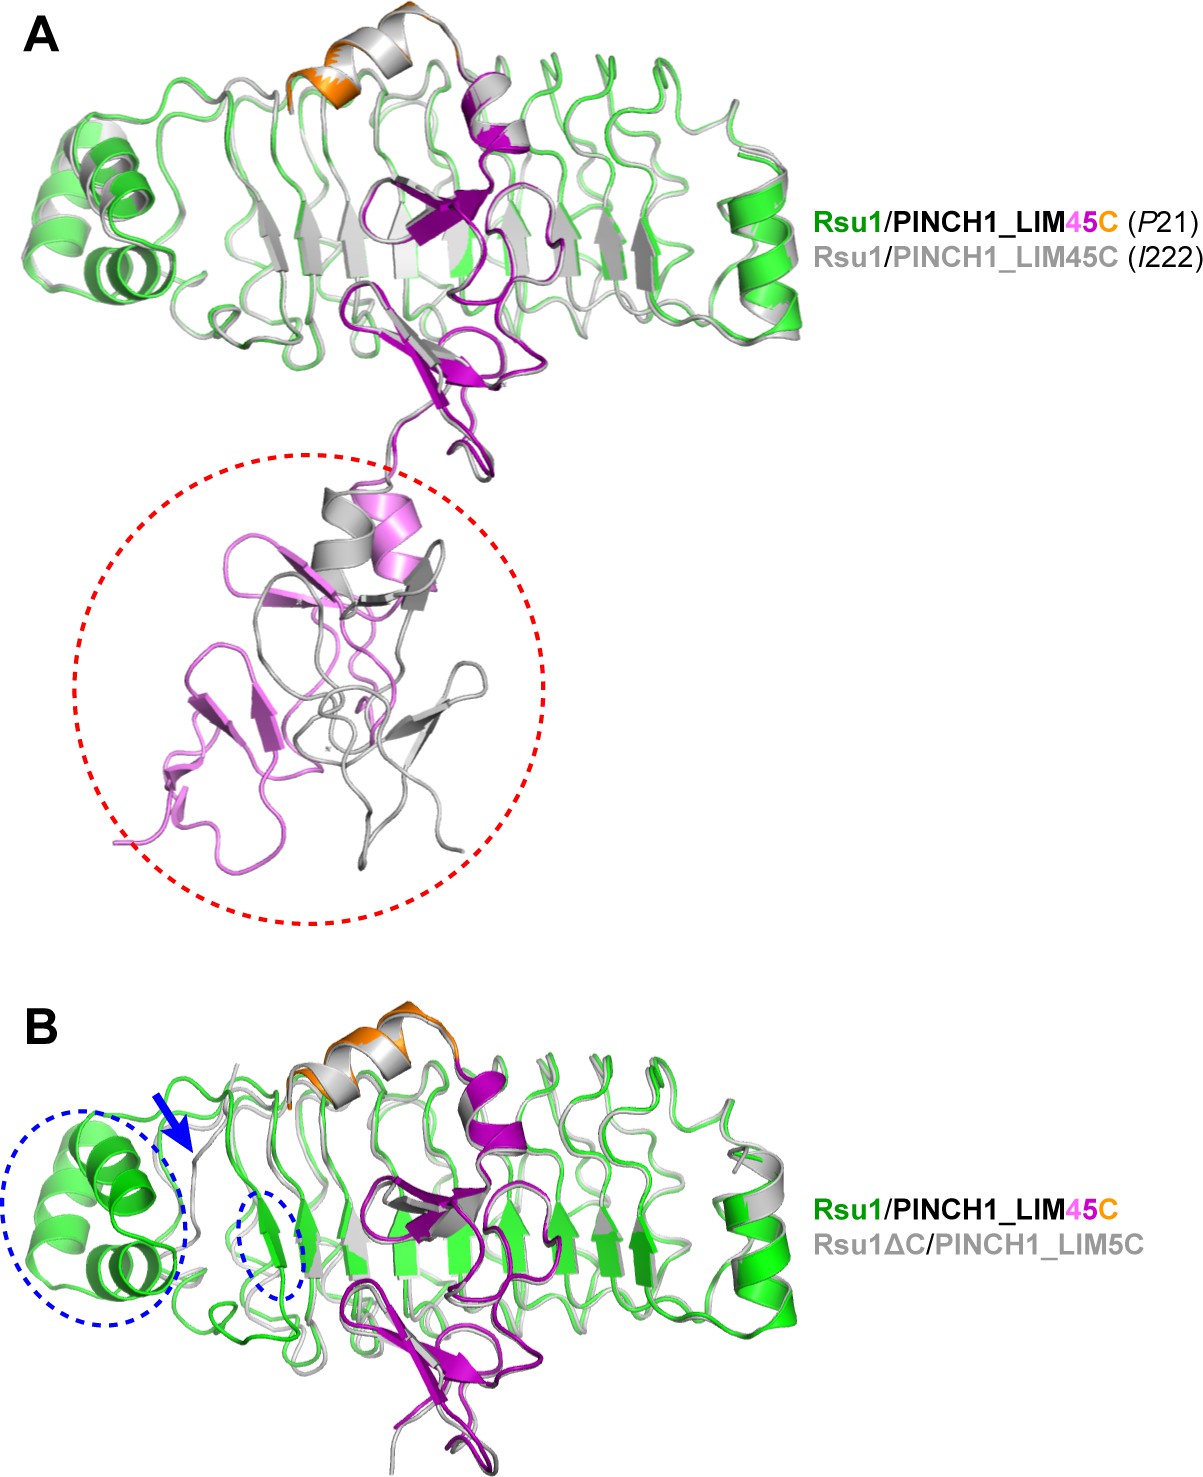
Structural comparison of the Rsu1/PINCH1 complexes solved in this study.
(A) Structural superposition of the Rsu1/PINCH1_LIM45C complex in different crystal forms. The structural difference is highlighted by a red dashed circle. (B) Structural superposition of the Rsu1/PINCH1_LIM45C and Rsu1ΔC/PINCH1_LIM5C complexes. The LIM4 domain of PINCH1_LIM45C was omitted from the comparison. The structural differences are highlighted by blue dashed circles. The LRR9 is misfolded in the Rsu1ΔC structure as indicated by a blue arrow.
Figure 3 with 2 supplements
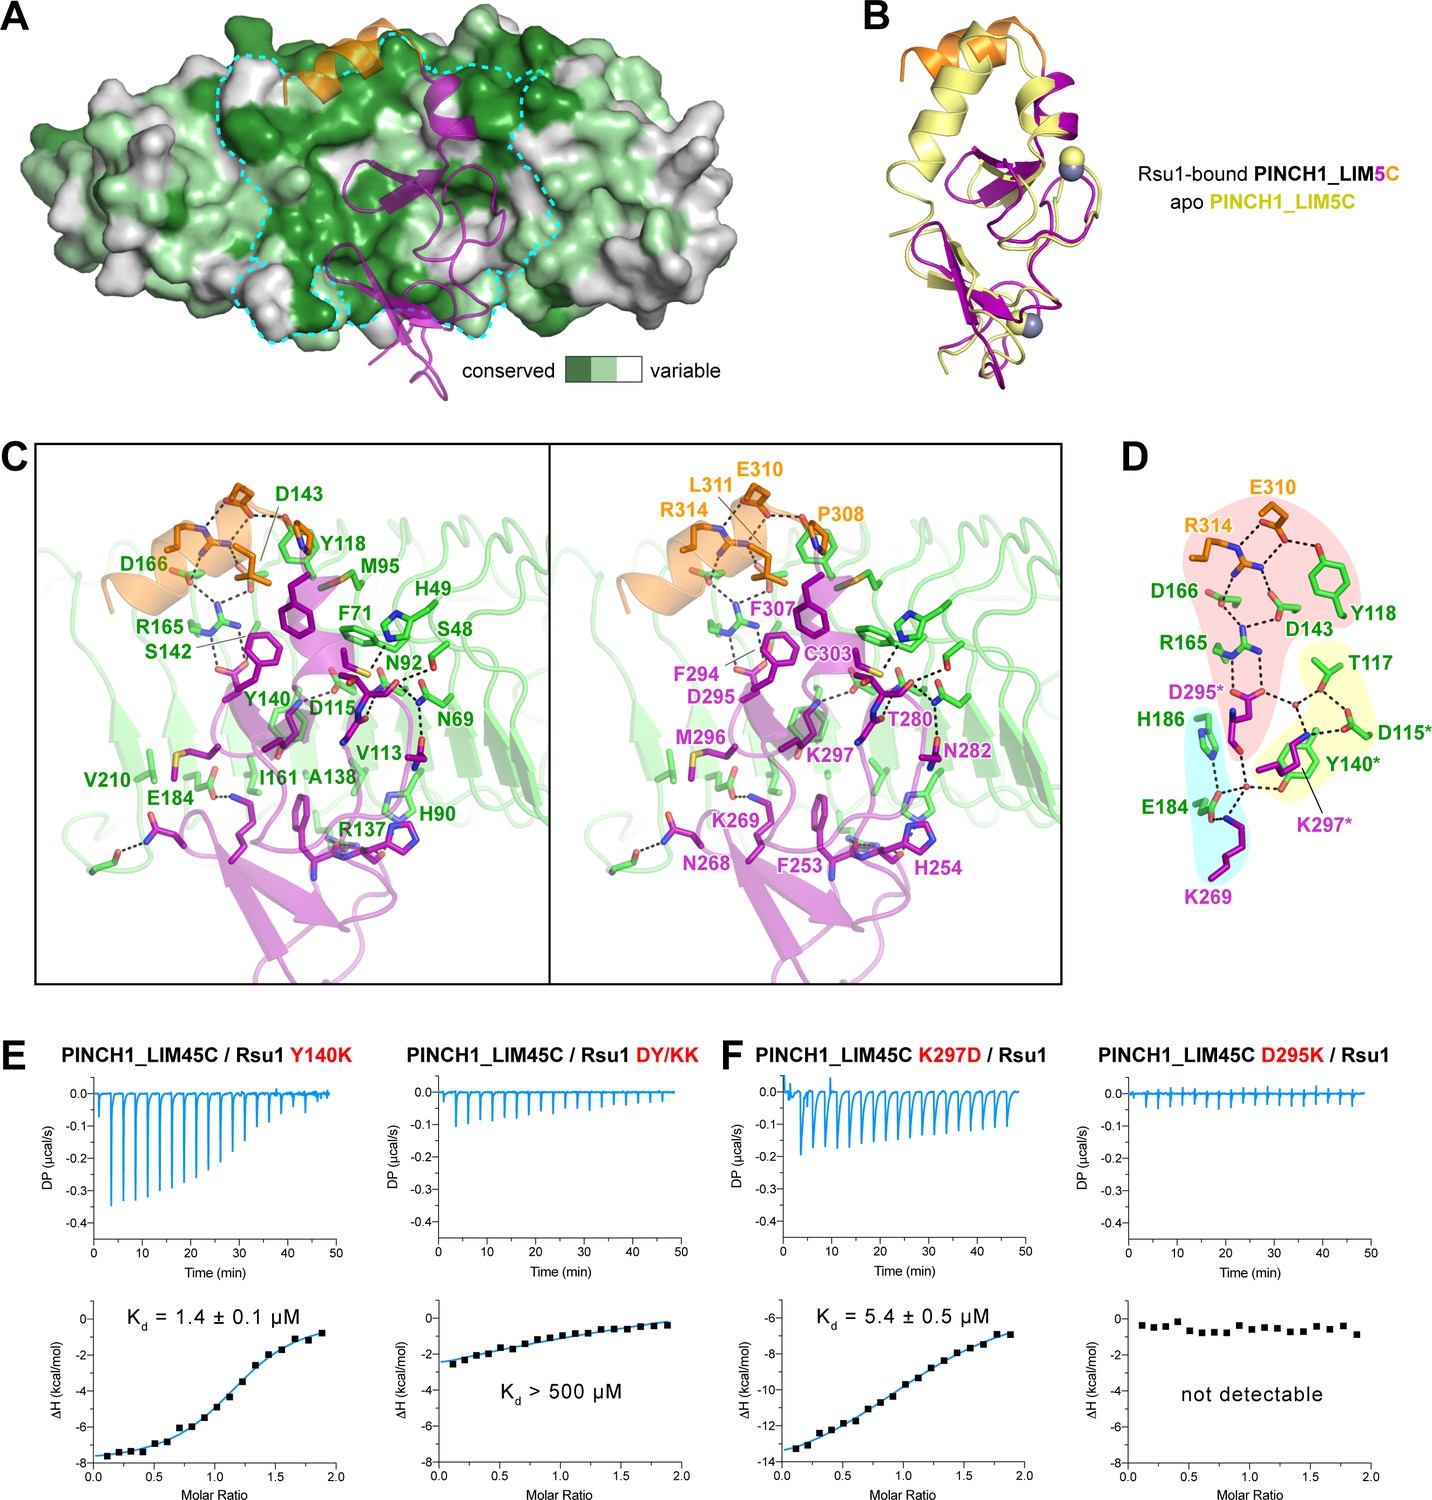
The Rsu1/PINCH1 interface.
(A) Surface representations of Rsu1. The protein surface of Rsu1 is rendered with the amino acid conservation (Figure 1—figure supplement 1). (B) Structural superposition of the PINCH1_LIM5C structures in the apo (PDB id: 6MIF) and Rsu1-bounded forms. (C) Stereoview of the Rsu1/PINCH1 interface. Hydrogen bonds and salt bridges are indicated by dashed lines. (D) Polar interactions in the Rsu1/PINCH1 interface. These interactions are organized together through a hydrogen-bond network coordinately by three buried water molecules that are indicated as red balls. (E and F) Mutations of interfacial residues in either Rsu1 (E) or PINCH1 (F) impair the interaction between Rsu1 and PINCH1.
Figure 3—figure supplement 1
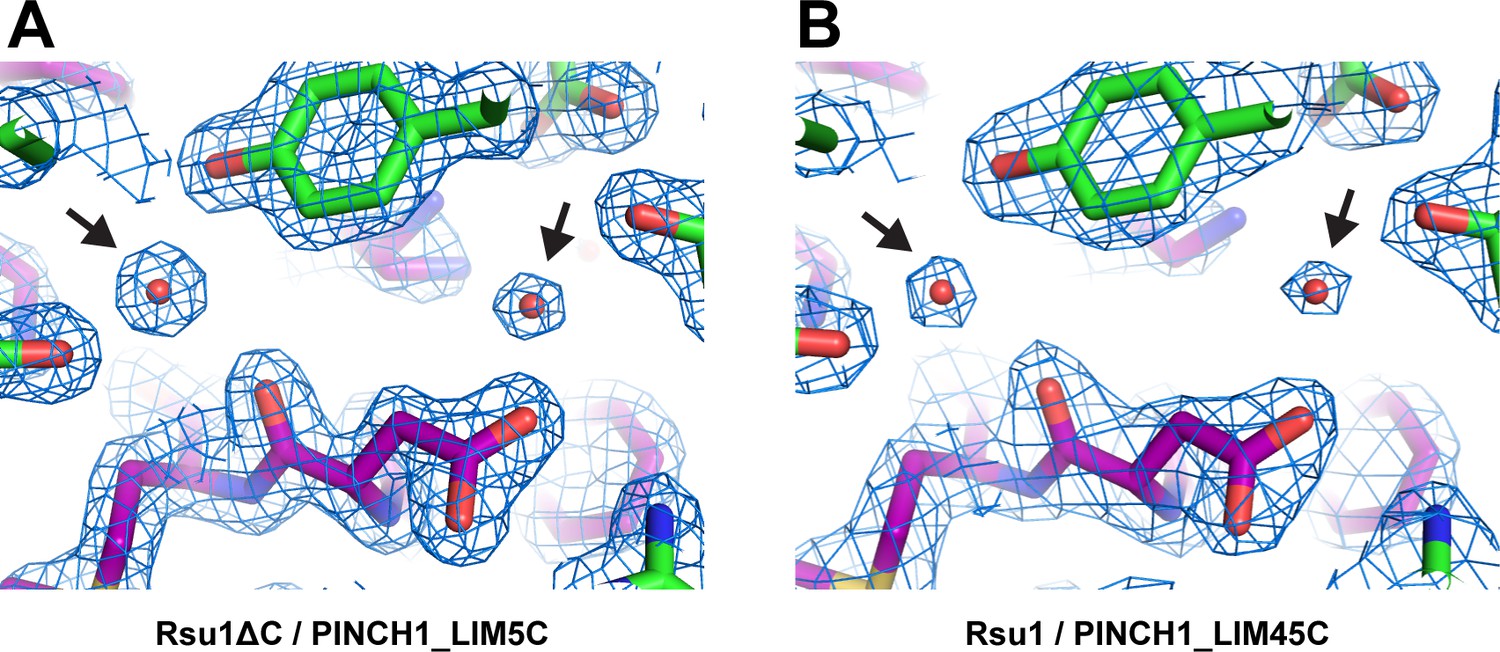
Electron density map of two buried water molecules in the Rsu1/PINCH1 complex structures.
The 2Fo-Fc densities are contoured at 2.0σ with the structures superimposed. The black arrows indicate the densities of the water molecules.
Figure 3—figure supplement 2
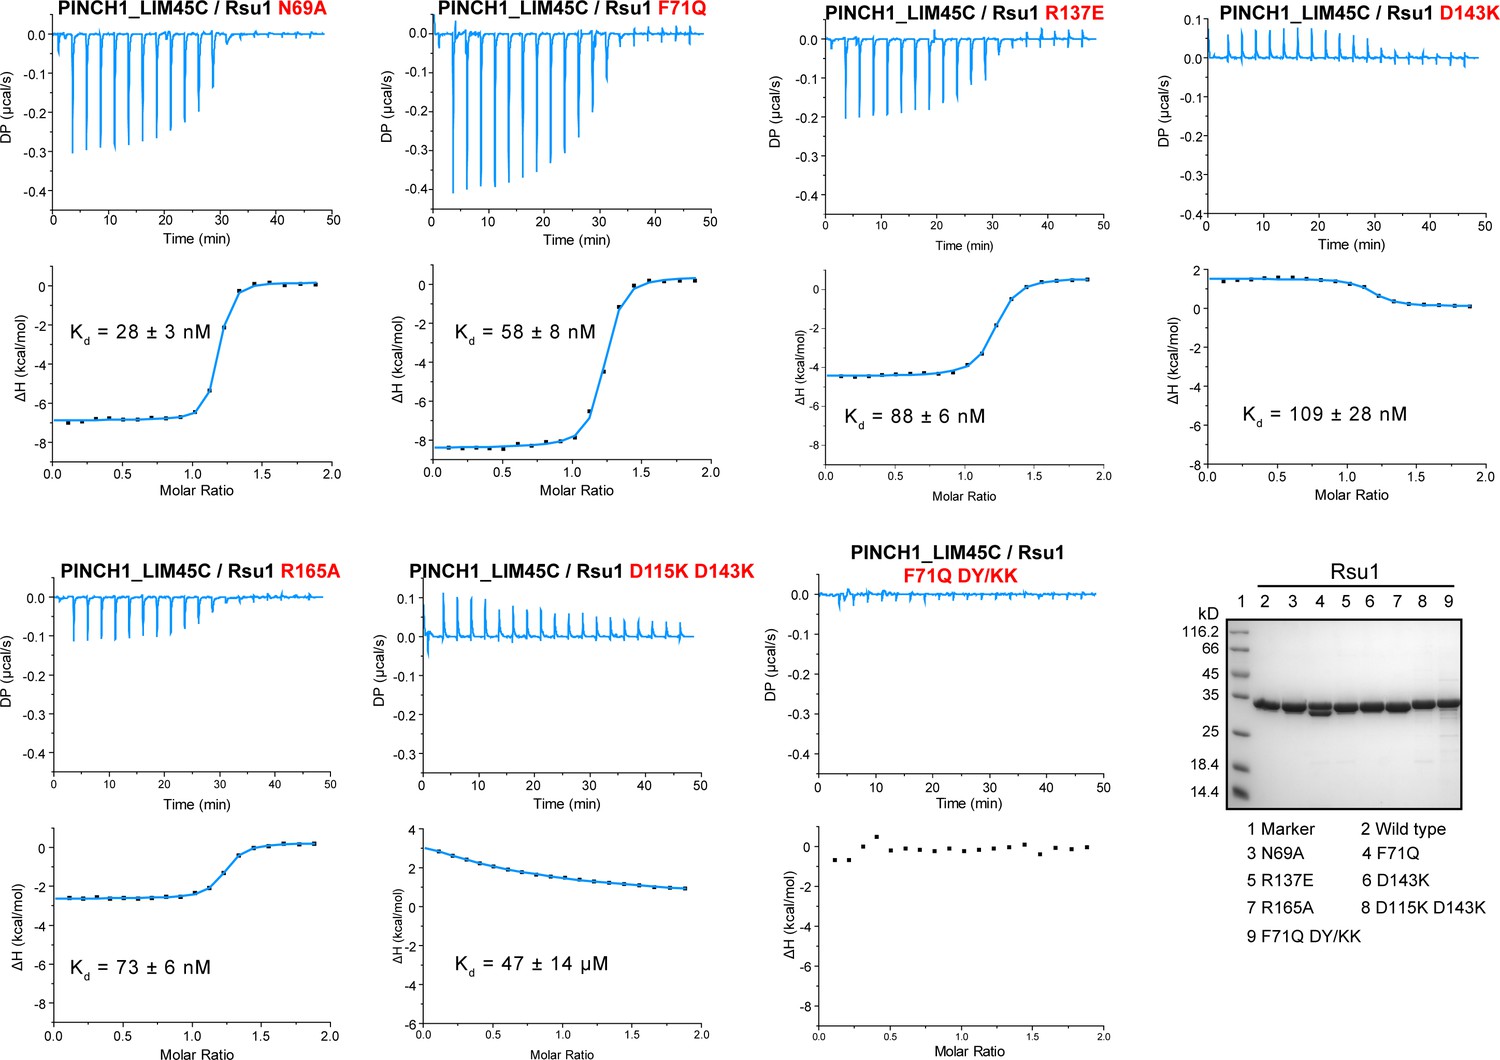
Isothermal titration calorimetry (ITC)-based binding affinity measurements showing the impaired interaction between PINCH1 and Rsu1 with the interface mutations on Rsu1.
The Rsu1 proteins used in the ITC experiments were checked by SDS-PAGE analysis.
Figure 4 with 3 supplements
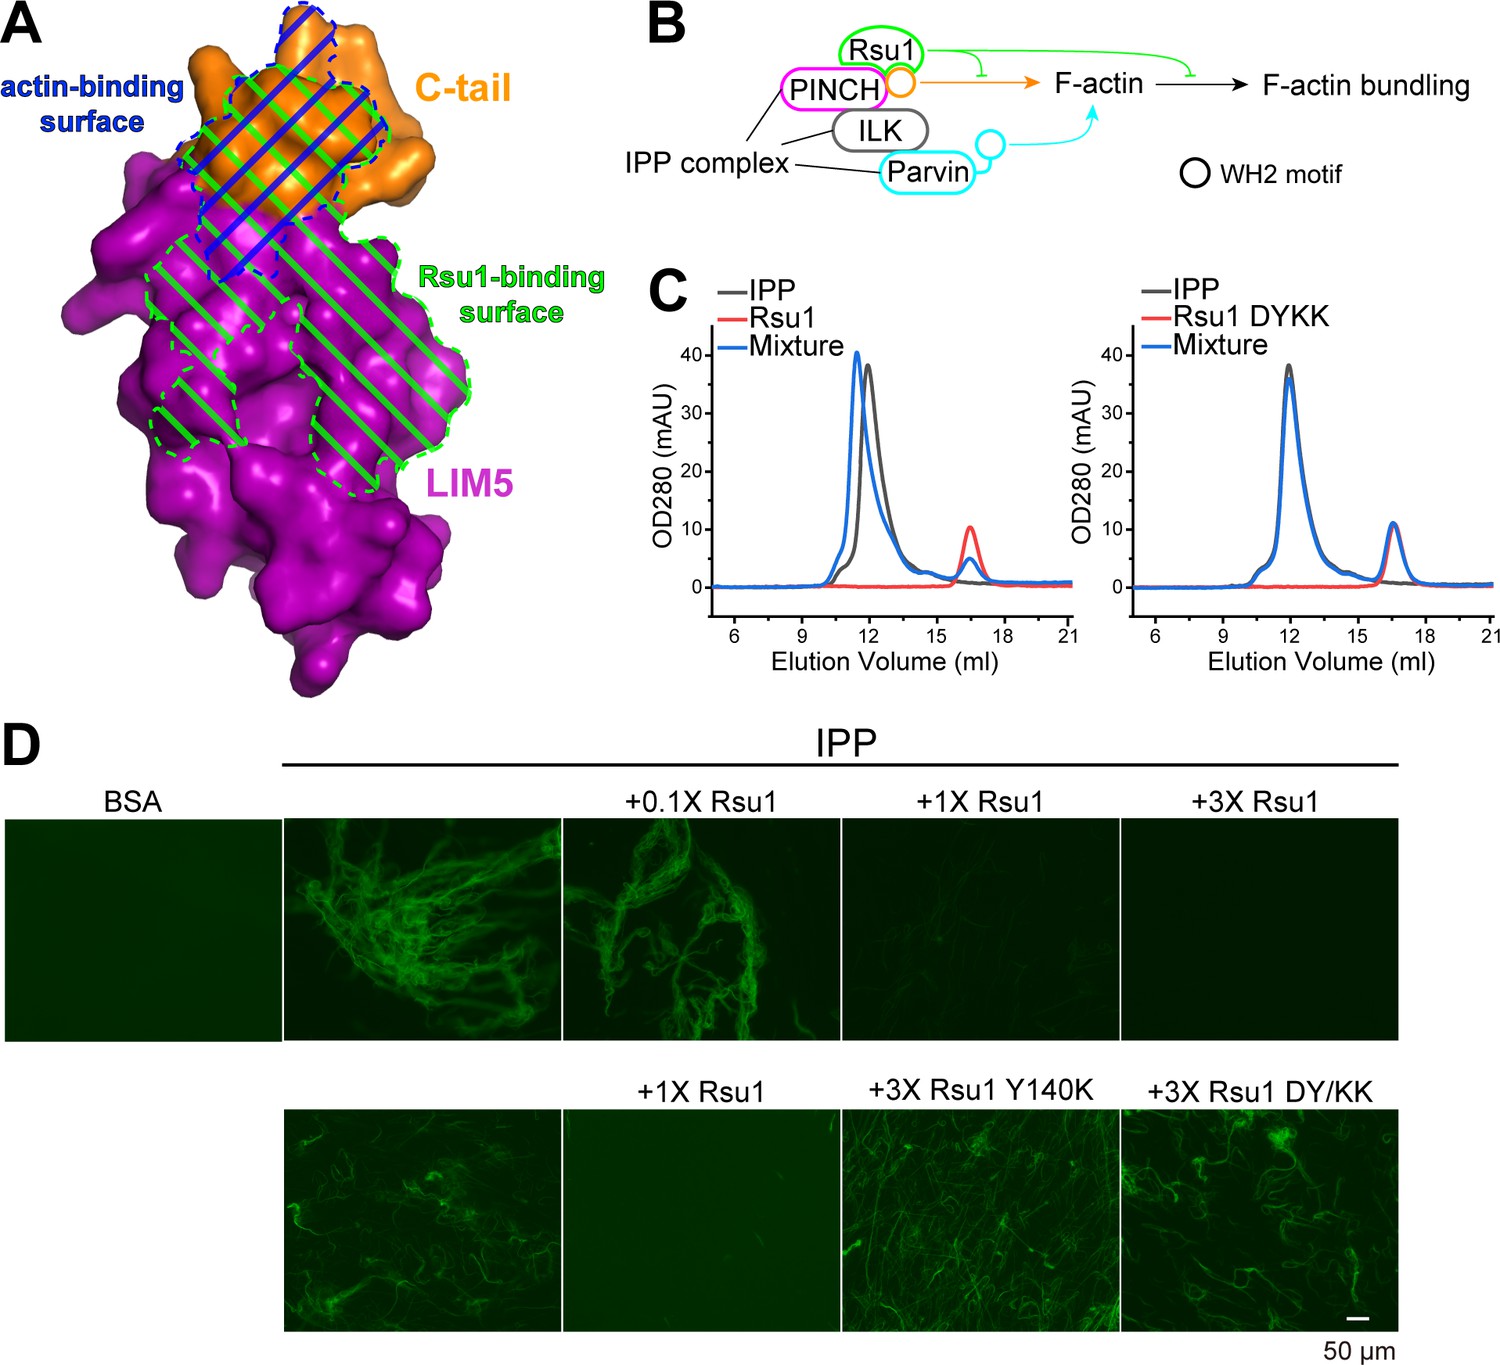
Rsu1 disrupts F-actin bundles induced by the ILK/PINCH/Parvin (IPP) complex.
(A) Surfaces on PINCH1_LIM5C that are involved in the Rsu1-binding or actin-binding. (B) Schematic cartoon showing the inhibitory role of Rsu1 in the IPP-mediated F-actin bundling. (C) Rsu1 but not its DY/KK mutation can co-migrate with the IPP complex in size exclusion chromatography. The concentration for each protein is 20 μM. (D) The IPP-induced F-actin bundling is blocked by wild-type Rsu1 but not the PINCH1-binding defective mutations of Rsu1. The protein concentration of the IPP complex is 10 μM. 0.1×, 1×, and 3× indicate that the protein concentrations are 1 μM, 10 μM, and 30 μM, respectively.
Figure 4—figure supplement 1

Purification of ILK/PINCH/Parvin (IPP) complex and F-actin bundling assay of Rsu1 proteins.
(A) Analytical gel filtration of IPP complex, and the multiangle static light scattering analysis showed that the molecular weight of IPP is 134 kDa (the theoretical molecular weight of IPP is 132 kDa). The SDS-PAGE gel stained by Coomassie Blue showed the purified IPP proteins. (B) Actin bundling assay showed that Rsu1 is not capable of bundling F-actins. The protein concentration of Rsu1 or its mutants is 30 μM.
Figure 4—figure supplement 2
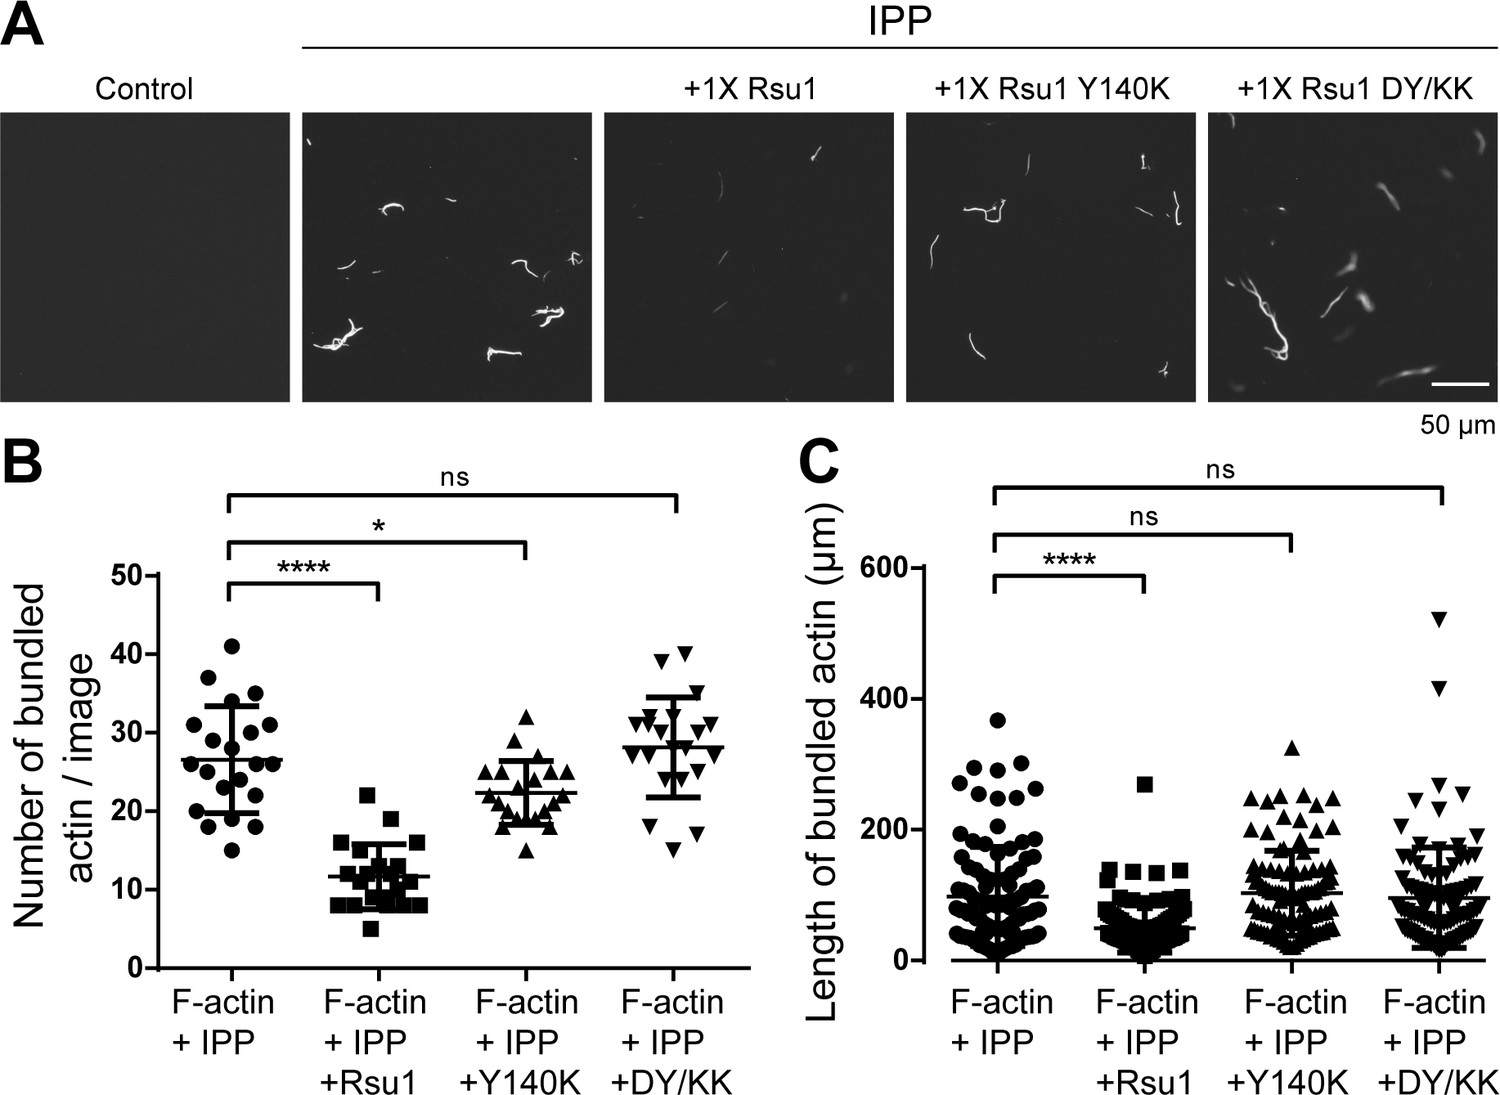
Quantification of actin bundles.
(A) Represented images of bundled F-actins by ILK/PINCH/Parvin (IPP) complex or IPP mixed with different Rsu1 proteins. The images here were about one quarter of the images used for the quantitative analysis shown in the panel B. (B and C) The quantification of the number (B) and length (C) of bundled F-actins as shown in A. For each sample, 20 images were used for the quantification of the bundle number and 100 bundles from five to eight images were used for the quantification of the bundle length.
Figure 4—figure supplement 3
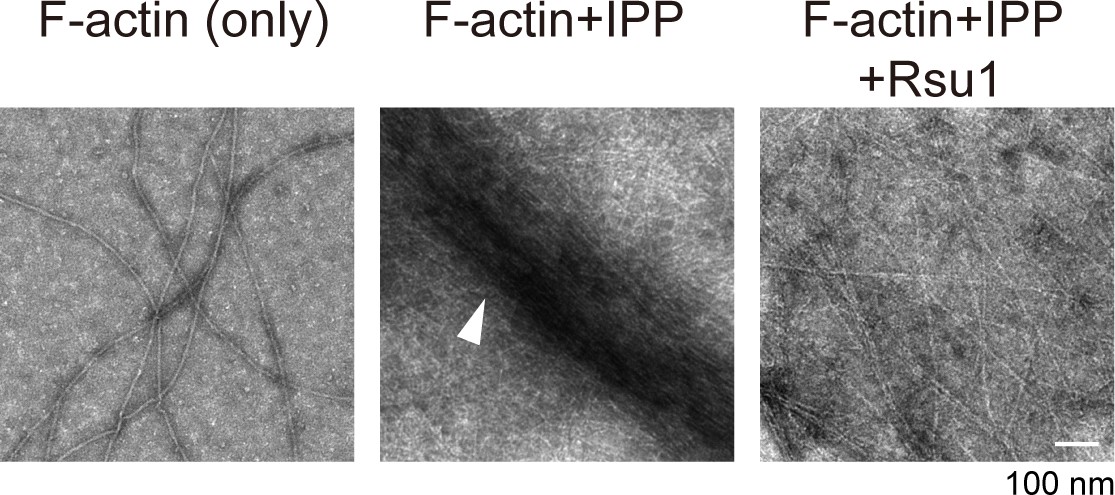
Electron microscopic analysis of F-actin in the presence of ILK/PINCH/Parvin (IPP) or the IPP/Rsu1 mixture.
The white arrowhead in the middle panel indicated the actin bundle.
Figure 5 with 1 supplement

Overexpression of Rsu1 in HeLa cells regulates actin-related cellular processes.
(A) Confocal images of HeLa cells transiently expressed of GFP, Rsu1-GFP, or Rsu1 mutations with a GFP tag. Focal adhesions (FAs) and stress fibers were stained by paxillin and phalloidin, respectively. (B) Quantification of the percentage of HeLa cells containing normal stress fiber formation as shown in A. Data was collected from 10 images in each sample. In each image, more than 10 cells were quantified. Significance was calculated by using Student's t-test in GraphPad Prism. ***p<0.001, *p<0.05. (C) Quantitative analysis of cell area in HeLa cells as imaged by Leica DMI6000B microscope. The areas of GFP-positive cells were measured using Image-Pro Plus. 300 cells were quantified in each sample. **p<0.01.
Figure 5—figure supplement 1

The expression level of wild-type Rsu1 and different mutants in HeLa cells as detected by western blot.
Figure 6 with 1 supplement
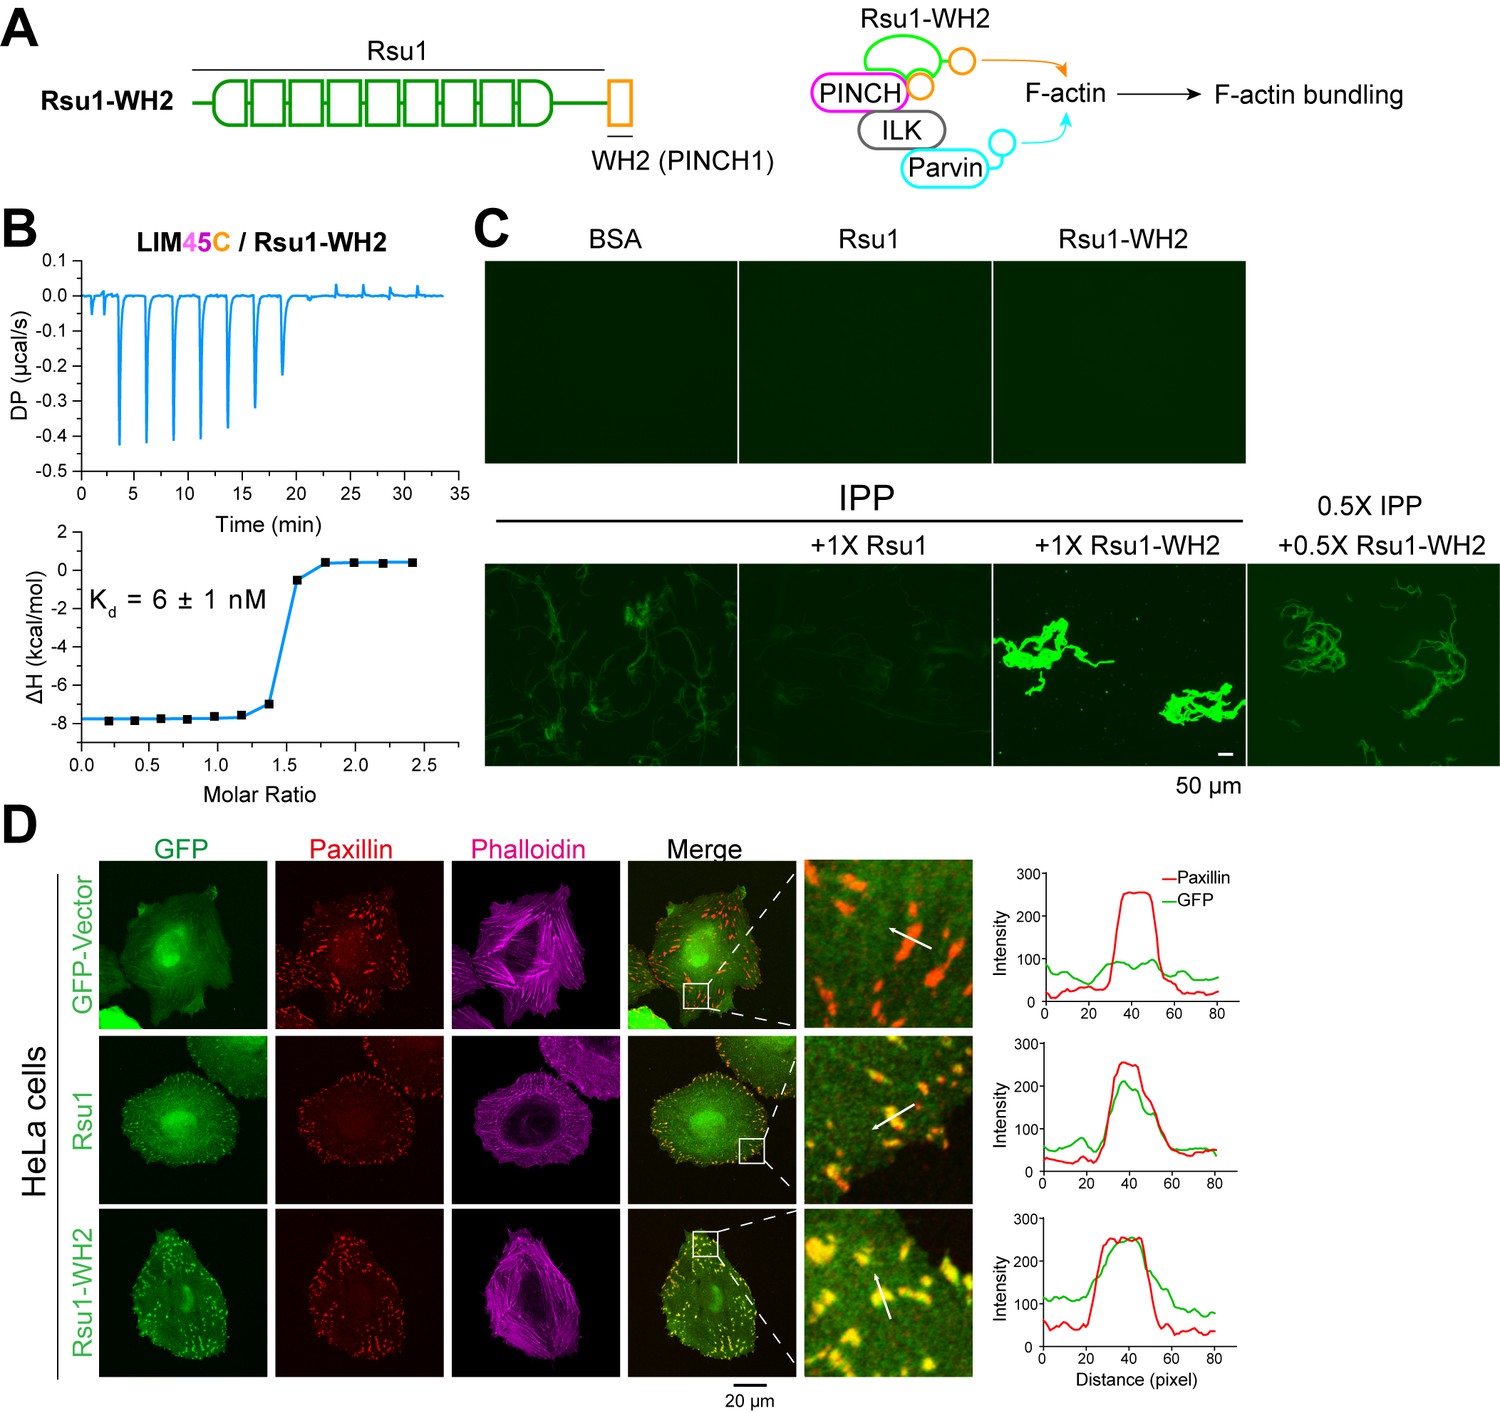
The inhibition of Rsu1 on the ILK/PINCH/Parvin (IPP) complex is released by the fusion of PINCH1-WH2.
(A) Design of the Rsu1-WH2 chimera, in which the WH2 motif (308–325) of PINCH1 was fused to the C-terminus of Rsu1. This chimera provides an additional WH2 motif for F-actin bundling as indicated by the schematic cartoon in the right panel. (B) Isothermal titration calorimetry (ITC) analysis showing that Rsu1-WH2 binds to PINCH1 with an affinity comparable to wild-type Rsu1. (C) Actin bundling assay showing the bundling effect of the IPP complex in the presence of Rsu1-WH2. Unlike wild-type Rsu1, Rsu1-WH2 cannot block the IPP-mediated actin bundling. The 1× protein concentration is 10 μM. (D) Confocal images of HeLa cells transfected with Rsu1 or Rsu1-WH2. Similar to wild-type Rsu1, Rsu1-WH2 was localized at the focal adhesions (FAs). However, the formation of stress fibers was not impaired in the cells transfected with Rsu1-WH2.
Figure 6—figure supplement 1
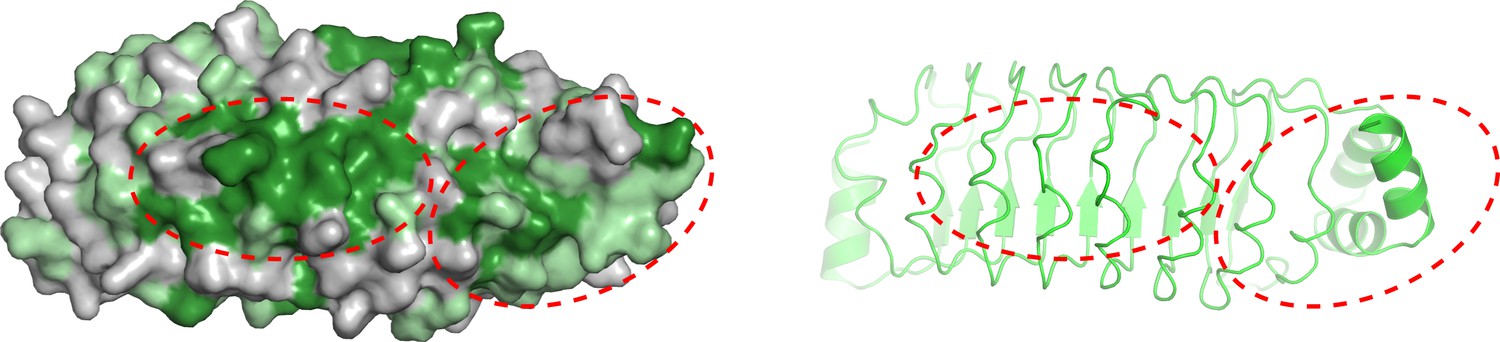
Conservation analysis of the convex surface on Rsu1.
Left panel: surface representations of Rsu1 to show the convex surface. The view is related to that in Figure 3A by rotating 180° along the y-axis. Right panel: cartoon representations of Rsu1 to show the convex side.
Author response image 1
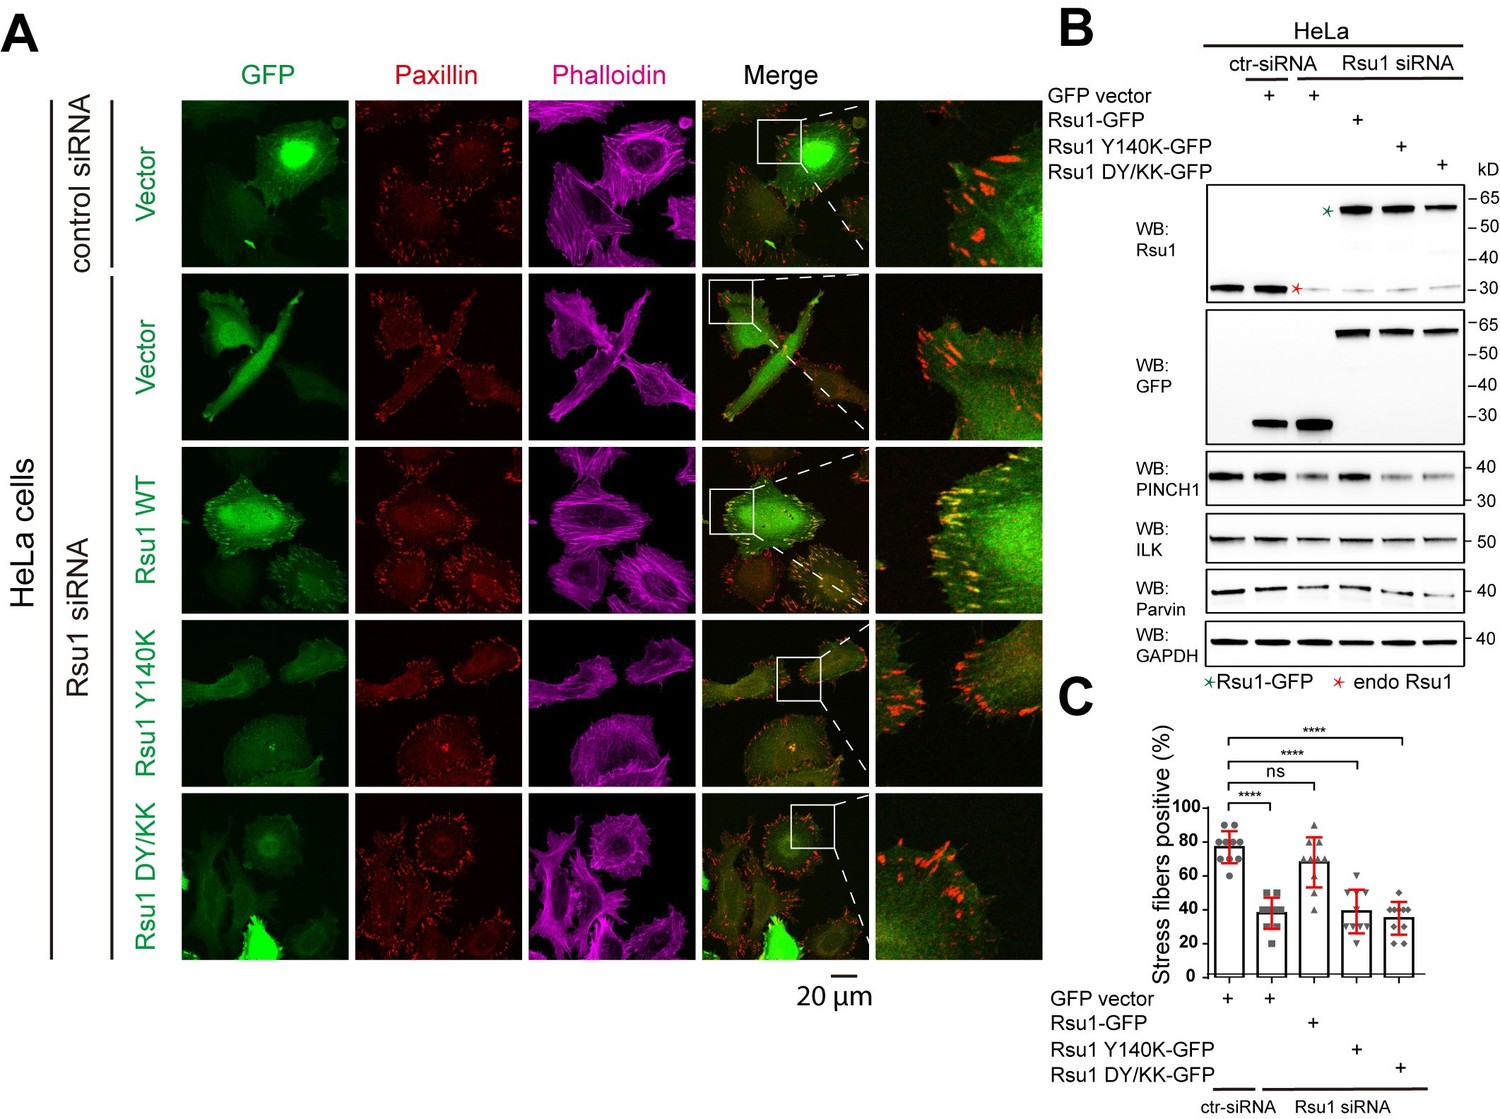
Depletion of Rsu1 in HeLa cells and rescue effects of wild type Rsu1 and its mutants.
(A) Confocal images of HeLa cells transfected with control siRNA and GFP-vector, or Rsu1-siRNA with GFP-vector, Rsu1-GFP or Rsu1 mutants. FAs and stress fibers were stained by paxillin and phalloidin, respectively. (B) The proteins level in normal cells or cells transfected with different siRNA or constructs was detected by western blot. The Rsu1-siRNA efficiently knocked down the endogenous Rsu1 and the GFP-Rsu1 or the mutants was expressed at a similar protein level, which are also comparable with the endogenous Rsu1 expression level. The protein level of ILK and α-parvin were also checked by western blot. (C) Quantification of the percentage of HeLa cells containing normal stress fiber formation as shown in a. Data was collected from 10 images in each sample. In each image, more than 10 cells were quantified. Significance was calculated by using student t test in GraphPad Prism. ***p<0.001, *p<0.05.
Author response image 2
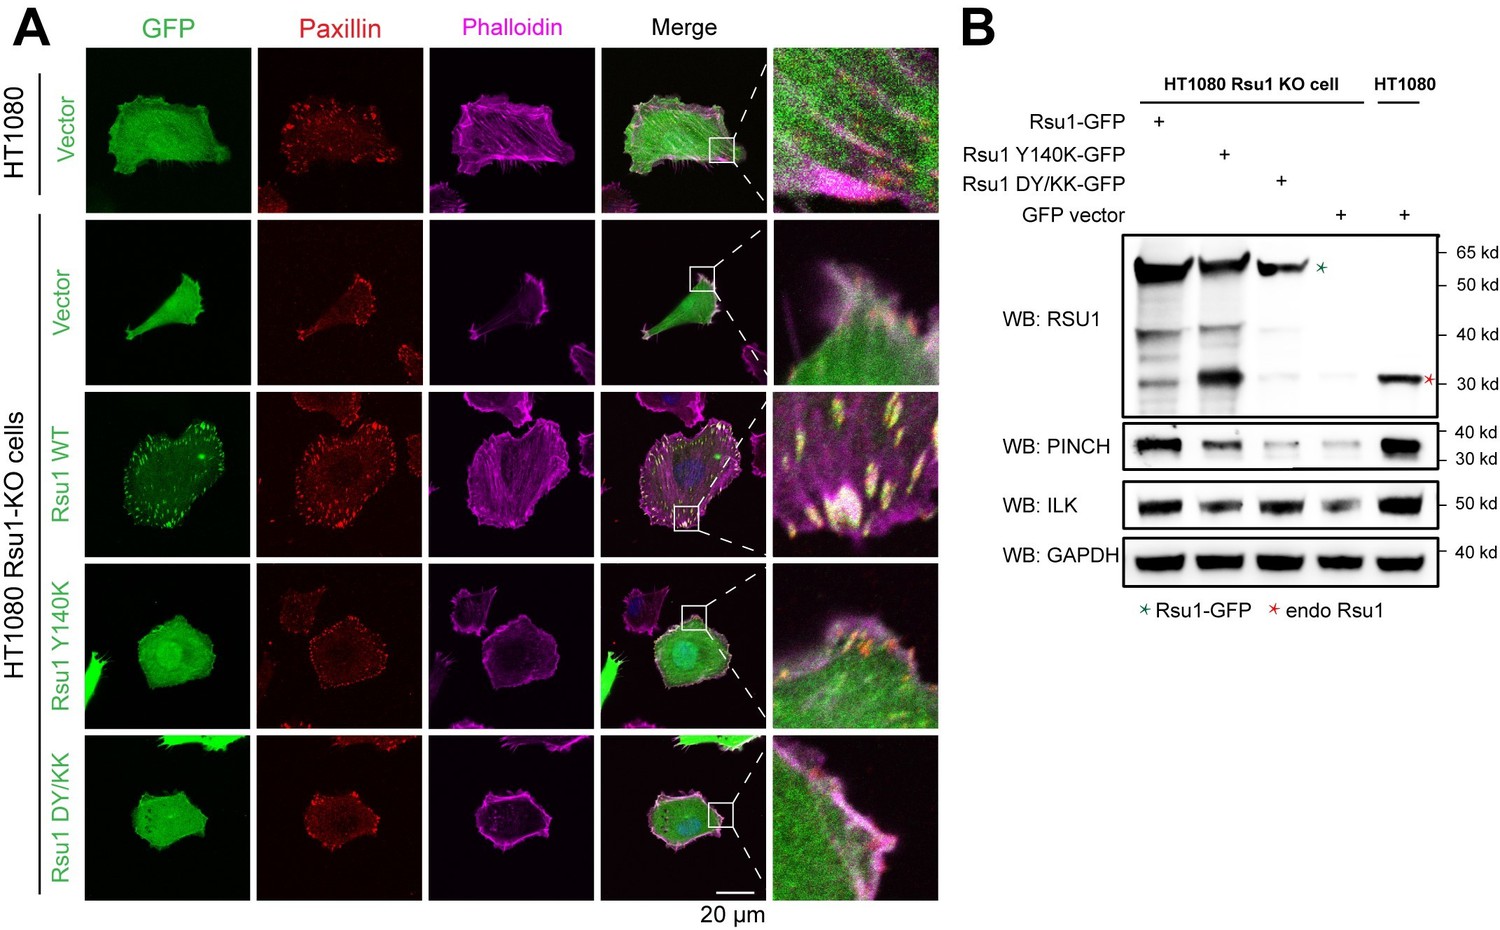
Rescue effect of wild type Rsu1 and its mutants in Rsu1-KO HT1080 cells.
(A) Confocal images of normal HT1080 cells or Rsu1-KO cells transfected with GFP-vector, Rsu1-GFP or Rsu1 mutants. FAs and stress fibers were stained by paxillin and phalloidin, respectively. (B) The proteins level of each cell in panel A was checked by western blot.
Author response image 3

SDS-PAGE analysis of the purified PINCH proteins.
Tables
Table 1
Statistics of data collection and model refinement.
| Rsu1ΔC/PINCH1_LIM5 (PDB id: 7D2S) | Rsu1/PINCH1_LIM45 (7D2T/7D2U) | ||
|---|---|---|---|
| Data collection | |||
| Space group | I 4 | P 21 | I 2 2 2 |
| Cell dimensions | |||
| a, b, c (Å) | 124.6, 124.6, 50.5 | 114.6, 51.3, 119.6 | 51.4, 144.4, 185.0 |
| α, β, γ (°) | 90, 90, 90 | 90, 101.6, 90 | 90, 90, 90 |
| Resolution (Å) | 50–1.65 (1.68–1.65) | 50–2.20 (2.24–2.20) | 50–3.15 (3.20–3.15) |
| Rmerge* | 0.089 (0.931) | 0.152 (1.204) | 0.131 (0.967) |
| I/σI | 31.2 (2.8) | 14.1 (1.4) | 26.0 (1.9) |
| CC1/2† | (0.823) | (0.687) | (0.885) |
| Completeness (%) | 100 (100) | 100 (100) | 99.9 (100) |
| Redundancy | 13.4 (12.9) | 6.7 (6.9) | 12.9 (12.4) |
| Refinement | |||
| Resolution (Å) | 50–1.65 (1.69–1.65) | 50–2.20 (2.25–2.20) | 50–3.15 (3.44–3.15) |
| No. reflections | 46570 (2695) | 70228 (4880) | 12487 (3033) |
| Rwork/Rfree‡ | 0.166 (0.241) / 0.185 (0.271) | 0.170 (0.281) / 0.198 (0.308) | 0.192 (0.262) / 0.216 (0.316) |
| No. atoms | |||
| Protein | 2236 | 6055 | 2980 |
| Ligand/ion | 14 | 74 | 17 |
| Water | 187 | 358 | 0 |
| Mean B (Å) | |||
| Protein | 32.4 | 53.1 | 134.2 |
| Ligand/ion | 32.2 | 78.1 | 151.2 |
| Water | 38.8 | 52.0 | - |
| r.m.s. deviations | |||
| Bond lengths (Å) | 0.006 | 0.003 | 0.002 |
| Bond angles (°) | 1.01 | 0.74 | 0.55 |
| Ramachandran analysis | |||
| Favored region (%) | 96.1 | 96.7 | 95.4 |
| Allowed region (%) | 3.9 | 3.3 | 4.6 |
| Outliers (%) | 0 | 0 | 0 |
-
The numbers in parentheses represent values for the highest resolution shell.
*Rmerge = ∑|Ii− Im|/∑Ii, where Ii is the intensity of the measured reflection and Im is the mean intensity of all symmetry related reflections.
-
†CC1/2 is the correlation coefficient of the half data sets.
‡Rwork = Σ||Fobs| − |Fcalc||/Σ|Fobs|, where Fobs and Fcalc are observed and calculated structure factors.
-
Rfree = ΣT||Fobs| − |Fcalc||/ΣT|Fobs|, where T is the test data set of about 4–5% of the total reflections randomly chosen and set aside prior to refinement.
Appendix 1—key resources table
| Reagent type (species) or resource | Designation | Source or reference | Identifiers | Additional information |
|---|---|---|---|---|
| Gene (Homo sapiens) | RSU1 | GenBank | NP_036557.1 | |
| Gene (Homo sapiens) | PINCH1 | GenBank | NP_001180417.1 | |
| Gene (Homo sapiens) | PINCH2 | GenBank | NP_001154875.1 | |
| Gene (Homo sapiens) | ILK | GenBank | NP_001014794.1 | |
| Gene (Homo sapiens) | Parvinα | GenBank | NP_060692.3 | |
| Recombinant DNA reagent | pFastBac-HTB-RSU1 | This paper | (1-277) / Full-length | BamHI/XhoI |
| Recombinant DNA reagent | pFastBac-HTB-RSU1 | This paper | (1-215) / LRR | BamHI/XhoI |
| Recombinant DNA reagent | pFastBac-HTB-RSU1 | This paper | /N69A/F71Q/R137E/Y140K/D143K/R165A/D115K-Y140K/D115K-D143K/F71Q-D115K-Y140K/WH2(308–325)/ | Kinds of Mutations in full-length gene |
| Recombinant DNA reagent | pEGFP-N3-hRSU1 | This paper | (1-277) / Full-length | HindIII / BamHI |
| Recombinant DNA reagent | pEGFP-N3-hRSU1 | This paper | /Y140K/D115K-Y140K/WH2/ | Kinds of Mutations in full-length gene |
| Recombinant DNA reagent | pET.32M.3C | PMID:19665975 | Dr. Mingjie Zhang (SUSTech, China) | |
| Recombinant DNA reagent | pET.32M.3C-hPINCH1 | This paper | LIM5C(249-325) | BamHI/XhoI |
| Recombinant DNA reagent | pET.32M.3C-hPINCH1 | This paper | LIM45C(188-325) | BamHI/XhoI |
| Recombinant DNA reagent | pET.32M.3C-hPINCH1 | This paper | LIM45(188-307) | BamHI/XhoI |
| Recombinant DNA reagent | pET.32M.3C-hPINCH1 | This paper | LIM45(188-325)-/D295K/K297D/F253Y-H254N/ | BamHI/XhoI |
| Recombinant DNA reagent | pET.32M.3C-hPINCH2 | This paper | LIM5C(276-363) | BamHI/XhoI |
| Recombinant DNA reagent | pRSF-SUMO-hPINCH1 | This paper | (1-325) / Full-length | NdeI/XhoI |
| Recombinant DNA reagent | pETDuet-SUMO-hILK(C346S-C422S) / His-hParvinα | This paper | hILK(1-452)C346S-C422S / hParvinα(1-372) | (EcoRI/HindIII) for hILK (Recombinational method) for hParvinα |
| Peptide, recombinant protein | actin | Cytoskeleton, Inc | Cat. # AKL99 | Rabbit Skeletal Muscle |
| Strain, strain background (Escherichia coli) | BL21(DE3) | Kangti Health | Cat. # KTSM104L | |
| Strain, strain background (Escherichia coli) | Rosseta(DE3) | PMID:28966017 | Dr. Mingjie Zhang (SUSTech, China) | |
| Cell line (Spodoptera frugiperda) | IPLB‐SF21‐AE | Gibco/Thermo Fisher | Cat. # 11496015 | Maintained in Sf-900 II SFM, large scale in ESF 921 |
| Cell line (Homo sapiens) | HeLa | National Collection of Authenticated Cell Cultures | Cat. # TCHu187 | |
| Chemical compound, drug | Sf-900 II SFM | Gibco/Thermo Fisher | Cat. # 10-902-096 | Medium for Sf9 cell |
| Chemical compound, drug | ESF 921 | Expression Systems | Cat. # 96-001-01 | Medium for Sf9 cell |
| Chemical compound, drug | MEM | CORNING | Cat. # 10–010-CV | |
| Chemical compound, drug | DMEM | CORNING | Cat. # 10–013-CVRC | |
| Chemical compound, drug | Fetal Bovine Serum | PAN BIOTECH | Cat. # P30-3302 | |
| Chemical compound, drug | Fibronectin | Millipore | Cat. # FC020-5MG | |
| Chemical compound, drug | Cellfectin II Reagent | Thermo Fisher | Cat. # 10362100 | Transfection reagent for Sf9 cell |
| Chemical compound, drug | Lipofectamine 2000 reagent | Invitrogen | Cat. # 11668–019 | Transfection reagent for HeLa cell |
| Chemical compound, drug | Lipofectamine 3000 reagent | Invitrogen | Cat. # L3000-015 | Transfection reagent for HeLa cell |
| Chemical compound, drug | Alexa Fluor 488 Phalloidin | Invitrogen/THermo Fisher | Cat. # A12379 | F-actin staining (1:100, v/v) |
| Chemical compound, drug | Alexa Fluor 594 Phalloidin | Invitrogen/THermo Fisher | Cat. # A12381 RRID: AB_2315633 | IF (1:200, v/v) |
| Chemical compound, drug | Alexa Fluor 647 Phalloidin | Invitrogen/THermo Fisher | Cat. # A22287 RRID: AB_2620155 | IF (1:100, v/v) |
| Chemical compound, drug | DAPI stain | SIGMA | D9542 | 1 µg/mL |
| Antibody | Anti-Paxillin (mouse monoclonal) | BD Bioscience | Cat. # 610620 RRID: AB_397952 | IF (1:500) |
| Antibody | Anti-Rsu1 (rabbit polyclonal) | Thermo Fisher Scientific | Cat. # A305-422A RRID: AB_2631813 | WB (1:4000) |
| Antibody | Anti-PINCH (mouse monoclonal) | BD Bioscience | Cat. # 612711 | WB (1:1000) |
| Antibody | Anti-Parvin (mouse) | Millipore | Cat. # MABT157 | WB (1:1000) |
| Antibody | Anti-ILK (mouse polyclonal) | BD Bioscience | Cat. # 611803 RRID: AB_399283 | WB (1:1000) |
| Antibody | Anti-GAPDH (mouse monoclonal) | TRANSGEN | Cat. # HC301-02 RRID: AB_2629434 | WB (1:3000) |
| Antibody | Anti-GFP (mouse monoclonal) | TRANSGEN | Cat. # HT801 | WB (1:3000) |
| Antibody | Anti-Mouse IgG (H+L), Alexa Fluor 594 (donkey) | Thermo Fisher Scientific | Cat. # A21203; RRID: AB_141633 | IF (1:1000) |
| Antibody | Anti-mouse IgG, HRP-linked Antibody (horse) | Cell Signaling | Cat. # 7076 RRID: AB_330924 | WB (1:10000) |
| Antibody | Anti-rabbit IgG, HRP-linked Antibody (goat) | Cell Signaling | Cat. # 7074 RRID: AB_2099233 | WB (1:10000) |
| Commercial assay or kit | Western ECL substrate | BIO-RAD | Cat. # 170–5061 | |
| Software, algorithm | ASTRA6 | WYATT Technology | PRID:SCR_016255 | |
| Software, algorithm | MicroCal PEAQ-ITC integrated Software package | Malvern Panalytical | ||
| Software, algorithm | OriginPro | OriginLab | Learning Edition | |
| Software, algorithm | GraphPad Prism | GraphPad Software | RRID: SCR_002798 | |
| Software, algorithm | Image pro plus | MEDIA CYBERNETICS | RRID: SCR_016879 | |
| Software, algorithm | Image J | National Institutes of Health | RRID: SCR_003070 |
Additional files
Download links
A two-part list of links to download the article, or parts of the article, in various formats.
Downloads (link to download the article as PDF)
Open citations (links to open the citations from this article in various online reference manager services)
Cite this article (links to download the citations from this article in formats compatible with various reference manager tools)
Complex structures of Rsu1 and PINCH1 reveal a regulatory mechanism of the ILK/PINCH/Parvin complex for F-actin dynamics
eLife 10:e64395.
https://doi.org/10.7554/eLife.64395


