GSK3 inhibition rescues growth and telomere dysfunction in dyskeratosis congenita iPSC-derived type II alveolar epithelial cells
- Medical Scientist Training Program, Perelman School of Medicine, University of Pennsylvania, United States
- Cell and Molecular Biology Graduate Group, Perelman School of Medicine, University of Pennsylvania, United States
- Perelman School of Medicine, University of Pennsylvania, United States
- Institute for Regenerative Medicine, University of Pennsylvania, United States
- Department of Medicine, Perelman School of Medicine, University of Pennsylvania, United States
- Department of Pathology and Laboratory Medicine, Perelman School of Medicine, University of Pennsylvania, United States
- College of Arts and Sciences and Vagelos Scholars Program, University of Pennsylvania, United States
- Penn Genomic Analysis Core, Perelman School of Medicine, University of Pennsylvania, United States
- Penn Cardiovascular Institute, University of Pennsylvania, United States
- Penn-CHOP Lung Biology Institute, University of Pennsylvania, United States
- Division of Pediatric Cardiology, Department of Pediatrics, Children's Hospital of Philadelphia, United States
- Department of Biomedical Sciences, School of Veterinary Medicine, University of Pennsylvania, United States
- Institute on Aging, University of Pennsylvania, United States
Figures
Figure 1 with 4 supplements
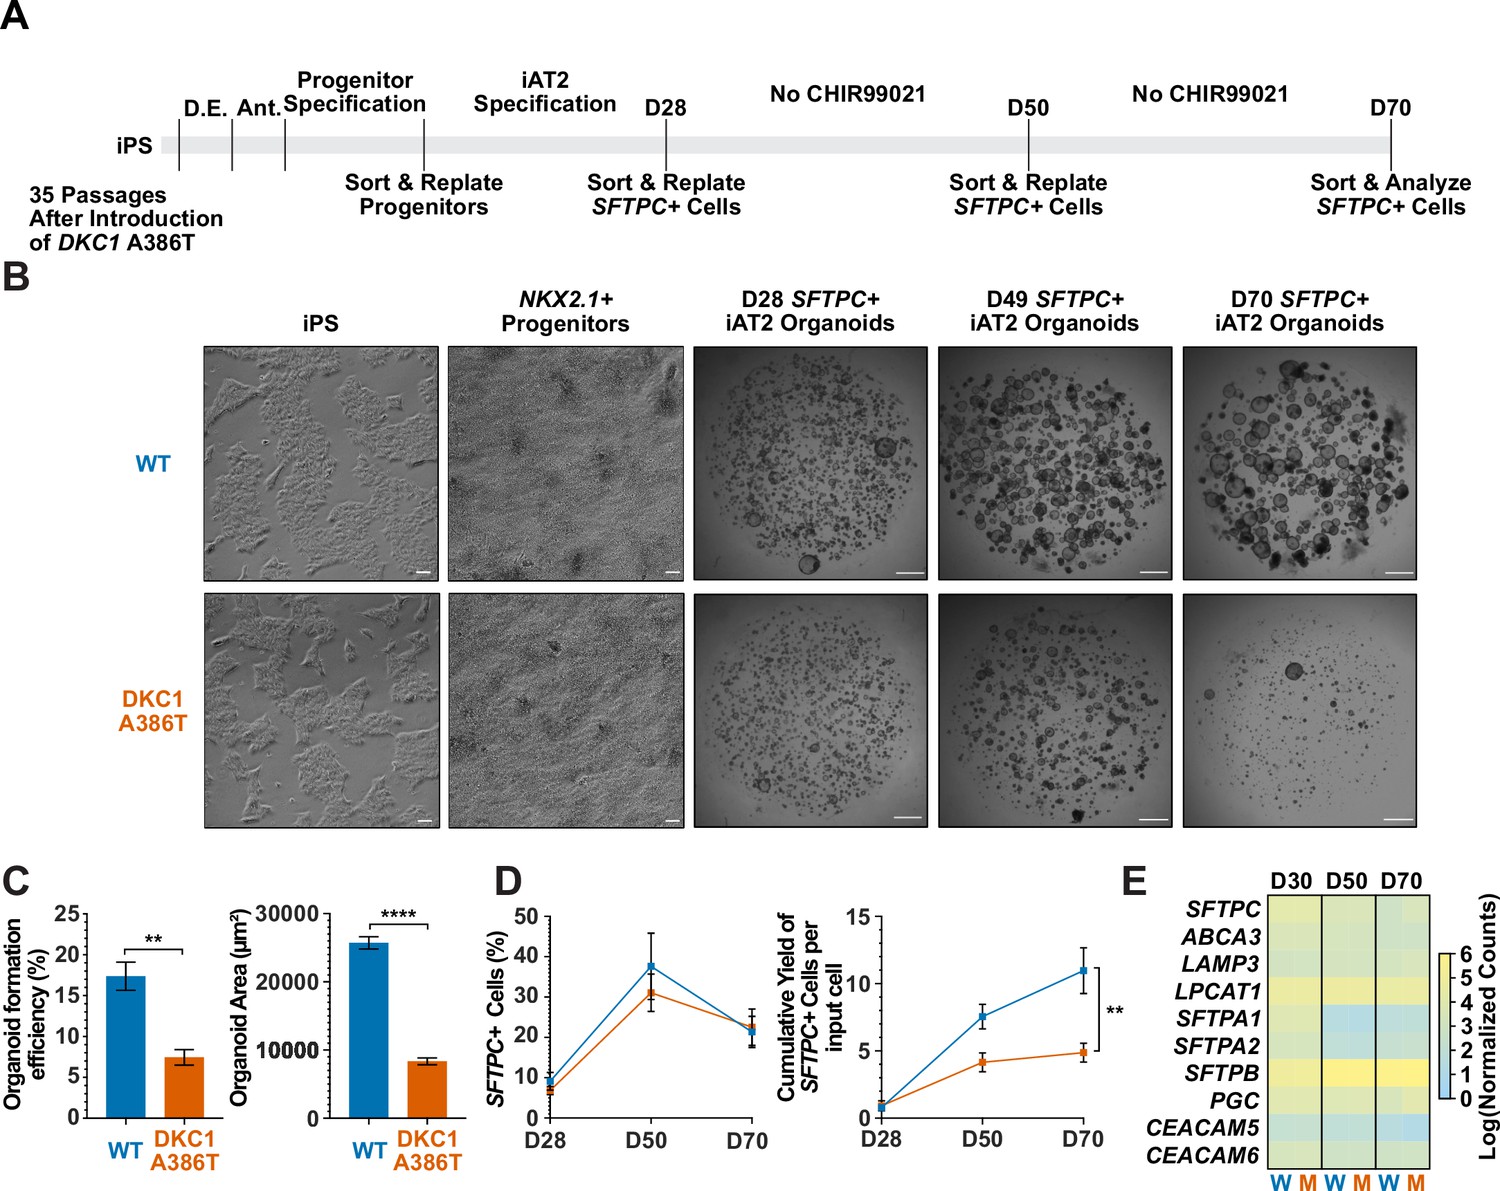
Dyskeratosis congenita induced pluripotent stem cell (iPSC)-derived type II alveolar epithelial cells (iAT2s) fail to form alveolospheres with successive passaging.
(A) Differentiation protocol used to probe the effects of the DKC1 A386T mutation on iAT2 cells. D.E., definitive endoderm specification; Ant., anteriorization. (B) Representative images of differentiating wild type and DKC1 A386T mutant bearing iAT2 alveolospheres (scale bars, 100 µm as indicated for iPS and NKX2.1+ progenitors; 1 mm for all alveolosphere images). (C) Quantifications of alveolosphere area and formation efficiency on D70 (n = 4; ** p<0.01, **** p<0.0001, and Student’s t-test). (D) Quantification of the percentage SFTPC+ cells and the number of SFTPC+ cells produced with passage of the iAT2 cells shows DKC1 A386T iAT2 alveolospheres accumulate fewer SFTPC+ cells (n = 4; ** p<0.01, and Student’s t-test). (E) RNA-seq of sorted SFTPC+ iAT2 cells at different passages shows AT2 cell genes are not grossly affected by the DKC1 A386T mutation (n = 4, W = wild type, M = mutant).
-
Figure 1—source data 1
Source Data for Figure 1C-E.
Figure 1C-SourceData-FormationEfficiency&OrganoidArea.pzfx – Raw counts of organoid counts normalized to number of cells input to calculate formation efficiency as well as area measurements along with statistical tests. Figure 1D-SourceData-SFTPC%&SFTPCCumYield.pzfx – Percentage SFTPC+ along the differentiation of the induced pluripotent stem cell-derived type II alveolar epithelial cells (iAT2s) from sort flow plots along with cumulative yield of surfactant protein C calculated as the number of SFTPC+ cells produced over the experiment over time. Figure 1E-SourceData-AT2Markers.pzfx – Raw counts from RNA-seq of iAT2s over the differentiation specifically looking at AT2 markers.
- https://cdn.elifesciences.org/articles/64430/elife-64430-fig1-data1-v2.zip
Figure 1—figure supplement 1
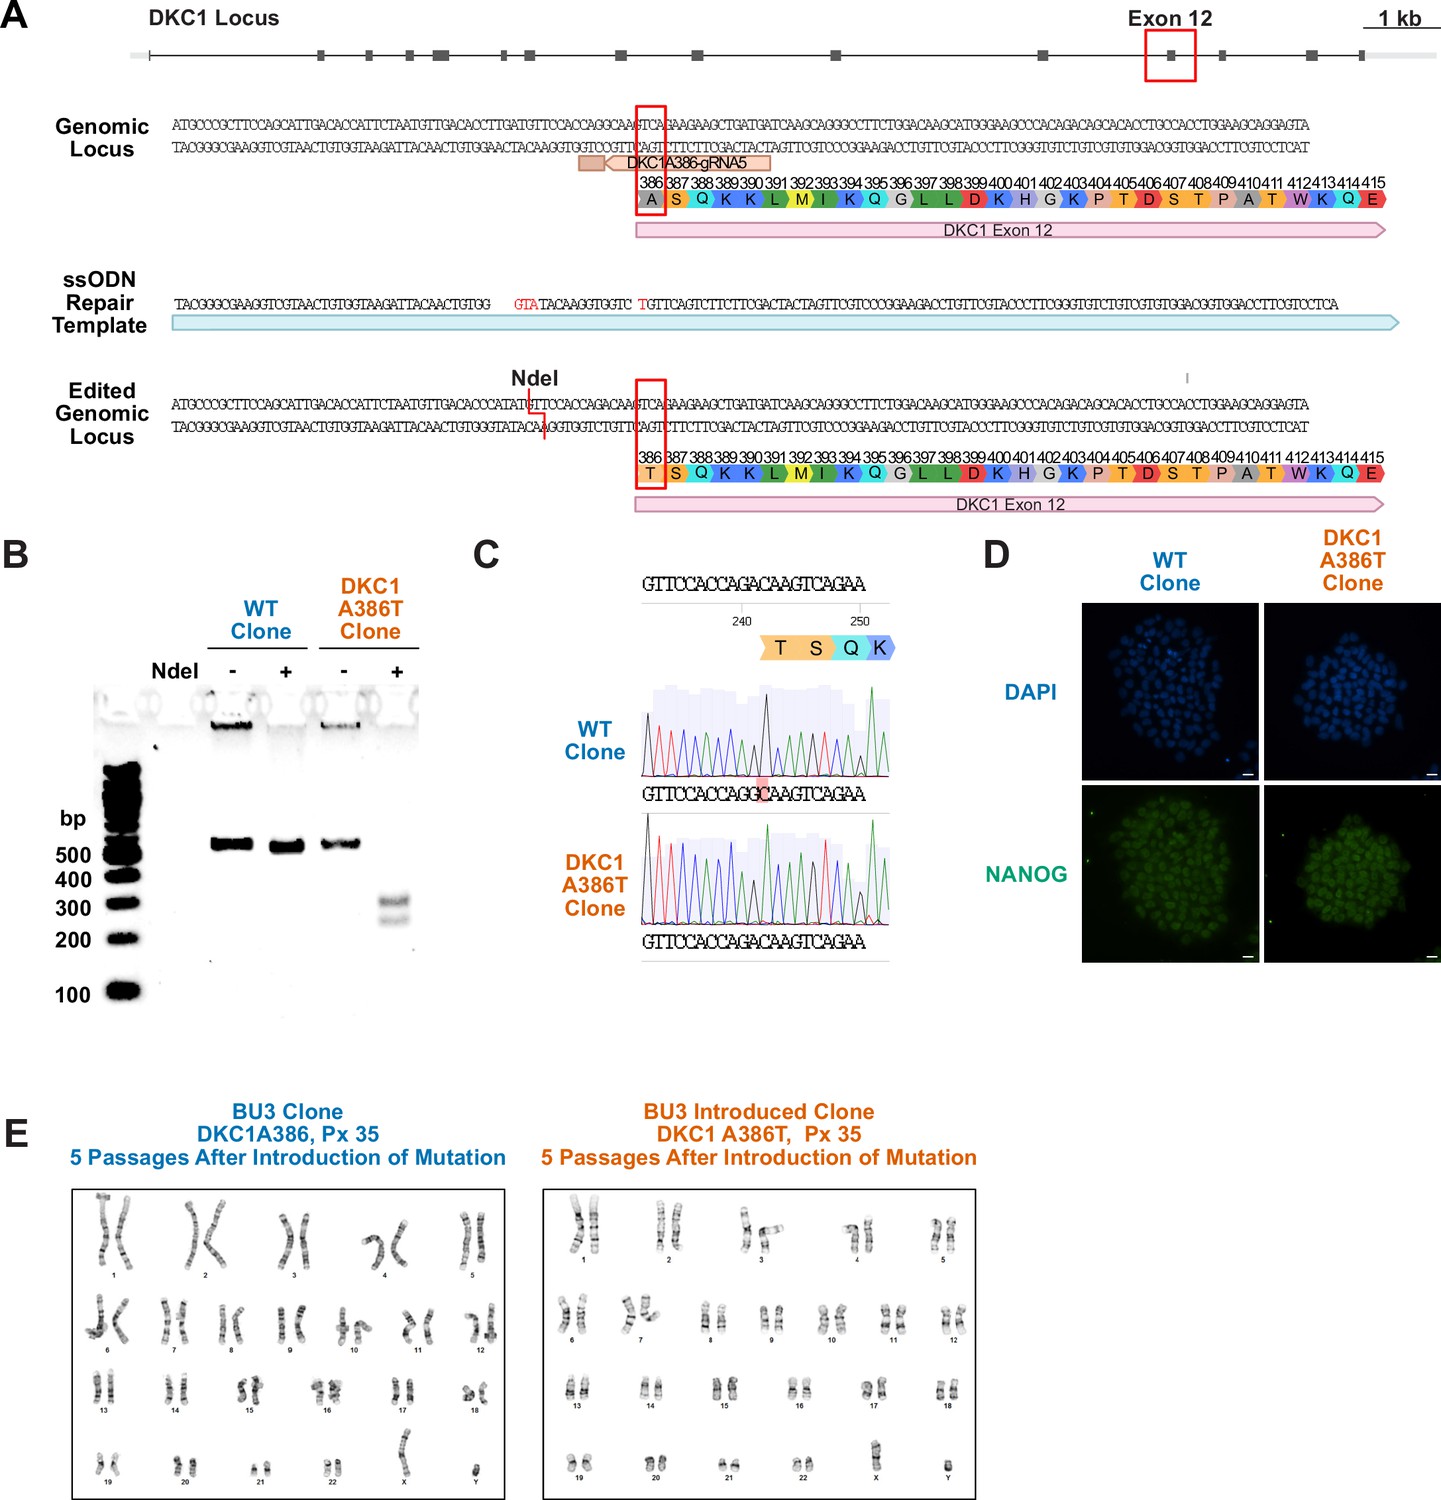
Introduction of the DKC1 A386T mutation into the BU3 NKX2.1::GFP SFTPC::TdTomato (NGST) induced pluripotent stem (iPS) cell line.
(A) CRISPR-based editing strategy for introducing the DKC1 A386T mutation into the BU3 NSGT iPS cell line. (B) Genotyping by RFLP of DKC1 A386T clonal cell lines and their wild-type (WT) counterparts that also were exposed to the CRISPR reagents using the introduced NdeI site. (C) Sanger sequence verification of the introduction of the mutation yielding 1156G>A. Note the WT sequence is marked in red. (D) Paired iPS cell clones maintain high expression of NANOG, a marker of pluripotency (scale bars, 100 µm). (E) Paired iPS cell clones show normal karyotypes after the introduction of the DKC1 A386T mutation.
-
Figure 1—figure supplement 1—source data 1
Source data for Figure 1—figure supplement 1B,C and E.
Figure 1—figure supplement 1B-SourceData-2020-07-17-FigureS1-NdeIGeno-CroppingLabeled.tiff – Genotyping agarose gel showing area that was cropped for the Figure 1—figure supplement 1B. Figure 1—figure supplement 1B-SourceData-2020-07-17-FigureS1-NdeIGeno.tiff – Raw agarose gel image for Figure 1—figure supplement 1B. Figure 1—figure supplement 1C-SourceData-DKC1A386T-34.2DA9_B05_045.ab1 – Sanger sequencing file for Figure 1—figure supplement 1C of BU3 NGST DKC1 A386T mutant iPS line. Figure 1—figure supplement 1C-SourceData-WT-33.3EF6_A05_047.ab1 – Sanger sequencing file for Figure 1—figure supplement 1C of BU3 NGST wild type (WT) control iPS line. Figure 1—figure supplement 1E-SourceData-DKC1A386T-KaryotypeImageCLG-35870.pdf – Image of a representative karyotype of BU3 NGST DKC1 A386T iPS line. Figure 1—figure supplement 1E-SourceData-DKC1A386T-REPORTCLG-35870.pdf – Report of karyotype analysis for BU3 NGST DKC1 A386T iPS line. Figure 1—figure supplement 1E-SourceData-WT-KaryotypeImageCLG-35869.pdf – Image of a representative karyotype of BU3 NGST WT control iPS line. Figure 1—figure supplement 1E-SourceData-WT-REPORTCLG-35869.pdf – Report of karyotype analysis for BU3 NGST WT control iPS line.
- https://cdn.elifesciences.org/articles/64430/elife-64430-fig1-figsupp1-data1-v2.zip
Figure 1—figure supplement 2
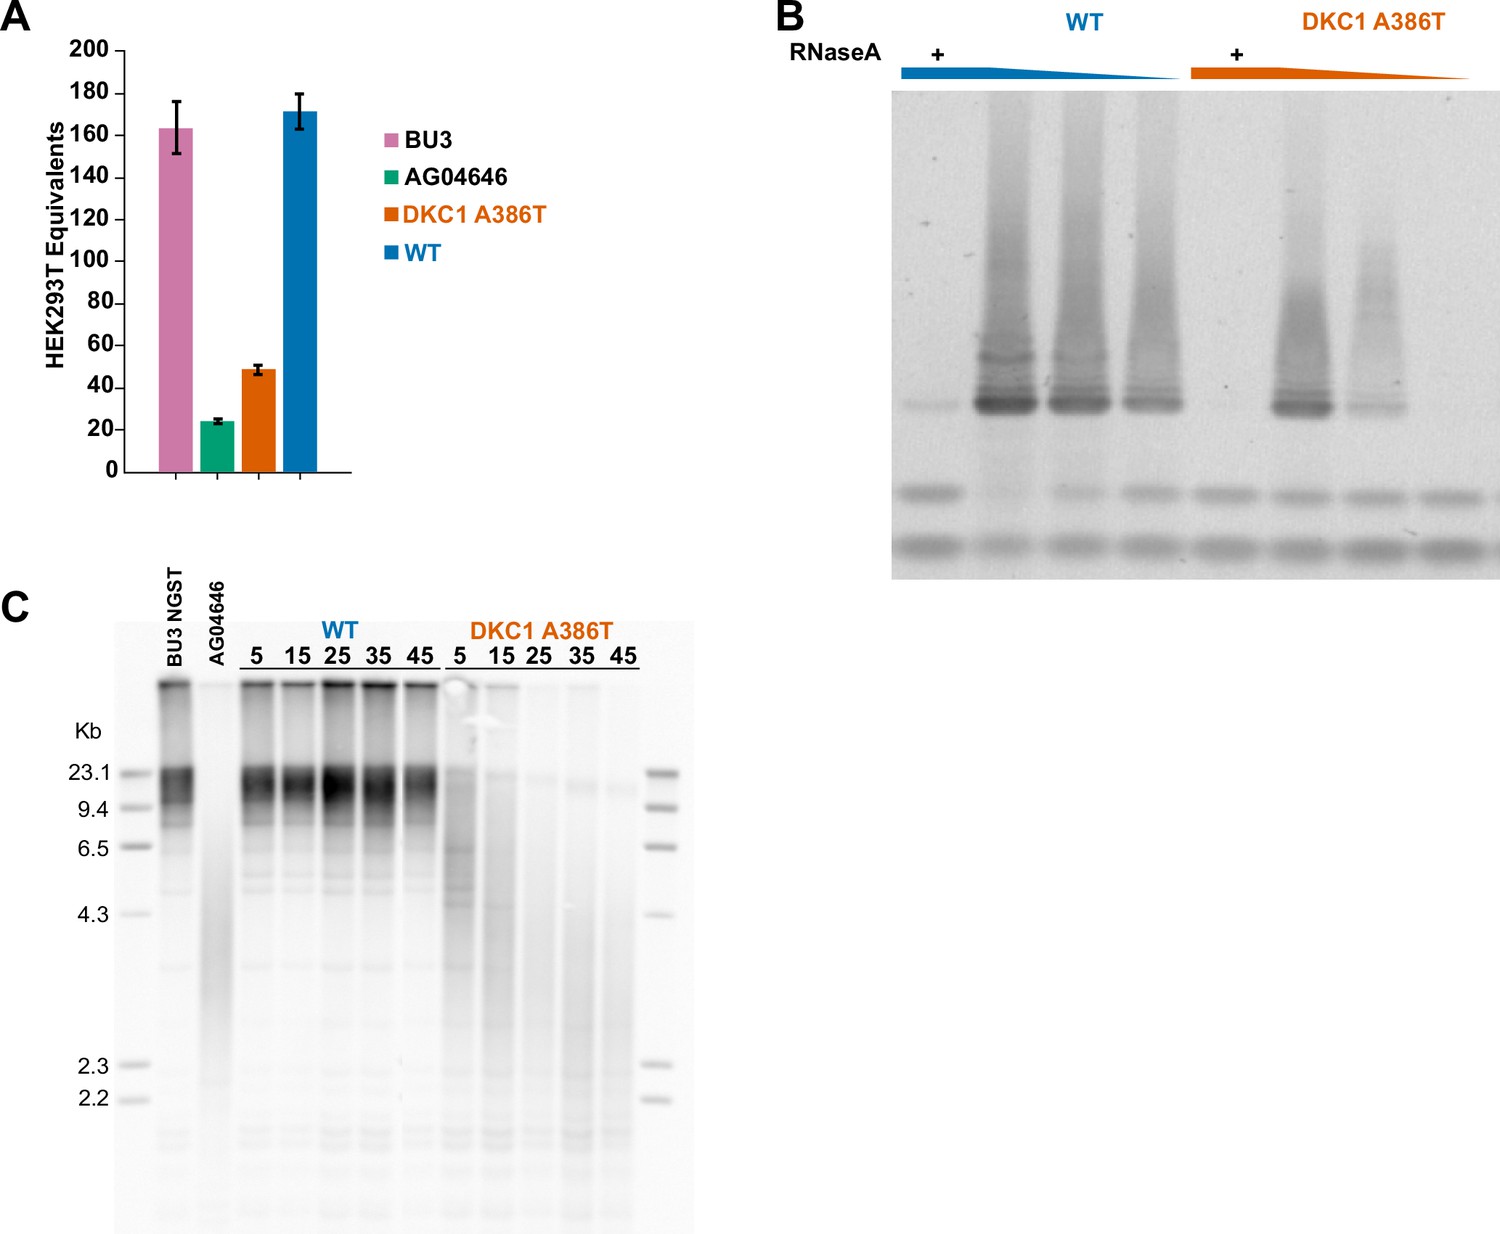
DKC1 A386T induced pluripotent stem (iPS) cells show decreased telomerase activity and telomeres shorten with passage.
(A) Quantitative telomeric repeat amplification protocol assay for telomerase activity in iPS cells shows a reduction in relative telomerase activity in DKC1 A386T introduced line (n = 3). AG04646 is an iPSC line derived from a dyskeratosis congenita patient with the A386T mutation, and the wild-type (WT) line is an unedited clone derived along with the A386T-introduced clone from the BU3 parental iPSC line. (B) Telomeric repeat amplification protocol assay for telomerase activity in iPS cells using a fivefold dilution series of the cellular extracts shows a reduction in relative telomerase activity in DKC1 A386T introduced lines. (C) Terminal restriction fragment telomere length analyses in the WT and DKC1 A386T paired iPS cells compared to the parental iPS line (BU3 NGST) and the patient derived iPS line (AG04646). Above each lane is the number of passages from the introduction of the mutation.
-
Figure 1—figure supplement 2—source data 1
Source data for Figure 1—figure supplement 2A-C.
Figure 1—figure supplement 2A-SourceData-qTRAPiPS-2018-09-06-007_qTRAP_BU3_Paired_Cell_Line.xlsx – Raw Cq (quantification cycle) data for quantitative telomeric repeat amplification protocol of different iPS lines. Figure 1—figure supplement 2B-SourceData-iPSWTDKC1A386TTRAP-2020-07-24-102Intense.tiff – Uncropped image of telomeric repeat amplification protocol (TRAP) gel for Figure 1—figure supplement 2B. Figure 1—figure supplement 2C-SourceData-2019-03-29-055TRFBU3A386T_60_60_60-Cropped.tif – Uncropped image of TRAP gel for Figure 1—figure supplement 2B showing where cropping occurred. Figure 1—figure supplement 2C-SourceData-2019-03-29-055TRFBU3A386T_60_60_60.tif – Uncropped raw image of Terminal restriction fragment (TRF blot for Figure 1—figure supplement 2C). Figure 1—figure supplement 2C-SourceData-2019-03-29-055TRFBU3A386T_60_60_60-Cropped.tiff – Uncropped raw image of TRF blot for Figure 1—figure supplement 2C showing how cropping removed the central ladder to aid in observation of iPS lines.
- https://cdn.elifesciences.org/articles/64430/elife-64430-fig1-figsupp2-data1-v2.zip
Figure 1—figure supplement 3
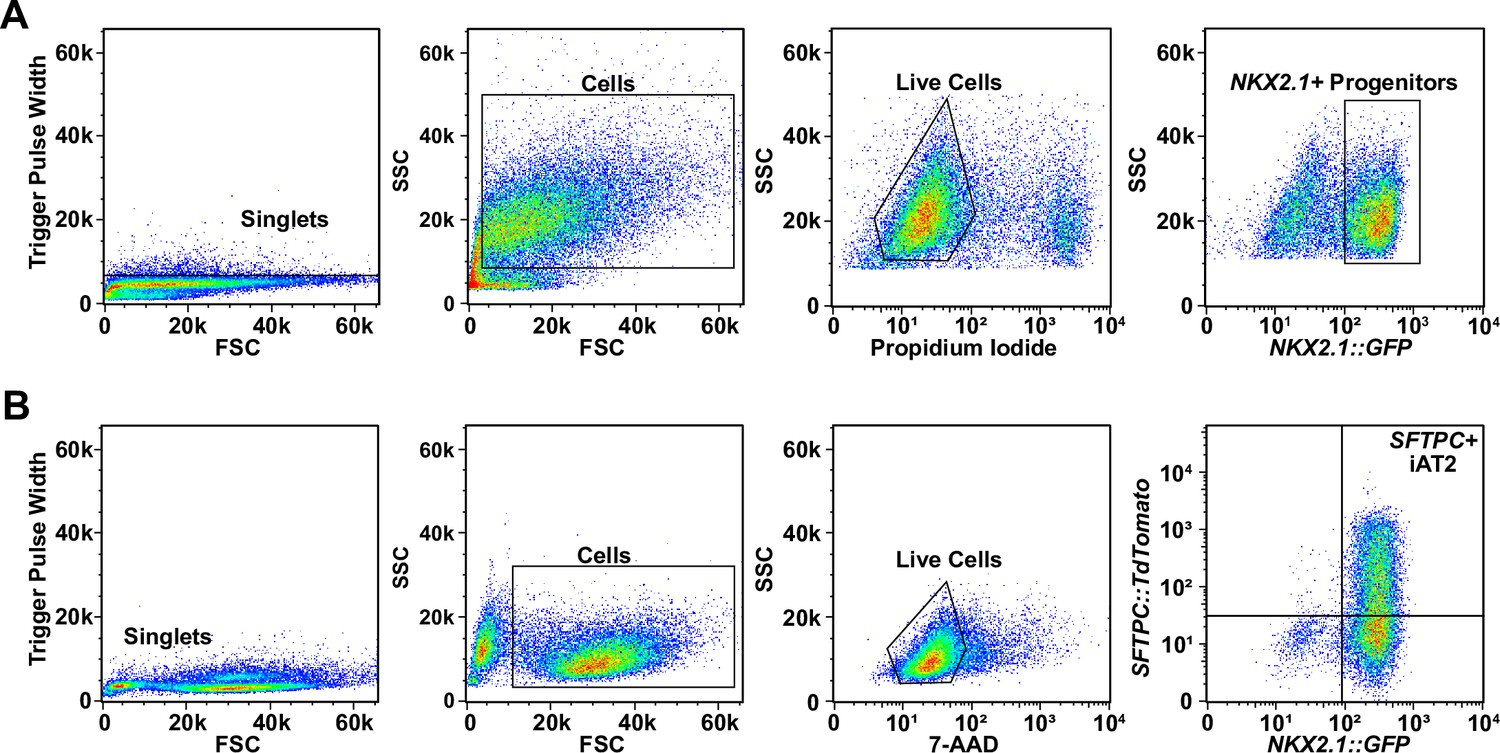
Representative sorting strategies for NKX2.1+ progenitors and SFTPC+ induced pluripotent stem cell-derived type II alveolar epithelial (iAT2) cells.
(A) Representative sorting strategy for NKX2.1+ progenitors. (B) Representative sorting strategy for SFTPC+ cells from iAT2 alveolospheres.
Figure 1—figure supplement 4
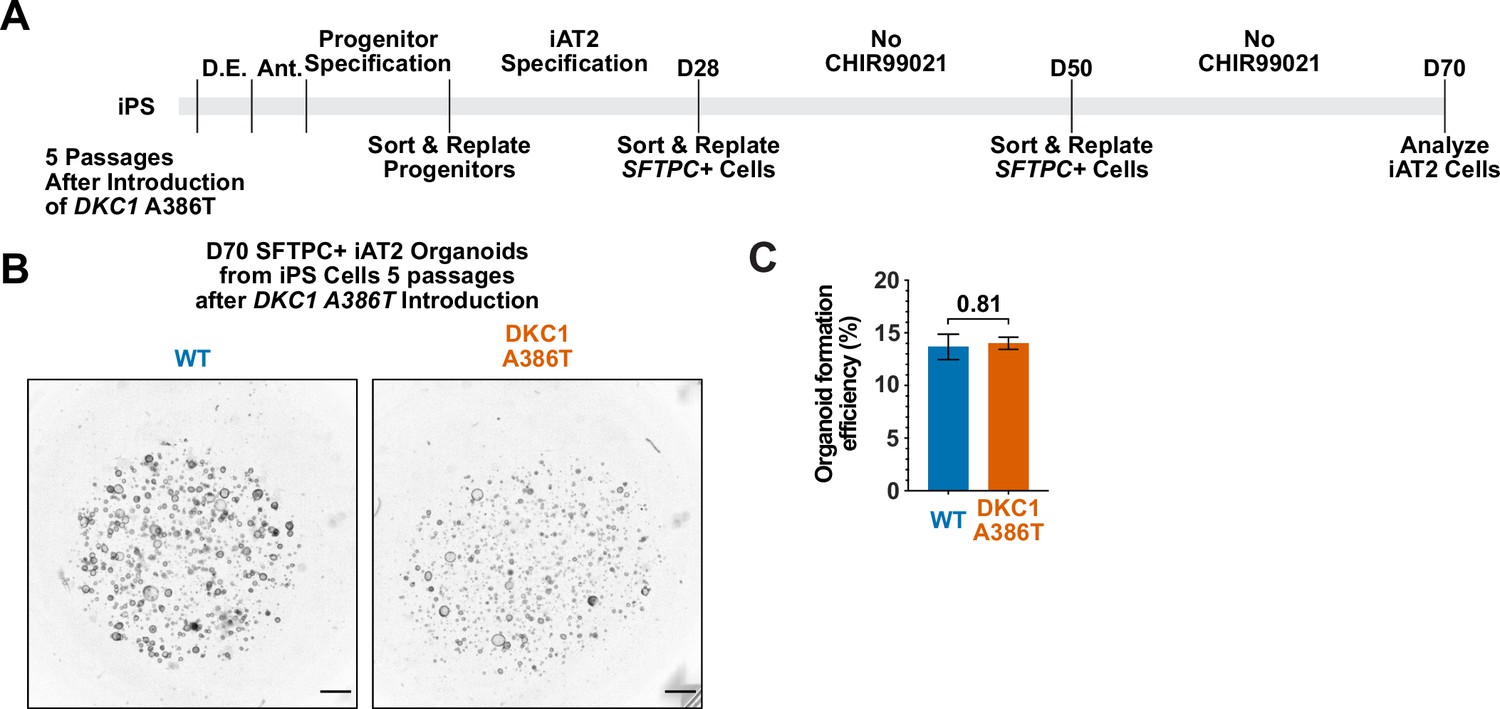
Differentiation of induced pluripotent stem cell (iPSC)-derived type II alveolar epithelial cell (iAT2) alveolospheres from early passage iPS cells yields no growth defect.
(A) Differentiation protocol used to probe the effects of the DKC1 A386T mutation on iAT2 cells. D.E., definitive endoderm specification; Ant., anteriorization. (B) Representative images of differentiating wild type (WT) and DKC1 A386T mutant bearing iAT2 alveolospheres derived from iPS cells that have undergone five passages after introduction of the mutation. (scale bars, 1 mm). (C) Quantifications of the formation efficiency on D70 of iAT2 alveolospheres derived from iPS cells that have undergone five passages after introduction of the mutation (n=3, p=0.81, and Student’s t-test).
Figure 2 with 2 supplements
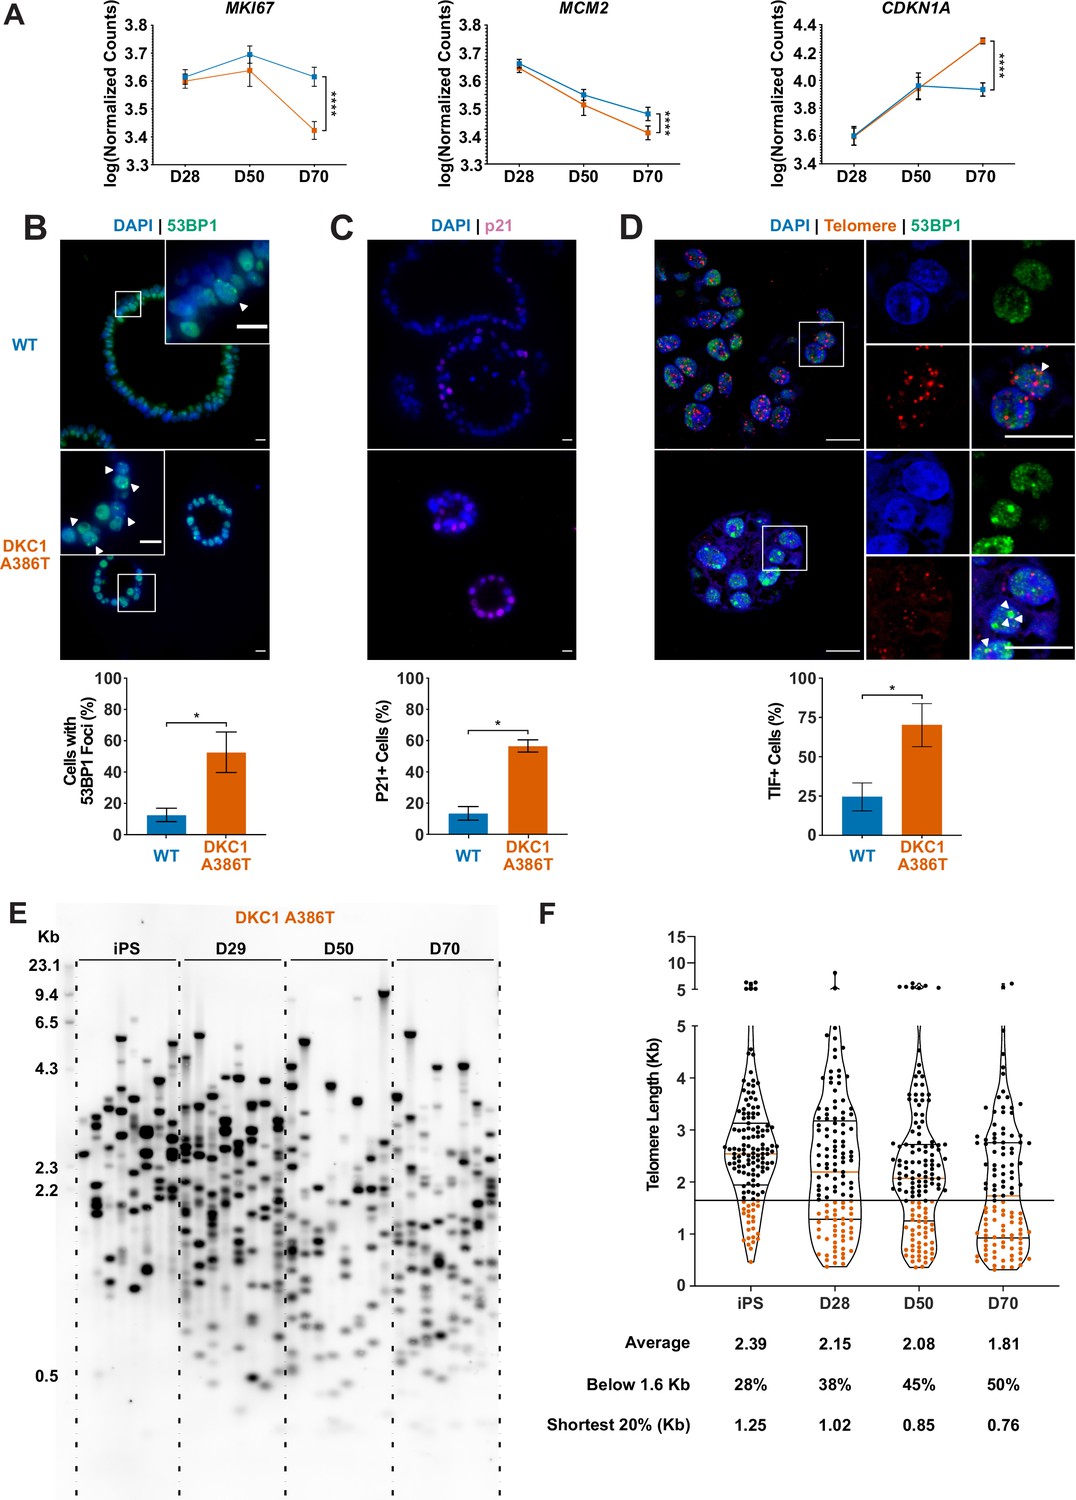
Dyskeratosis congenita induced pluripotent stem cell-derived type II alveolar epithelial cells (iAT2s) 35 passages after introduction of the mutation at D70 show hallmarks of senescence.
(A) Gene expression profiling of iAT2 cells at D28 and D50 shows no difference between wild type and DKC1 A386T in expression of markers of proliferation and a cell cycle inhibitor, while at D70 cells, there is a significant decrease in MCM2 and MKI67 as well as a significant increase in CDKN1A (p21) (n = 4, **** p<0.0001, DEseq2 pairwise contrast statistics). (B) At D70, DKC1 A386T mutant iAT2 cells have a higher fraction of cells with 53BP1 foci (n = 4, * p<0.05, and Student’s t-test; scale bars, 10 µm; insets highlight cells with 53BP1 foci as noted by the white arrowheads). (C) At D70, DKC1 A386T mutant iAT2s have a higher fraction of cells positive for p21 (n = 4, * p<0.05, and student’s t-test; scale bars, 10 µm). (D) At D70, DKC1 A386T mutant iAT2s have a higher fraction of cells with telomere dysfunction induced foci (TIFs) (n = 4, * p<0.05, and Student’s t-test; scale bars, 10 µm; insets highlight cells with TIFs, each one noted by a white arrowhead). (E) Representative TeSLA of DKC1 A386T iAT2 alveolospheres shows telomeres shorten with passage. (F) Quantification of DKC1 A386T iAT2 cell telomere lengths shows a preponderance of short telomeres appears as the iAT2 cells approach D70, red colored data points highlight telomeres under the 1.6 kb threshold (n = 2, ‘shortest 20%’ reports the 20th percentile of telomere length, in Kb).
-
Figure 2—source data 1
Source data for Figure 2.
Figure 2A-SourceData-iAT2-SenescentGeneExpression.pzfx – Raw counts from RNA-seq of induced pluripotent stem cell-derived type II alveolar epithelial cells over the differentiation specifically looking at specific senescence related genes.
Figure 2B-SourceData-53BP1PositiveCounts.pzfx – Raw counts of 53BP1 positive cells along with statistics. Figure 2C-SourceData-p21PositiveCounts.pzfx – Raw counts of p21 positive cells along with statistics. Figure 2D-SourceData-TIFPhenotype.pzfx – Raw counts of telomere dysfunction induced foci positive cells along with statistics. Figure 2E,F-SourceData-2020-08-31-TeSLABlotMerged-Cropped.tiff – Uncropped raw image of TeSLA blot along the differentiation showing where the crop was placed for Figure 2E. This is the same blot as used in Figure 4—figure supplement 3B. Figure 2E,F-SourceData-2020-08-31-TeSLABlotMerged.tiff – Uncropped raw image of TeSLA blot along the differentiation showing where the crop was placed for Figure 2E. This is the same blot as used in Figure 4—figure supplement 3B. Figure 2E,F-SourceData-TeSLADKC1A386TAlongDiff.pzfx – Raw counts from TeSLA quant software analysis of cropped blot looking at telomere length along the differentiation along with statistical analysis.
- https://cdn.elifesciences.org/articles/64430/elife-64430-fig2-data1-v2.zip
Figure 2—figure supplement 1
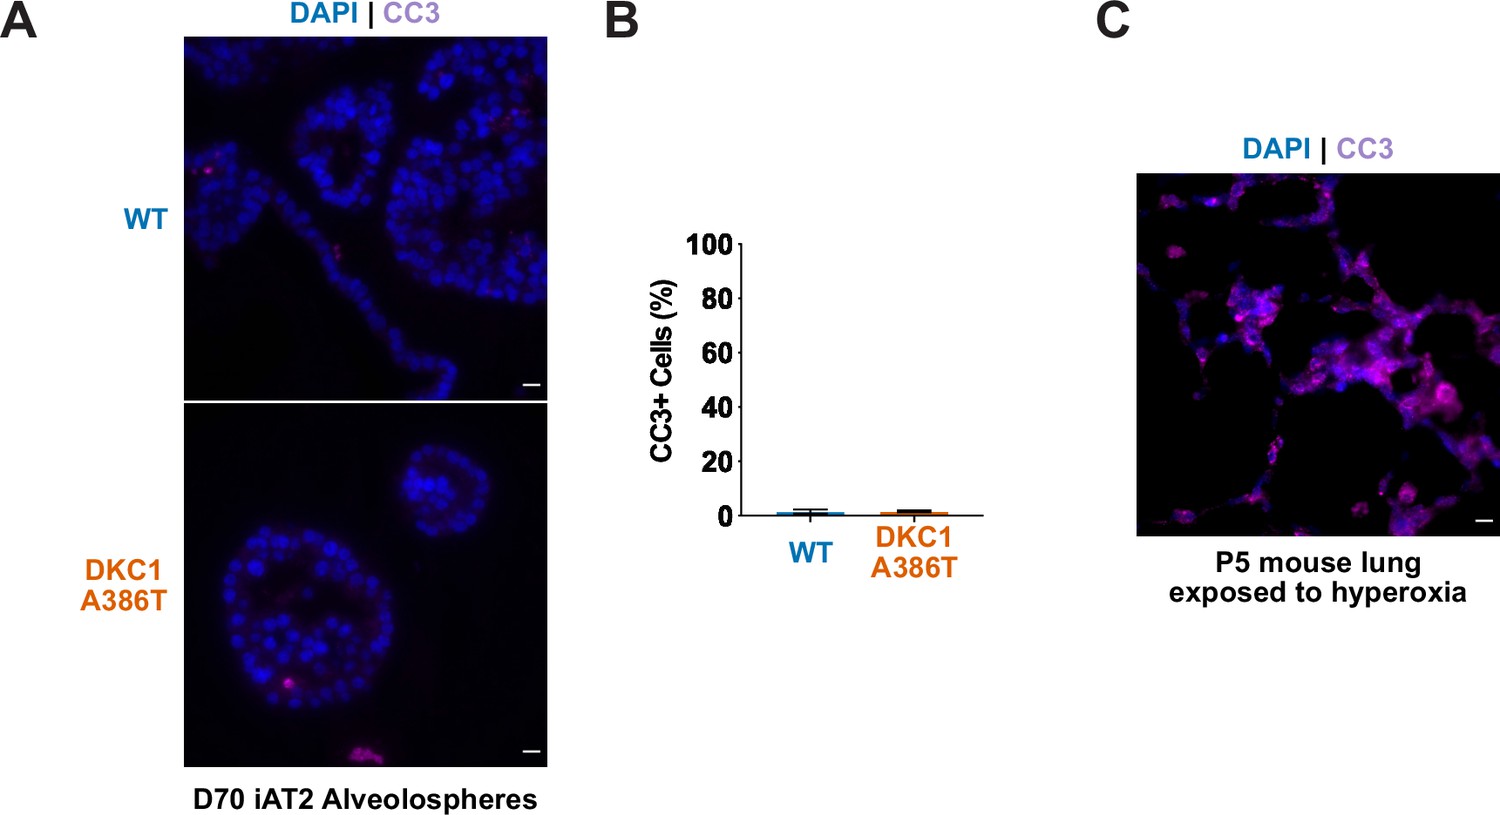
Dyskeratosis congenita induced pluripotent stem cell-derived type II alveolar epithelial cells (iAT2s) 35 passages after introduction of the mutation at D70 do not show an increase in apoptosis.
(A) Representative images and quantification of CC3 staining at D70 show no significant difference between wild type (WT) and DKC1 A386T mutant iAT2 alveolospheres. (B) Quantification of CC3+ cells in D70 iAT2 alveolospheres (n = 4, no difference, p=0.96, student’s t-test; scale bars, 10 µm). (C) CC3 positive control: day 0 postnatal lung from a mouse exposed to hyperoxia (panel on right) served as a positive control for CC3 staining.
-
Figure 2—figure supplement 1—source data 1
Source data for Figure 2—figure supplement 1C.
Figure 2—figure supplement 1-SourceData-CC3Counts.pzfx – Raw counts of CC3 positive cells along with statistics.
- https://cdn.elifesciences.org/articles/64430/elife-64430-fig2-figsupp1-data1-v2.zip
Figure 2—figure supplement 2
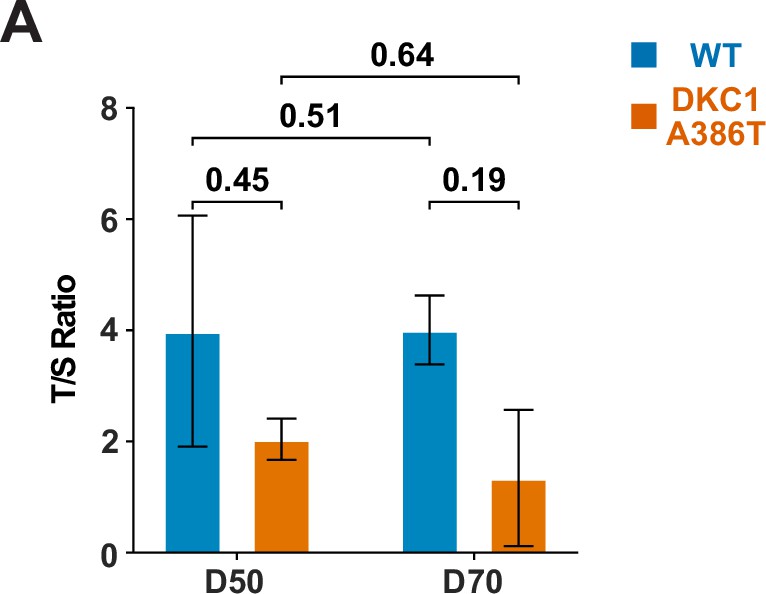
Telomere qPCR reveals a trend toward shorter average telomere lengths in dyskeratosis congenita (DC) induced pluripotent stem cell-derived type II alveolar epithelial (iAT2) cells.
(A) Average telomere length as measured by telomere qPCR of wild type (WT) and DC iAT2 cells with passage (n = 2, p-values listed on the figure, Student’s t-test).
-
Figure 2—figure supplement 2—source data 1
Source data for Figure 2—figure supplement 2.
Figure 2—figure supplement 2-SourceData-TelomereqPCR.pzfx – Raw Cq values from telomere qPCR for measuring average telomere lengths.
- https://cdn.elifesciences.org/articles/64430/elife-64430-fig2-figsupp2-data1-v2.zip
Figure 3 with 1 supplement
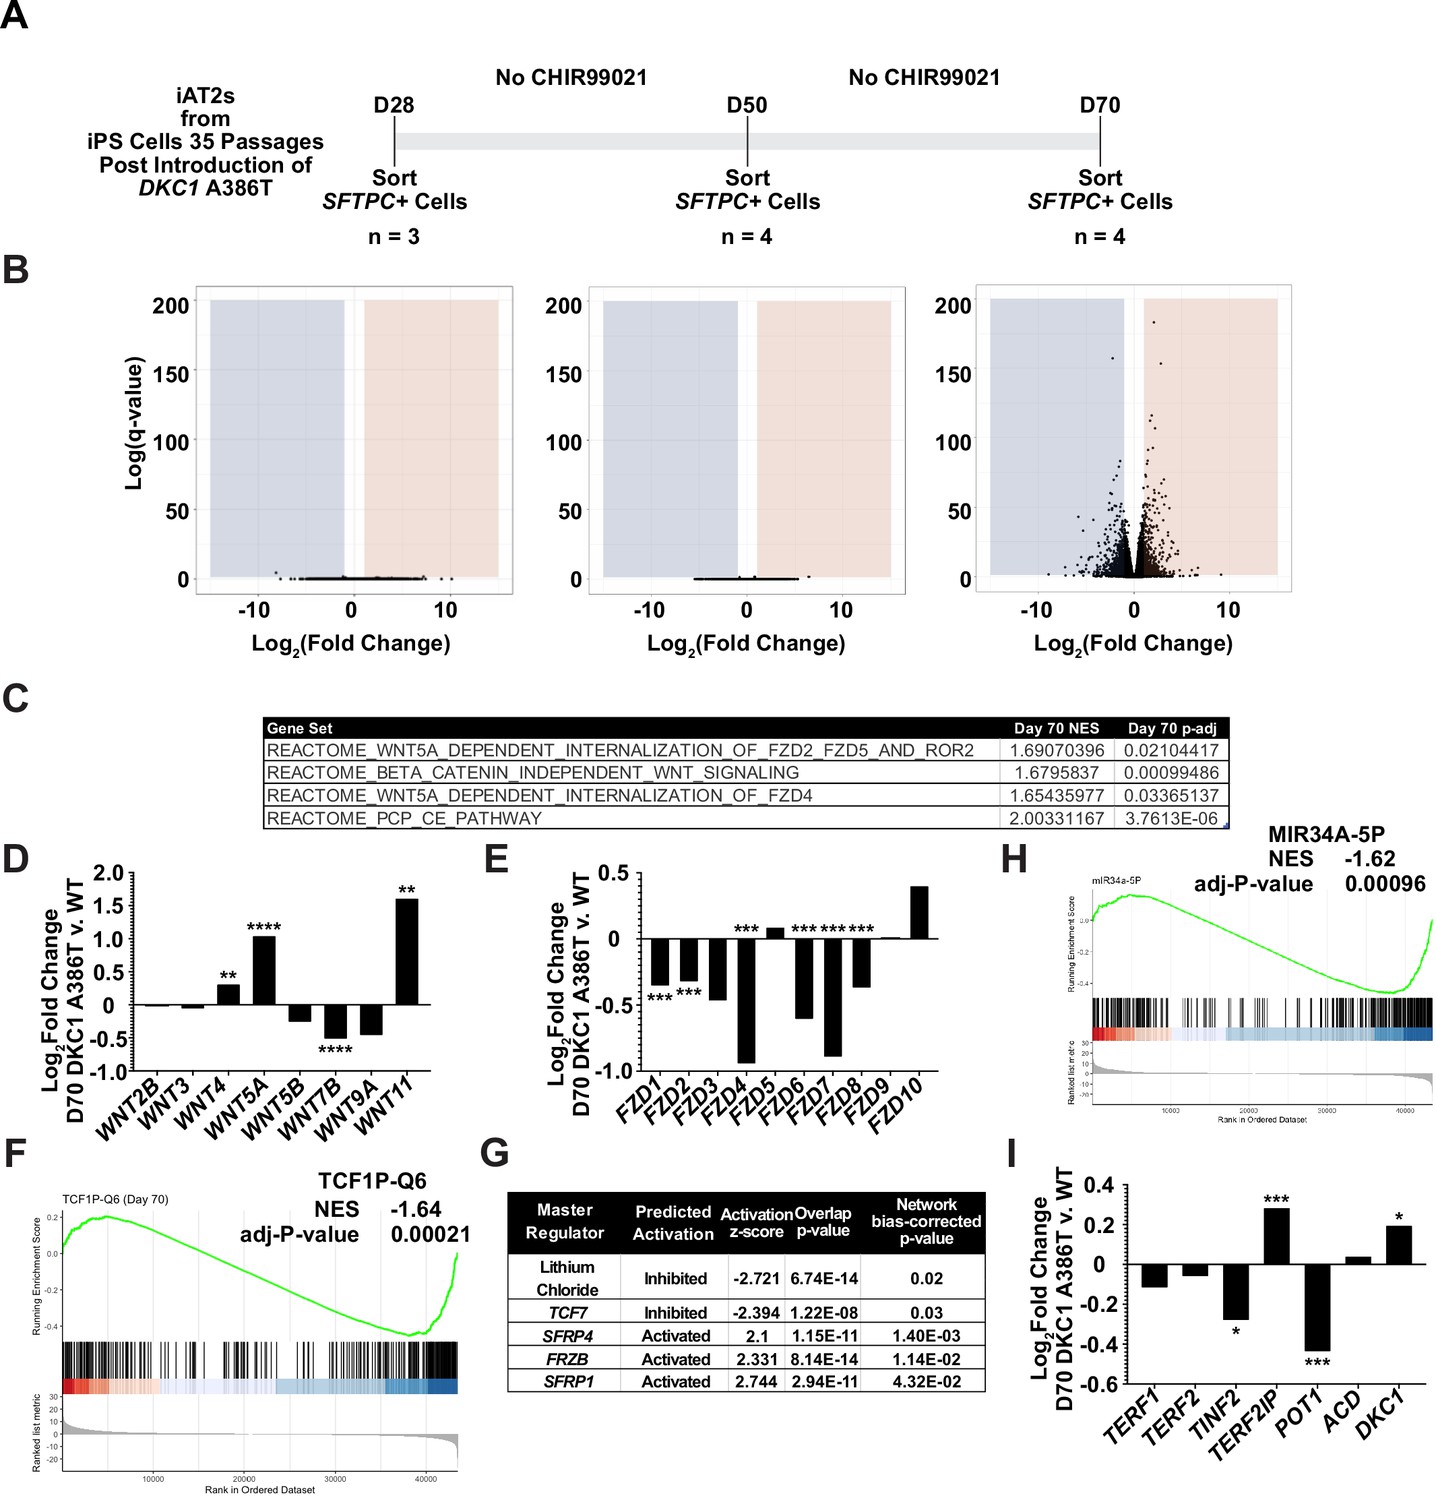
RNA-seq of passaged induced pluripotent stem cell-derived type II alveolar epithelial (iAT2) cells reveals a time dependent change in Wnt signaling.
(A) A schematic to show how cells were prepared for RNA-seq. (B) Volcano plots at D28, D50, and D70 show how the number of differentially expressed genes increases at D70. (C) Gene set enrichment analyses (GSEA) at D70 comparing DKC1 A386T iAT2 cells reveal an upregulation of non-canonical Wnt signaling and the planar cell polarity (PCP) pathway. (D) RNA-seq analysis shows upregulation of WNT5A and WNT11, non-canonical WNTs associated with pulmonary fibrosis (* p<0.05, ** p<0.01, *** p<0.001, **** p<0.0001, DEseq2 pairwise contrast statistics). (E) RNA-seq analysis shows broad downregulation of many FZD receptors (* p<0.05, ** p<0.01, *** p<0.001, **** p<0.0001, DEseq2 pairwise contrast statistics). (F) GSEA at D70 comparing DKC1 A386T iAT2 cells reveals a downregulation of genes with TCF7 bindings sites in their promoters. (G) Ingenuity pathway analysis reveals master regulators at D70 including downregulation of regulation associated with lithium chloride and TCF7, and upregulation of regulation associated with multiple Wnt inhibitors. (H) GSEA at D70 comparing DKC1 A386T iAT2 cells reveals a downregulation of genes with miR34A binding sites. TINF2 and POT1 are downregulated in DKC1 A386T iAT2 cells at D70 (* p<0.05, ** p<0.01).
Figure 3—figure supplement 1
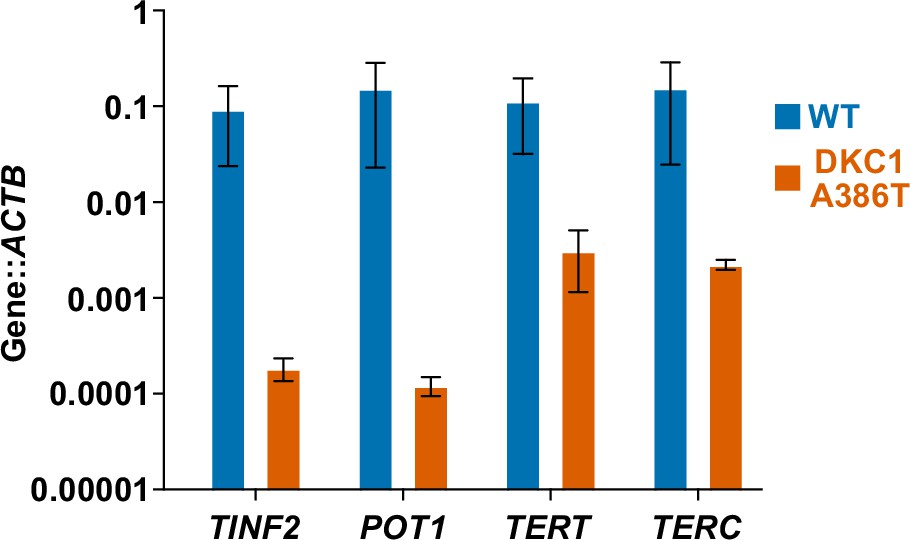
ddPCR demonstrates key shelterin and telomerase related genes are downregulated in dyskeratosis congenita (DC) induced pluripotent stem cell-derived type II alveolar epithelial (iAT2) cells.
ddPCR of TINF2, POT1, TERT, and TERC (normalized to ACTB) showing significant decreases in the expression of these genes in DC iAT2 cells (n = 2). The organoids used were equivalent to those tested in the main panels of Figure 3 except that they were cultured for an additional 7 days in K + DCI + TZV.
-
Figure 3—figure supplement 1—source data 1
Source data for Figure 3—figure supplement 1.
Figure 3—figure supplement 1-SourceData-2022-01-27-112-ddPCRWTMut.pzfx – Raw data of ddPCR of WT and DKC1 A386T iAT2s at D77.
- https://cdn.elifesciences.org/articles/64430/elife-64430-fig3-figsupp1-data1-v2.zip
Figure 4 with 3 supplements
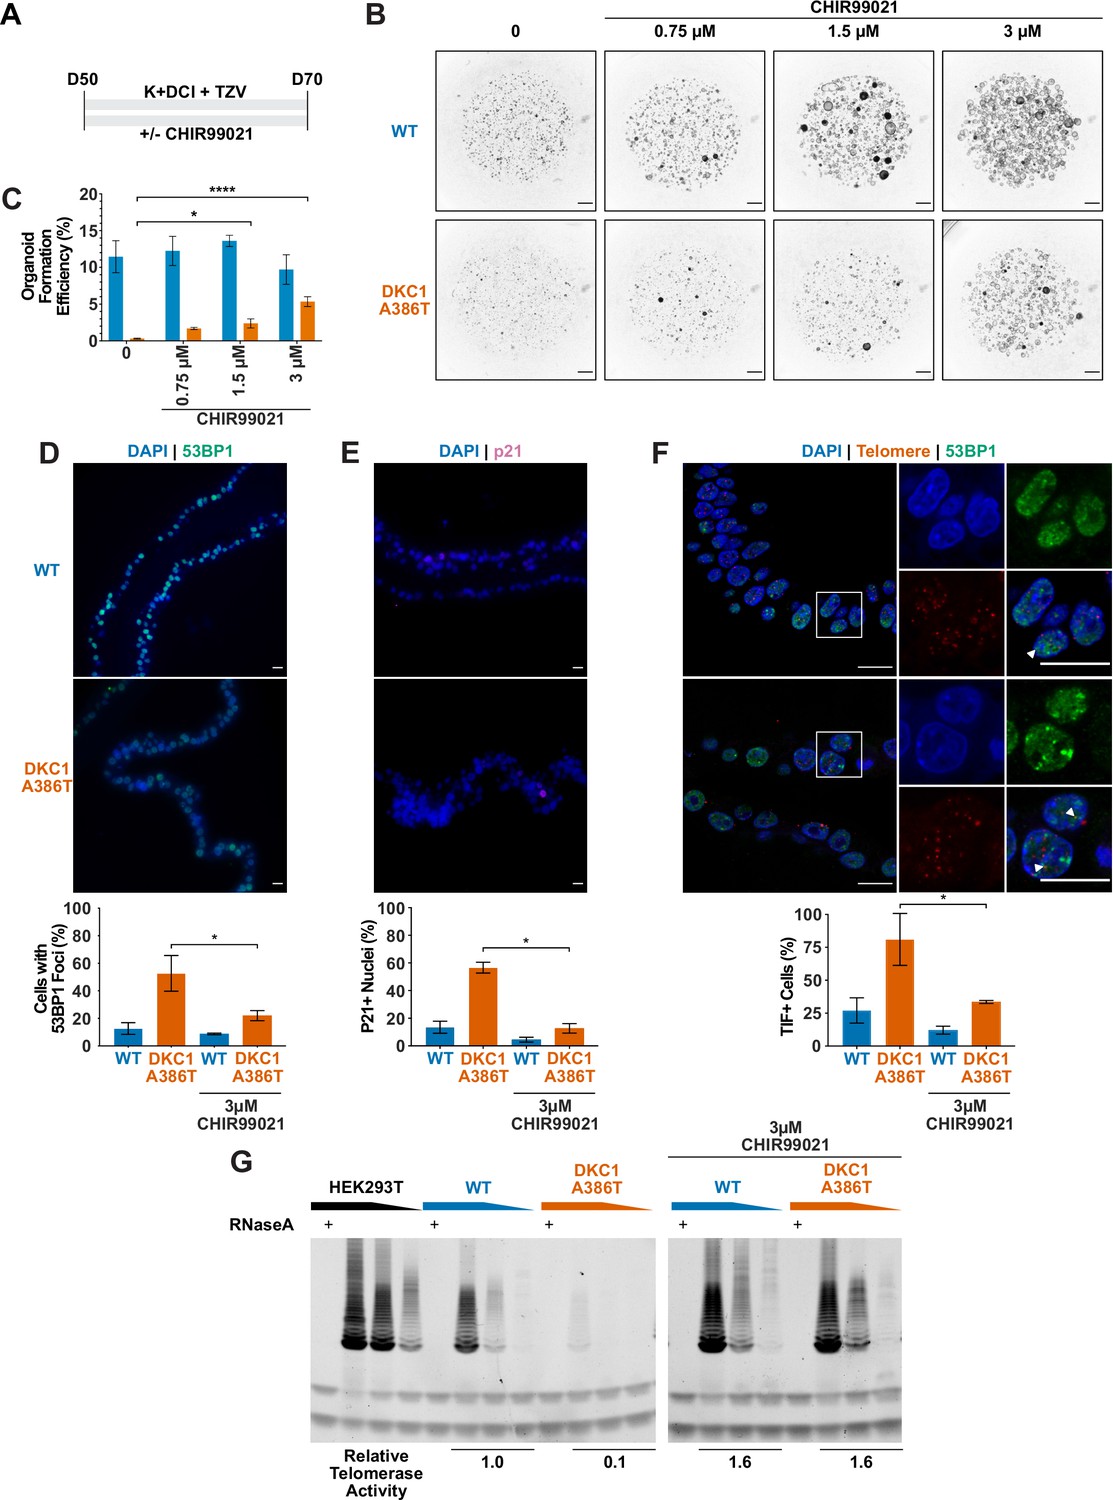
CHIR99021 rescues growth and telomere defects in dyskeratosis congentia (DC) induced pluripotent stem cell-derived type II alveolar epithelial (iAT2) cell alveolospheres.
(A) Differentiation protocol used to test how CHIR99021 affects growth of DC iAT2s. (B) Representative images of differentiating wild type (WT) and DKC1 A386T mutant bearing cells with increasing amounts of CHIR99021 (scale bars, 1 mm for all alveolosphere images). (C) Quantifications of alveolosphere formation efficiency after treatment with differing concentrations of CHIR99021 (n = 4, * p<0.05, **** p<0.0001, Student’s t-test). (D) When D70 alveolospheres are cultured with 3 µM CHIR99021, DKC1 A386T mutant iAT2 cells have a lower fraction of cells with 53 BP1 foci. Note, data for no CHIR99021 bars are from Figure 2 (n = 3, * p<0.05, Student’s t-test; scale bars, 10 µm). (E) When D70 alveolospheres are cultured with 3 µM CHIR99021, DKC1 A386T mutant iAT2 cells have a lower fraction of p21 positive cells. Note, data for no CHIR99021 bars are from Figure 2 (n = 3, * p<0.05, Student’s t-test; scale bars, 10 µm). (F) When D70 alveolospheres are cultured with 3 µM CHIR99021, DKC1 A386T mutant iAT2 cells have a lower fraction of telomere dysfunction induced foci (TIF) positive cells. Note, data for no CHIR99021 bars are from Figure 2 (n = 3, * p<0.05, Student’s t-test; scale bars, 10 µm; insets highlight cells with TIFs, each one noted by the white arrowheads). (G) Telomeric repeat amplification protocol assay for telomerase activity in iAT2 cells using fivefold extract dilutions (n = 3).
-
Figure 4—source data 1
Source data for Figure 4C-G.
Figure 4C-SourceData-OrganoidFormationEfficiency.pzfx – Raw counts of organoid counts normalized to number of cells input to calculate formation efficiency along with statistical tests. Figure 4D-SourceData-53BP1Rescue.pzfx – Raw counts of 53BP1 positive cells after treatment with CHIR99021 along with statistics. Figure 4E-SourceData-p21Rescue.pzfx – Raw counts of p21 positive cells after treatment with CHIR99021 along with statistics. Figure 4F-SourceData-TIFRescue.pzfx – Raw counts of telomere dysfunction induced foci positive cells after treatment with CHIR99021 along with statistics.Figure 4G-SourceData-2021-05-04-109-CK-Cropped.tiff – Raw blot of telomeric repeat amplification protocol (TRAP) assay of iPSC-derived type II alveolar epithelial (iAT2) cells treated with CHIR99021 showing area that was cropped. Figure 4G-SourceData-2021-05-04-109-CK.tif – Raw blot of TRAP assay of iAT2 cells treated with CHIR99021. Figure 4G-SourceData-2021-05-04-109-K-Cropped.tiff – Raw blot of TRAP assay of untreated iAT2 showing area that was cropped. Figure 4G-SourceData-2021-05-04-109-K.tif – Raw blot of TRAP assay of untreated iAT2. Figure 4G-SourceData-2021-05-04-109-QuantificationTRAP.xlsx – Quantifications of TRAP assay in Figure 4G.
- https://cdn.elifesciences.org/articles/64430/elife-64430-fig4-data1-v2.zip
Figure 4—figure supplement 1
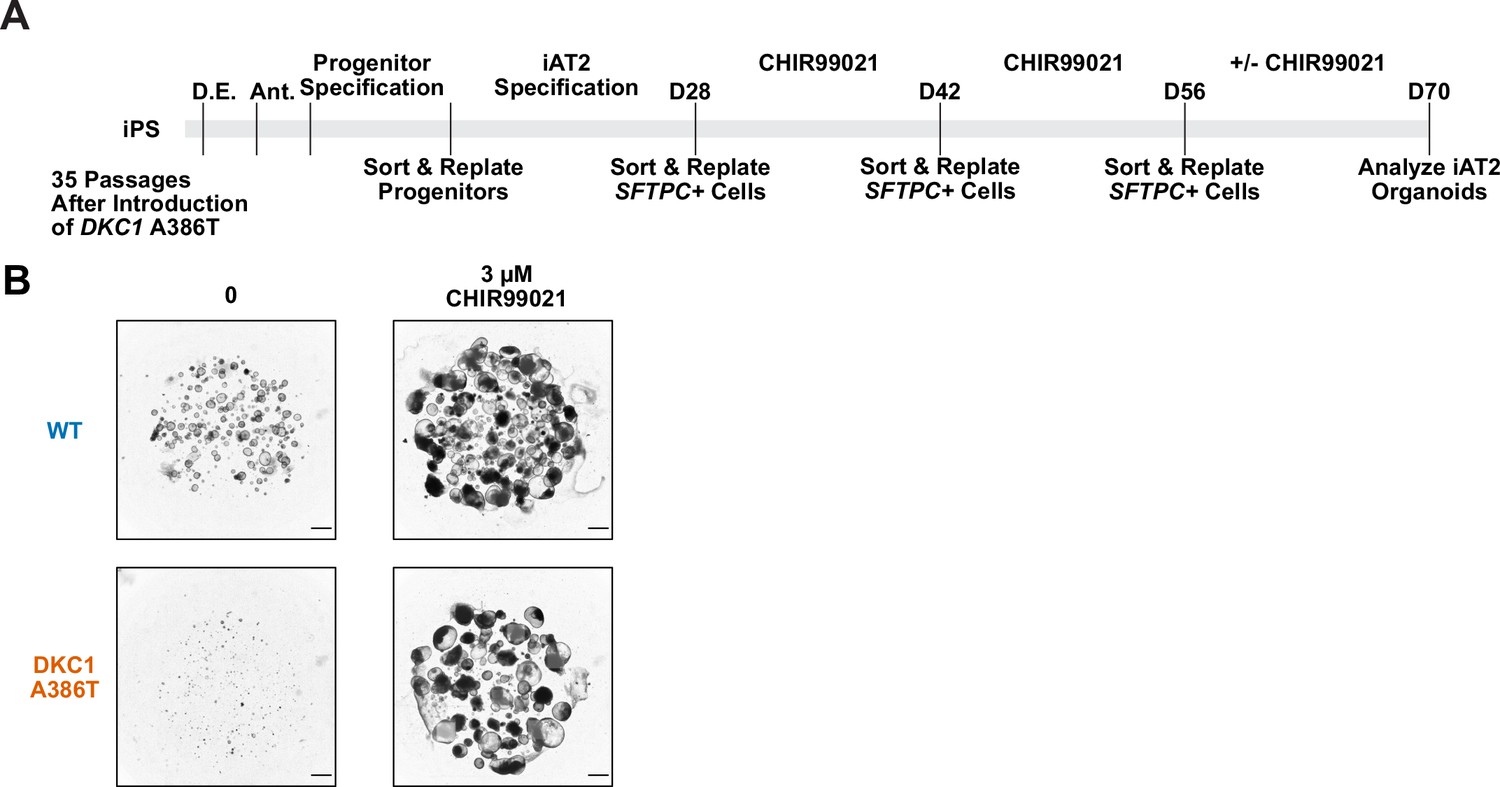
The growth defect in dyskeratosis congenita (DC) induced pluripotent stem cell-derived type II alveolar epithelial (iAT2) cells is rescued by continuous treatment of CHIR99021 from D28 to D70 but not if withdrawn at D56.
(A) Differentiation protocol used to test how withdrawal of CHIR99021 at D56 affects growth of DC iAT2s at D70. (B) Representative images of iAT2 alveolospheres at D70 when CHIR99021 (present up to D56) was either continued or removed after D56 and the cells analyzed at D70. If CHIR99021 is maintained, the growth defect is suppressed, while if CHIR99021 is removed the growth defect emerges (scale bars, 1 mm).
Figure 4—figure supplement 2
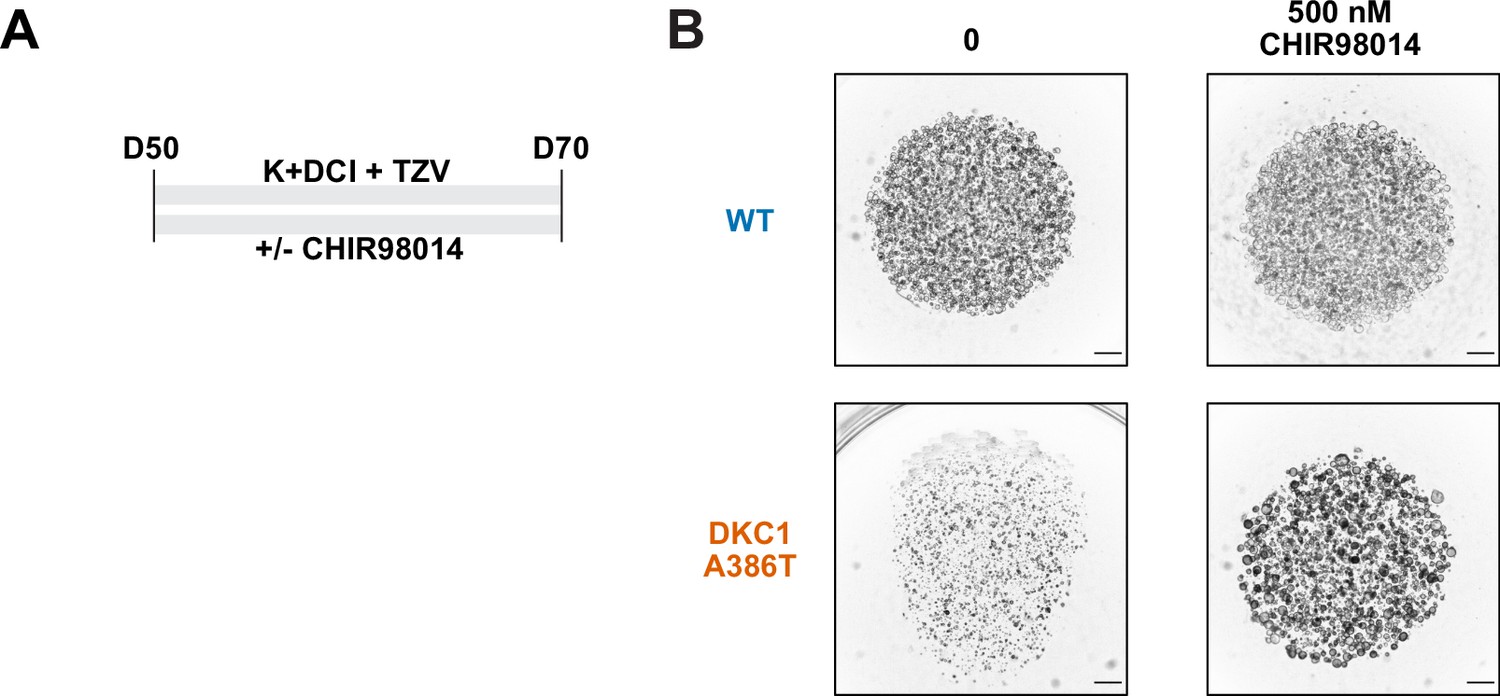
CHIR98014 can rescue dyskeratosis congenita (DC) induced pluripotent stem cell-derived type II alveolar epithelial (iAT2) cell growth.
(A) Differentiation protocol used to test whether CHIR98014 can affect the growth of DC iAT2s at D70. (B) Rescue of DC iAT2 alveolosphere growth with CHIR98014. These alveolospheres grew from cells plated at 400 cells/µL (scale bars, 1 mm).
Figure 4—figure supplement 3
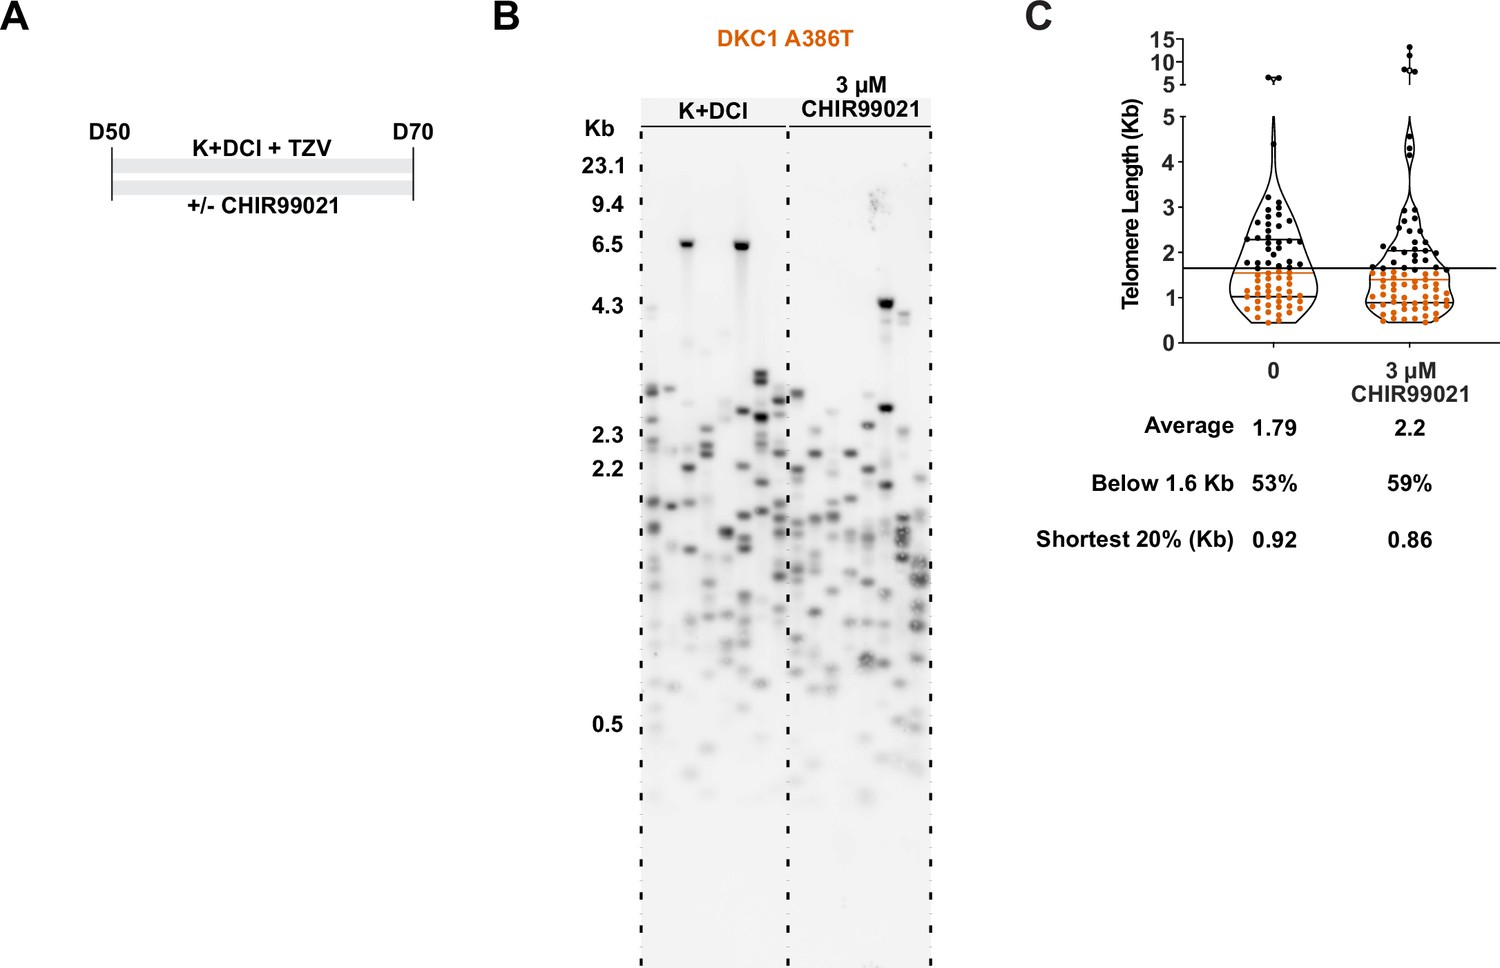
TeSLA revealed a modest increase in average telomere length but no apparent decrease in the frequency of shortest detectable telomeres.
(A) Differentiation protocol used to test how CHIR99021 affects growth of dyakeratosis congenita induced pluripotent stem cell-derived type II alveolar epithelial cells (iAT2s), same as in Figure 4. (B) TeSLA of DKC1 A386T iAT2 alveolospheres treated with 3 µM CHIR99021 as per differentiation protocol in A. (C) Quantification of TeSLA blot of DKC1 A386T iAT2 alveolospheres (n = 1, ‘shortest 20%’ reports the 20th percentile of telomere length, in Kb).
-
Figure 4—figure supplement 3—source data 1
Source data for Figure 4—figure supplement 3.
Figure 4—figure supplement 3B-SourceData-2020-08-31-MergedTeslaDKC1A386T-Cropped – Uncropped raw image of TeSLA blot when DKC1 A386T iPSC-derived type II alveolar epithelial cells (iAT2s) were treated with CHIR99021 showing where the crop was placed for Figure 4—figure supplement 3B. This is the same blot as used in Figure 2E. Figure 4, Figure 4—figure supplement 3-SourceData-2020-08-31-MergedTeslaDKC1A386T – Uncropped raw image of TeSLA blot when DKC1 A386T iAT2s were treated with CHIR99021. This is the same blot as used in Figure 2E. Figure 4—figure supplement 3C-SourceData-DKC1A386TTesLARescue – Quantification of TeSLA using TeSLA quant software for DKC1 A386T mutant cells treated with CHIR99021.
- https://cdn.elifesciences.org/articles/64430/elife-64430-fig4-figsupp3-data1-v2.zip
Tables
Appendix 1—key resources table
| Reagent type (species) or resource | Designation | Source or reference | Identifiers | Additional information |
|---|---|---|---|---|
| Cell line (Homo sapiens) | BU3 NGST | Jacob et al., 2017 | iPS cell line | |
| Cell line (Homo sapiens) | BU3 NGST – WT | This Paper | iPS cell line, WT control passaged with the DKC1 A386T cell line. See Figure 1—figure supplement 1 & 2 for more details. Contact the corresponding authors for the cell line. | |
| Cell line (Homo sapiens) | BU3 NGST - DKC1 A386T | This Paper | iPS cell line, DKC1 A386T passaged with the WT cell line. See Figure 1—figure supplement 1 & 2 for more details. Contact the corresponding authors for the cell line. | |
| Cell line (Homo sapiens) | AG04646 | Woo et al., 2016 | iPS cell line | |
| Recombinant DNA reagent | pX458 | Feng Zhang | Addgene # 48,138 | |
| Chemical compound, drug | Thiazovivin (TZV) | Cayman Chemical compound, drug | CAT# 14,245 | |
| Chemical compound, drug | SB431542 | Cayman Chemical compound, drug | CAT# 13,031 | |
| Chemical compound, drug | Dorsomorphin | Cayman Chemical compound, drug | CAT# 21,207 | |
| Chemical compound, drug | CHIR99021 | Cayman Chemical compound, drug | CAT# 13,122 | |
| Chemical compound, drug | CHIR98014 | Cayman Chemical compound, drug | CAT# 15,578 | |
| Chemical compound, drug | Retinoic Acid | Sigma | CAT# R2625-50MG | |
| Peptide, recombinant protein | rhBMP4 | R&D Systems | CAT# 314 BP-050 | |
| Peptide, recombinant protein | rhKGF | R&D Systems | CAT# 251 KG-050 | |
| Chemical compound, drug | Dexamethasone | Sigma | CAT# D4902-100MG | |
| Chemical compound, drug | 8Br-cAMP | Sigma | CAT# 7880–250 MG | |
| Chemical compound, drug | IBMX | Sigma | CAT# I5879-250MG | |
| Peptide, recombinant protein | DNaseI | Roche | CAT# 4716728001 | |
| Chemical compound, drug | 7-AAD | BD Biosciences | CAT# 51-68981E | |
| Chemical compound, drug | Propidium Iodide | BD Biosciences | CAT# 556,463 | |
| Peptide, recombinant protein | Dispase II | Gibco | CAT# 17105041 | |
| Chemical compound, drug | SYBR Green I Nucleic Acid Gel Stain | Invitrogen | CAT# S7563 | |
| Peptide, recombinant protein | Matrigel, Growth Factor Reduced | Corning | CAT# 354,230 | |
| Chemical compound, drug | Stem MACS iPS-Brew XF | Miltenyi Biotec | CAT# 130-104-368 | |
| Peptide, recombinant protein | Accutase | Innovative Cell Technologies | CAT# AT104-500 | |
| Commercial assay, kit | P3 Primary Cell 4D-NucleofectorTM X Kit L | Lonza | CAT# V4XP-3012 | |
| Chemical compound, drug | IMDM | Corning/Mediatech | CAT# MT10-016-CV | |
| Chemical compound, drug | Ham’s F12 Nutrient Mix | Corning/Mediatech | CAT# MT10-080-CV | |
| Chemical compound, drug | B27 | Gibco | CAT# 17504044 | |
| Chemical compound, drug | N2 | Gibco | CAT# 17502048 | |
| Chemical compound, drug | BSA Fraction V | Gibco | CAT# 15260037 | |
| Chemical compound, drug | Monothioglycerol | Sigma | CAT# M6145-25ML | |
| Chemical compound, drug | GlutaMAX | Gibco | CAT# 35050061 | |
| Chemical compound, drug | Ascorbic Acid | Sigma | CAT# A4544-25G | |
| Chemical compound, drug | Primocin | Invivogen | CAT# ANT-PM-2 | |
| Chemical compound, drug | Hank’s Balanced Salt Solution | Gibco | CAT# 14175079 | |
| Chemical compound, drug | HEPES | Gibco | CAT# 15630080 | |
| Chemical compound, drug | EDTA | Gibco | CAT# 15575039 | |
| Peptide, recombinant protein | 0.05% trypsin-EDTA | Gibco | CAT# 25300054 | |
| Commercial assay, kit | Direct-zol RNA Micro Kit | Zymo | CAT# R2061 | |
| Commercial assay, kit | Gentra Puregene Cell Kit | Qiagen | CAT# 158,745 | |
| Antibody | Anti-NANOG (Rabbit polyclonal) | Reprocell/Stemgent | CAT# 09–0020 | IF (1:100 37°C for 2 hr) |
| Antibody | Anti-53BP1 (Rabbit monoclonal) | Novus | CAT# NB100-304 | IF (1:100 37°C for 2 hr) |
| Antibody | Anti-P21 (Mouse monoclonal) | Santa Cruz | CAT# sc-6246 | IF (1:50 37°C for 2 hr) |
| Antibody | Anti-Cleaved Caspase 3 (CC3) (Rabbit monoclonal) | Cell Signaling Technologies | CAT# 9,664 | IF (1:2000 37°C for 2 hr) |
| Sequence-based reagent | Anti-Cy3-Telo-C Probe | PNA Bio | CAT# F1002 | Anti-telomeric |
| Antibody | Anti-Digoxigenin-AP, Fab fragments | Roche | CAT# 11093274910 | |
| Antibody | Goat anti-Rabbit IgG Secondary Antibody, Alexa Fluor 647 (Donkey polyclonal) | Invitrogen | CAT# A-21244 | IF (1:250 RT for 1 hr) |
| Antibody | Donkey anti-Mouse IgG Secondary Antibody, Alexa Fluor 647 (Donkey polyclonal) | Invitrogen | CAT# A-31571 | IF (1:250 RT for 1 hr) |
| Antibody | Donkey anti-Goat IgG Secondary Antibody, Alexa Fluor 647 (Donkey polyclonal) | Invitrogen | CAT# A-21447 | IF(1:250 RT for 1 hr) |
| Chemical compound, drug | TriZOL | Invitrogen | CAT# 15596018 | |
| Peptide, recombinant protein | FailSafe Polymerase Enzyme Mix | Lucigen | CAT# FS9901K | |
| Chemical compound, drug | FailSafe Buffer H | Lucigen | CAT# FSP995H-INCL | |
| Peptide, recombinant protein | CviAII | NEB | CAT# R0640L | |
| Peptide, recombinant protein | BfaI | NEB | CAT# R0568L | |
| Peptide, recombinant protein | MseI | NEB | CAT# R0525L | |
| Peptide, recombinant protein | NdeI | NEB | CAT# R0111L | |
| Peptide, recombinant protein | rSAP | NEB | CAT# M0371L | |
| Chemical compound, drug | CDP-Star | Roche | CAT# 11759051001 | |
| Chemical compound, drug | DIG-11-dUTP | Roche | CAT# 11558706910 | |
| Chemical compound, drug | DIG Easy Hybridization Granules | Roche | CAT# 11796895001 | |
| Chemical compound, drug | Blocking Reagent | Roche | CAT# 11096176001 | |
| Sequence-based reagent | DIG Labeld DNA Molecular Weight Marker II | Roche | CAT# 11218590910 | |
| Chemical compound, drug | Hybond-XL | Cytiva/Amersham | CAT# RPN303S | |
| Peptide, recombinant protein | Klenow Fragment | NEB | CAT# M0212S | |
| Peptide, recombinant protein | Lambda Exonuclease | NEB | CAT# M0262S | |
| Peptide, recombinant protein | Go-TAQ Flexi | Promega | CAT# M8298 | |
| Peptide, recombinant protein | ddPCR Multiplex Supermix | BioRad | CAT# 12005909 | |
| Software | FIJI | NIH | RRID:SCR_002285 | https://imagej.net/Fiji |
| Software | Salmon | Patro et al., 2017 | ||
| Software | Ingenuity pathway analysis | Krämer et al., 2014 | ||
| Software | FlowJo | BD Biosciences | RRID:SCR_008520 | |
| Software | ImageQuant TL 8.2 | Cytiva | RRID:SCR_018374 | |
| Software | TeSLAQuant | Lai et al., 2017 |
Additional files
-
Supplementary file 1
Gene set enrichment analysis (GSEA) results comparing D70 DC to wild type (WT) iPSC-derived type II alveolar epithelial (iAT2) cells.
These tables provide the unedited output of the GSEA analysis using the C2 curated gene sets, H hallmark gene sets, and C3 regulatory target gene sets when comparing D70 mutant to WT iAT2 cells. The table reports the name of the gene set (ID), the size of the gene set (setSize), the raw enrichment score (enrichmentScore), the normalized enrichment score, along with the p-value, the adjusted p-value (p.adjust) and false discovery rate q-value (q-values). The ‘core enrichment’ column displays the genes in the gene set.
- https://cdn.elifesciences.org/articles/64430/elife-64430-supp1-v2.xlsx
-
Supplementary file 2
Ingenuity pathway analysis (IPA) results comparing D70 dyskeratosis congenita to wild type iPSC-derived type II alveolar epithelial (iAT2) cells.
These tables provide the unedited output of the IPA. The summary tab lists metadata associated with the analysis. The ‘analysis ready molecules’ lists the differentially expressed genes that differed in expression greater than twofold and were associated with an adjusted p-value < 0.05 from D70 mutant iAT2 cells (DEG list). The ‘canonical pathways tab’ lists pathways curated from the literature and the p-value for enrichment using the DEG list used in the IPA. The ‘upstream regulators’ tab lists the transcription factors, cytokines, and other genetic regulators whose target genes are in the DEG list. ‘Causal networks’ seeks to build a regulatory network based off of the ‘upstream regulators’ to identify master regulators of the DEG list. For more information on interpreting ingenuity analysis results see Krämer et al., 2014.
- https://cdn.elifesciences.org/articles/64430/elife-64430-supp2-v2.xlsx
-
Supplementary file 3
Differentially expressed pathways from D70 dyskeratosis congenita iPSC-derived type II alveolar epithelial (iAT2) cells that are similar to changes seen in pulmonary fibrosis.
These tables display selected results from gene set enrichment analysis (GSEA) and ingenuity pathway analyses (IPAs) that highlight pathways found to be differentially regulated in mutant iAT2 cells at D70 when compared with wild type cells. The first table displays GSEA results along with the pathway name, normalized enrichment score, and adjusted p-value (D70 p-adj). The second table displays IPA results from the canonical pathways analysis. These are gene sets that are differentially regulated in mutant iAT2 cells at D70 when compared with wild type cells. The p-value reports the significance of enrichment of the molecules in that gene set, and the activation score reports how concordant the gene expression changes are with what is predicted from the literature embedded in IPA (a negative z-score argues that the gene set is down regulated in the mutant iAT2 cells, whereas a positive z-score argues that the gene set is upregulated in mutant iAT2 cells; the lack of a z-score is indicative there was insufficient evidence to provide a z-score.) The ‘molecules’ column lists the genes that were in that gene set that were also found in our differentially expressed gene list when comparing mutant iAT2 cells to wildtype cells.
- https://cdn.elifesciences.org/articles/64430/elife-64430-supp3-v2.xlsx
-
Transparent reporting form
- https://cdn.elifesciences.org/articles/64430/elife-64430-transrepform1-v2.docx
Download links
A two-part list of links to download the article, or parts of the article, in various formats.
Downloads (link to download the article as PDF)
Open citations (links to open the citations from this article in various online reference manager services)
Cite this article (links to download the citations from this article in formats compatible with various reference manager tools)
GSK3 inhibition rescues growth and telomere dysfunction in dyskeratosis congenita iPSC-derived type II alveolar epithelial cells
eLife 11:e64430.
https://doi.org/10.7554/eLife.64430


