Allele-specific endogenous tagging and quantitative analysis of β-catenin in colorectal cancer cells
- German Cancer Research Center (DKFZ), Division of Signaling and Functional Genomics and Heidelberg University, BioQuant and Medical Faculty Mannheim, Germany
- Institute of Applied Physics, Karlsruhe Institute of Technology, Germany
- Institute of Nanotechnology, Karlsruhe Institute of Technology, Germany
- Institute of Biological and Chemical Systems, Karlsruhe Institute of Technology, Germany
- Department of Physics, University of Illinois at Urbana-Champaign, United States
Figures
Figure 1 with 4 supplements
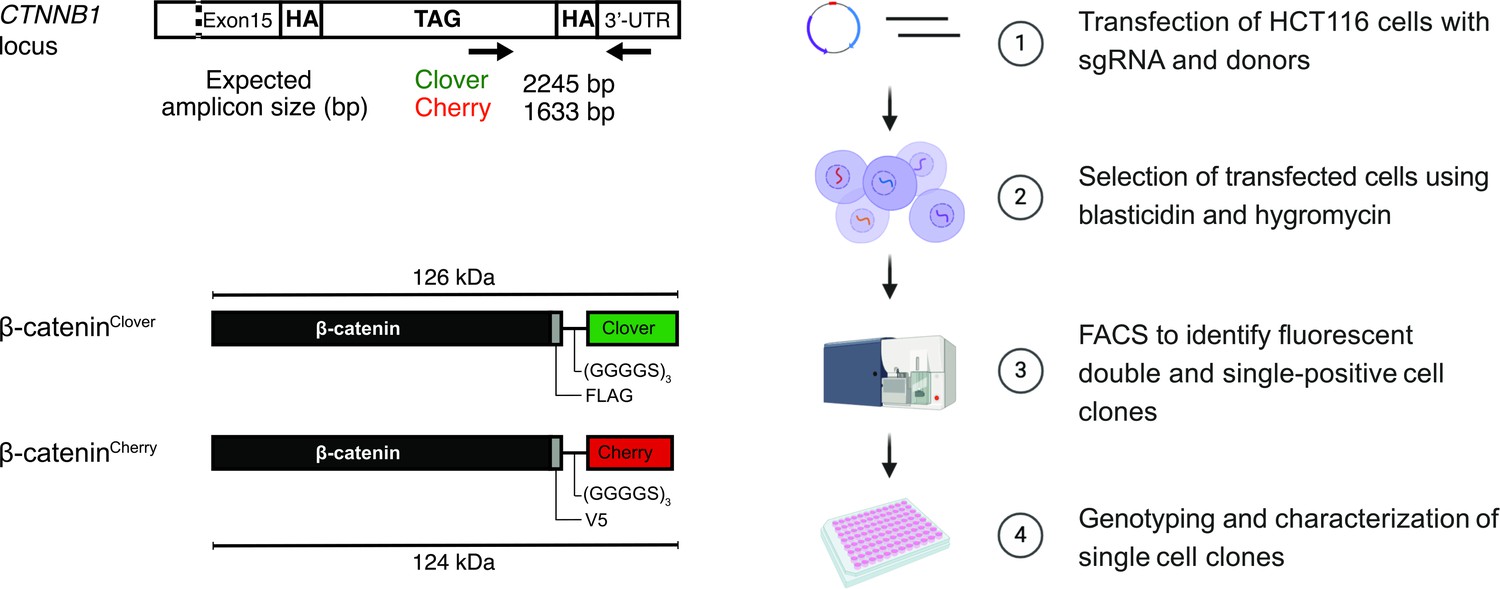
Strategy and workflow for bi-allelic fluorescent tagging of β-catenin in colon cancer cells.
(Left panels) Schematic representation of CTNNB1/β-catenin tagging strategy, the CTNNB1/β-catenin locus and tagged β-catenin proteins. (Right panels) Workflow for the generation of endogenously tagged β-catenin in HCT116 colorectal cancer cells. See also Figure 1—figure supplement 1A for more details. bp, base pair; HA, homology arm; kDa, kilo Dalton; sgRNA, single guide RNA; UTR, untranslated region.
Figure 1—figure supplement 1
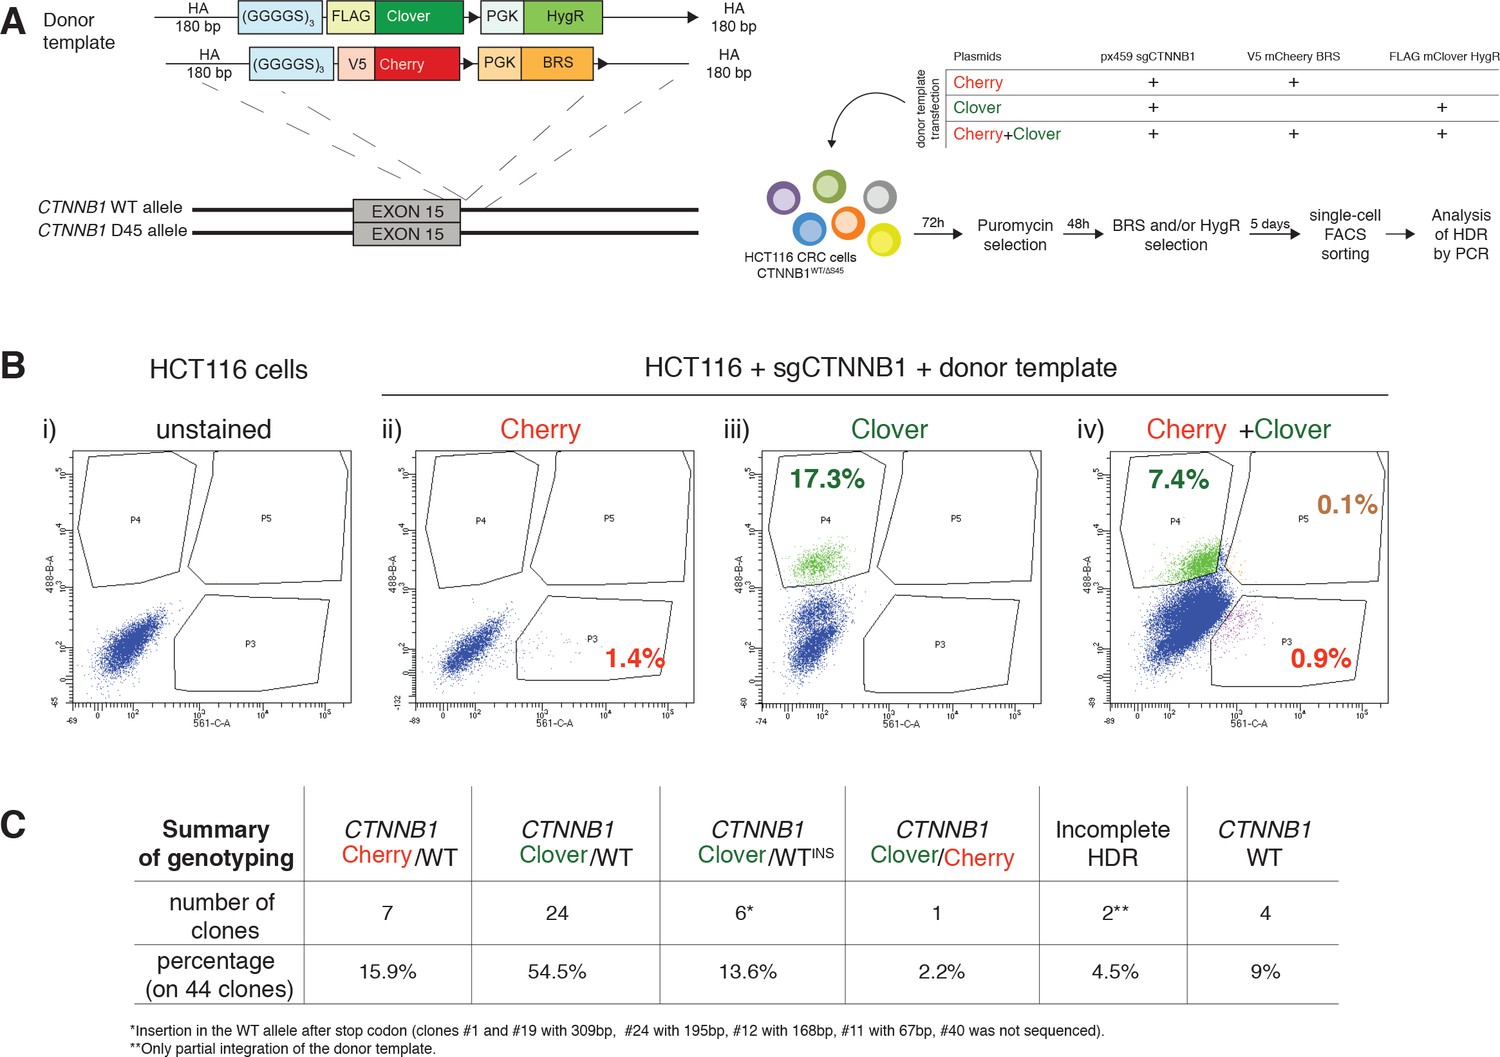
Generation of endogenous fluorescently tagged β-catenin cell lines.
(A) Schematic representation of CTNNB1/β-catenin tagging strategy and workflow of bi-allelic β-catenin tagged HCT116 cells generation. (B) The editing efficiency between the two donor templates was different. The donor template Clover was more efficiently integrated than the Cherry one. (i) Parental HCT116 cells were used as “unstained” sample for FACS analysis (ii) HCT116 cells transfected with sgCTNNB1 and Cherry donor template were used to define the gate P3 (mCherry+ cells), (iii) HCT116 transfected with sgCTNNB1 and Clover donor template were used to set the gate P4 (mClover+ cells), (iv) edited cells transfected with sgCTNNB1 and both Cherry and Clover donor templates are double-positive (gate P5). Percentages of positive cells are shown in each panel. (C) Table summarizing the obtained HCT116 single clones with their according genotypes. FACS, fluorescence-activated cell sorting.
Figure 1—figure supplement 2
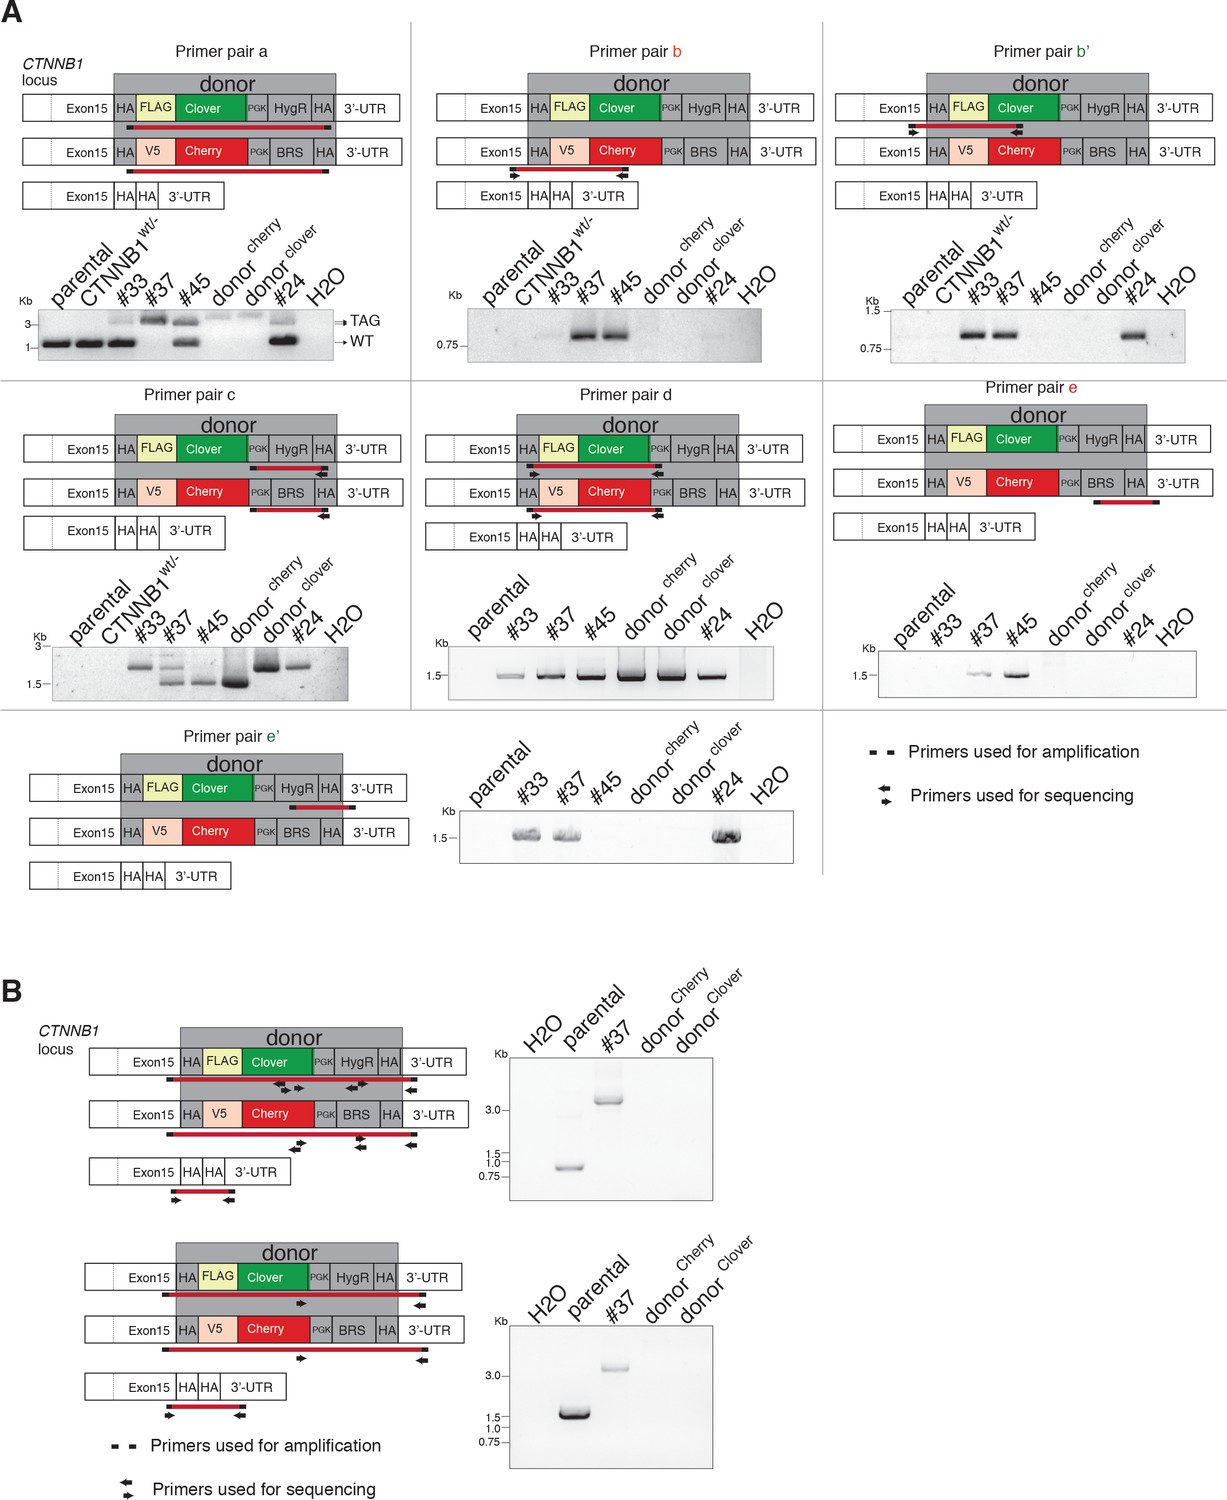
Characterization of endogenous fluorescently tagged β-catenin cell lines.
(A, B) The schemes indicate primers used for genotyping of single-cell clones. PCR analysis shows genotyping of HCT116 single-cell clones #33, #37, #45, and #24. Parental HCT116 β-cateninWT/Δ45, HCT116 β-cateninWT/−, and donor templates were used as controls.
Figure 1—figure supplement 3
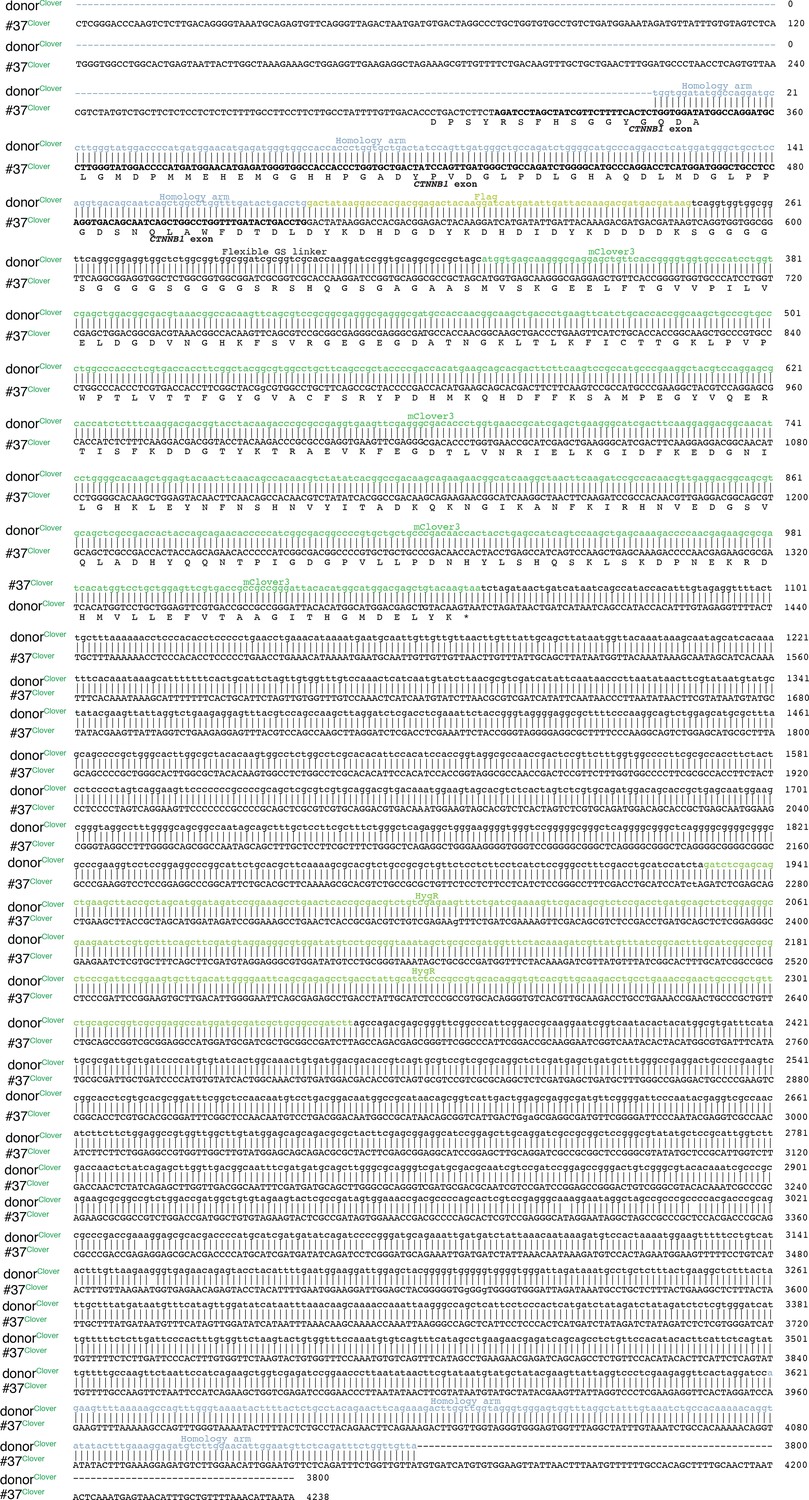
The sequences of integration sites/tags of bi-allelic β-catenin tagged HCT116 cells (#37) in comparison to donor templates.
The sequences are combination/alignment of several (5–6) Sanger sequences performed with the primers shown in the scheme Figure 1—figure supplement 2.
Figure 1—figure supplement 4
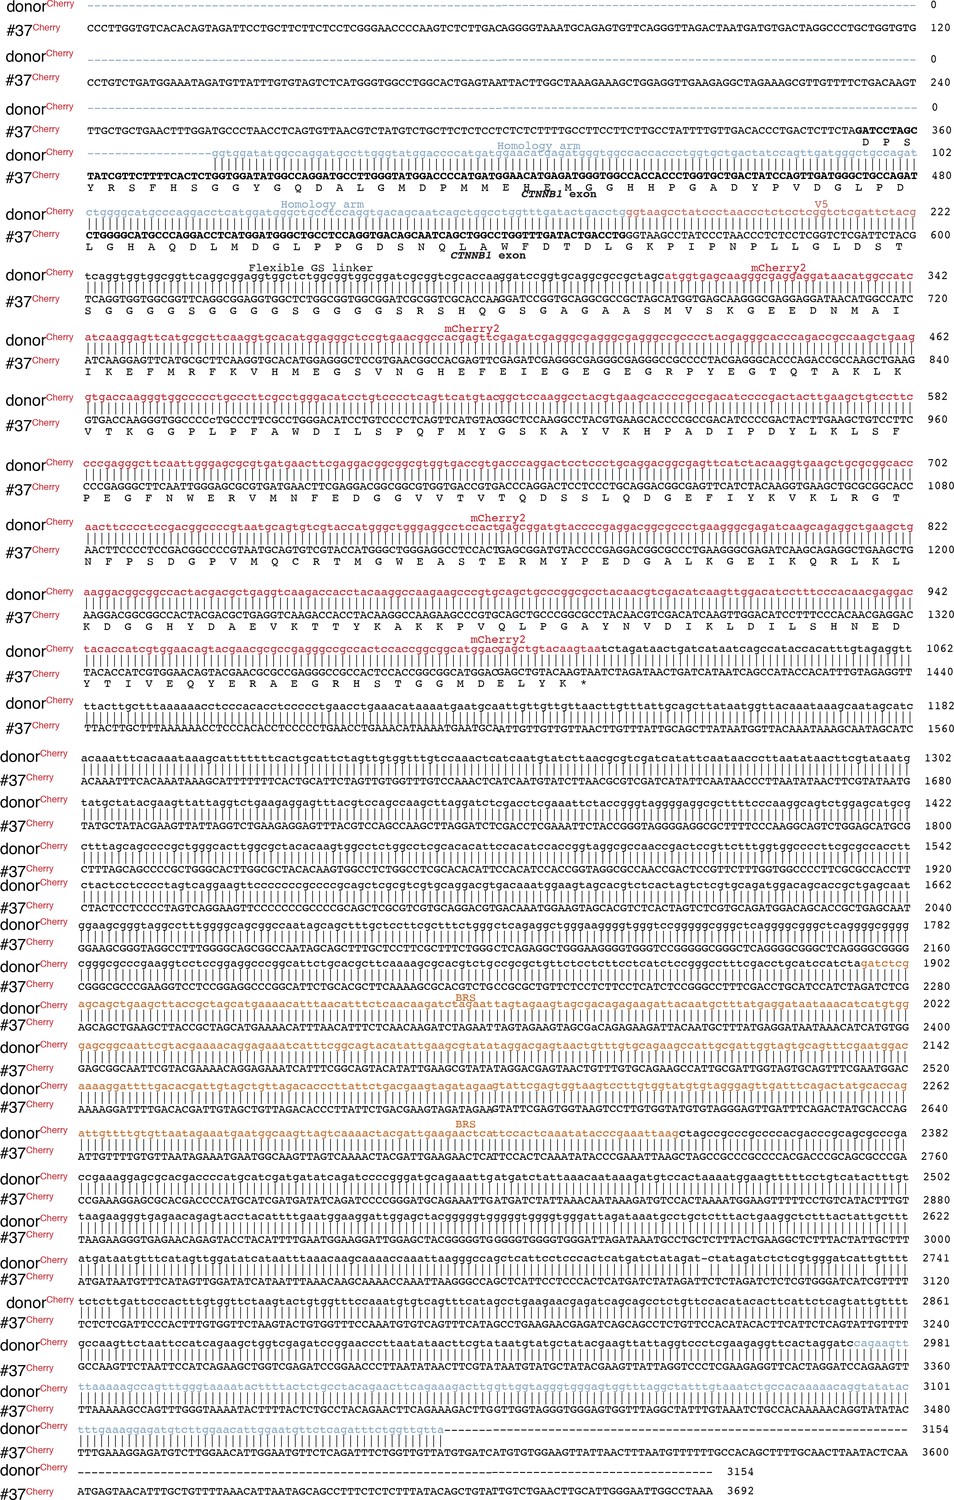
The sequences of integration sites/tags of bi-allelic β-catenin tagged HCT116 cells (#37) in comparison to donor templates.
The sequences are combination/alignment of several (5–6) Sanger sequences performed with the primers shown in the scheme Figure 1—figure supplement 2.
Figure 2 with 1 supplement
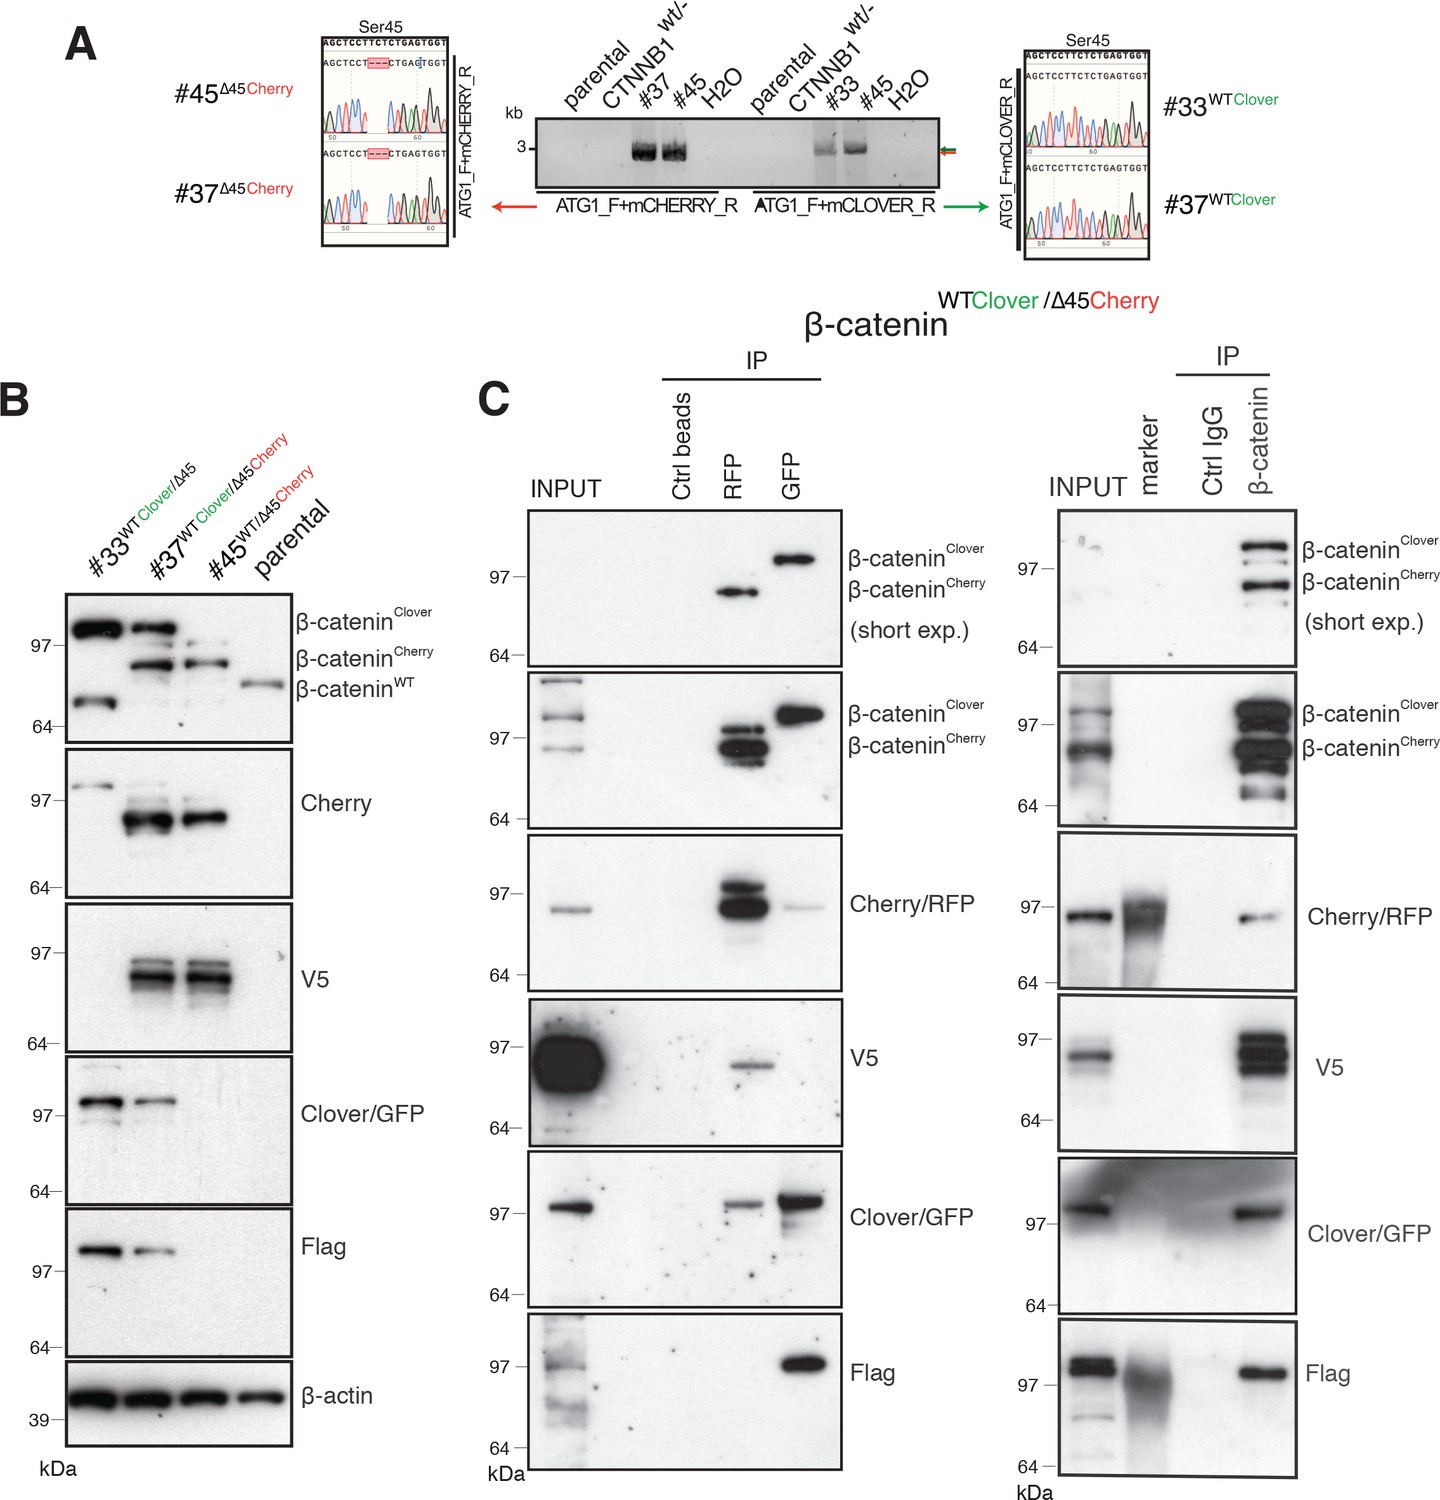
Identification and confirmation of tagged β-catenin alleles.
(A) Sanger sequencing confirms bi-allelic tagging of β-catenin. Sequencing results show clones #45 (β-cateninWT/∆45Cherry) and #37 (β-cateninWTClover/∆45Cherry) Cherry is in-frame with the mutant allele and clones #33 (β-cateninWTClover/∆45) and #37 (β-cateninWTClover/∆45Cherry) Clover is in-frame with wild-type allele (codon TCT). (B) Cell lysates of indicated HCT116 cell lines analyzed by Western blotting with a β-catenin antibody; β-actin served as a loading control. (C) HCT116 β-cateninWTClover/∆45Cherry (clone #37) immunoprecipitation with GFP, Cherry and control beads, or with a β-catenin antibody followed by immunoblotting with indicated antibodies. Representative results from three independent experiments are shown.
-
Figure 2—source data 1
Identification and confirmation of tagged β-catenin alleles.
(B) Cell lysates of indicated HCT116 cell lines analyzed by Western blotting with a β-catenin antibody; β-actin served as a loading control. (C) HCT116 β-cateninWTClover/∆45Cherry (clone #37) immunoprecipitation with GFP, Cherry and control beads, or with a β-catenin antibody followed by immunoblotting with indicated antibodies. Representative results from three independent experiments are shown. Figure 2—figure supplement 1: Validation of endogenously fluorescent-tagged β-catenin in HCT116 colon cancer cells. (A) HCT116 β-cateninWTClover/∆45Cherry (clone #37) cells express comparable amounts of β-catenin to the parental HCT116 WT cells. (B–D) Immunoprecipitation using HCT116 β-cateninWTClover/∆45 (clone #33 – left), β-cateninWT/∆45Cherry (clone #45 – middle), and β-cateninWTClover/∆45 (clone #24 – right) were performed with GFP/Cherry or control beads, followed by Western blotting with the indicated antibodies. Representative results from three independent experiments are shown.
- https://cdn.elifesciences.org/articles/64498/elife-64498-fig2-data1-v1.zip
Figure 2—figure supplement 1
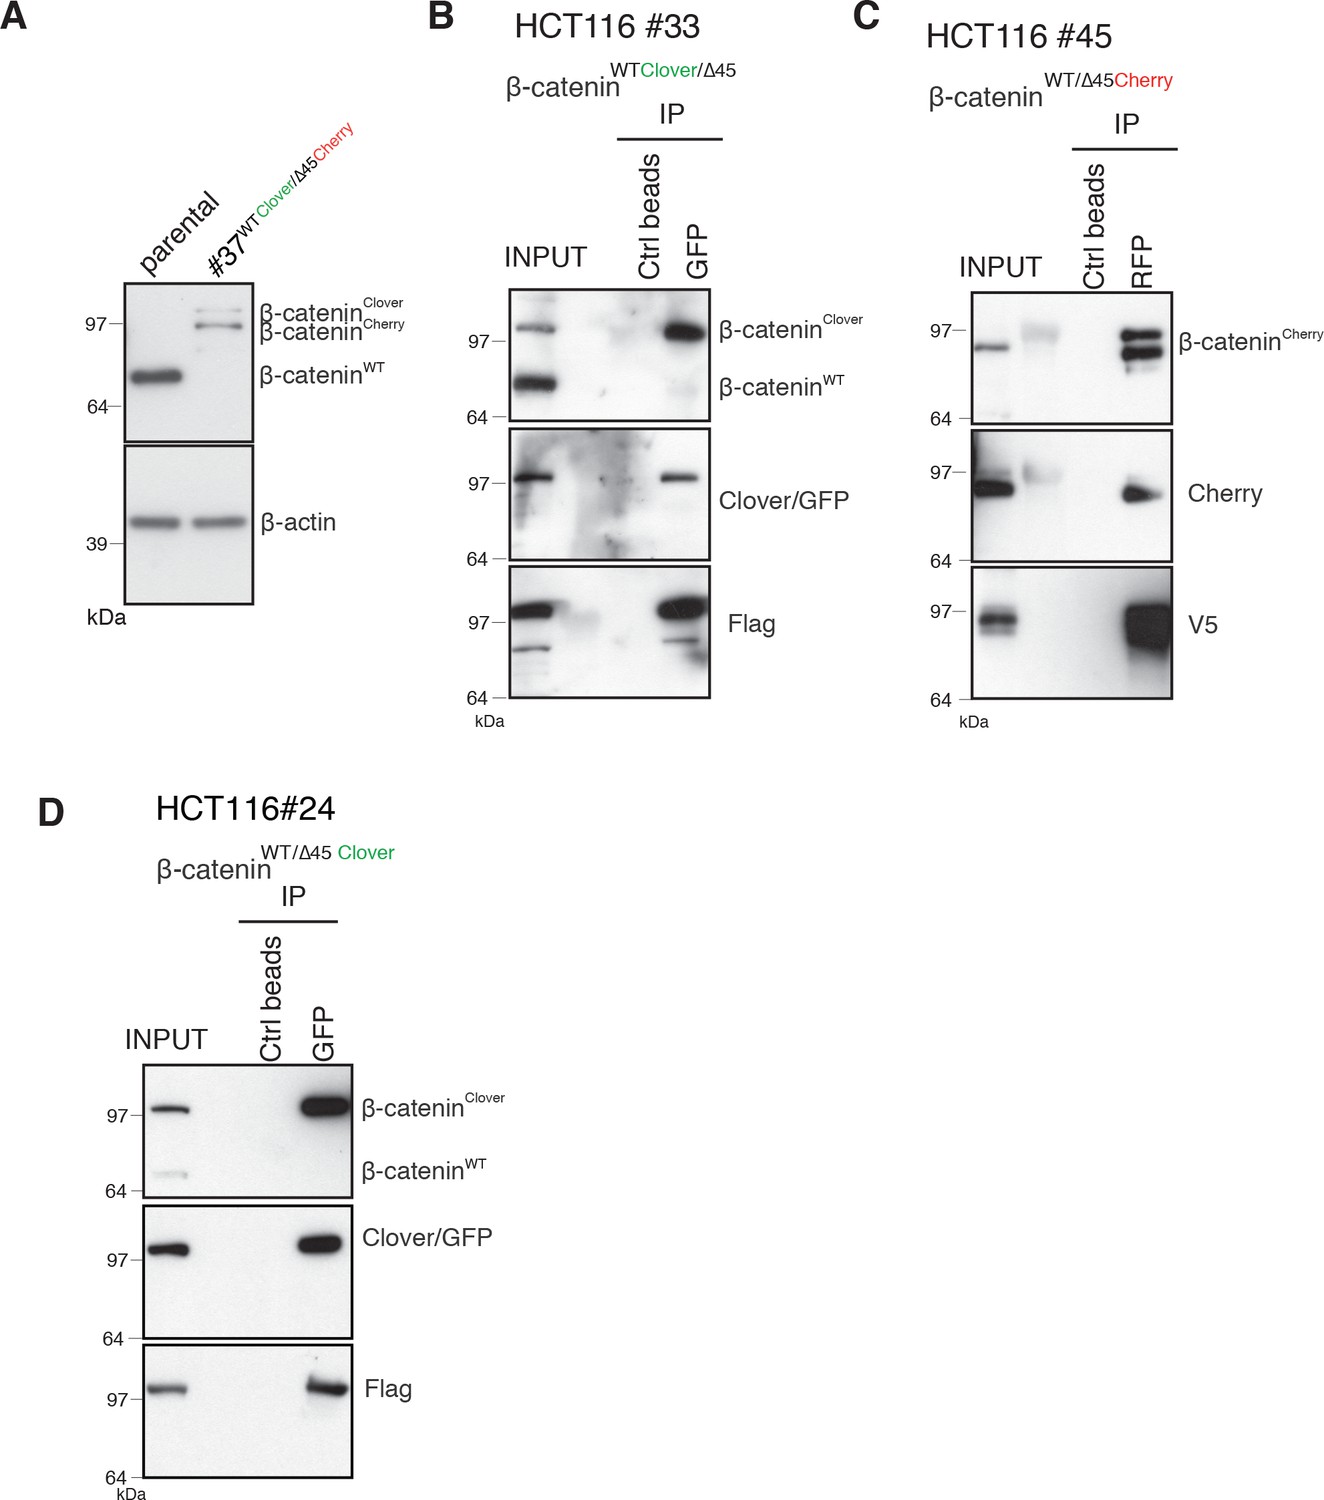
Validation of endogenously fluorescent-tagged β-catenin in HCT116 colon cancer cells.
(A) HCT116 β-cateninWTClover/∆45Cherry (clone #37) cells express comparable amounts of β-catenin to the parental HCT116 WT cells. (B–D) Immunoprecipitation using HCT116 β-cateninWTClover/∆45 (clone #33 – left), β-cateninWT/∆45Cherry (clone #45 – middle), and β-cateninWTClover/∆45 (clone #24 – right) were performed with GFP/Cherry or control beads, followed by Western blotting with the indicated antibodies. Representative results from three independent experiments are shown.
Figure 3 with 1 supplement
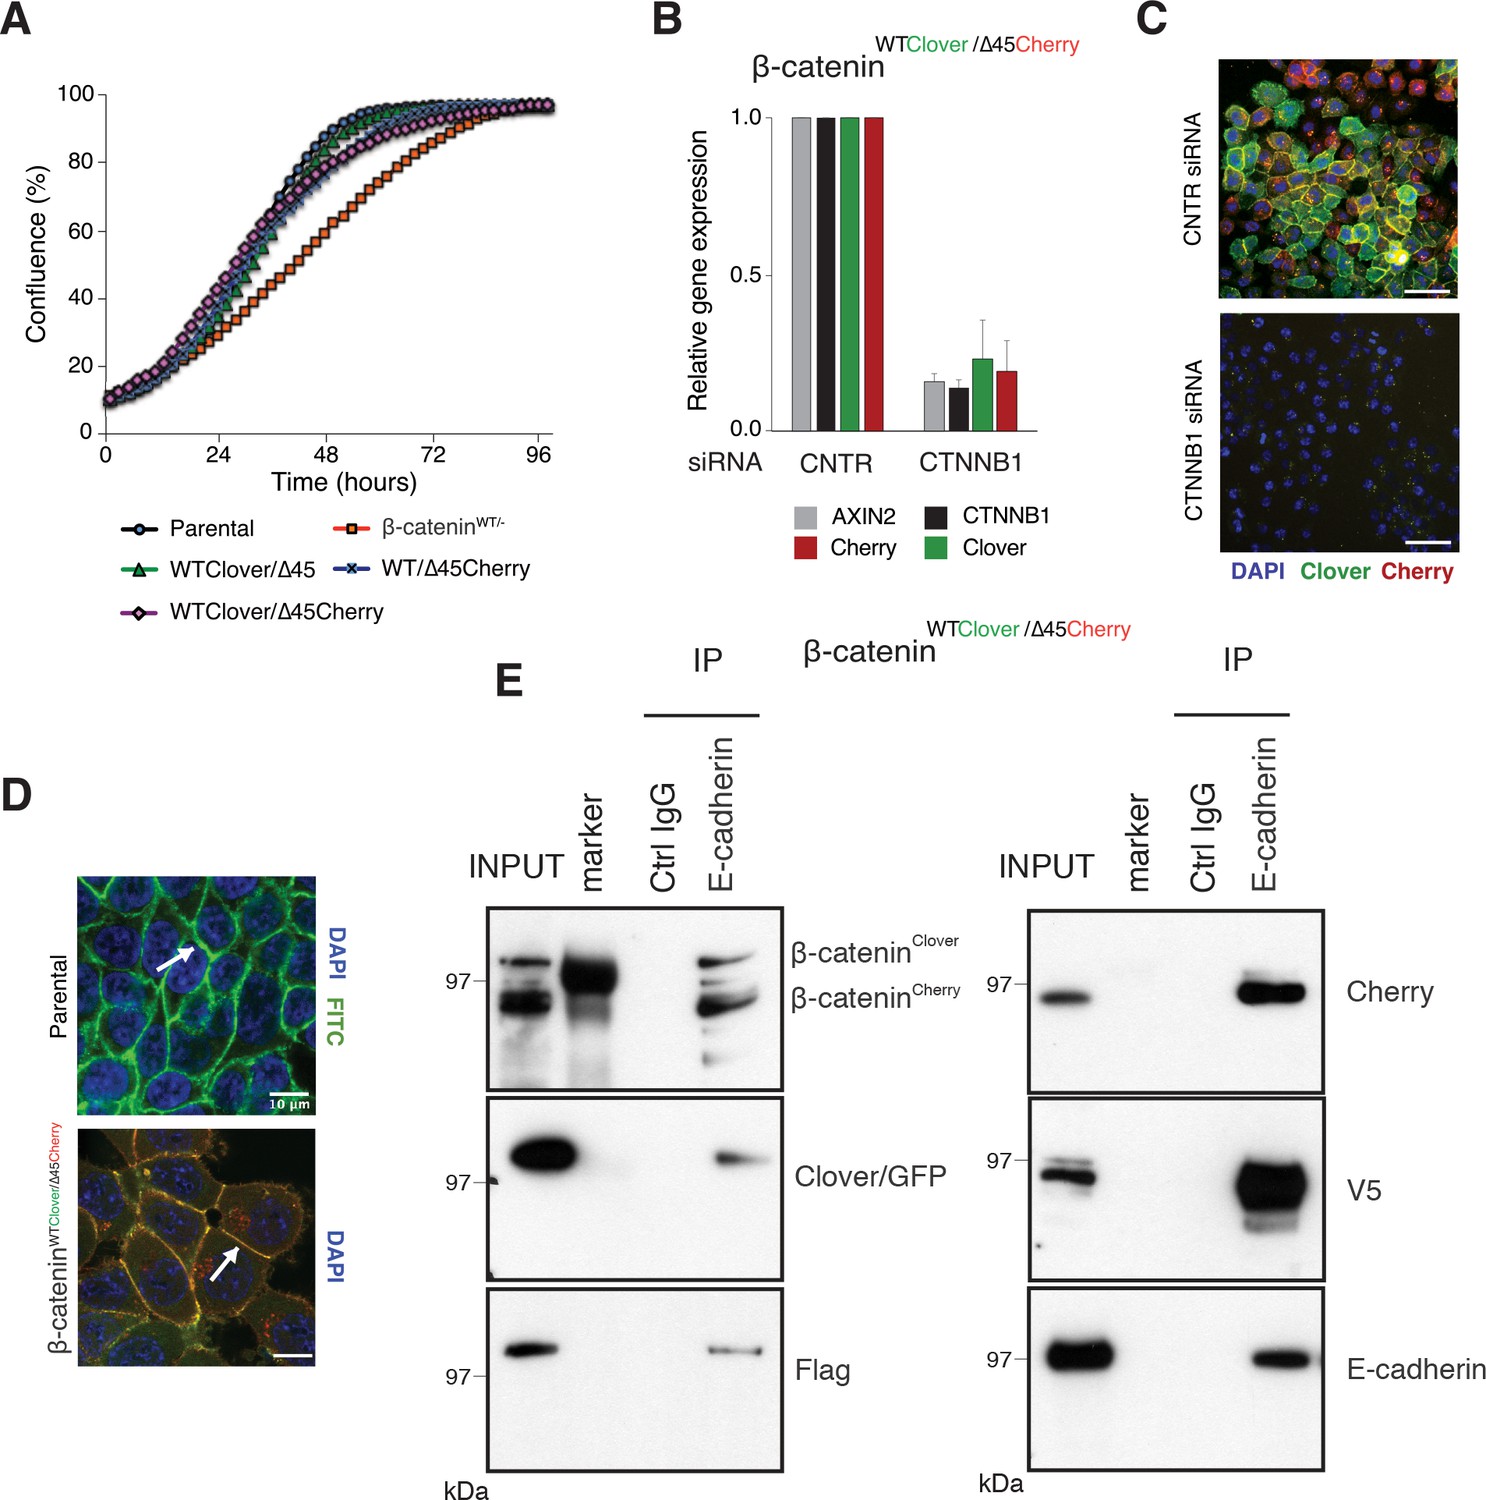
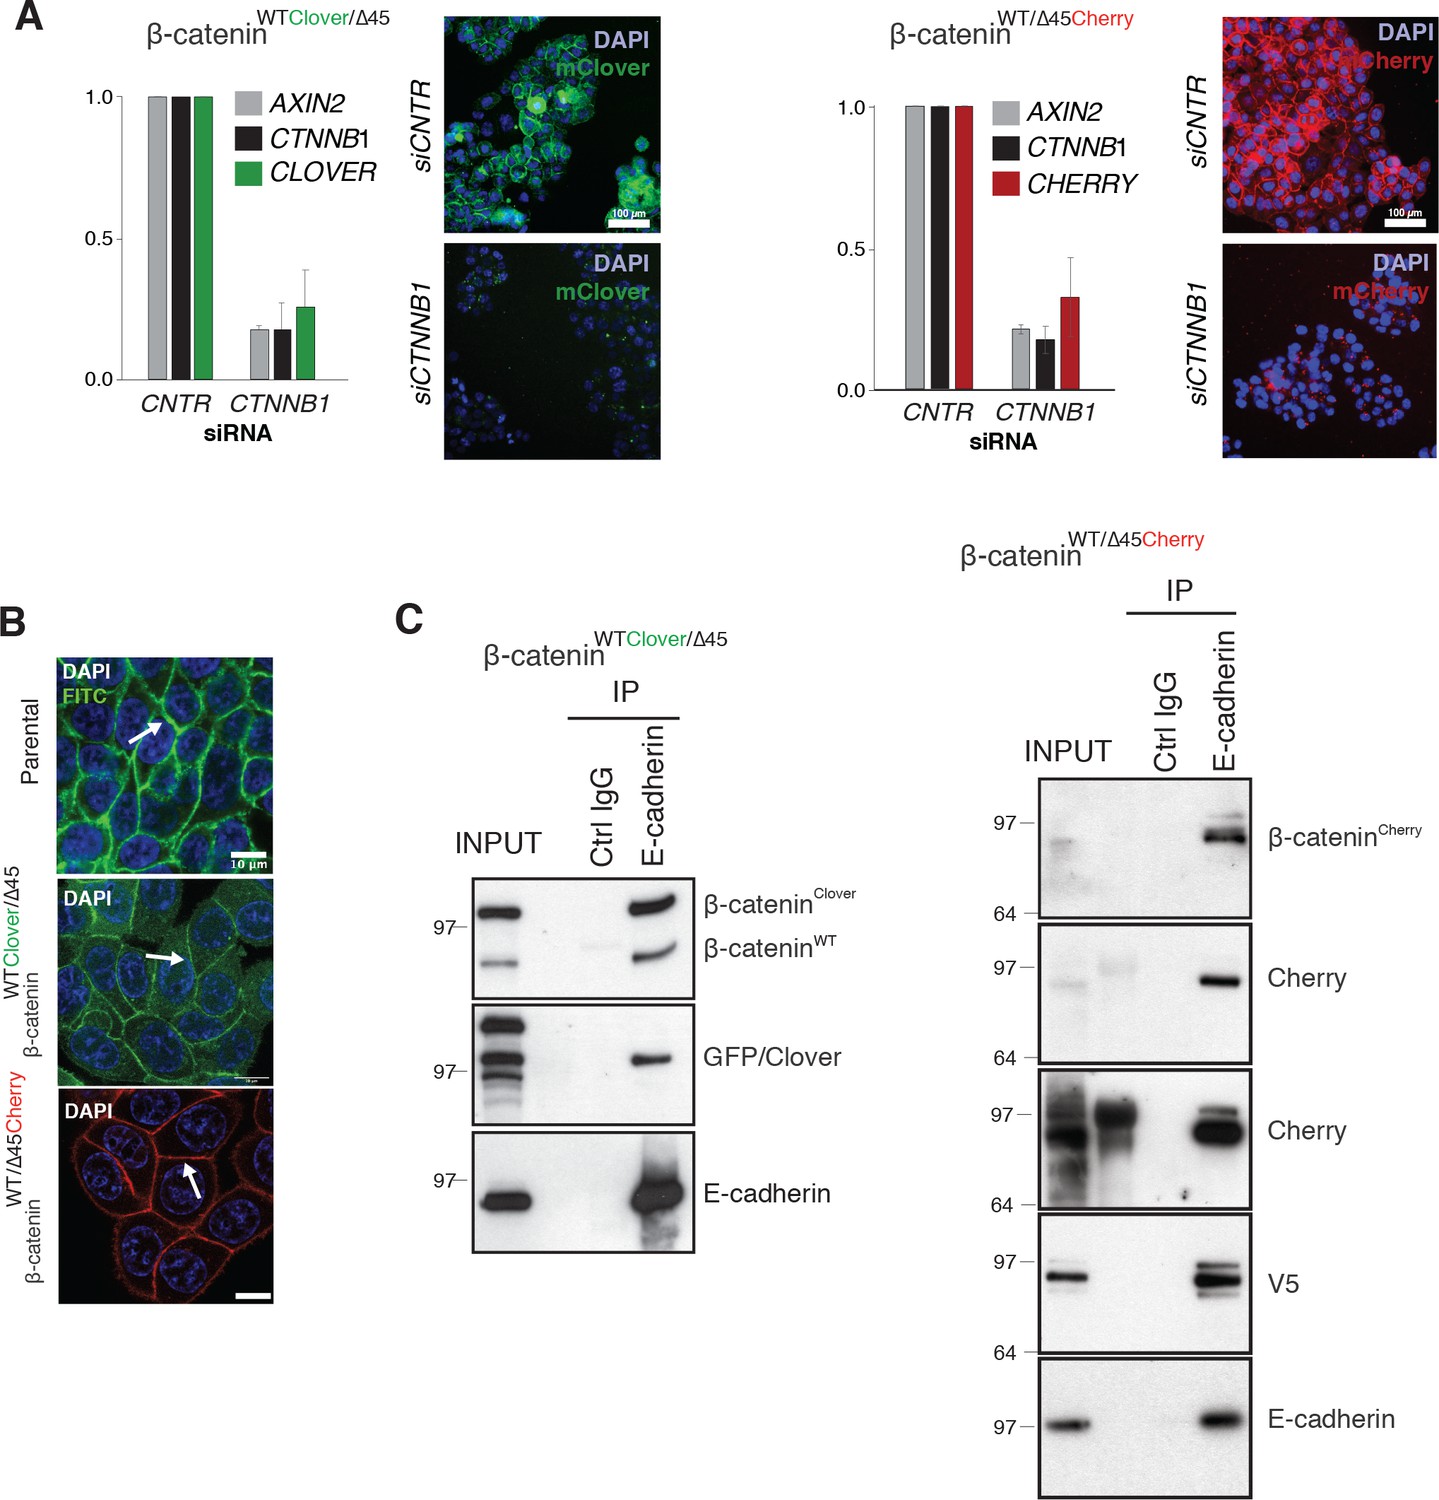
Fluorescently tagged β-catenin variants are functional and localize to adherens junctions.
(A) Proliferation of the indicated HCT116 cell clones was monitored by live-cell imaging using an Incucyte instrument. (B) In HCT116 β-cateninWTClover/∆45Cherry, mRNA-levels of CTNNB1, AXIN2, Cherry, and Clover were determined by RT-qPCR in control conditions and upon depletion of CTNNB1/β-catenin by siRNA (n=5; mean ± SD). (C) Representative immunofluorescence images of HCT116 β-cateninWTClover/∆45Cherry after siRNA-mediated knockdown of CTNNB1 are shown (n=3; scale bars: 100 μm). (D) β-catenin accumulates at cell-cell junctions (arrow). Representative immunofluorescence images of HCT116 β-cateninWTClover/∆45Cherry and parental HCT116 β-cateninWT/Δ45 stained with a β-catenin antibody are shown (scale bars: 10 μm). (E) Immunoprecipitation of HCT116 clone β-cateninWTClover/∆45Cherry with E-cadherin confirms its interaction with β-catenin. Representative results from three independent experiments are shown.
-
Figure 3—source data 1
Fluorescently tagged β-catenin variants are functional and localize to adherens junctions.
(A) Proliferation of the indicated HCT116 cell clones was monitored by live-cell imaging using an Incucyte instrument. (B) In HCT116 β-cateninWTClover/∆45Cherry, mRNA-levels of CTNNB1, AXIN2, Cherry, and Clover were determined by RT-qPCR in control conditions and upon depletion of CTNNB1/β-catenin by siRNA (n=5; mean ± SD). Figure 3—figure supplement 1: Validation of the physiological function of fluorescently tagged β-catenin. (A) In HCT116 β-cateninWTClover/∆45 and β-cateninWT/∆45Cherry mRNA-levels of CTNNB1, AXIN2, CHERRY, and CLOVER were determined by RT-qPCR upon silencing of CTNNB1/β-catenin. Immunofluorescence analysis of HCT116 β-cateninWTClover/∆45 and β-cateninWT/∆45Cherry after siRNA-mediated knockdown of CTNNB1 is shown (n=3; mean ± SEM; scale bar: 100 μm).
- https://cdn.elifesciences.org/articles/64498/elife-64498-fig3-data1-v1.xlsx
-
Figure 3—source data 2
Fluorescently tagged β-catenin variants are functional and localize to adherens junctions.
(E) Immunoprecipitation of HCT116 clone β-cateninWTClover/∆45Cherry with E-cadherin confirms its interaction with β-catenin. Representative results from three independent experiments are shown. Figure 3—figure supplement 1: Validation of the physiological function of fluorescently tagged β-catenin. (C) Immunoprecipitation of HCT116 β-cateninWTClover/∆45 and β-cateninWT/∆45Cherry with E-cadherin validates its interaction with β-catenin. A representative immunoblot is displayed.
- https://cdn.elifesciences.org/articles/64498/elife-64498-fig3-data2-v1.zip
Figure 3—figure supplement 1
Validation of the physiological function of fluorescently tagged β-catenin.
(A) In HCT116 β-cateninWTClover/∆45 and β-cateninWT/∆45Cherry, mRNA-levels of CTNNB1, AXIN2, CHERRY, and CLOVER were determined by RT-qPCR upon silencing of CTNNB1/β-catenin. Immunofluorescence analysis of HCT116 β-cateninWTClover/∆45 and β-cateninWT/∆45Cherry after siRNA-mediated knockdown of CTNNB1 is shown (n=3; mean ± SEM; scale bar: 100 μm). (B) β-catenin accumulates at cell-cell junctions (arrow). Representative immunofluorescence of HCT116 β-cateninWTClover/∆45, β-cateninWT/∆45Cherry, and parental HCT116WT/Δ45 stained with β-catenin antibody is shown. Scale bar=10 μm. (C) Immunoprecipitation of HCT116 β-cateninWTClover/∆45 and β-cateninWT/∆45Cherry with E-cadherin validates its interaction with β-catenin. A representative immunoblot is displayed.
Figure 4 with 2 supplements
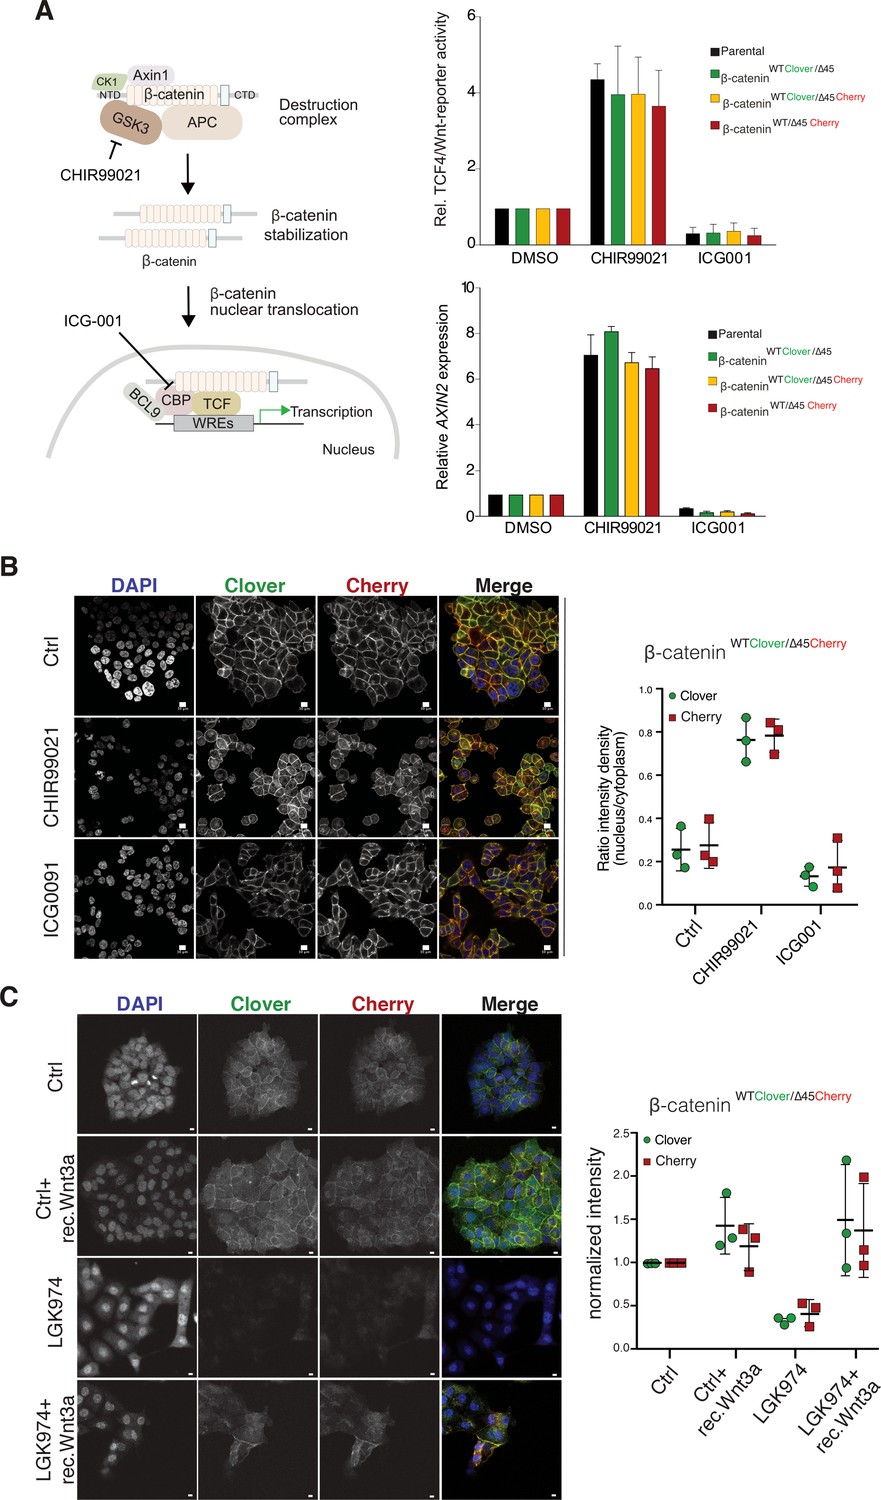
Tagging of β-catenin does not affect functionality in canonical Wnt signaling.
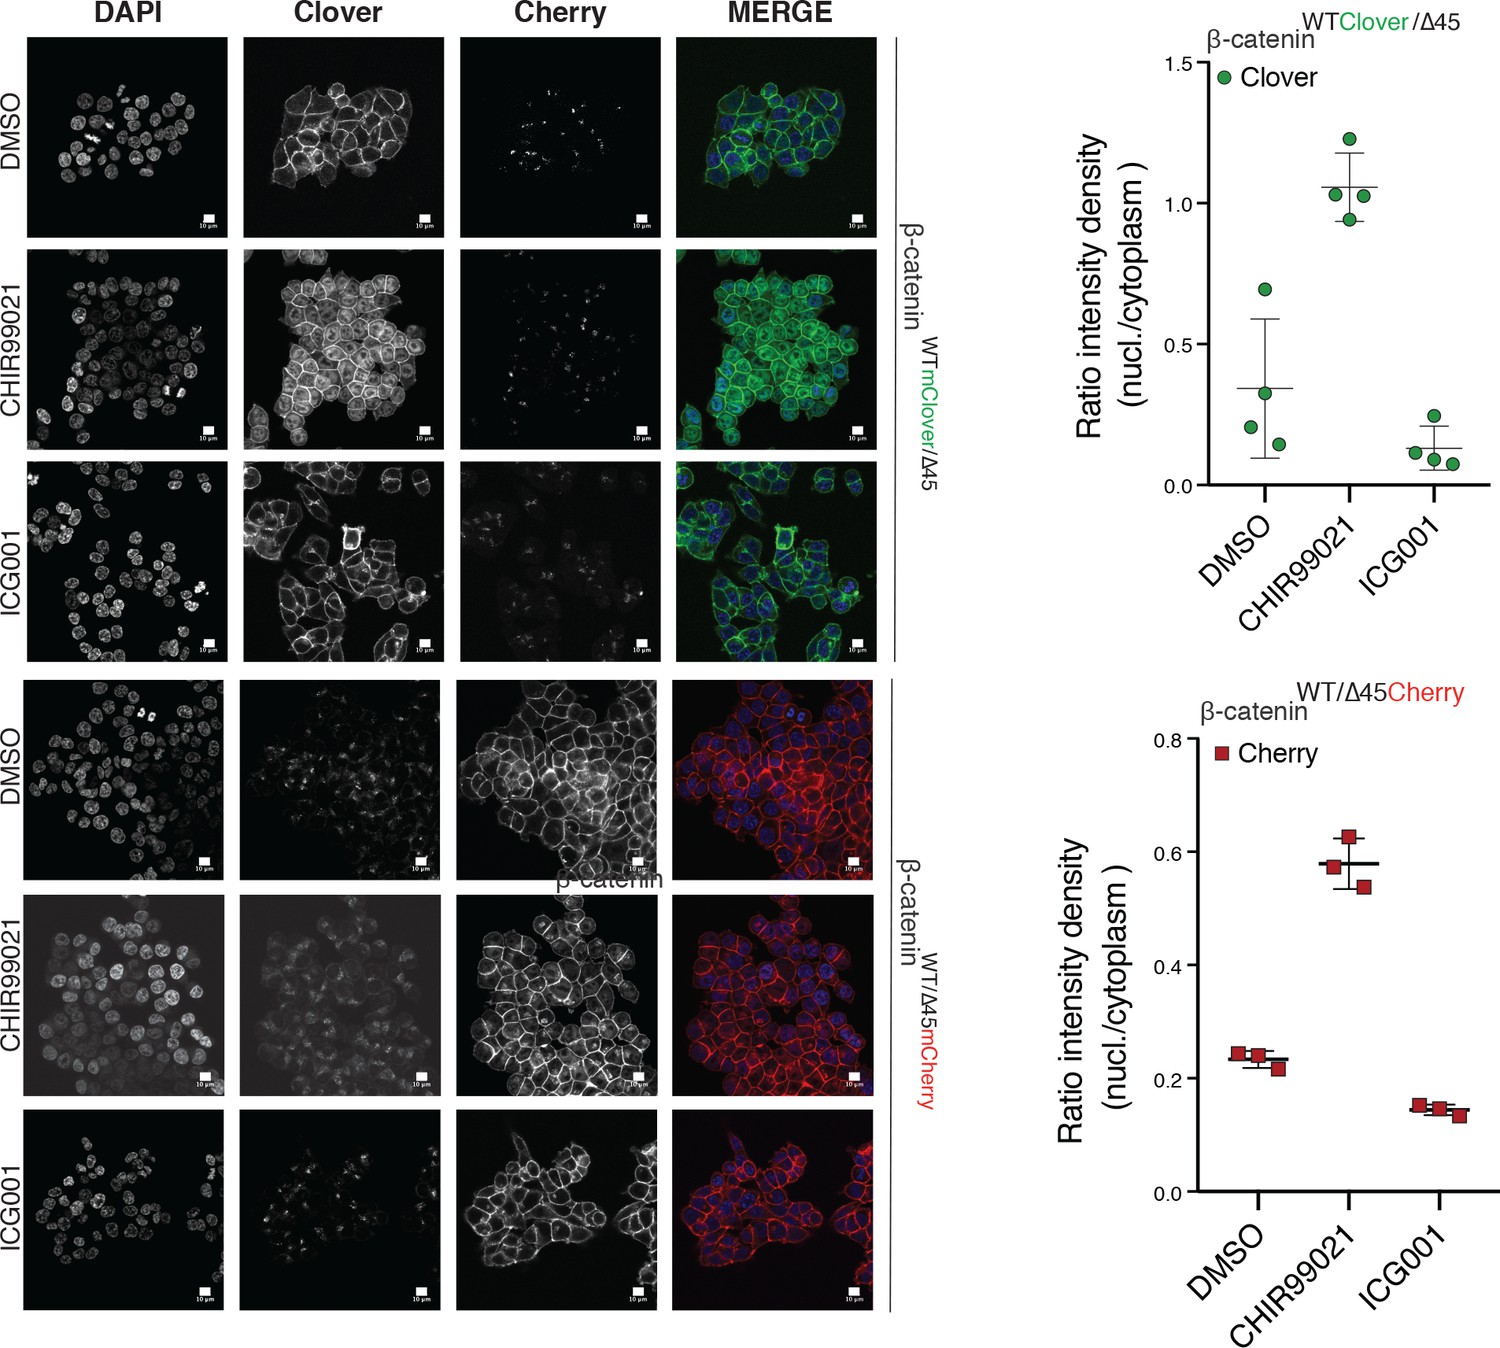
(A) Left: Scheme showing the mode of action of GSK3β inhibitor CHIR99021 and CBP inhibitor ICG-001. Right: Indicated HCT116 cell lines were treated with 10 μM CHIR99021 and 10 μM ICG-001 for 24 hr, then Wnt activity was determined by a luciferase-based TCF4/Wnt-reporter assay (upper panel) and quantification of AXIN2 mRNA-levels by RT-qPCR (n=3; mean ± SD). (B) Immunofluorescence analysis of HCT116 β-cateninWTClover/∆45Cherry after 24 hr treatment with 10 μM CHIR99021 and 10 μM ICG-001 is shown (scale bar: 10 μm). The graph on the right depicts the ratio of nuclear to cytoplasmic fluorescent signal intensity for Clover and Cherry in HCT116 β-cateninWTClover/∆45Cherry. Data from three independent experiments, each with at least 250 cells per condition, are shown as mean ± SEM. Every experiment includes at least 250 cells per condition. Enlarged representative images are shown in the Figure 4—figure supplement 2. (C) HCT116 β-cateninWTClover/∆45Cherry were treated with LGK974 for 80 hr then 200 ng/ml of recombinant Wnt3a was added for 16 hr. Intensities of the Clover or Cherry signals were measured per slide and normalized to the intensity of Hoechst staining and to the control. 10–20 slides were measured per condition in one experiment. Data of three independent experiments are shown as mean ± SEM. Each dot represents an independent experiment. WRE, Wnt responsive element. Scale bar: 10 μm.
-
Figure 4—source data 1
Tagging of β-catenin does not affect functionality in canonical Wnt signaling.
(A) Left: Scheme showing the mode of action of GSK3β inhibitor CHIR99021 and CBP inhibitor ICG-001. Right: Indicated HCT116 cell lines were treated with 10 μM CHIR99021 and 10 μM ICG-001 for 24 hr, then Wnt activity was determined by a luciferase-based TCF4/Wnt-reporter assay (upper panel) and quantification of AXIN2 mRNA-levels by RT-qPCR (n=3; mean ± SD). (B) Immunofluorescence analysis of HCT116 β-cateninWTClover/∆45Cherry after 24 hr treatment with 10 μM CHIR99021 and 10 μM ICG-001 is shown (scale bar: 10 μm). The graph on the right depicts the ratio of nuclear to cytoplasmic fluorescent signal intensity for Clover and Cherry in HCT116 β-cateninWTClover/∆45Cherry. Data from three independent experiments, each with at least 250 cells per condition, are shown as mean ± SEM. Every experiment includes at least 250 cells per condition. Enlarged representative images are shown in the Figure 4—figure supplement 2. (C) HCT116 β-cateninWTClover/∆45Cherry were treated with LGK974 for 80 hr then 200 ng/ml of recombinant Wnt3a was added for 16 hr. Intensities of the Clover or Cherry signals were measured per slide and normalized to the intensity of Hoechst staining and to the control. 10–20 slides were measured per condition in one experiment. Data of three independent experiments are shown as mean ± SEM. Each dot represents an independent experiment. Scale bar: 10 μm. Figure 4—figure supplement 1: Tagging of β-catenin does not affect its functionality in canonical Wnt signaling. Immunofluorescence analysis of HCT116 β-cateninWTClover/∆45 and β-cateninWT/∆45Cherry after 24 hr treatment with 10 μM CHIR99021 and 10 μM ICG-001 is shown. The graphs on the right show the ratio of nuclear to cytoplasmic fluorescence intensities for Clover and Cherry in β-cateninWTClover/∆45 and β-cateninWT/∆45Cherry, respectively (n=3 and 4; mean ± SEM). WRE, Wnt responsive element. Scale bar: 10 μm.
- https://cdn.elifesciences.org/articles/64498/elife-64498-fig4-data1-v1.xlsx
Figure 4—figure supplement 1
Tagging of β-catenin does not affect its functionality in canonical Wnt signaling.
Immunofluorescence analysis of HCT116 β-cateninWTClover/∆45 and β-cateninWT/∆45Cherry after 24 hr treatment with 10 μM CHIR99021 and 10 μM ICG-001 is shown. The graphs on the right show the ratio of nuclear to cytoplasmic fluorescence intensities for Clover and Cherry in β-cateninWTClover/∆45 and β-cateninWT/∆45Cherry, respectively (n=3 and 4; mean ± SEM). Scale bar: 10 μm.
Figure 4—figure supplement 2
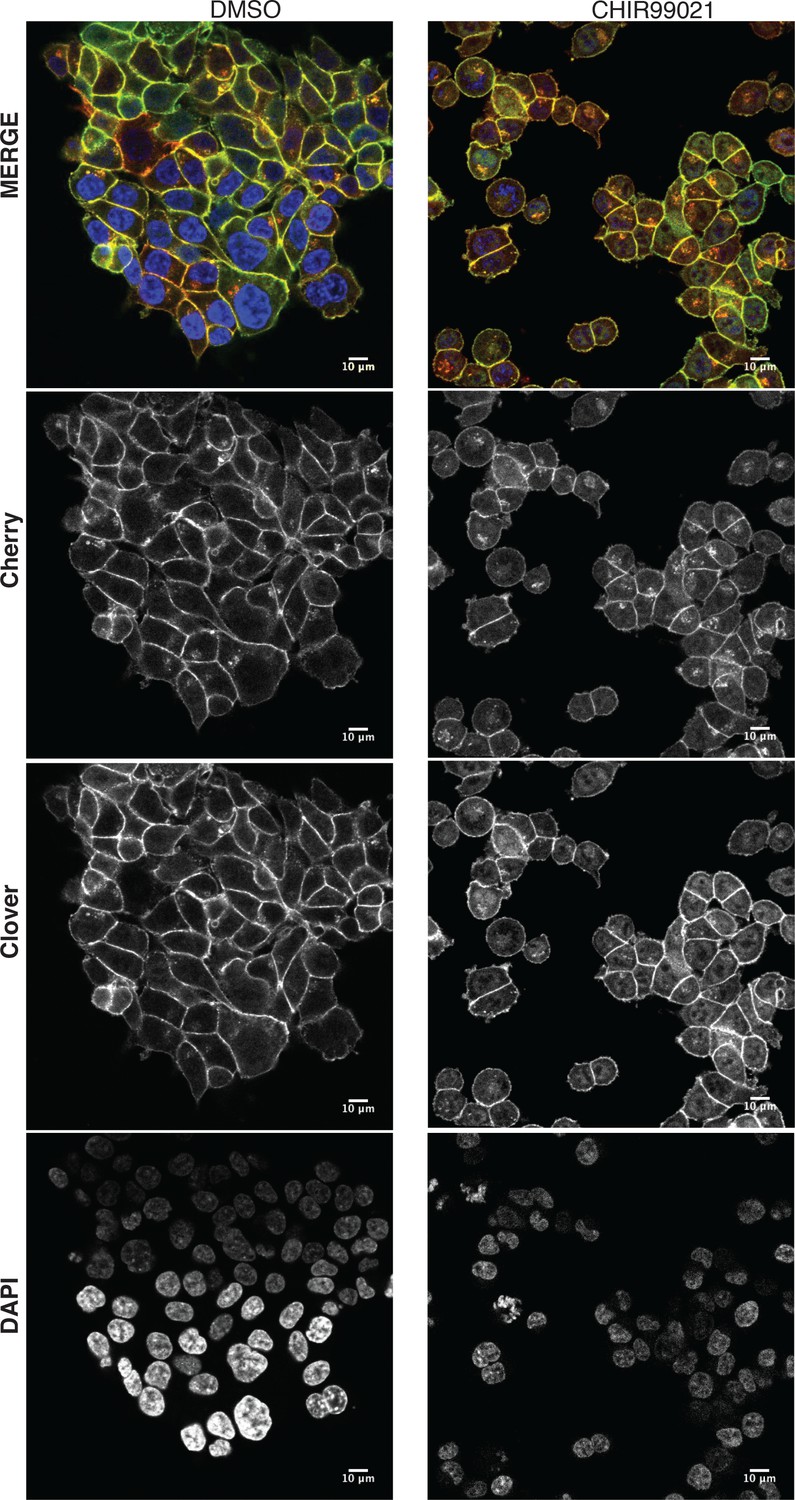
Tagging of β-catenin does not affect its functionality in canonical Wnt signaling.
Representative images from Figure 4B of HCT116 β-cateninWTClover/∆45 and β-cateninWT/∆45Cherry after 24 hr treatment with 10 μM CHIR99021 are shown. Scale bar: 10 μm.
Figure 5 with 1 supplement
Wild-type and mutant β-catenin both contribute to Wnt pathway activation.
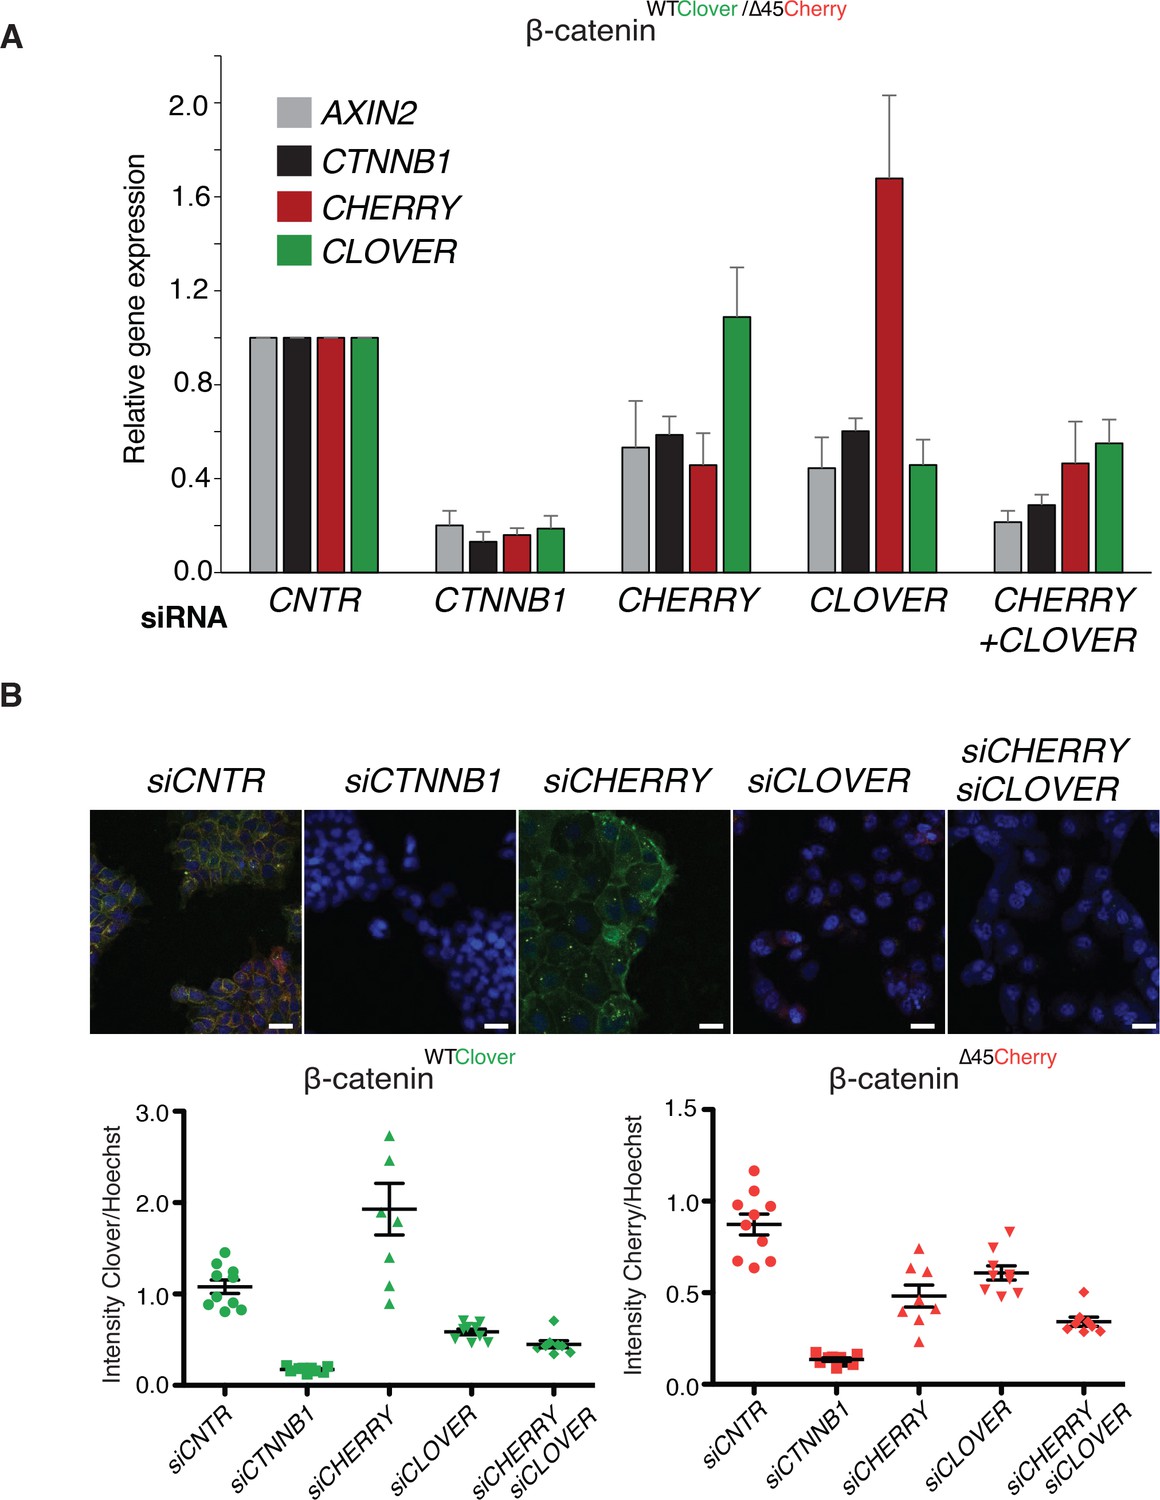
(A) Expression levels of AXIN2, CTNNB1/β-catenin, Cherry, and Clover were measured 72 hr after knockdown with siRNAs directed against Clover, Cherry or both in HCT116 β-cateninWTClover/∆45Cherry (n=4, mean ± SD). (B) Immunofluorescence analysis of HCT116 β-cateninWTClover/∆45Cherry upon transfection with siRNAs targeting CTNNB1, CLOVER, CHERRY, or a combination of CLOVER and CHERRY (scale bar: 25 μm). Intensities of the Clover or Cherry signals were measured per slide and normalized to the intensity of Hoechst staining. 5–10 slides were measured per condition and are shown as dots. Representative one from four independent experiments (Figure 5—figure supplement 1) is shown.
-
Figure 5—source data 1
Wild-type and mutant β-catenin both contribute to Wnt pathway activation.
(A) Expression levels of AXIN2, CTNNB1/β-catenin, Cherry, and Clover were measured 72 hr after knockdown with siRNAs directed against Clover, Cherry, or both in HCT116 β-cateninWTClover/∆45Cherry (n=4, mean ± SD). (B) Immunofluorescence analysis of HCT116 β-cateninWTClover/∆45Cherry upon transfection with siRNAs targeting CTNNB1, CLOVER, CHERRY, or a combination of CLOVER and CHERRY (scale bar: 25 μm). Intensities of the Clover or Cherry signals were measured per slide and normalized to the intensity of Hoechst staining. 5–10 slides were measured per condition and are shown as dots. Representative one from four independent experiments (Figure 5—figure supplement 1) is shown. Figure 5—figure supplement 1: Immunofluorescence analysis of HCT116 β-cateninWTClover/∆45Cherry upon transfection with siRNAs targeting CTNNB1, CLOVER, CHERRY, or a combination of CLOVER and CHERRY. Representative images from Figure 5. Scale bar: 25 μm. Immunofluorescence analysis of HCT116 β-cateninWTClover/∆45Cherry upon transfection with siRNAs targeting CTNNB1, CLOVER, CHERRY, or a combination of CLOVER and CHERRY (scale bar: 25 μm). Intensity of Clover or Cherry signal was measured per slide and normalized to the intensity of Hoechst staining and then normalized to control. 5–10 slides per condition were measured. Data of four independent experiments are shown as mean ± SEM. Each dot represents an independent experiment.
- https://cdn.elifesciences.org/articles/64498/elife-64498-fig5-data1-v1.xlsx
Figure 5—figure supplement 1
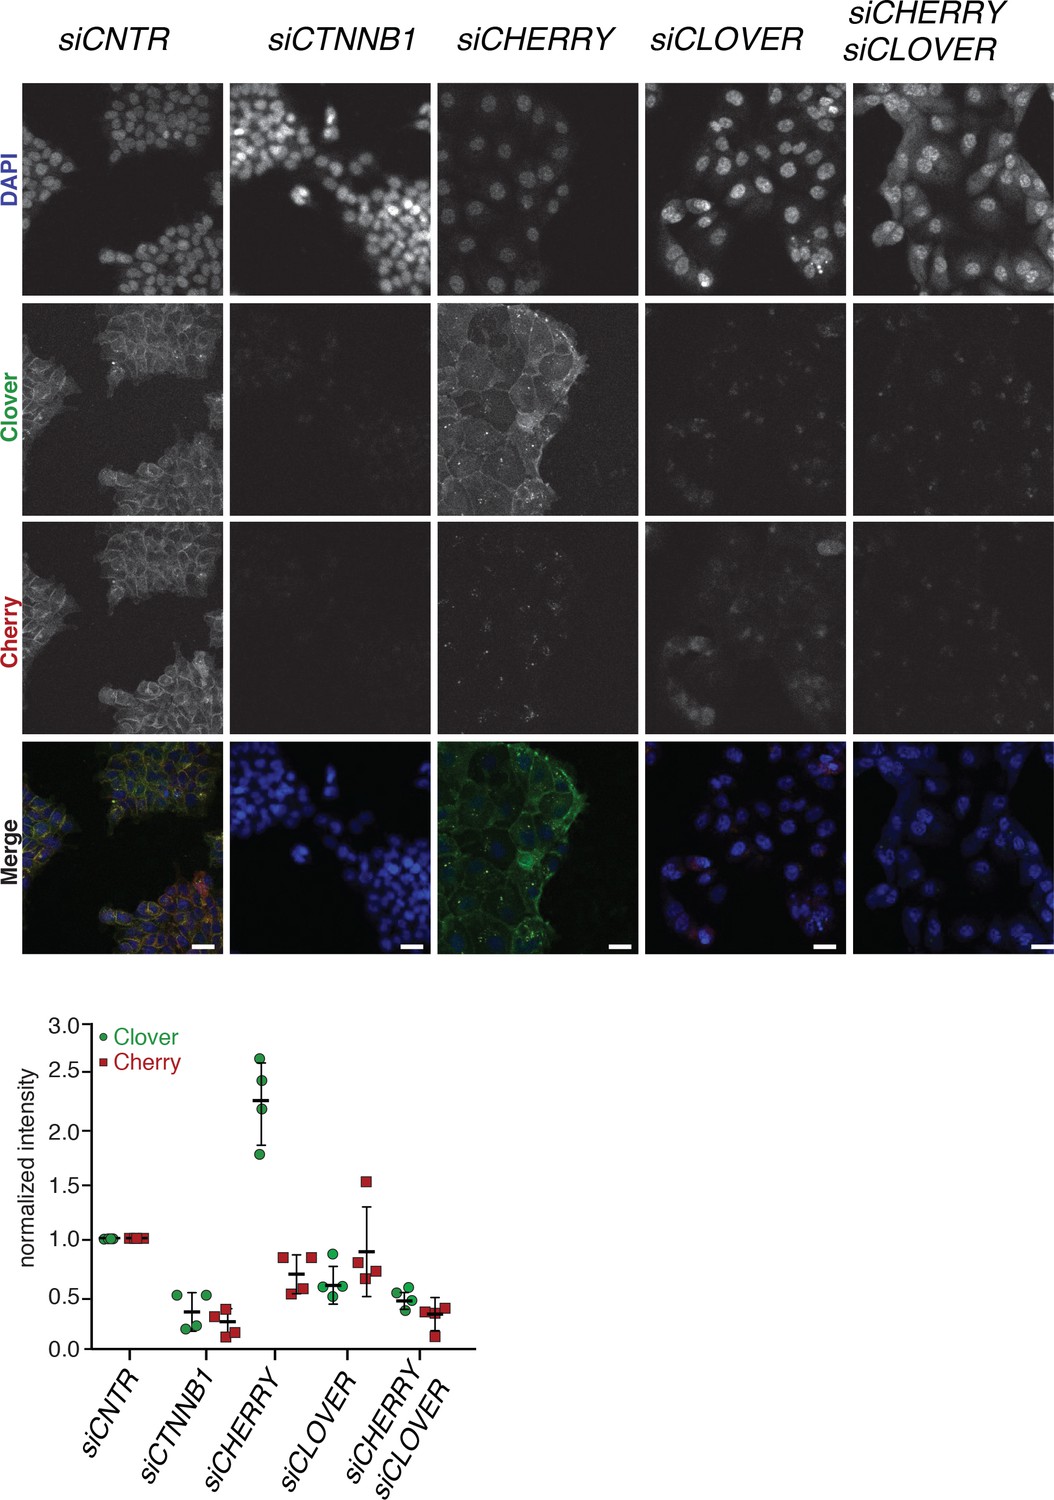
Immunofluorescence analysis of HCT116 β-cateninWTClover/∆45Cherry upon transfection with siRNAs targeting CTNNB1, CLOVER, CHERRY, or a combination of CLOVER and CHERRY.
Representative images from Figure 5B. Scale bar: 25 μm. Immunofluorescence analysis of HCT116 β-cateninWTClover/∆45Cherry upon transfection with siRNAs targeting CTNNB1, CLOVER, CHERRY, or a combination of CLOVER and CHERRY (scale bar: 25 μm). Intensity of Clover or Cherry signal was measured per slide and normalized to the intensity of Hoechst staining and then normalized to control. 5–10 slides per condition were measured. Data of four independent experiments are shown as mean ± SEM. Each dot represents an independent experiment.
Figure 6 with 1 supplement
FCS autocorrelation analyses reveal differences in the dynamics and concentrations of wild-type and mutant β-catenin.
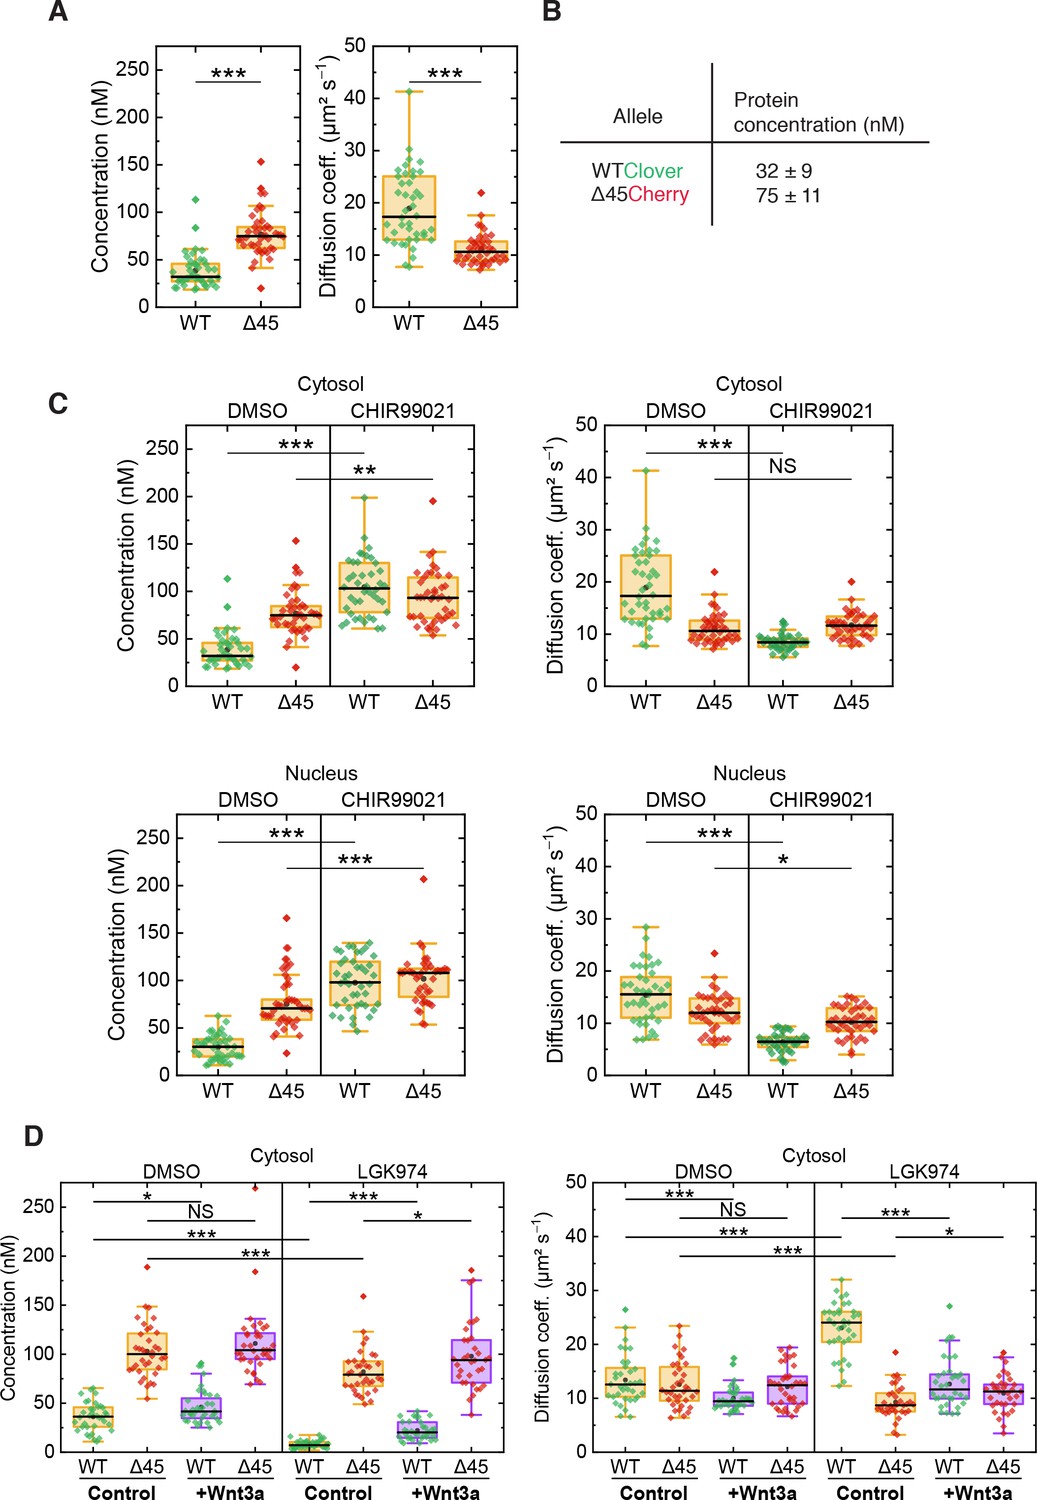
(A) Concentrations (left) and diffusion coefficients (right) of Clover-tagged wild-type β-catenin and Cherry-tagged mutant β-catenin in the cytosol of HCT116 β-cateninWTClover/∆45Cherry. (B) Protein concentrations (medians of the distributions shown in panel (A)). (C) Concentrations (left) and diffusion coefficients (right) of Clover-tagged wild-type β-catenin and Cherry-tagged mutant β-catenin measured on HCT116 β-cateninWTClover/∆45Cherry cells that were treated for 14–26 hr with either 10 µM CHIR99021 or DMSO as control. (D) HCT116 β-cateninwtClover/∆45Cherry cells were treated with 5 µM of LGK974 for 96 hr. Sixteen hours before termination of the experiment, 200 ng/ml of recombinant Wnt3a was added. FCS analysis was performed in the cytosol (data shown here) and in the nucleus (data shown in Figure 6—figure supplement 1). Each data point represents a 120 s FCS measurement in a single cell. In total, more than 40 cells per condition were measured in three independent experiments per box plot. p-values were calculated with the Mann-Whitney test (*** <0.001; ** <0.01; * <0.05; NS – non-significant). See also Supplementary file 1. FCS, fluorescence correlation spectroscopy.
-
Figure 6—source data 1
FCS autocorrelation analyses reveal differences in the dynamics and concentrations of wild-type and mutant β-catenin.
(A) Concentrations (left) and diffusion coefficients (right) of Clover-tagged wild-type β-catenin and Cherry-tagged mutant β-catenin in the cytosol of HCT116 β-cateninWTClover/∆45Cherry. (C) Concentrations (left) and diffusion coefficients (right) of Clover-tagged wild-type β-catenin and Cherry-tagged mutant β-catenin measured on HCT116 β-cateninWTClover/∆45Cherry cells that were treated for 14–26 hr with either 10 µM CHIR99021 or DMSO as control. (D) HCT116 β-cateninwtClover/∆45Cherry cells were treated with 5 µM of LGK974 for 96 hr. Sixteen hours before termination of the experiment, 200 ng/ml of recombinant Wnt3a was added. FCS analysis was performed in the cytosol (data shown here) and in the nucleus (data shown in Figure 6—figure supplement 1). Each data point represents a 120 s FCS measurement in a single cell. In total, more than 40 cells per condition were measured in three independent experiments per box plot. p-values were calculated with the Mann-Whitney test (*** <0.001; ** <0.01; * <0.05; NS – non-significant). See also Supplementary file 1. Figure 6—figure supplement 1: Cross-correlation analysis reveals that the two β-catenin protein isoforms diffuse independently. (A) Shown are representative autocorrelation curves (green, red) and the cross-correlation (blue) from 120 s FCS measurements in the cytosol and the nucleus of HCT116 β-cateninWTClover/∆45Cherry. The non-zero amplitudes of the autocorrelation curves in the green and red color channels indicate the presence of both β-catenin isoforms in the cytosol and in the nucleus. Jagged lines: experimental data, smooth lines, fits with a model function, y-axis: amplitudes of the pair correlation functions. (B) HCT116 β-cateninWTClover/∆45Cherry cells were treated with 5 µM of LGK974 for 96 hr. Sixteen hours before termination of the experiment, 200 ng/ml of recombinant Wnt3a was added. Afterward, FCS measurements were performed in the cytosol (data shown in Figure 6) and in the nucleus (shown here). For each data point, a 120 s FCS measurement was carried out in a single cell. Per box plot, more than 40 cells were examined in three independent experiments. p-values were calculated with the Mann-Whitney test (*** <0.001; ** <0.01; * <0.05; NS – non-significant) The exact values are provided as the Supplementary file 1. FCS, fluorescence correlation spectroscopy.
- https://cdn.elifesciences.org/articles/64498/elife-64498-fig6-data1-v1.xlsx
Figure 6—figure supplement 1
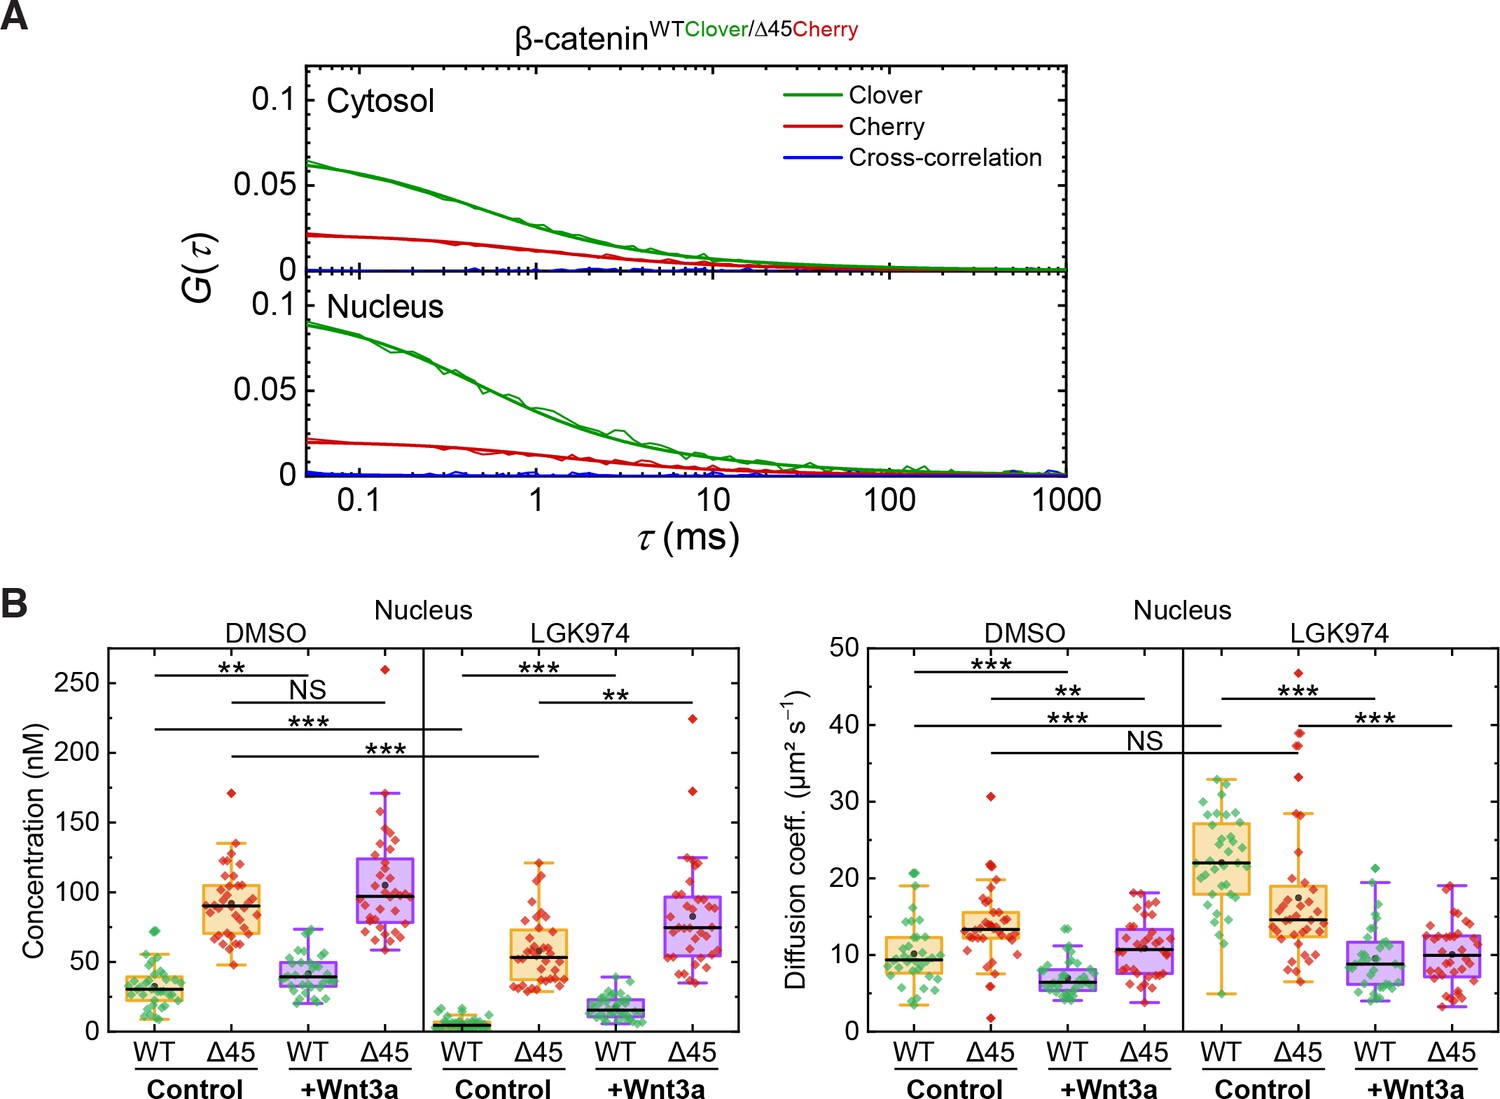
Cross-correlation analysis reveals that the two β-catenin protein isoforms diffuse independently.
(A) Shown are representative autocorrelation curves (green, red) and the cross-correlation (blue) from 120 s FCS measurements in the cytosol and the nucleus of HCT116 β-cateninWTClover/∆45Cherry. The non-zero amplitudes of the autocorrelation curves in the green and red color channels indicate the presence of both β-catenin isoforms in the cytosol and in the nucleus. Jagged lines: experimental data, smooth lines, fits with a model function, y-axis: amplitudes of the pair correlation functions. (B) HCT116 β-cateninWTClover/∆45Cherry cells were treated with 5 µM of LGK974 for 96 hr. Sixteen hours before termination of the experiment, 200 ng/ml of recombinant Wnt3a was added. Afterward, FCS measurements were performed in the cytosol (data shown in Figure 6C) and in the nucleus (shown here). For each data point, a 120 s FCS measurement was carried out in a single cell. Per box plot, more than 40 cells were examined in three independent experiments. p-values were calculated with the Mann-Whitney test (*** <0.001; ** <0.01; * <0.05; NS – non-significant:) The exact values are provided as the Supplementary file 1.
Figure 7 with 1 supplement
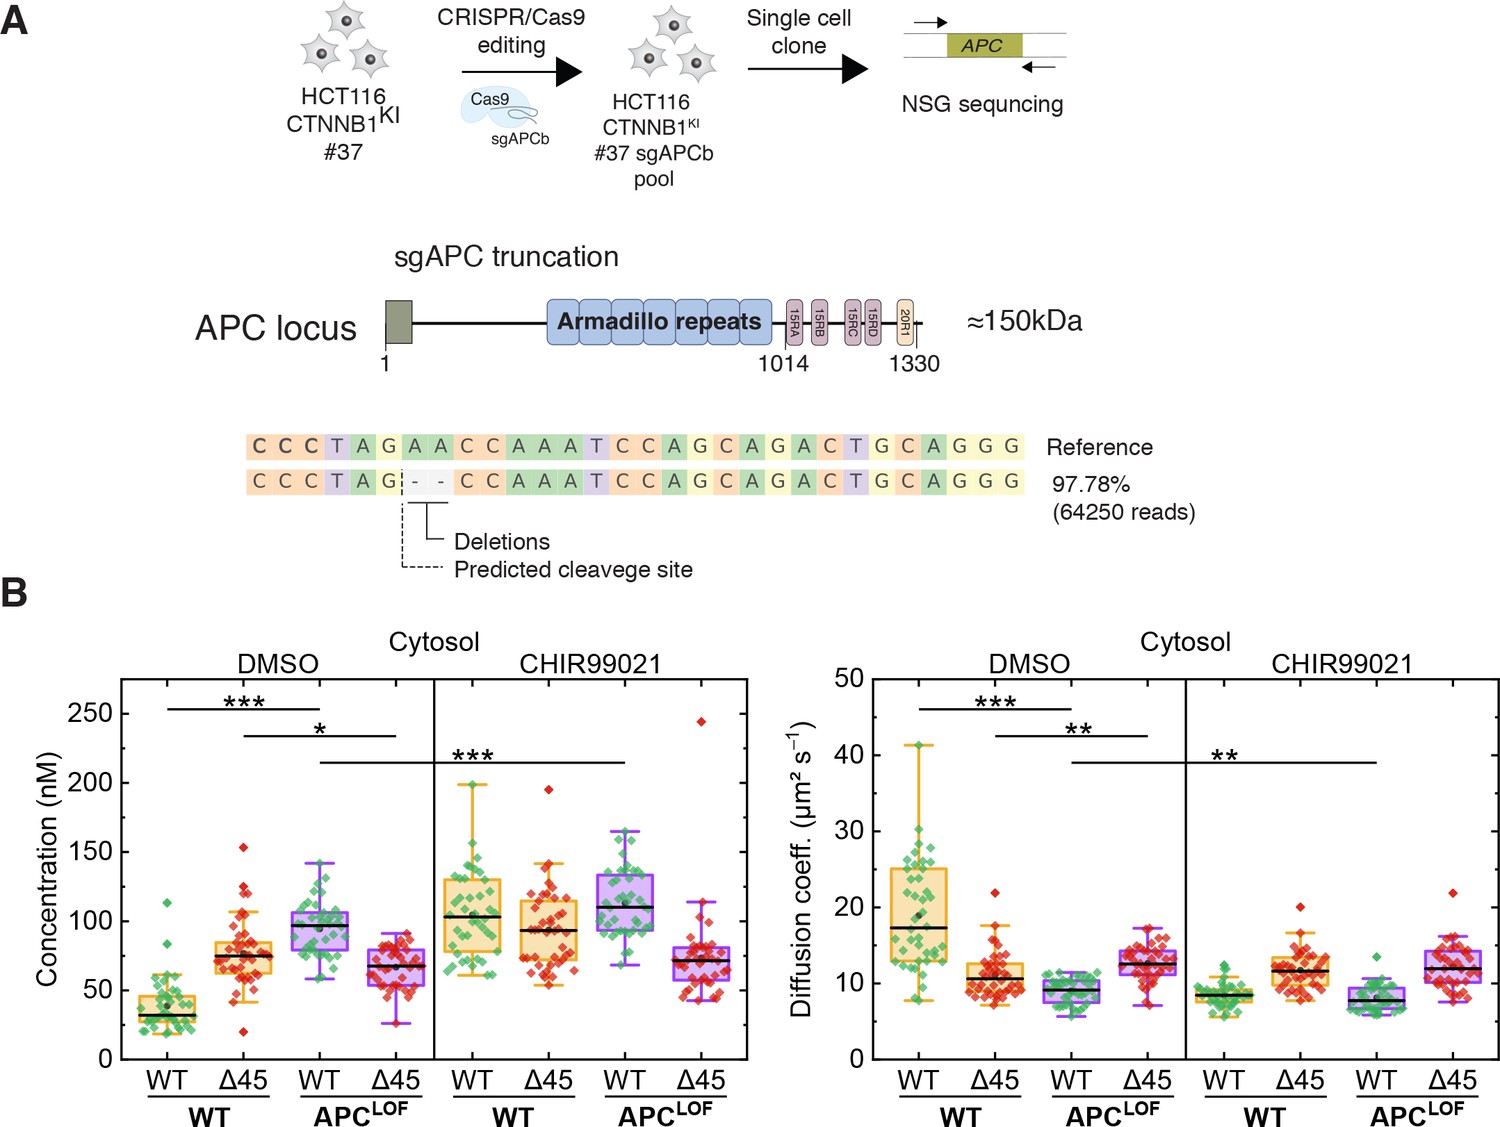
Truncation of APC affects abundance and diffusional dynamics of wild-type but not mutant β-catenin in the cytosol.
(A) Schematic representation of the APC locus and target site of sgACP in the mutation cluster region (MCR) domain. (B) Concentrations (left) and diffusion coefficients (right) of Clover-tagged wild-type β-catenin and Cherry-tagged mutant β-catenin in the cytosol of HCT116 β-cateninWTClover/∆45Cherry and sgAPC targeted clone (APCLOF) cells that were treated for ~16 hr with either 10 µM CHIR9901 or DMSO as control. Subsequently, FCS measurements were performed in the cytosol (data shown here) and in the nucleus (data shown in Figure 7—figure supplement 1A). Each data point in the box plots represents a result from a 120 s FCS measurement in a single cell. Per box plot, more than 40 cells were investigated in three independent experiments. p-values were calculated with the Mann-Whitney test (*** <0.001; ** <0.01; * <0.05; NS – non-significant). The exact values are provided in the Supplementary file 1. FCS, fluorescence correlation spectroscopy.
-
Figure 7—source data 1
Truncation of APC affects abundance and diffusional dynamics of wild-type but not mutant β-catenin in the cytosol.
(B) HCT116 β-cateninWTClover/∆45Cherry and sgAPC targeted clone (APCLOF) cells were treated for ~16 hr with either 10 µM CHIR9901 or DMSO as control. Subsequently, FCS measurements were performed in the cytosol (data shown here) and in the nucleus (data shown in Figure 7—figure supplement 1A). Each data point in the box plots represents a result from a 120 s FCS measurement in a single cell. Per box plot, more than 40 cells were investigated in three independent experiments. p-values were calculated with the Mann-Whitney test (*** <0.001; ** <0.01; * <0.05; NS – non-significant). The exact values are provided in the Supplementary file 1. Figure 7—figure supplement 1: Truncation of APC affects abundance and diffusion of wild-type but not mutant β-catenin in the nucleus. (A) HCT116 β-cateninWTClover/∆45Cherry and sgAPC targeted clone (APCLOF) cells were treated for ~16 hr with either 10 µM CHIR9901 or DMSO as control. Afterward, FCS measurements were performed in the cytosol (data shown in Figure 7) and in the nucleus (shown here). For each data point, a 120 s FCS measurement was carried out in a single cell. Per box plot, more than 40 cells were examined in three independent experiments. p-values were calculated with the Mann-Whitney test (*** <0.001; ** <0.01; * <0.05; NS – non-significant). The exact values are provided as the Supplementary file 1. FCS, fluorescence correlation spectroscopy.
- https://cdn.elifesciences.org/articles/64498/elife-64498-fig7-data1-v1.xlsx
-
Figure 7—source data 2
Truncation of APC affects abundance and diffusion of wild-type but not mutant β-catenin in the nucleus.
Figure 7—figure supplement 1: (B) Both β-catenin alleles of HCT116 cells bind to APC, GSK3β, and Axin1. IP with anti-APC antibody was performed GFP/Clover and Cherry were detected (left panel). IPs with RFP/Cherry and GFP/Clover beads were performed and β-catenin, Axin1, and GSK3β were detected (right panel). Representative experiments from three independent are shown.
- https://cdn.elifesciences.org/articles/64498/elife-64498-fig7-data2-v1.zip
Figure 7—figure supplement 1
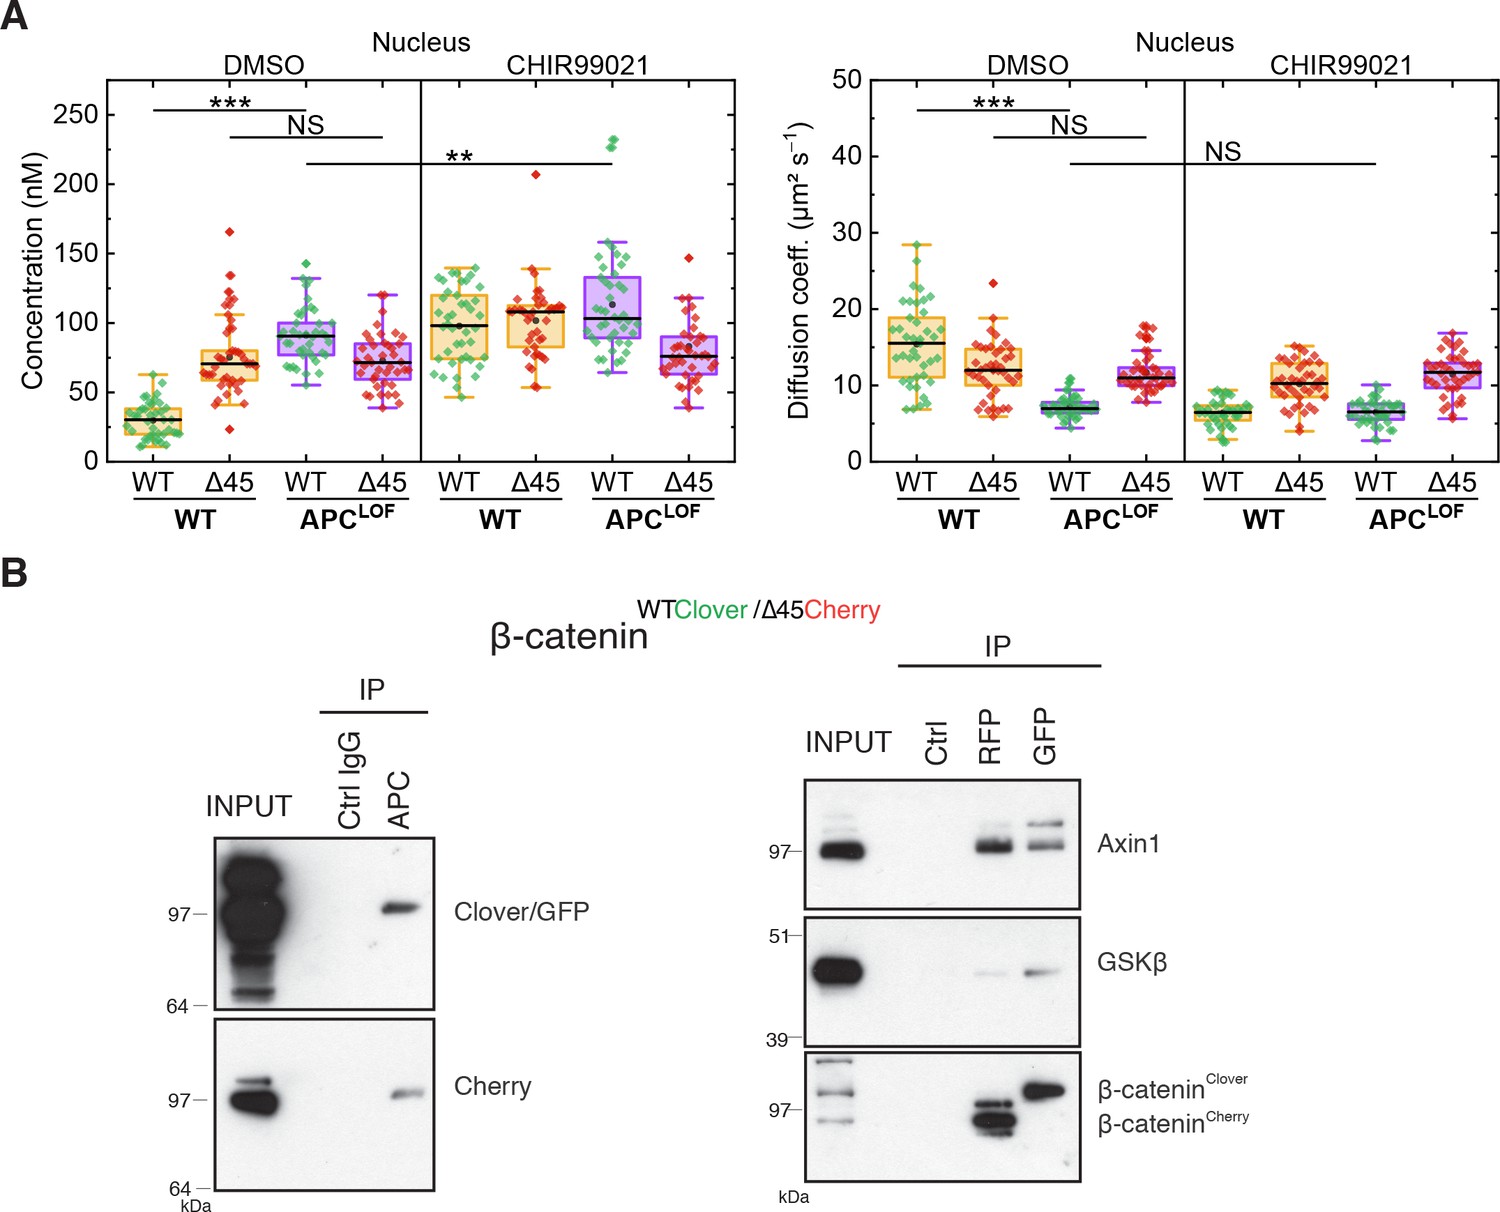
Truncation of APC affects abundance and diffusion of wild-type but not mutant β-catenin in the nucleus.
(A) HCT116 β-cateninWTClover/∆45Cherry and sgAPC targeted clone (APCLOF) cells were treated for ~16 hr with either 10 µM CHIR9901 or DMSO as control. Afterward, FCS measurements were performed in the cytosol (data shown in Figure 7) and in the nucleus (shown here). For each data point, a 120 s FCS measurement was carried out in a single cell. Per box plot, more than 40 cells were examined in three independent experiments. p-values were calculated with the Mann-Whitney test (*** <0.001; ** <0.01; * <0.05; NS – non-significant:) The exact values are provided as the Supplementary file 1. (B) Both β-catenin alleles of HCT116 cells bind to APC, GSK3β, and Axin1. IP with anti-APC antibody was performed GFP/Clover and Cherry were detected (left panel). IPs with RFP/Cherry and GFP/Clover beads were performed and β-catenin, Axin1, and GSK3β were detected (right panel). Representative experiments from three independent are shown.
Author response image 1
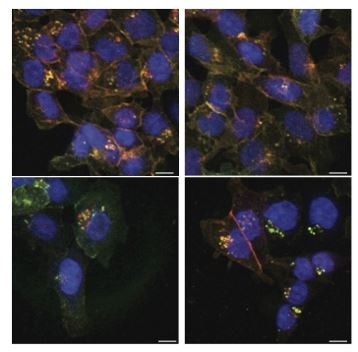
Both alleles, β-cateninWTClover and β-cateninΔ45Cherry, can be located in the perinuclear puncta.
Representative immunofluorescence images of HCT116 β-cateninwtClover/Δ45Cherry cells from experiments shown in Figure 4C, 5B. Scale bar: 10 μm.
Tables
Key resources table
| Reagent type (species) or resource | Designation | Source or reference | Identifiers | Additional information |
|---|---|---|---|---|
| Cell line (Homo sapiens) | HCT116 | ATCC | CCL-247/CVCL_0291 | Human colon cancer cells |
| Strain, strain background (Escherichia coli) | Top 10 E. coli | Life Technologies GmbH | C404003 | Chemically competent cells |
| Other | TransIT-LT1 | VWR | 731-0029 | Plasmid transfection reagent |
| Other | Lipofectamine RNAiMax | Life technologies GmbH | 13778150 | siRNA transfection reagent |
| Transfected construct (human) | siRNA:UBC | GE HealthcareDharmacon/Horizon | MU-019408-01-0002 | #1 GTGAAGACCCTGACTGGTA#2 AAGCAAAGATCCAGGACAA#3 GAAGATGGACGCACCCTGT#4 GTAAGACCATCACTCTCGA |
| Transfected construct (human) | siRNA:Non targeting | GE HealthcareDharmacon/Horizon | D‐001810‐02 | UGGUUUACAUGUUGUGUGA |
| Transfected construct (human) | siRNA:Control | Ambion | S29712 | |
| Transfected construct (human) | siRNA:GFP | GE HealthcareDharmacon//Horizon | D-001300-01-05 | GCAAGCTGACCCTGAAGTTC |
| Transfected construct (human) | siRNA:CTNNB1 | Ambion | S438 | CUGUUGGAUUGAUUCGAAAtt |
| Transfected construct (human) | siRNA:Cherry | IDT | Custom design | rCrArU rGrGrC rCrArU rCrArU rCrArA rGrGrA rGrUrU rCrArU rG |
| Antibody | Anti-β-actin HRP, (Rabbit polyclonal) | Santa Cruz Biotechnology | Cat#: 47778/ RRID:AB_2714189 | WB (1:20,000) |
| Antibody | Anti-β-actin, (Rabbit polyclonal) | Santa Cruz Biotechnology | Cat#: 47778/ RRID:AB_2714189 | WB (1:40,000) |
| Antibody | Anti-β-catenin, (Mouse monoclonal) | Dianova/Affinity BioReagent | Cat#: MA1-2001/ RRID:AB_326078 | WB (1:3000),IF (1:500) |
| Antibody | Anti-Cherry, (Mouse monoclonal) | ClonTech | Cat#: 632543/ RRID:AB_2307319 | WB (1:1000) |
| Antibody | Anti-GFP, (Mouse monoclonal) | Invitrogen | Cat#: 332600/ RRID:AB_2533111 | WB (1:1000) |
| Antibody | Anti-GFP, (Rabbit polyclonal) | Invitrogen | Cat#: A6455/ RRID:AB_221570 | WB (1:1000) |
| Antibody | Anti-E-Cadherin, (Mouse monoclonal) | BD Biosciences | Cat#: 610182/ RRID:AB_397581 | WB (1:1000) |
| Antibody | Anti-V5, (Rabbit polyclonal) | Rockland | Cat#: 600-401−378/ RRID:AB_828437 | WB (1:2000) |
| Antibody | Anti-V5, (Mouse monoclonal) | Thermo Fisher Scientific | Cat#: 15253/ RRID:AB_10977225 | WB (1:1000) |
| Antibody | Anti-Flag, (Rabbit polyclonal) | Sigma-Aldrich | Cat#: F7425/ RRID:AB_439687 | WB (1:1000) |
| Antibody | Anti-Flag, mouse (Mouse monoclonal) | Sigma-Aldrich | Cat#: F3165/ RRID:AB_259529 | WB (1:1000) |
| Antibody | Anti-APC ALI 12–28, (Mouse monoclonal) | Santa Cruz Biotechnology | Cat#: sc-53165/ RRID:AB_628734 | WB (1:1000) |
| Antibody | Anti-Axin1 C76H11, (Rabbit polyclonal) | Santa Cruz Biotechnology | Cat#: 2087/ RRID:AB_2274550 | WB (1:1000) |
| Antibody | Anti-GSK3β D5C5Z, (Rabbit polyclonal) | Cell Signaling Technology | Cat#: 12456/ RRID:AB_2636978 | WB (1:1000) |
| Antibody | Normal IgG, (Rabbit) | Cell Signaling Technology | Cat#: 2729/ RRID:AB_1031062 | WB (1:1000) |
| Antibody | IgG1 K isotype control (Mouse) | eBioscience | Cat#: 16-4714-81/ RRID:AB_470160 | IP (1:1000) |
| Antibody | Anti-mouse IgG-HRP (Goat) | Jackson ImmunoResearch | Cat#: 115-035-003/ RRID:AB_10015289 | WB (1:10,000) |
| Antibody | Anti-rabbit IgG-HRP (Goat) | Jackson ImmunoResearch | Cat#: 111-035-003/ RRID:AB_2313567 | WB (1:10,000) |
| Antibody | True Blot ULTRA Anti-mouse IgG-HRP | eBioscience | Cat#: 18-8817-33/ RRID:AB_2610851 | WB (1:5000) |
| Recombinant DNA reagent | pRL actin-Renilla | Nickles et al., 2012 | Renilla luciferase reporter | |
| Recombinant DNA reagent | pgl4.23 TCF4/Wnt-luciferase | Demir et al., 2013 | TCF4/Wnt-Firefly Luciferase reporter | |
| Recombinant DNA reagent | px459 | Mali et al., 2013 | RRID:SCR_002037 | Cloning of the sgRNA |
| Recombinant DNA reagent | px459sgCTNNB1 | This paper | See Materials and methods, Figure 1—figure supplement 1– sgRNA:TGACCTGTAAATCATCCTTT | |
| Recombinant DNA reagent | px459sgAPC#b | This study | See Materials and methods, Figure 7A sgRNA: TAGAACCAAATCCAGCAGA | |
| Recombinant DNA reagent | pSpCas9(BB)–2A-GFP (PX458) | Mali et al., 2013 | RRID:SCR_002037 | Control vector |
| Recombinant DNA reagent | pMK-RQ HA-FLAG-mClover-PGK-HygRHA | This study | Donor template, See Materials and methods, Figure 1—figure supplement 1 | |
| Recombinant DNA reagent | pMK-RQ HA-V5-mCherry-PGK-BRS-HA | This study | Donor template, See Materials and methods, Figure 1—figure supplement 1 | |
| Chemical compound, drug | CHIR99021 | Merck Millipore | 361571 | GSK-3β inhibitor |
| Chemical compound, drug | LGK974 | Hölzel Diagnostika | TRC-L397640-50mg | Porcupine inhibitor |
| Peptide, recombinant protein | Mouse Wnt3a | PeproTech | 315-20-10 | |
| Other | Triton X-100 | Sigma-Aldrich | T8787-250ml | |
| Other | NP-40 | Sigma-Aldrich | NP40S-100ml | |
| Other | GFP-(gta) magnetic beads/agarose | Chromotec | gtak-20gtma-20 | |
| Other | RFP-Trap(rta) magnetic beads/agarose | Chromotec | rta-20rtma-20 | |
| Commercial assay or kit | BCA Protein Assay Kit | Thermo Fisher Scientific | 23225 | |
| Other | 4–12% NuPAGE Bis-Tris gels | Thermo Fisher Scientific | NW04122BOX;NW00120BOX | |
| Other | 3–8% NuPAGE Tris acetate gels | Thermo Fisher Scientific | EA03752BOX | |
| Other | Nitrocellulose membranes | GE Healthcare | GE10600002 | |
| Commercial assay or kit | In-Fusion HD Cloning | Takara | 639650 | |
| Other | Dynabeads Protein G magnetic beads | Thermo Fisher Scientific | 10004D | |
| Other | ECL reagent | Merck Millipore | WBKLS0100 | |
| Other | ECL reagent | BiozolDiagnostica | MBL-JM-K820-500 | |
| Other | Hyperfilm ECL; 18×24 cm2 | Amersham/GE Healthcare | GE28-9068-36 | |
| Other | Puromycin | Sigma-Aldrich | P9620 | |
| Other | Hygromycin | Gibco/Thermo Fisher Scientific | 10687010 | |
| Other | Blasticidin | Life Technologies GmbH | R21001 | |
| Commercial assay or kit | DNeasy Blood & Tissue Kit | QIAGEN | 69504 | |
| Commercial assay or kit | RevertAid H Minus First Strand cDNA Synthesis Kit | Thermo Fisher Scientific/VWR | K1632 | |
| Commercial assay or kit | QIAfilter Plasmid Maxi Kit | QIAGEN | 12263 | |
| Commercial assay or kit | Qiagen RNeasy Mini Kit | QIAGEN | 12571 | |
| Other | McCoy | Life Technologies GmbH | 26600080 | |
| Commercial assay or kit | Light Cycler 480 Probes Master Mix QPCR | Roche | 4887301001 | |
| Other | Q5 Hot Start High-Fidelity DNA Polymerase | New England Biolabs | M0493S | |
| Other | dNTP Set 100 mM | VWR/Fermentas/Thermo Fisher Scientific | R0182 | |
| Commercial assay or kit | Light Cycler 480 Probes Master Mix QPCR | Roche | 4887301001 | |
| Other | PFA/ paraformaldehyde | VWR | 43,368.9 L | |
| Other | 4% paraformaldehyde in PBS | Santa Cruz Biotechnology | sc-281692 | |
| Other | VectashieldDAPI solution | Biozol Diagnostica | C-H-1200 | |
| Other | Hoechst 33342; trihydrochloride; trihydrate | Life Technologies GmbH | H1399 | |
| Other | BSA | Gerbu | 5010500 | |
| Other | PBS | Sigma-Aldrich | P3813-10PAK | |
| Other | Goat serum | Cell Signaling Technology | 5425S | |
| Other | Microscope slides 76×26 mm2 | Carl Roth GmbH | H868.1 | |
| Other | µ-Slide eight well | Ibidi | 80826 | |
| Sequence-based reagent | Universal probe library #011 | Roche/Sigma-Aldrich | 4685105001 | |
| Sequence-based reagent | Universal probe library #148 | Roche/Sigma-Aldrich | 04685148001 | |
| Sequence-based reagent | Universal probe library #152 | Roche/Sigma-Aldrich | 4694384001 | |
| Sequence-based reagent | Universal probe library #088 | Roche/Sigma-Aldrich | 4689135001 | |
| Sequence-based reagent | Universal probe library #060 | Roche/Sigma-Aldrich | 4688589001 | |
| Sequence-based reagent | Universal probe library #021 | Roche/Sigma-Aldrich | 4686942001 | |
| Sequence-based reagent | sgRNA used for targeting CTNNB1 (px459sgCTNNB1) | This paper | TGACCTGTAAATCATCCTTT | |
| Sequence-based reagent | sgRNA used for targeting APC(px459sgAPC#b) | This paper | TAGAACCAAATCCAGCAGA | |
| Software, algorithm | Adobe Photoshop CS6 | Adobe | RRID:SCR_014199 | |
| Software, algorithm | Adobe Illustrator CS6 | Adobe | RRID:SCR_010279 | |
| Software, algorithm | Adobe Affinity Designer | Adobe | RRID:SCR_016952 | |
| Software, algorithm | Fiji | PRID:SCR_002285 | ||
| Software, algorithm | ImageJ | RRID:SCR_003070 | ||
| Software, algorithm | Biorender | RRID:SCR_018361 | ||
| Software, algorithm | OriginPro | RRID:SCR_014212 | ||
| Software, algorithm | MATLAB | RRID:SCR_013499 | ||
| Other | Fibronectin | Sigma-Aldrich | F1141-5MG | |
| Other | DPBS | Gibco (ThermoFisher Scientific) | 14190-144 | |
| Other | 8-well Nunc Lab-Tek chambered cover glass | Thermo Fisher Scientific | 155411 (#1) | |
| Other | McCoy’s 5A - w/ L-Gln, w/o Phenol RedMcCoy’s 5AMedium w/ L-Glutamine w/o Phenol red and Sodium bicarbonate | GE Lifesciences/HyClone (Thermo Fisher Scientific)HIMEDIA (NeoLab) | SH30270.01/10358633AT179-5L | Sodiumbicar-bonate was added before sterile filtration |
| Other | Alexa 488 | Thermo Fisher Scientific | 10266262 | Reference dye |
| Other | Alexa 546 | Thermo Fisher Scientific | 10534783 | Reference dye |
| Other | Xfect | Takara ClonTech | 631318 | Transfection reagent |
| Sequence-based reagents | Primers (Supplementary files 5 and 6) | Eurofins | See Supplementary files 5 and 6 |
Additional files
-
Transparent reporting form
- https://cdn.elifesciences.org/articles/64498/elife-64498-transrepform1-v1.pdf
-
Supplementary file 1
p-values.
- https://cdn.elifesciences.org/articles/64498/elife-64498-supp1-v1.docx
-
Supplementary file 2
siRNAs.
- https://cdn.elifesciences.org/articles/64498/elife-64498-supp2-v1.docx
-
Supplementary file 3
Antibodies.
- https://cdn.elifesciences.org/articles/64498/elife-64498-supp3-v1.docx
-
Supplementary file 4
Plasmids.
- https://cdn.elifesciences.org/articles/64498/elife-64498-supp4-v1.docx
-
Supplementary file 5
Primers for qPCR.
- https://cdn.elifesciences.org/articles/64498/elife-64498-supp5-v1.docx
-
Supplementary file 6
Oligonucleotides.
- https://cdn.elifesciences.org/articles/64498/elife-64498-supp6-v1.docx
Download links
A two-part list of links to download the article, or parts of the article, in various formats.
Downloads (link to download the article as PDF)
Open citations (links to open the citations from this article in various online reference manager services)
Cite this article (links to download the citations from this article in formats compatible with various reference manager tools)
Allele-specific endogenous tagging and quantitative analysis of β-catenin in colorectal cancer cells
eLife 11:e64498.
https://doi.org/10.7554/eLife.64498


