A fusion peptide in preS1 and the human protein disulfide isomerase ERp57 are involved in hepatitis B virus membrane fusion process
- CIRI – Centre International de Recherche en Infectiologie, Univ Lyon, Université Claude Bernard Lyon 1, Inserm, U1111, CNRS, UMR5308, ENS Lyon, France
- Sorbonne Université, CNRS, IBPS, Laboratoire de Biologie Computationnelle et Quantitative (LCQB) - UMR 7238, France
- Sorbonne Université, Institut des Sciences du Calcul et des Données (ISCD), France
- Cancer Research Center of Lyon (CRCL), UMR Inserm 1052 - CNRS 5286 - Université Lyon 1 - Centre Léon Bérard, France
- Molecular Microbiology and Structural Biochemistry, UMR5086 CNRS-Université Lyon 1, France
Figures
Figure 1 with 4 supplements
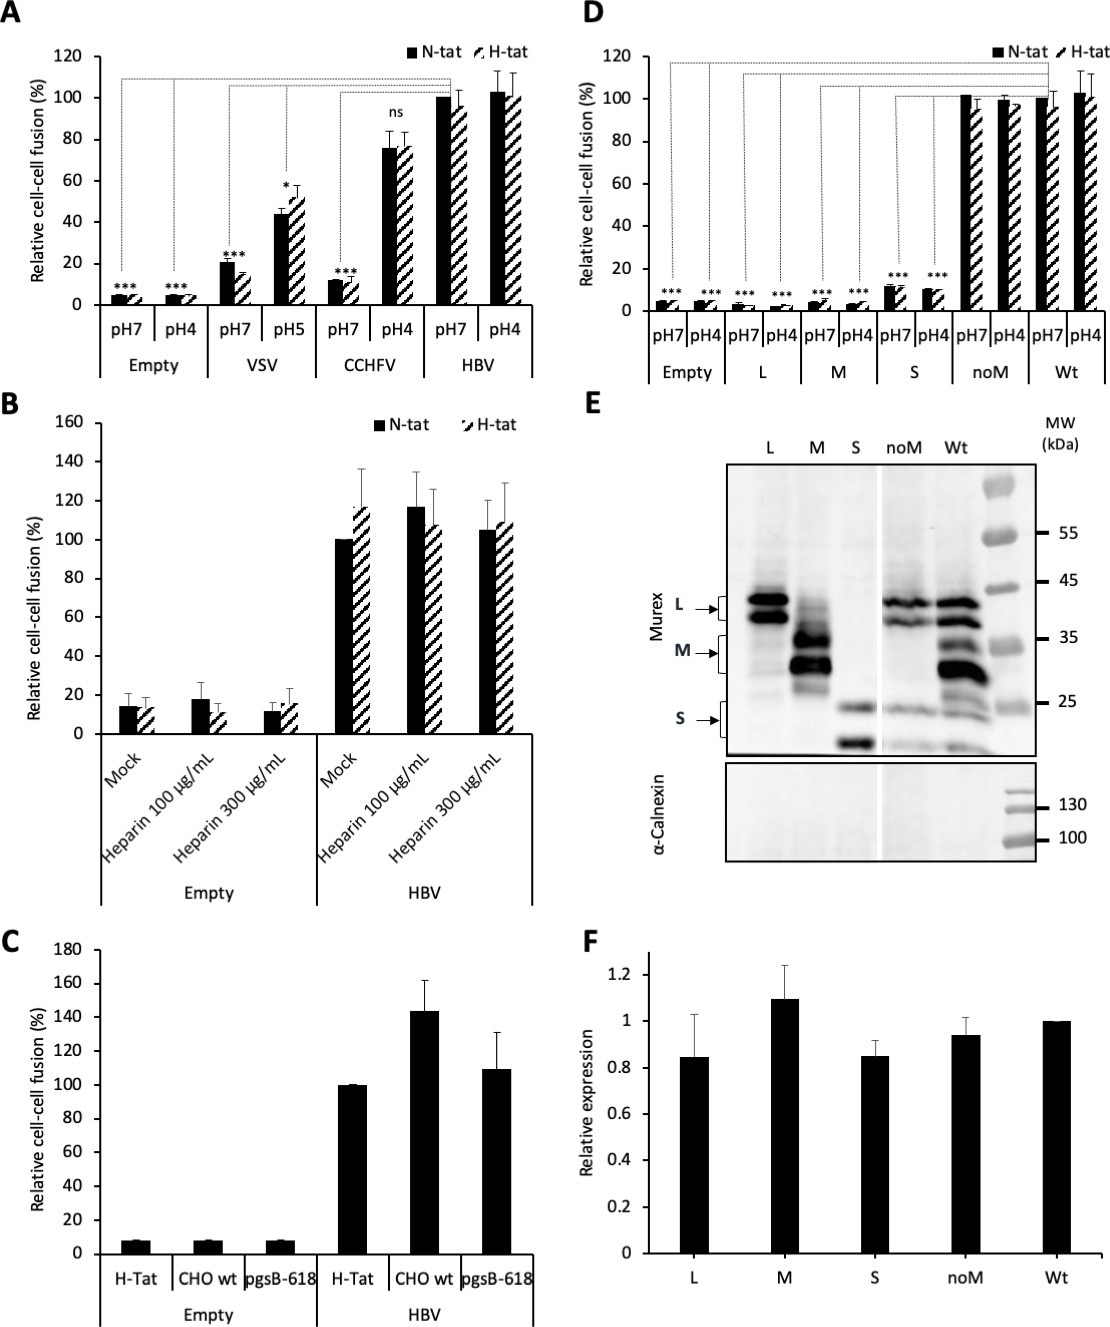
HBV GP fusion trigger is independent of acidic pH, HSPG, and NTCP.
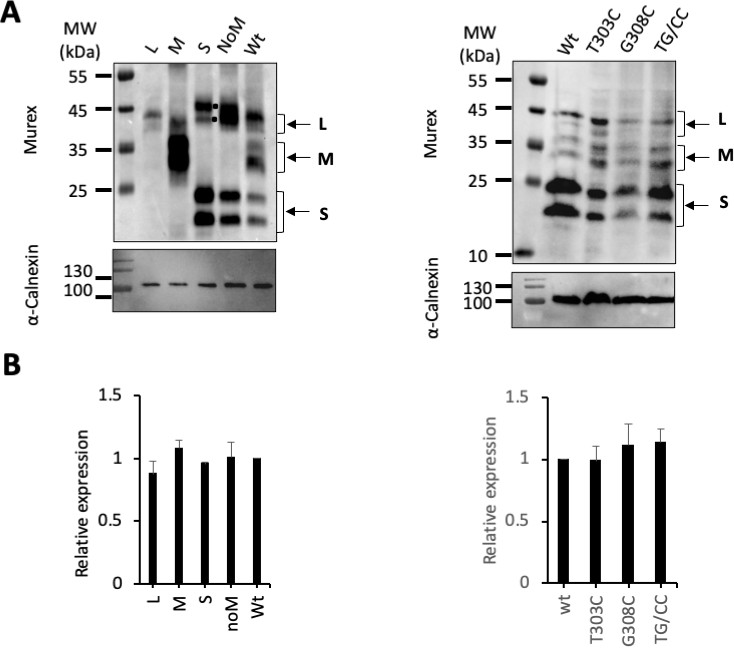
(A) Huh7 ‘donor’ cells transfected with the pT7HB2.7 plasmid allowing expression of hepatitis B virus glycoproteins (HBV GPs) (HBV) and a luciferase marker gene driven by the HIV-1 promoter were co-cultured with either Huh7-tat (H-tat) or Huh7-NTCP-tat (N-tat) ‘indicator’ cells that express the HIV Tat protein. After 24 hr of co-culture, the cells were treated at pH 4 (or pH 5 for VSV-G) vs pH 7 for 3 min. The luciferase activity induced by fusion between donor and indicator cells was then measured 24 hr later. A control plasmid that does not allow GP expression (Empty) was used to determine the background of luciferase expression. The Crimean-Congo hemorrhagic fever virus (CCHFV) Gn/Gc (CCHFV) or vesicular stomatitis virus-G (VSV-G) (VSV) GPs were used as positive controls for fusion at low pH. Fusion mediated by HBV GPs with Huh7-tat cells was taken as 100%. The bars represent the means (N = 3). Error bars correspond to standard deviation. See the raw data of individual experiments in Figure 1—figure supplement 1. (B) Results of cell-cell fusion assays performed as described above in the presence of heparin at the indicated concentrations throughout the co-culture. No cytotoxicity could be detected in these conditions (Figure 1—figure supplement 2). The graphs represent the average of two independent experiments. Fusion mediated by HBV GPs with mock-treated Huh7 cells was taken as 100%. (C) CHO ‘donor’ cells transfected with the pT7HB2.7 plasmid and a luciferase marker gene driven by the HIV-1 promoter were co-cultured with either Huh7-tat (H-tat), CHO-tat (CHO wild-type [wt]), or CHO-pgsB618-tat (pgsB618) ‘indicator’ cells that express the HIV Tat protein. The luciferase activity induced by fusion between donor and indicator cells was then measured 24 hr later. A control plasmid that does not allow GP expression (Empty) was used to determine the background of luciferase expression. Fusion mediated by HBV GPs with Huh7-tat was taken as 100%. The graphs represent the average of two independent experiments. (D) Huh7 ‘donor’ cells transfected with plasmids allowing expression of L, M, or S HBV GPs alone, both L and S GPs (noM), or all HBV GPs (Wt) and a luciferase marker gene driven by the HIV-1 promoter were co-cultured with Huh7-tat or Huh7-NTCP-tat ‘indicator’ cells that express HIV Tat protein. Cell co-cultures were then processed as described above to determine cell-cell fusion activity. Fusion mediated by HBV GP at pH 7 with Huh7-tat cells was taken as 100%. The bars represent the means (N = 3). Error bars correspond to standard deviation. (E) Detection of HBV GPs at the cell surface by biotinylation. Transfected Huh7 cells were biotinylated for 30 min at 4°C and then processed biochemically. Cell lysates were subjected to streptavidin pull-down prior to western blot analysis using anti-HBsAg antibody (Murex). The molecular weight markers (kDa) are shown on the right. Calnexin detection was used as control for the cytoplasmic protein marker, showing the integrity of cell membrane, as shown in this representative western blot. (F) Relative GP expression at the cell surface as compared to Wt, quantified by adding the L+M+S signals from western blot analyses. The results are expressed as mean ± SD (N = 3). No statistical differences could be found using the Mann-Whitney test (p-value>0.05). See also the quantification of total HBV GP expression in Figure 1—figure supplement 4.
-
Figure 1—source data 1
HBV GP fusion trigger is independent of acidic pH and NTCP.
The values correspond to the data expressed in the graphs displayed in Figure 1A, D and F.
- https://cdn.elifesciences.org/articles/64507/elife-64507-fig1-data1-v2.xlsx
-
Figure 1—source data 2
HBV GP fusion trigger is independent of acidic pH and NTCP.
These images are of the original and uncropped gels that correspond to the blots displayed in Figure 1E. The vertical bars correspond to samples that are not described in the 'Results' section.
- https://cdn.elifesciences.org/articles/64507/elife-64507-fig1-data2-v2.xlsx
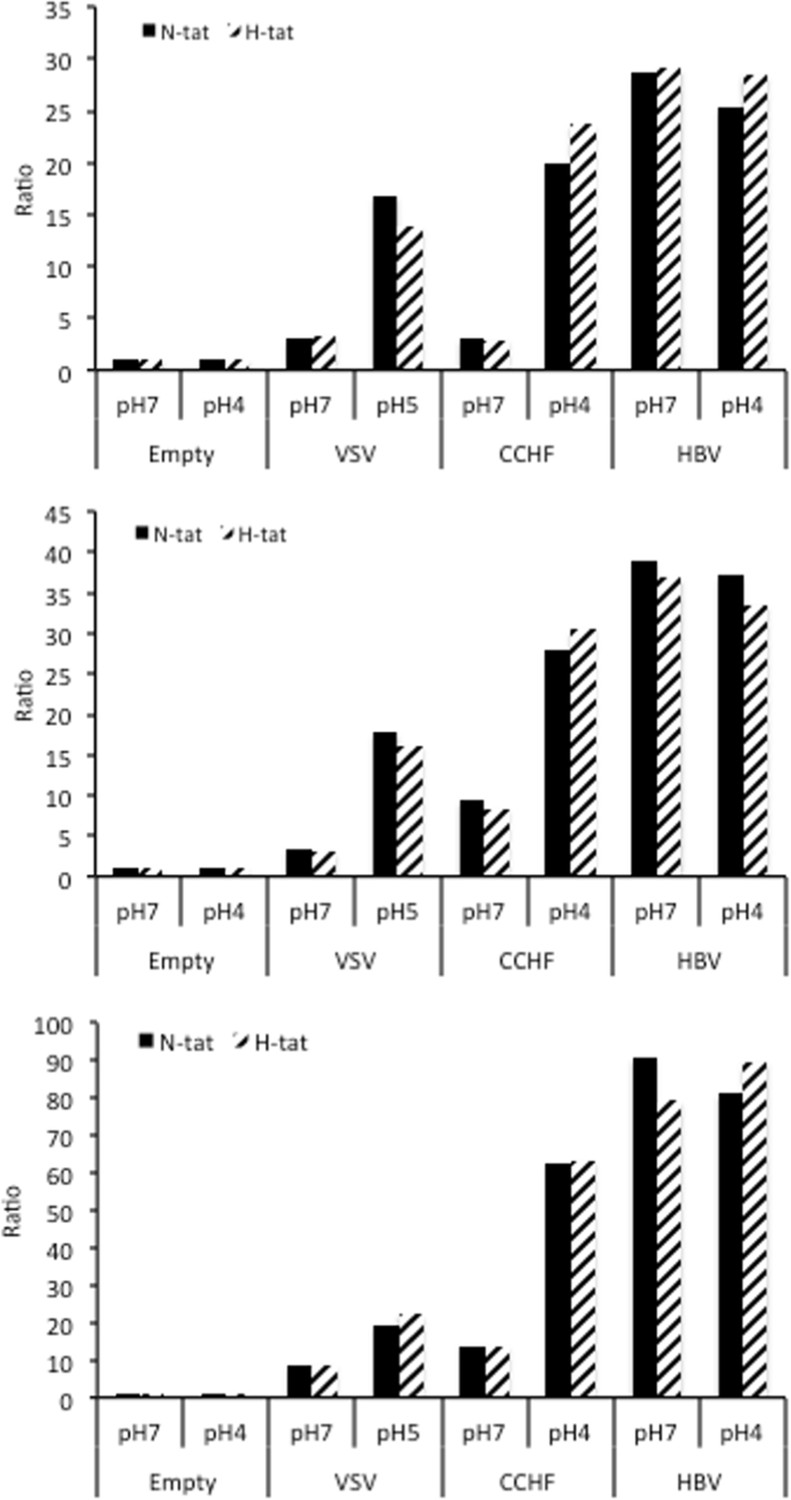
Figure 1—figure supplement 1
HBV GP fusion trigger is independent of acidic pH and NTCP.
Huh7 ‘donor’ cells transfected with the pT7HB2.7 plasmid allowing expression of hepatitis B virus glycoproteins (HBV GPs) (HBV) and a luciferase marker gene driven by the HIV-1 promoter were co-cultured with either Huh7-tat (H-tat) or Huh7-NTCP-tat (N-tat) ‘indicator’ cells that express the HIV Tat protein. After 24 hr of co-culture, the cells were treated at pH 4 (or pH 5 for vesicular stomatitis virus-G [VSV-G]) vs pH 7 for 3 min. The luciferase activity induced by fusion between donor and indicator cells was then measured 24 hr later. A control plasmid that does not allow GP expression (Empty) was used to determine the background of luciferase expression. The Crimean-Congo hemorrhagic fever virus (CCHFV) Gn/Gc (CCHFV) or VSV-G GPs (VSV) were used as positive controls for fusion at low pH. Results are from three independent experiments expressed as ratios of luciferase activities of the different conditions relative to those of the control conditions.
Figure 1—figure supplement 2
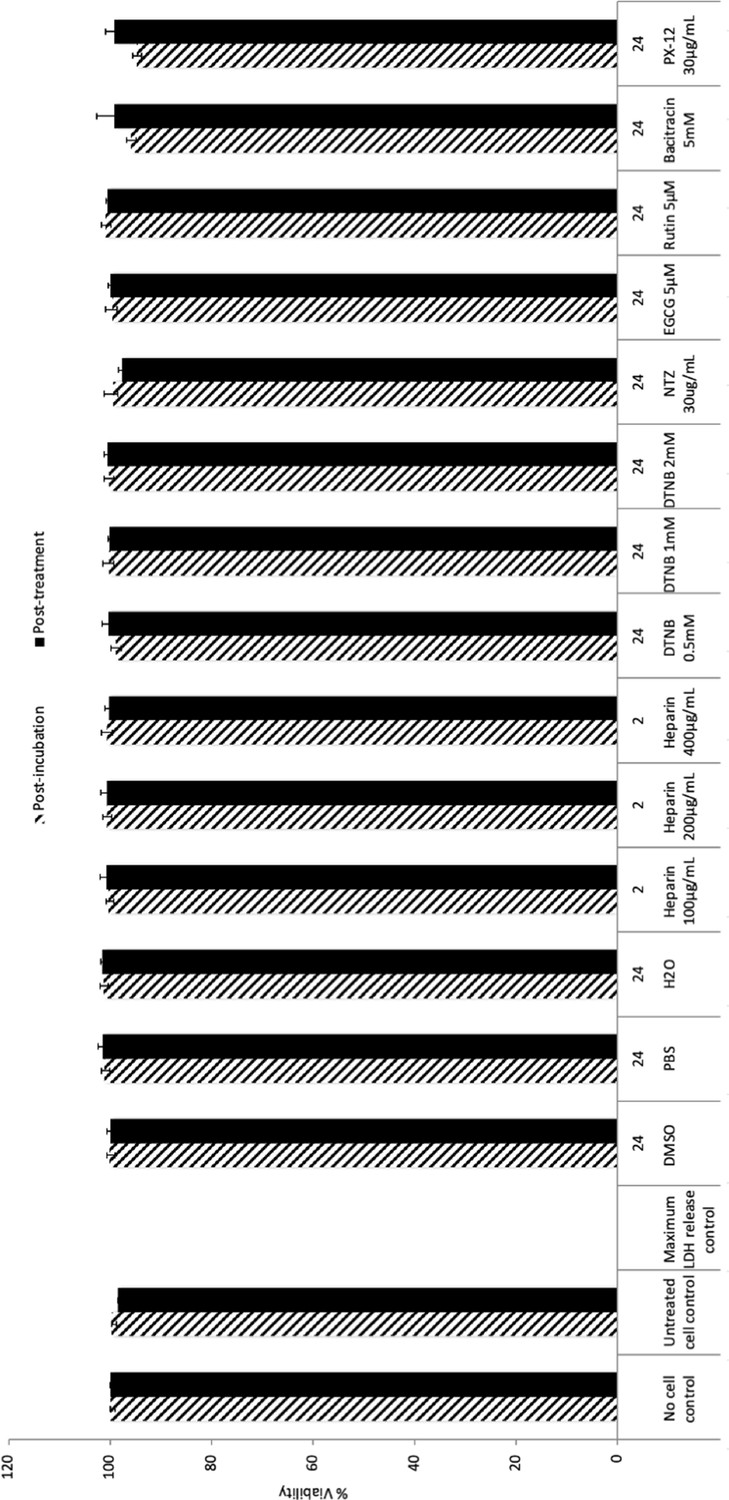
Results of cell survival after drug treatments.
The indicated drugs were used as described in Figure 1B (heparin), Figure 3 (DNTB), and Figure 6 (NTZ, EGCG, rutin, bacitracin, and PX-12). Cell supernatants were collected immediately after treatment (post-treatment) or after a further incubation at 37°C of the treated cells (post-incubation). Cell toxicity assessment was performed with lactate dehydrogenase (LDH) (CytoTox-ONE; Promega) using the indicated positive and negative controls of the kit. Error bars correspond to standard deviations.
Figure 1—figure supplement 3
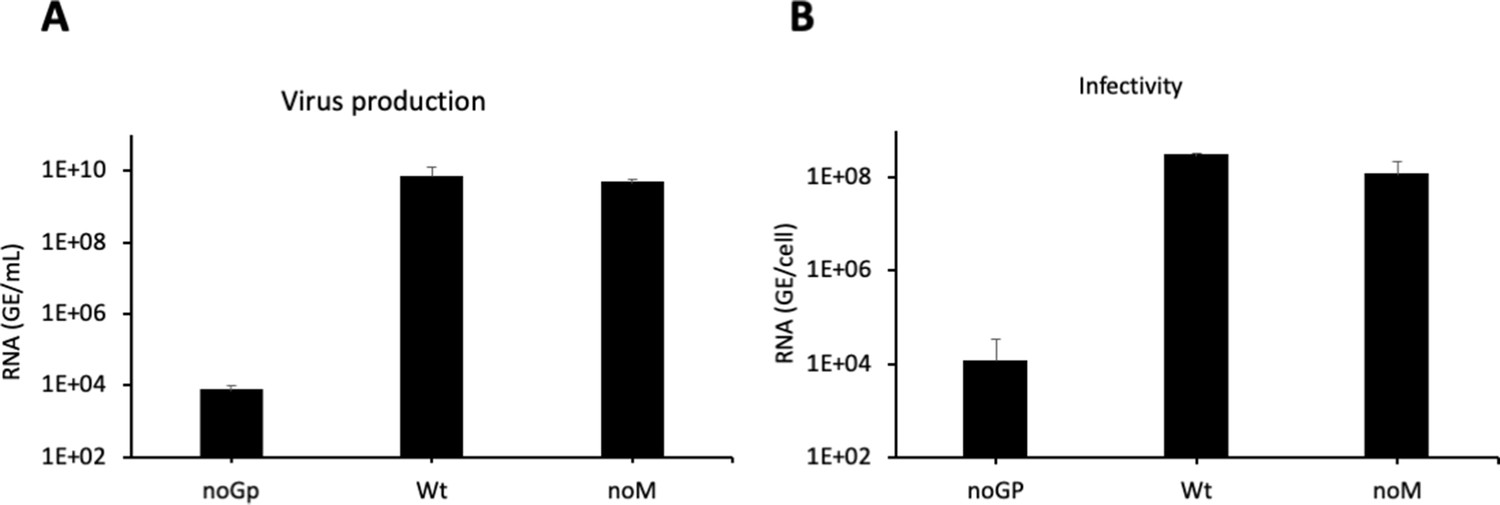
Characterization of ‘noM’ HDV particles.
(A) Huh7 cells were co-transfected with pSVLD3 plasmid coding for hepatitis delta virus (HDV) ribonucleoprotein (RNP) and with plasmids encoding either the wild-type (wt) hepatitis B virus glycoproteins (HBV GPs) (Wt) or only L and S (noM). As control, pSVLD3 was co-transfected with an empty plasmid (referred to as ‘noGP’). At day 9 post-transfection, the cell supernatants were harvested and filtered, and the extracellular RNA was extracted and purified before quantifying HDV RNAs by quantitative reverse transcription PCR (RTqPCR). HDV RNA levels in GE (genome equivalent) are expressed as means ± SD (N = 4) per ml of cell supernatants. (B) HDV or noM particles were used to infect Huh7-NTCP cells, which were grown for 7 days before total intracellular RNA was purified. The results of HDV RNA quantification by RTqPCR are expressed after normalization with glyceraldehyde 3-phosphate dehydrogenase (GAPDH) RNAs as means ± SD (N = 4) per ml of cell lysates containing 106 cells.
Figure 1—figure supplement 4
Total protein expression.
(A) Cell lysates of Huh7 cells expressing the indicated wild-type (wt) or mutant glycoproteins (GPs) from Figure 1 (left) and Figure 5 (right) were subjected to western blot analysis, using anti-HBsAg antibody (Murex). The molecular weight markers (kDa) are shown on the left. Calnexin detection was used as control for the cytoplasmic protein marker, as shown in these representative western blots. The black dots indicate dimers of S, as described in the literature (Huovila et al., 1992), which are formed in the pre-Golgi compartment. (B) Relative GP expression compared to Wt, quantified from western blots using anti-HBsAg antibody. The results are expressed as mean ± SD (N = 3).
Figure 2 with 2 supplements
Functional analysis of predicted HBV fusion peptides.
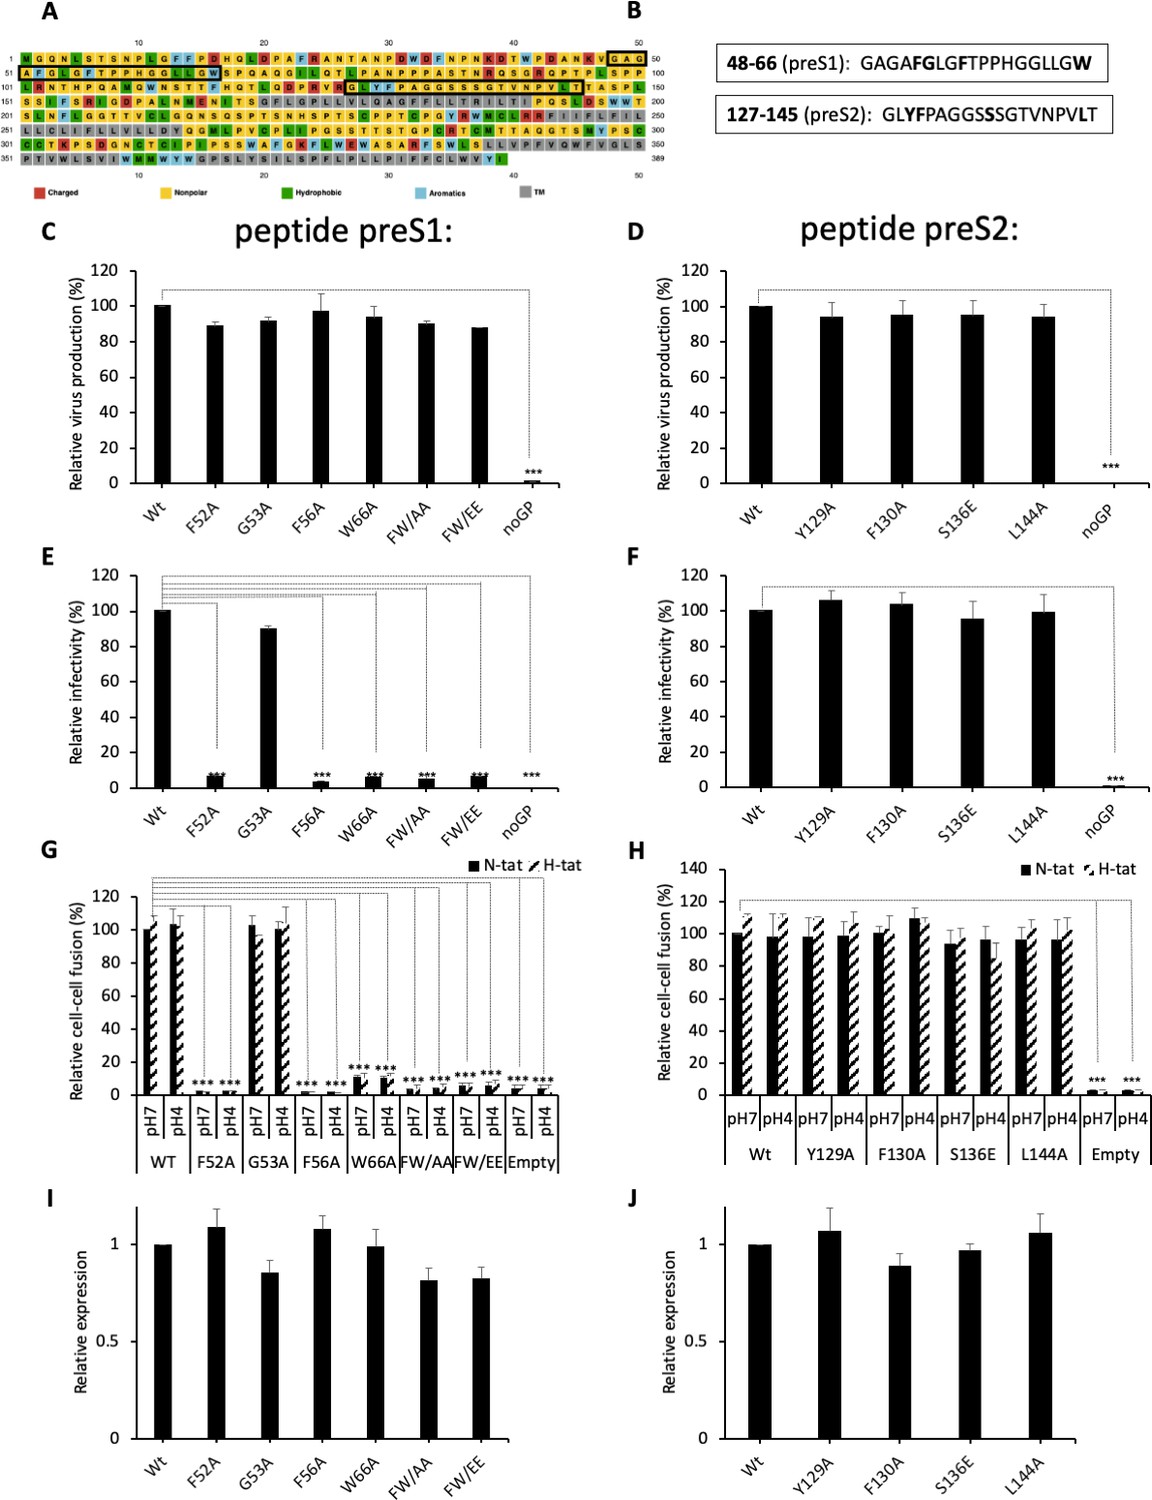
(A) Sequence of hepatitis B virus (HBV) L protein showing the amino acid color code and boxes for the localization of the two predicted fusion peptides in preS1 and in preS2. (B) Sequences of the two predicted fusion peptides showing the positions that were mutated (bold). (C, D) Huh7 cells were co-transfected with pSVLD3 plasmid coding for hepatitis delta virus (HDV) RNPs and plasmids coding for wild-type (wt) or mutant HBV glycoproteins (GPs). The FW/AA and FW/EE are double-alanine mutants at positions F52 and W66. As control, pSVLD3 was co-transfected with an empty plasmid (referred to as ‘noGP’). At day 9 post-transfection, the cell supernatants were harvested and filtered, and the extracellular RNA was extracted and purified before quantifying HDV RNAs by quantitative reverse transcription PCR (RTqPCR). HDV RNA levels in GE (genome equivalent) are expressed as means ± SD (N = 3) per ml of cell supernatants. (E, F) HDV particles were used to infect Huh7-NTCP cells, which were grown for 7 days before total intracellular RNA was purified. The results of HDV RNA quantification by RTqPCR are expressed after normalization with glyceraldehyde 3-phosphate dehydrogenase (GAPDH) RNAs as means ± SD (N = 3) per ml of cell lysates containing 106 cells. (G, H) Huh7 ‘donor’ cells co-expressing wt or mutant HBV GPs and a luciferase marker gene driven by the HIV-1 promoter were co-cultured with either Huh7-tat (H-tat) or Huh7-NTCP-tat (N-tat) ‘indicator’ cells that express HIV Tat protein. After 24 hr, the cells were treated at pH 4 or pH 7 for 3 min. The luciferase activity induced by the fusion between the donor and indicator cells was measured 24 hr later. Fusion mediated by wt GP at pH 7 with Huh7-NTCP-tat cells was taken as 100%. The bars represent the means (N = 5). Error bars correspond to standard deviations. (I, J) Quantification of wt and mutant GPs at cell surface by western blot analyses (see examples in Figure 2—figure supplement 2). The results show the relative GP expression of preS1 (I) and preS2 (J) mutants compared to Wt, as indicated, and are expressed as means ± SD (N = 3). No statistical differences could be found using the Mann-Whitney test (p-value>0.05).
-
Figure 2—source data 1
Functional analysis of predicted HBV fusion peptides.
The values correspond to the data expressed in the graphs displayed in Figure 2C, D, E, F, I and J.
- https://cdn.elifesciences.org/articles/64507/elife-64507-fig2-data1-v2.xlsx
-
Figure 2—source data 2
Functional analysis of predicted HBV fusion peptides.
The values correspond to the data expressed in the graphs displayed in Figure 2G.
- https://cdn.elifesciences.org/articles/64507/elife-64507-fig2-data2-v2.xlsx
-
Figure 2—source data 3
Functional analysis of predicted HBV fusion peptides.
The values correspond to the data expressed in the graphs displayed in Figure 2H.
- https://cdn.elifesciences.org/articles/64507/elife-64507-fig2-data3-v2.xlsx
Figure 2—figure supplement 1
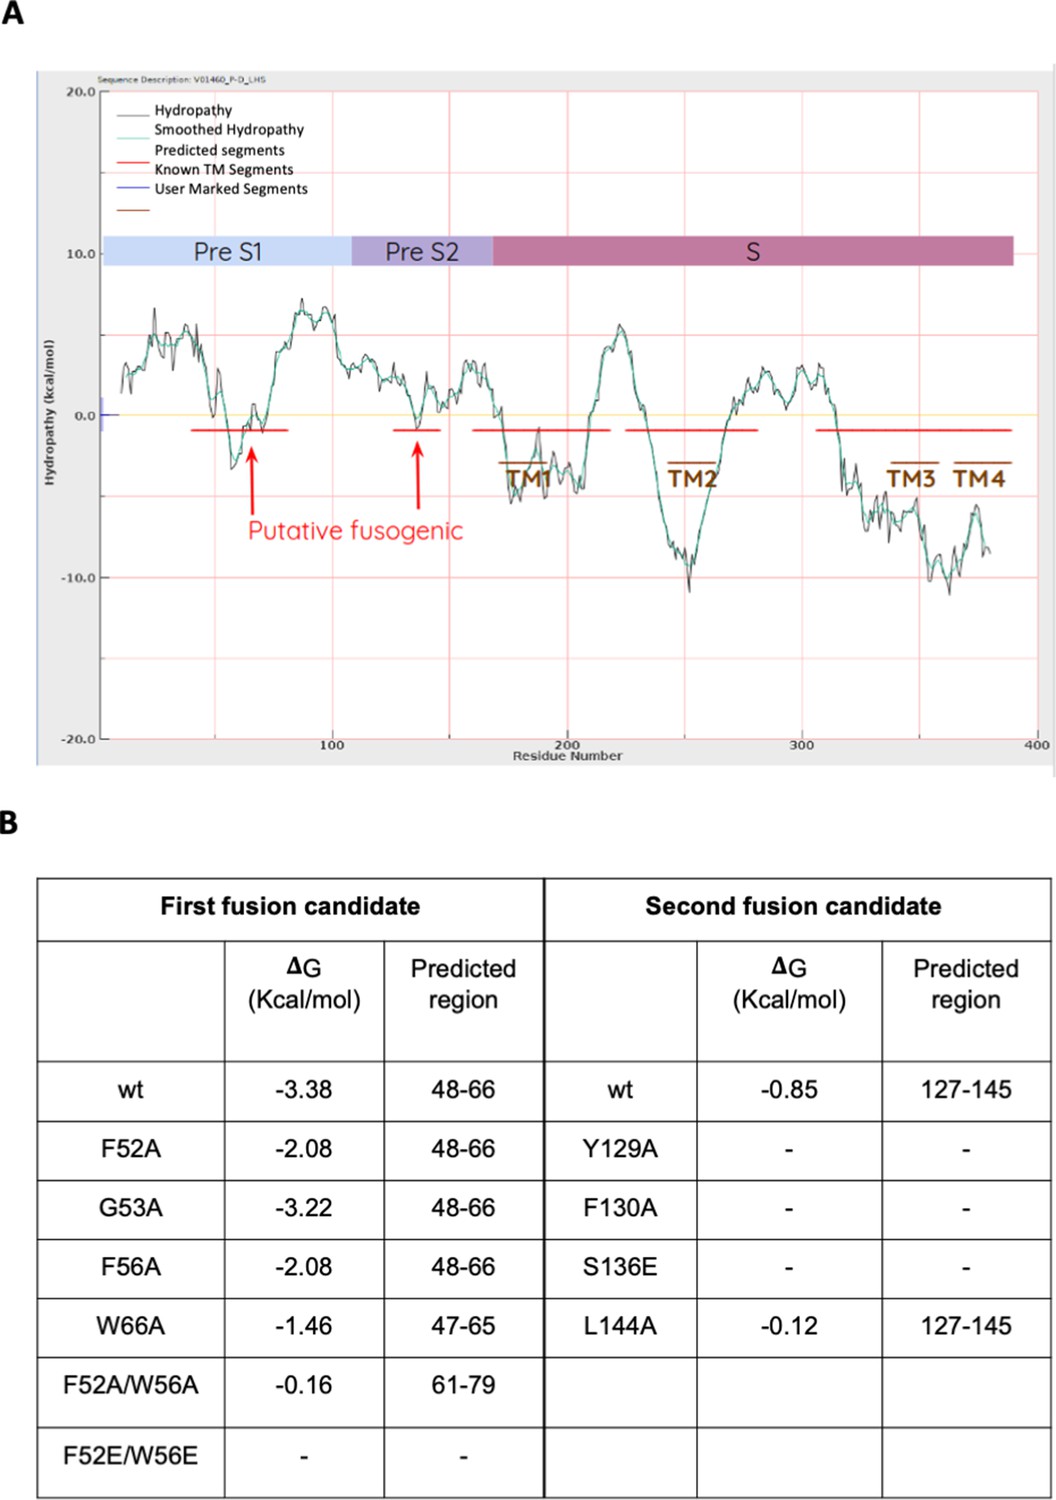
Prediction of fusion peptides within S protein by using Wimley-White interfacial hydrophobicity scale.
(A) The hydropathy profile (black curve) and its smoothed approximation (green curve). The interface scale measures a residue’s free energy of transfer within an unfolded polypeptide chain, from water to a phosphocholine bilayer. The five predicted regions with high propensity to interact with the lipid surface of the cell membrane are indicated with horizontal red bars, and the four putative transmembrane regions are indicated with horizontal brown bars. The two regions indicated with red arrows were considered as putative fusogenic peptides. The preS1, preS2, and S regions are represented above the curve. (B) Impact of mutations in predicted putative fusogenic segments. The table reports the Gibbs free energy (ΔG) of the two presumed fusogenic segments computed for wild-type (wt) and mutants. A negative ΔG indicates that a peptide is favored for partitioning from water to lipid bilayer, so it may be suspected as fusogenic. A dash indicates that the region is no longer expected to interact with the lipid bilayer and hence is fusogenic.
Figure 2—figure supplement 2
Cell-surface and intracellular detection of preS1 and preS2 HBV GP mutants.
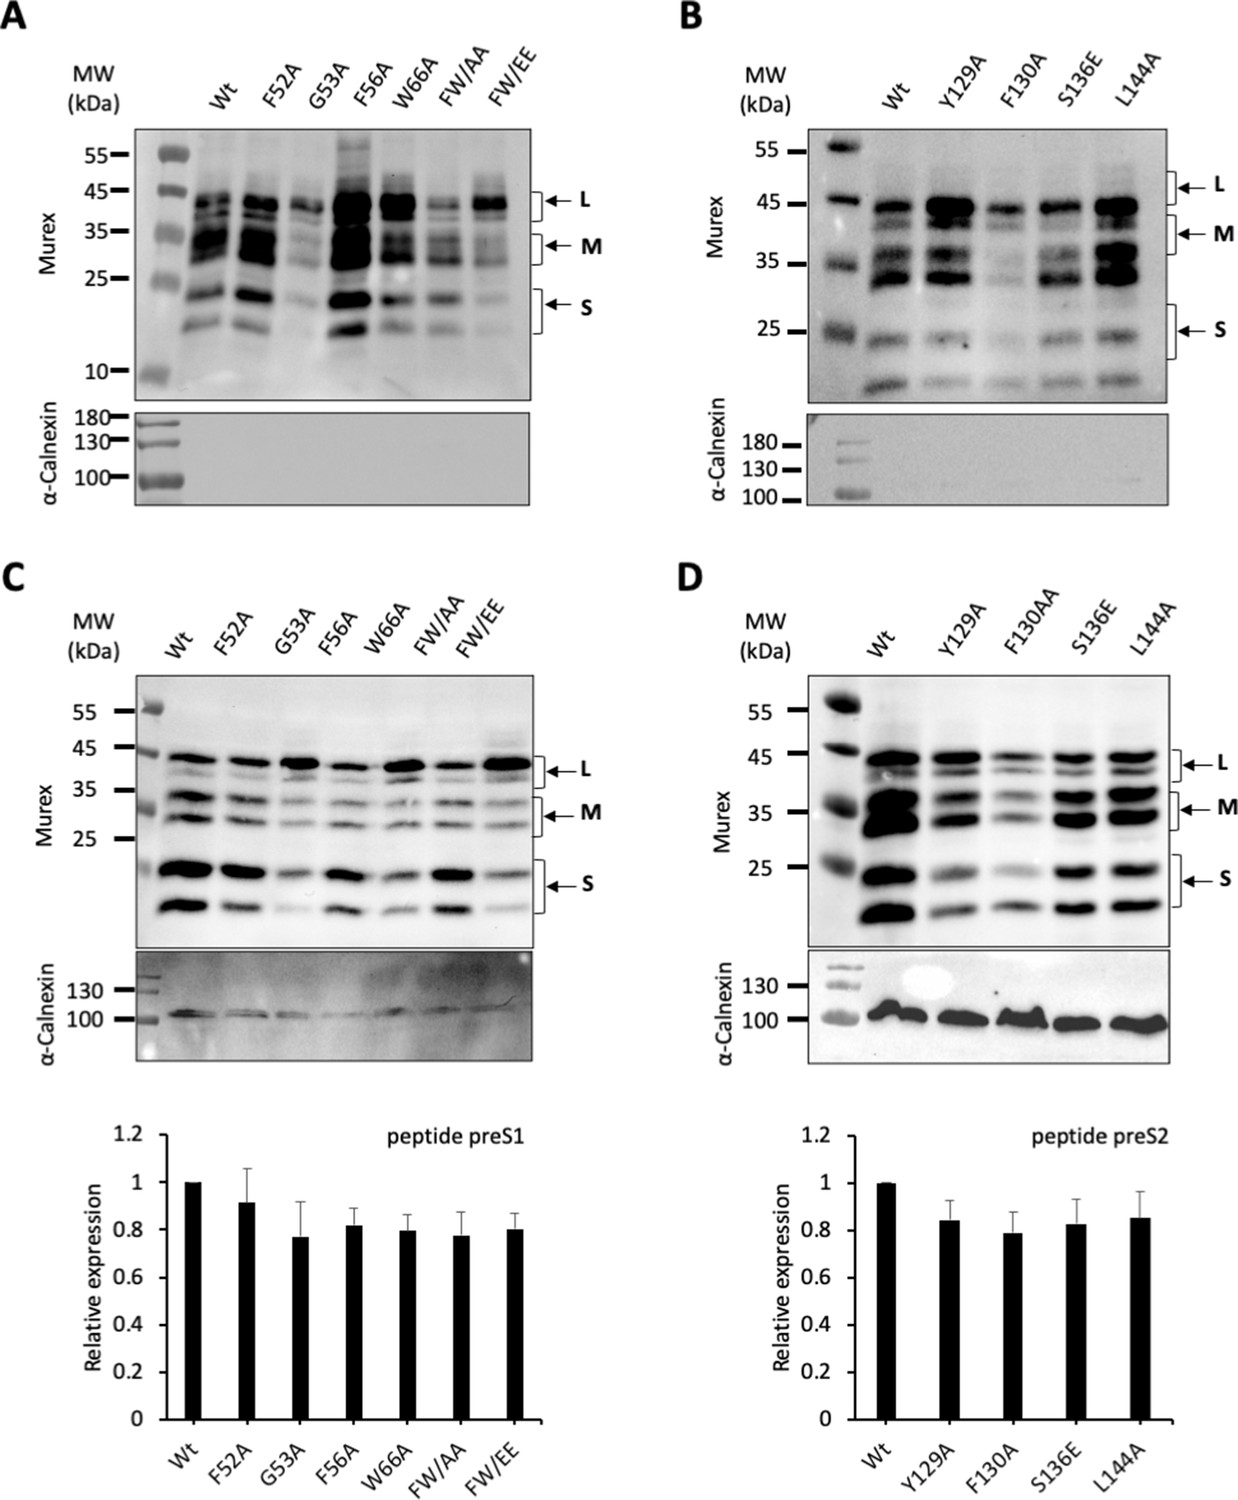
(A, B) Huh7 cells expressing wild-type (wt) or mutant hepatitis B virus glycoproteins (HBV GPs) from Figure 2 were biotinylated for 30 min at 4°C and then processed biochemically. Cell lysates were subjected to streptavidin pull-down prior to western blot analysis using anti-HBsAg antibody (Murex). The molecular weight markers (kDa) are shown on the left. Calnexin detection was used as control for the cytoplasm protein marker, showing the integrity of the cell membrane. (C, D) Detection and quantification of total GP expression. Cell lysates of Huh7 cells expressing the indicated wt or mutant GPs from Figure 2 were subjected to western blot analysis using anti-HBsAg antibody (Murex). The molecular weight markers (kDa) are shown on the left. Calnexin detection was used as control for the cytoplasmic protein marker, as shown in these representative western blots. The results show the relative GP expression compared to Wt of preS1 (C) and preS2 mutants (D), as indicated, and are expressed as mean ± SD (N = 3).
Figure 3 with 1 supplement
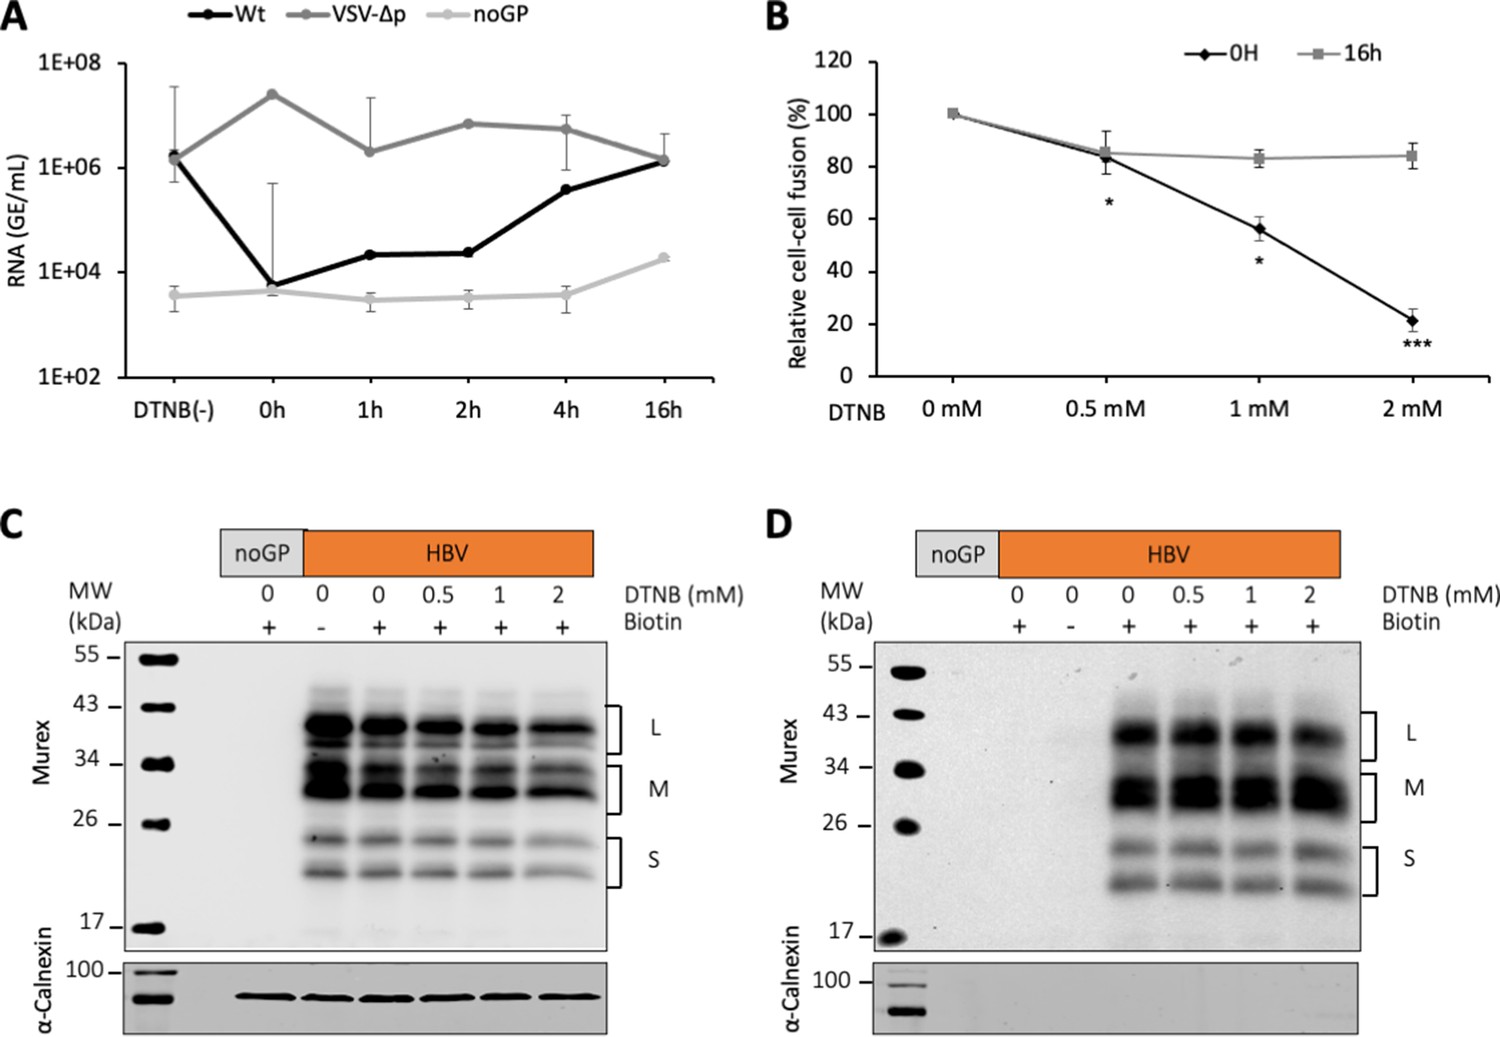
DTNB, a thiol-specific oxidizing reagent, inhibits HBV membrane fusion.
(A) 5,5-Dithiobis(2-nitrobenzoic acid) (DTNB) (2 mM) was added to the cell supernatant containing hepatitis delta virus (HDV) particles at the onset of infection (0 hr) or at the indicated times post-infection and was removed 8 hr later. VSV-∆p, that is, HDV particles generated with vesicular stomatitis virus-G glycoprotein (VSV-G GP) rather than hepatitis B virus (HBV), were used as the control for a virus entry process that is not affected by DNTB. As a negative control, pSVLD3 was co-transfected with an empty plasmid (referred to as ‘noGP’). At 7 days post-infection, HDV RNAs were extracted from infected cells and quantified by quantitative reverse transcription PCR (RTqPCR). The results are expressed after normalization with glyceraldehyde 3-phosphate dehydrogenase (GAPDH) RNAs as means ± SD (N = 3) per ml of cell lysates containing 106 cells. The results of infection in the absence of DTNB are shown (DTNB(-)). (B) Huh7 ‘donor’ cells co-expressing HBV GPs and a luciferase marker gene driven by the HIV-1 promoter were co-cultured with Huh7-NTCP-tat ‘indicator’ cells that express HIV Tat protein. Different concentrations of DTNB were added at 0 hr vs at 16 hr after initiating the cell co-culture, as indicated. No cytotoxicity could be detected in these conditions (Figure 1—figure supplement 2). The luciferase activity induced by fusion between donor and indicator cells was then measured 24 hr later. Fusion mediated by HBV GPs without DTNB was taken as 100%. The graphs represent the average of four independent experiments. (C, D) Huh7 cells transfected with pUC19 (noGP) or the pT7HB2.7 (HBV) plasmids were incubated with dimethyl sulfoxide (DMSO) (0) or increasing doses of DTNB (0.5, 1, and 2 mM) for 16 hr prior to incubation with biotin for 30 min at 4°C. Biotin was omitted from one sample (-) and served as a negative control for non-specific binding of proteins to streptavidin. Cells were subsequently lysed and the biotinylated surface proteins were captured by streptavidin agarose. Total (C) and biotin-labeled proteins (D) were then analyzed by western blot using anti-HBsAg (Murex) and anti-calnexin antibodies. Calnexin detection was used as a control for the cytoplasmic protein marker, showing the integrity of the cell membrane, as shown in these representative western blots. The molecular weight markers (kDa) are shown on the left.
-
Figure 3—source data 1
DTNB, a thiol-specific oxidizing reagent, inhibits HBV membrane fusion.
The values correspond to the data expressed in the graphs displayed in Figure 3A and B.
- https://cdn.elifesciences.org/articles/64507/elife-64507-fig3-data1-v2.xlsx
-
Figure 3—source data 2
DTNB, a thiol-specific oxidizing reagent, inhibits HBV membrane fusion.
These images are of the original and uncropped gels that correspond to the blots displayed in Figure 3C.
- https://cdn.elifesciences.org/articles/64507/elife-64507-fig3-data2-v2.xlsx
-
Figure 3—source data 3
DTNB, a thiol-specific oxidizing reagent, inhibits HBV membrane fusion.
These images are of the original and uncropped gels that correspond to the blots displayed in Figure 3D.
- https://cdn.elifesciences.org/articles/64507/elife-64507-fig3-data3-v2.xlsx
Figure 3—figure supplement 1
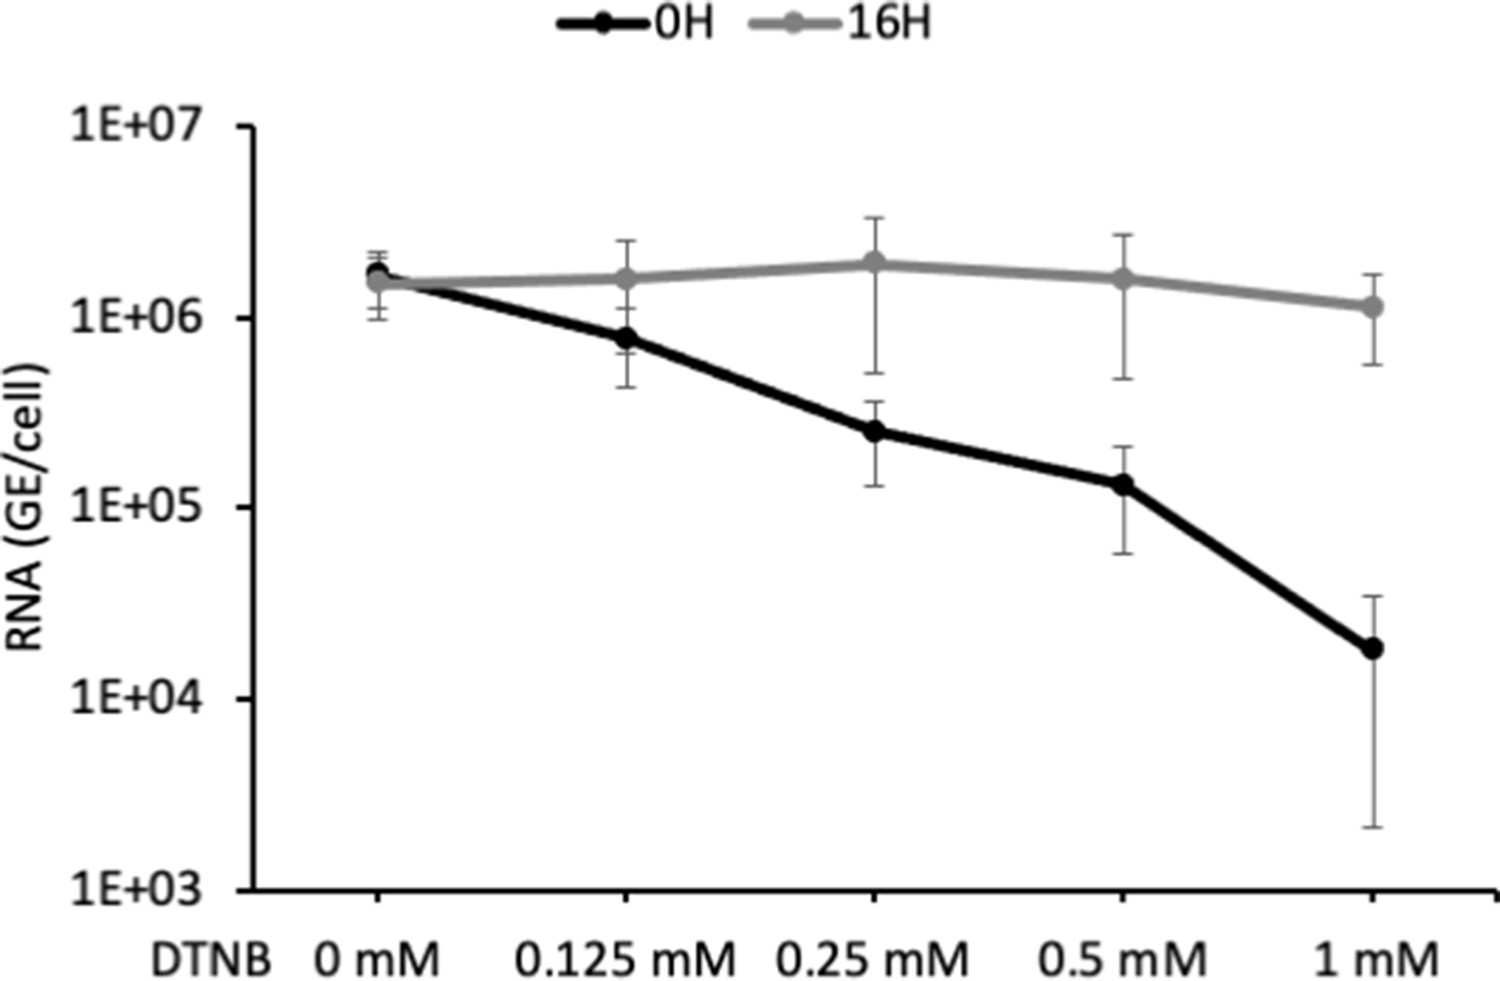
Effect of DTNB on HDV entry.
Different concentrations of 5,5-dithiobis(2-nitrobenzoic acid) (DTNB) were added to the cell supernatant containing hepatitis delta virus (HDV) particles at the onset of infection (0 hr) or at 16 hr post-infection. At 7 days post-infection, virus HDV RNAs from cells were extracted and quantified by quantitative reverse transcription PCR (RTqPCR). The results are expressed after normalization with glyceraldehyde 3-phosphate dehydrogenase (GAPDH) RNAs as means ± SD (N = 3) per ml of cell lysates containing 106 cells.
Figure 4 with 2 supplements
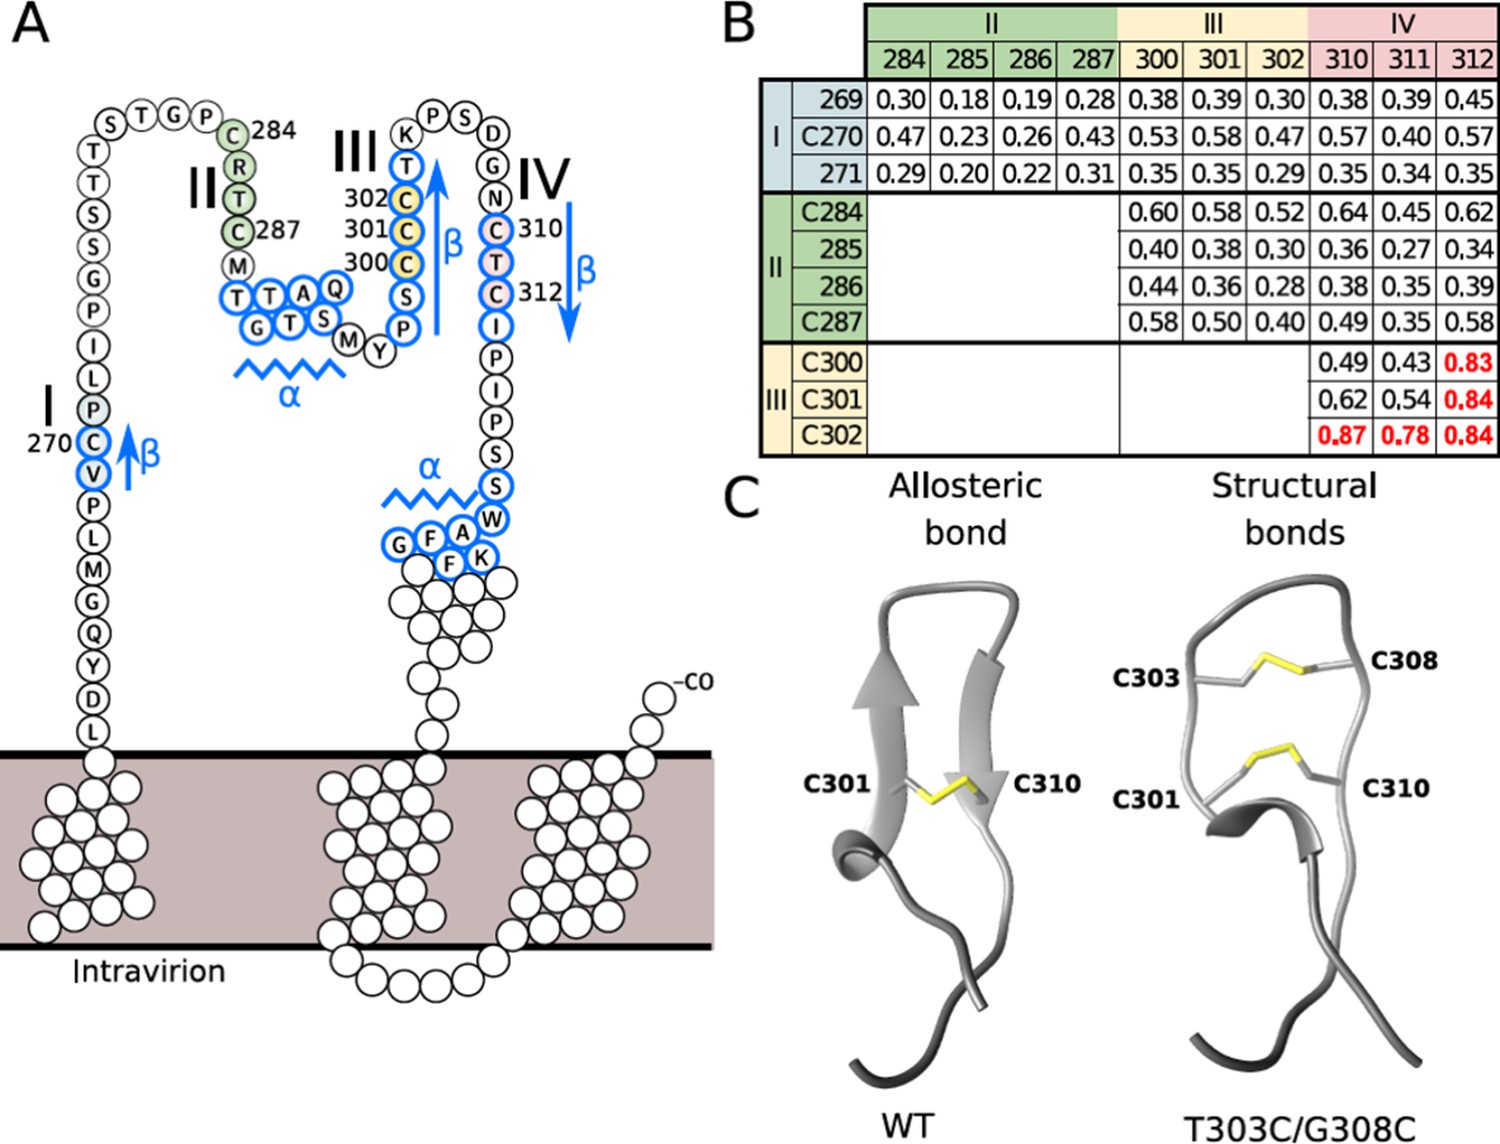
Disulfide conformation models.
(A) Cysteine-rich regions on the ‘a’ determinant (residues 261–324) of the hepatitis B virus S glycoprotein (HBV S GP). Four subregions that are rich in cysteine are colored: I (blue), II (green), III (yellow), and IV (red). Jpred secondary structure prediction different from random-coil is indicated: β-strand (arrows) and α-helix (zigzag lines). (B) Probability of contacts predicted by RaptorX between the four cysteine-rich regions. The probabilities higher than 0.7 are highlighted in red (see also Figure 4—figure supplement 1). (C) Predominant disulfide conformations obtained by molecular dynamics simulation of the modeled 294–317 region of the HBV surface protein. Note that the ß-strand on the wild-type (wt) sequence (left) adopts a loop conformation with an allosteric disulfide conformer between the C301-C310 bond, which is specifically classified as a -/+RH Hook conformation. The T303C/G308C double mutant (right) may generate an additional disulfide bond, resulting in two structural disulfides of +/-RH Staple and -/+LH Spiral conformations that form the C301-C310 and C303-C308 bonds, respectively.
Figure 4—figure supplement 1
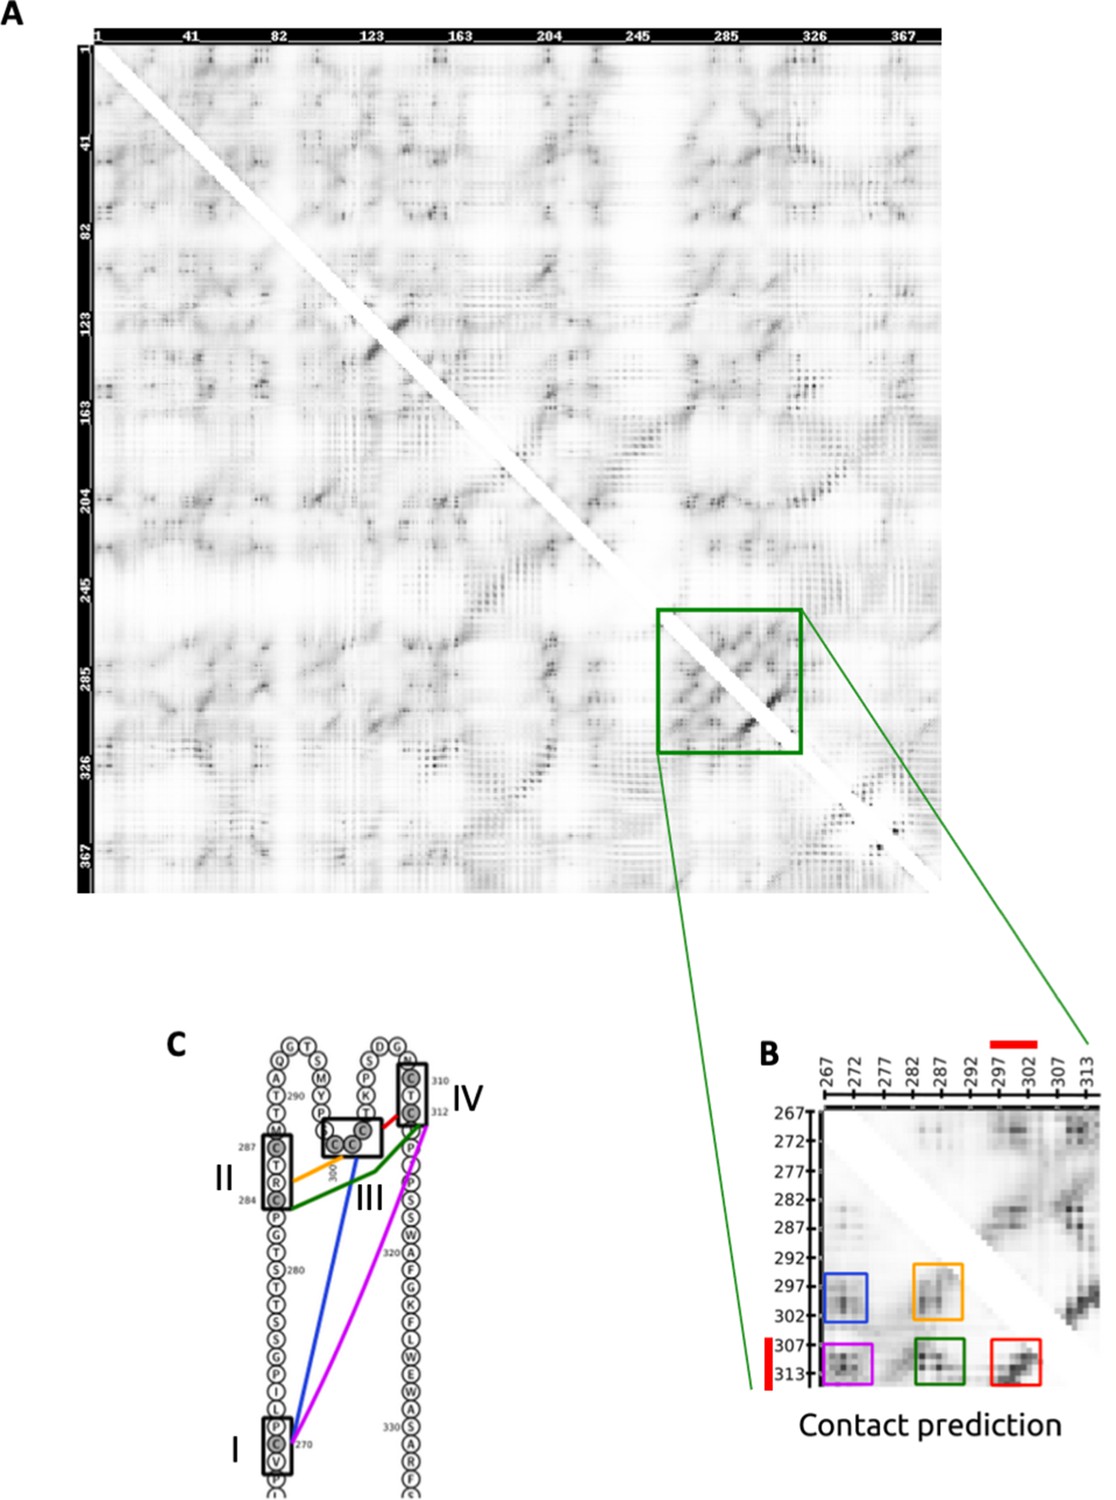
Contact map prediction for the L protein by RaptorX.
(A) The symmetric NxN matrix, where N is the length of the L protein, represents the probability of two residues being in contact. Higher probabilities are represented by darker colors. The green square highlights the ‘a’ determinant containing the four cysteine-rich regions illustrated in Figure 4A and in (C) on the sequence. (B) A zoom of the green square where contacts between residues in the four cysteine-rich regions are delimited by five distinguished boxes. (C) Colors of the boxes pair with the links connecting the cysteine-rich regions.
Figure 4—figure supplement 2
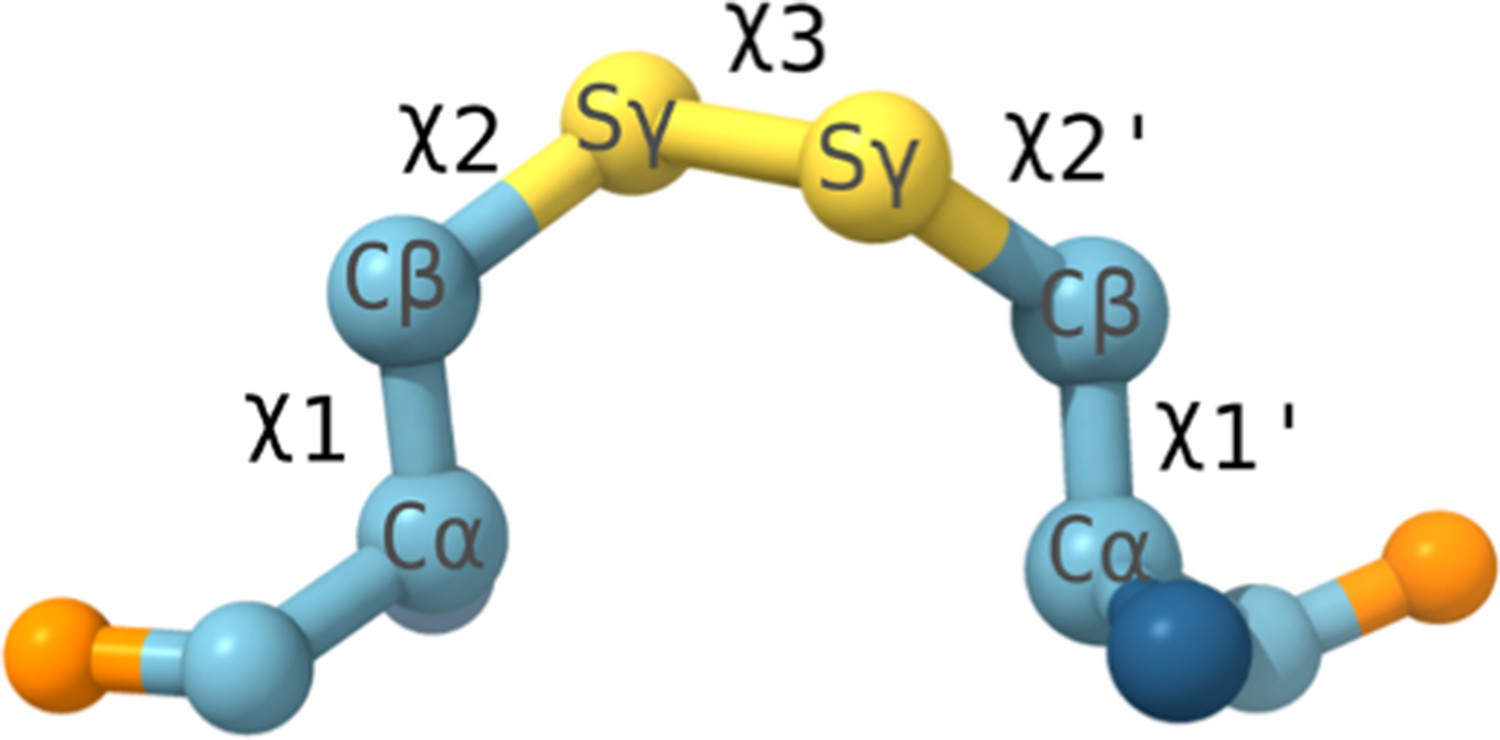
Geometry of a disulfide bond.
The five χ angles used to classify the disulfide bond conformers are labeled across the bond. Molecular dynamic (MD) simulations (see 'Methods') confirmed the stability of the bond as an allosteric disulfide, specifically on a -/+RH Hook conformation. While only 3 out of the 20 possible configurations, namely −RH Staple, −LH Hook, and −/+RH Hook, are identified as allosteric disulfide bonds (Hogg, 2013; Schmidt and Hogg, 2007), the -/+RH Hook conformation is more stressed than other geometries, due to stretching of the S-S bond and bending of the neighboring bond angles (Zhou et al., 2014).
Figure 5

Evidence for a functional role of the CSD in the region 294–317 of the HBV S GP.
(A) Huh7 cells were co-transfected with pSVLD3 plasmid coding for hepatitis delta virus (HDV) RNPs and plasmids coding for wild-type (wt), single, or double mutant (TG/CC) hepatitis B virus glycoproteins (HBV GPs). As control, pSVLD3 was co-transfected with an empty plasmid (referred to as ‘noGP’). At day 9 post-transfection, the cell supernatants were harvested, filtered, and the extracellular RNA extracted and purified before quantifying HDV RNAs by quantitative reverse transcription PCR (RTqPCR). HDV RNA levels in GE (genome equivalent) are expressed as means ± SD (N = 4) per ml of cell supernatants. (B) HDV particles were used to infect Huh7-NTCP cells, which were grown for 7 days before total intracellular RNA was purified. The results of HDV RNA quantification by RTqPCR are expressed after normalization with glyceraldehyde 3-phosphate dehydrogenase (GAPDH) RNAs as means ± SD (N = 4) per ml of cell lysates containing 106 cells. (C) Detection of GP mutants at the cell surface by biotinylation. Huh7 cells expressing wt or mutant HBV GPs were biotinylated for 30 min at 4°C and then processed biochemically. Cell lysates were subjected to streptavidin pull-down prior to western blot analysis using anti-HBsAg antibody (Murex). The molecular weight markers (kDa) are shown on the left. Calnexin detection was used as a control for the cytoplasm protein marker, showing the integrity of cell membrane, as shown in this representative western blot. The relative quantification of cell-surface GP expression compared to wt quantified from western blot analyses (means ± SD; N = 3) is shown below. See the quantification of total HBV GP expression in Figure 1—figure supplement 4. (D) Huh7 ‘donor’ cells co-expressing wt or mutant HBV GPs and a luciferase marker gene driven by the HIV-1 promoter were co-cultured with either Huh7-tat (H-tat) or Huh7-NTCP-tat (N-tat) ‘indicator’ cells that express HIV Tat protein. After 24 hr, the cells were treated at pH 4 or pH 7 for 3 min. The luciferase activity induced by the fusion between the donor and indicator cells was measured 24 hr later. Fusion mediated by wt GP at pH 7 with Huh7-NTCP-tat cells was taken as 100%. The bars represent the means (N = 4). Error bars correspond to standard deviations.
-
Figure 5—source data 1
Evidence for a functional role of the CSD in the region 294–317 of the HBV S GP.
The values correspond to the data expressed in the graphs displayed in Figure 5A–C.
- https://cdn.elifesciences.org/articles/64507/elife-64507-fig5-data1-v2.xlsx
-
Figure 5—source data 2
Evidence for a functional role of the CSD in the region 294–317 of the HBV S GP.
The values correspond to the data expressed in the graphs displayed in Figure 5D.
- https://cdn.elifesciences.org/articles/64507/elife-64507-fig5-data2-v2.xlsx
-
Figure 5—source data 3
Evidence for a functional role of the CSD in the region 294–317 of the HBV S GP.
These images are of the original and uncropped gels that correspond to the blots displayed in Figure 5C. The vertical bars correspond to samples that are not described in the 'Results' section.
- https://cdn.elifesciences.org/articles/64507/elife-64507-fig5-data3-v2.xlsx
Figure 6
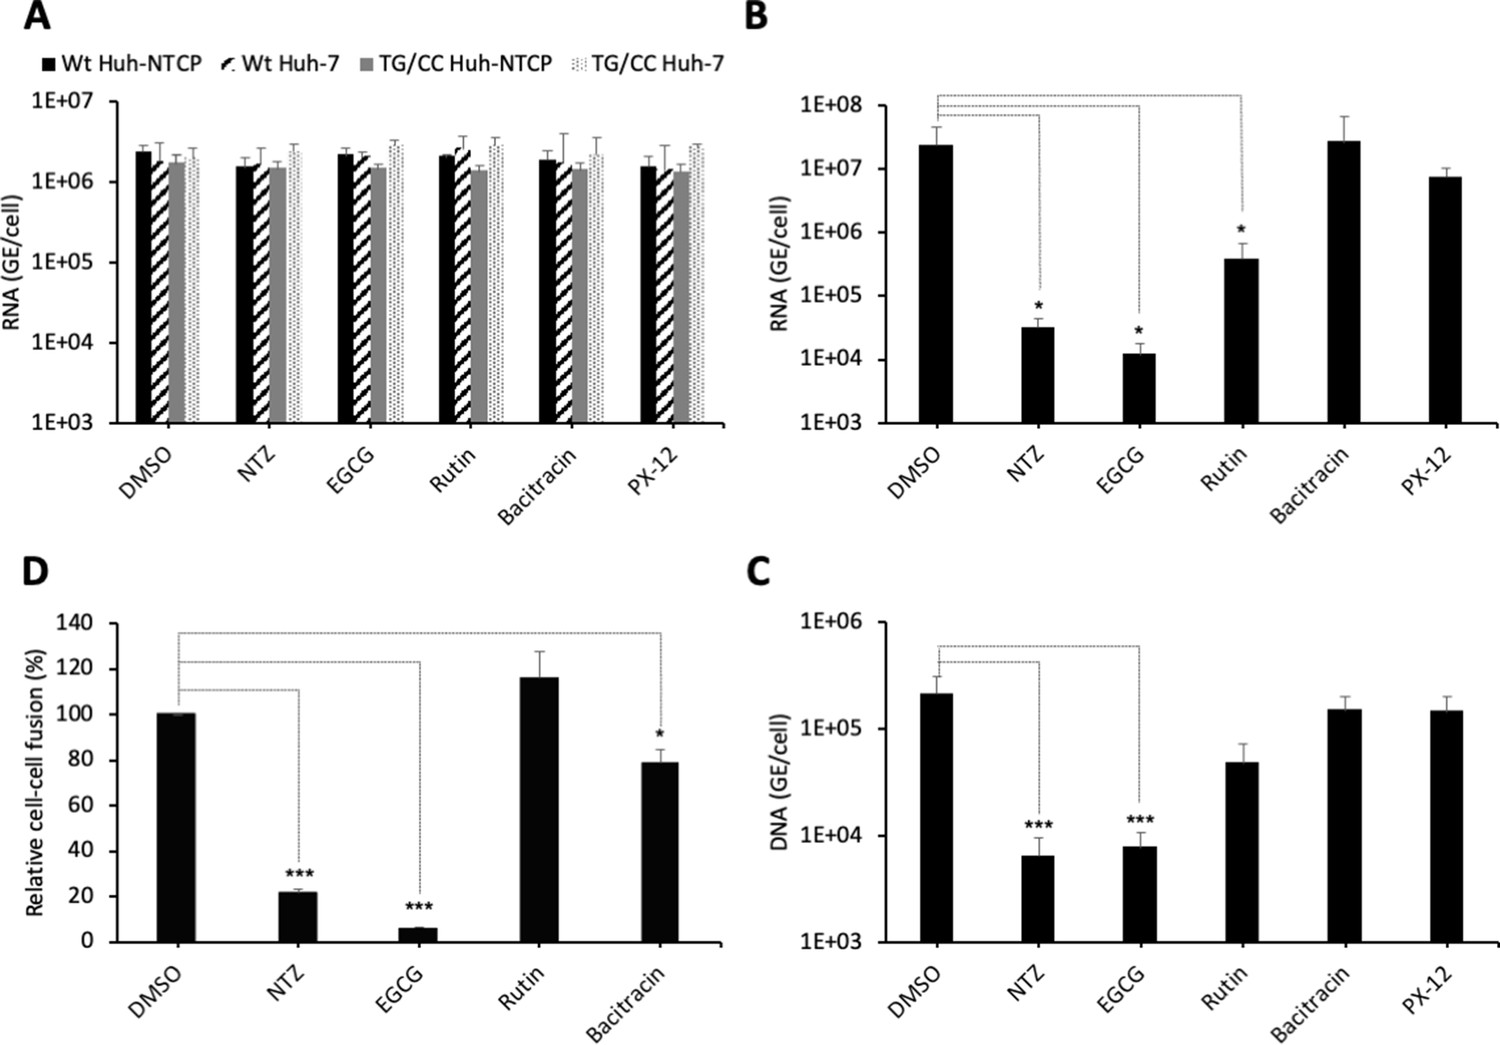
PDI inhibitors in HBV entry.
(A) Hepatitis delta virus (HDV) particles harboring wild-type (wt) or TG/CC mutant (T330C/G308C) hepatitis B virus glycoproteins (HBV GPs) were incubated with Huh7 or Huh7-NTCP cells that were pre-treated for 2 hr with the indicated inhibitors that block different protein disulfide isomerase (PDI) proteins or with dimethyl sulfoxide (DMSO), used as the vehicle. Binding of either virus particles to the cells was quantified by quantitative reverse transcription PCR (RTqPCR) and expressed after normalization with glyceraldehyde 3-phosphate dehydrogenase (GAPDH) RNAs as mean ± SD (N = 3) per ml of cell lysates containing 106 cells. (B) HDV or (C) HBV particles were used to infect Huh7-NTCP cells that were pre-incubated for 2 hr with the indicated inhibitors that block different PDI proteins or with DMSO, used as a vehicle. Infected cells were grown for 7 days before the total intracellular RNA or DNA was purified. The results of HDV RNA and HBV DNA quantification by RTqPCR and quantitative PCR (qPCR), respectively, are expressed after normalization with GAPDH RNAs as means ± SD (N = 3) per ml of cell lysates containing 106 cells. (D) Huh7 ‘donor’ cells co-expressing HBV GPs and a luciferase marker gene driven by the HIV-1 promoter were co-cultured with Huh7-NTCP-tat ‘indicator’ cells that express HIV Tat protein. The indicated PDI inhibitors were added when ‘donor’ and ‘indicator’ cells were mixed for co-cultures and the luciferase activity induced by cell-cell fusion was measured 24 hr later. DMSO was used as a vehicle. Fusion mediated by HBV GPs without inhibitor was taken as 100%. The graphs represent the average of four independent experiments. The PDI inhibitors were used at the following concentrations: nitazoxanide (NTZ), 30 µg/ml; (−)-epigallocatechin 3-gallate (EGCG), 5 µM; rutin, 5 µM; bacitracin, 5 mM; PX-12, 30 µg/ml. No cytotoxicity could be detected in these conditions (Figure 1—figure supplement 2).
-
Figure 6—source data 1
PDI inhibitors in HBV entry.
The values correspond to the data expressed in the graphs displayed in Figure 6A–D.
- https://cdn.elifesciences.org/articles/64507/elife-64507-fig6-data1-v2.xlsx
Figure 7 with 2 supplements
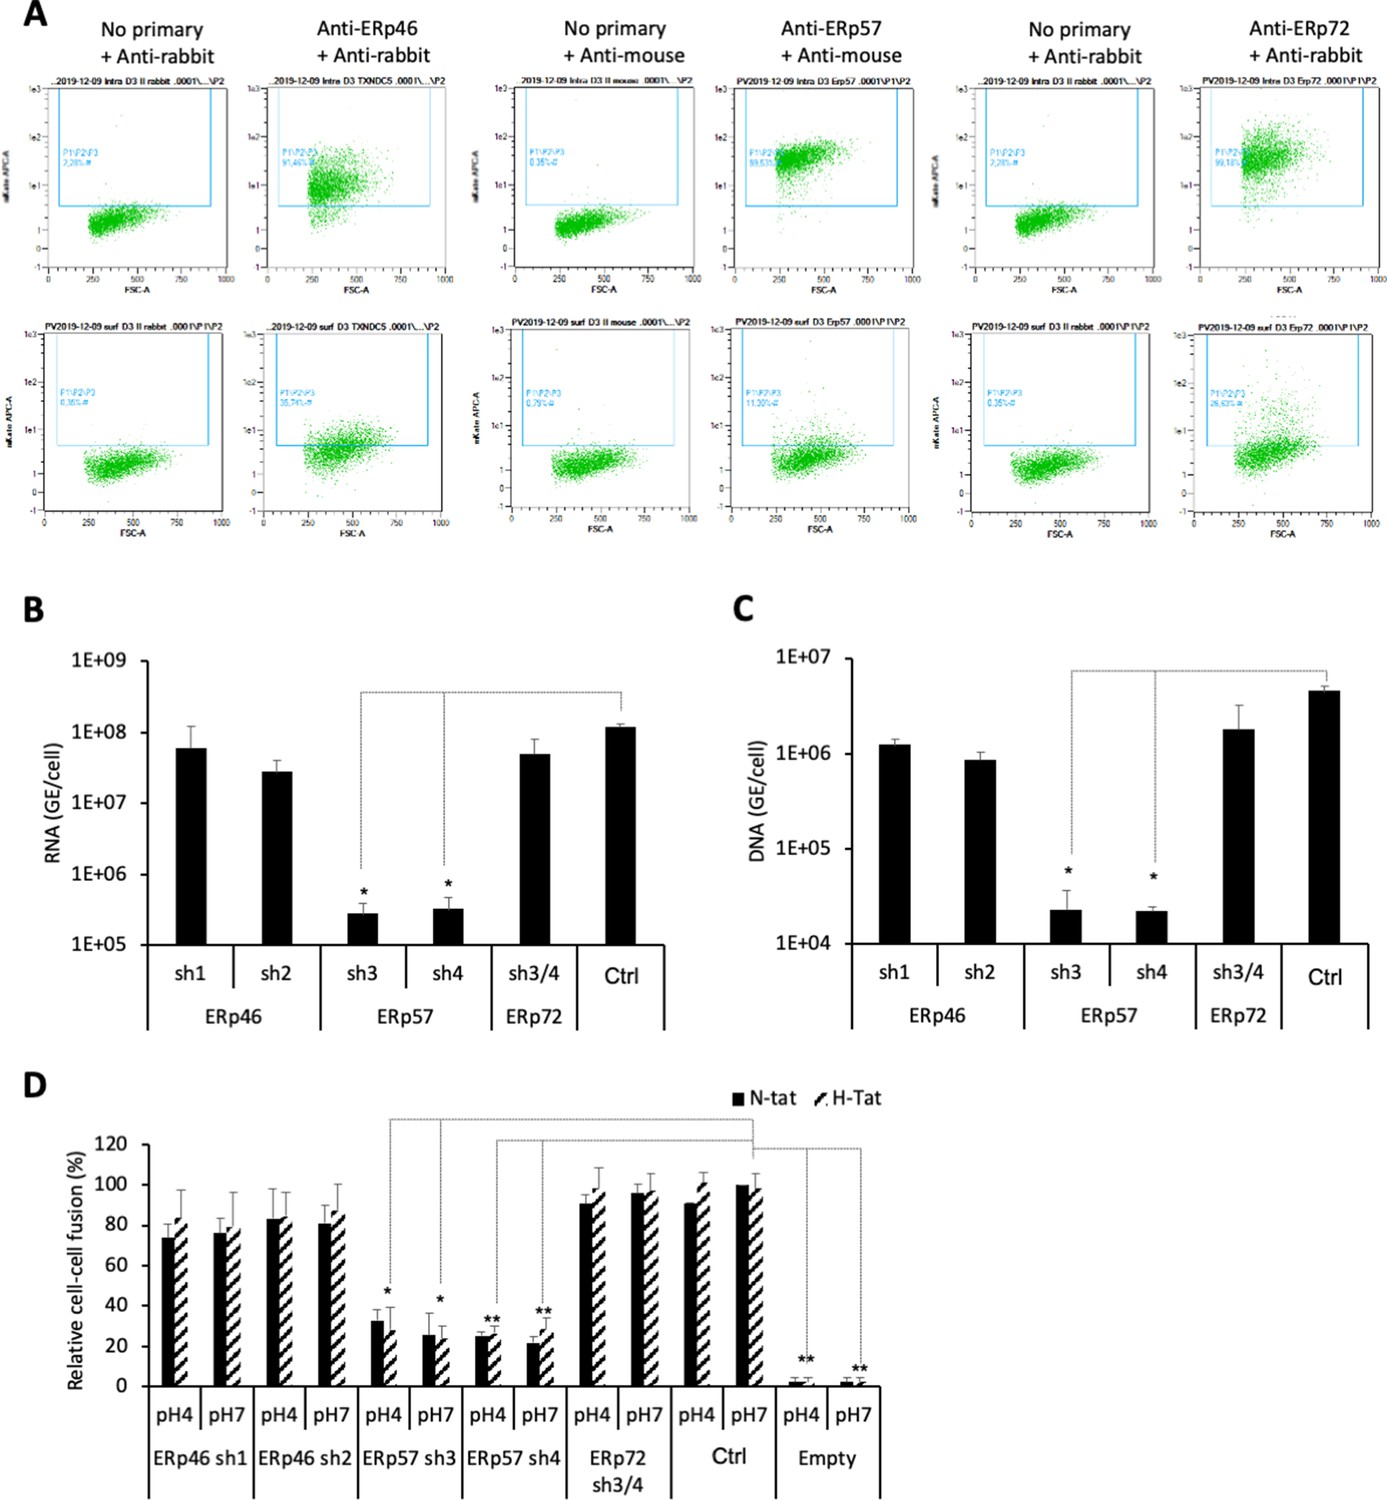
ERp57 down-regulation inhibits HBV entry.
(A) Intracellular (upper panels) and cell-surface (lower panels) staining of ERp46, ERp57, and ERp72 protein disulfide isomerase (PDI) members. Huh7-NTCP cells were subjected to flow cytometry analysis, in order to evaluate the expression of the indicated PDIs. Cells stained with secondary antibody only (no primary) were used to provide the background of flow cytometry analyses. (B) Hepatitis delta virus (HDV) or (C) hepatitis B virus (HBV) particles were used to infect Huh7-NTCP cells in which the indicated PDIs were down-regulated by lentiviral vectors carrying shRNA (see Figure 7—figure supplement 1 and Figure 7—figure supplement 2). Naive Huh7-NTCP cells were used as controls. Infected cells were grown for 7 days before total intracellular RNA or DNA was purified. The results of HDV RNA and HBV DNA quantification by quantitative reverse transcription PCR (RTqPCR) and quantitative PCR (qPCR), respectively, are expressed after normalization with glyceraldehyde 3-phosphate dehydrogenase (GAPDH) RNAs as means ± SD (N = 3) per ml of cell lysates containing 106 cells. (D) Huh7 ‘donor’ cells co-expressing HBV glycoproteins (GPs) and a luciferase marker gene driven by the HIV-1 promoter were co-cultured with Huh7-NTCP-tat ‘indicator’ cells that express HIV Tat protein in which the indicated PDIs were down-regulated by lentiviral vectors carrying shRNA. After 24 hr, the cells were treated at pH 4 or pH 7 for 3 min. The luciferase activity induced by the fusion between donor and indicator cells was measured 24 hr later. Fusion mediated by HBV GPs at pH 7 with naive Huh7-NTCP-tat cells (Ctrl) was taken as 100%. A control plasmid that does not allow GP expression (Empty) was used to determine the background of luciferase expression. The bars represent the means (N = 3). Error bars correspond to standard deviations.
-
Figure 7—source data 1
ERp57 down-regulation inhibits HBV entry.
The values correspond to the data expressed in the graphs displayed in Figure 7B–D.
- https://cdn.elifesciences.org/articles/64507/elife-64507-fig7-data1-v2.xlsx
Figure 7—figure supplement 1

Down-regulation of PDI family members.
(A–C) Naive Huh7-NTCP cells (Ctrl+) or shRNA-expressing Huh7-NTCP cells were subjected to flow cytometry (left) and western blot (right) analyses, in order to evaluate the expression levels of the indicated protein disulfide isomerases (PDIs) ((A) ERp46; (B) ERp57; (C) ERp72) before or after down-regulation. Huh7-NTCP cells stained with secondary antibody only (Neg) were used to provide the background of flow cytometry analyses.
Figure 7—figure supplement 2
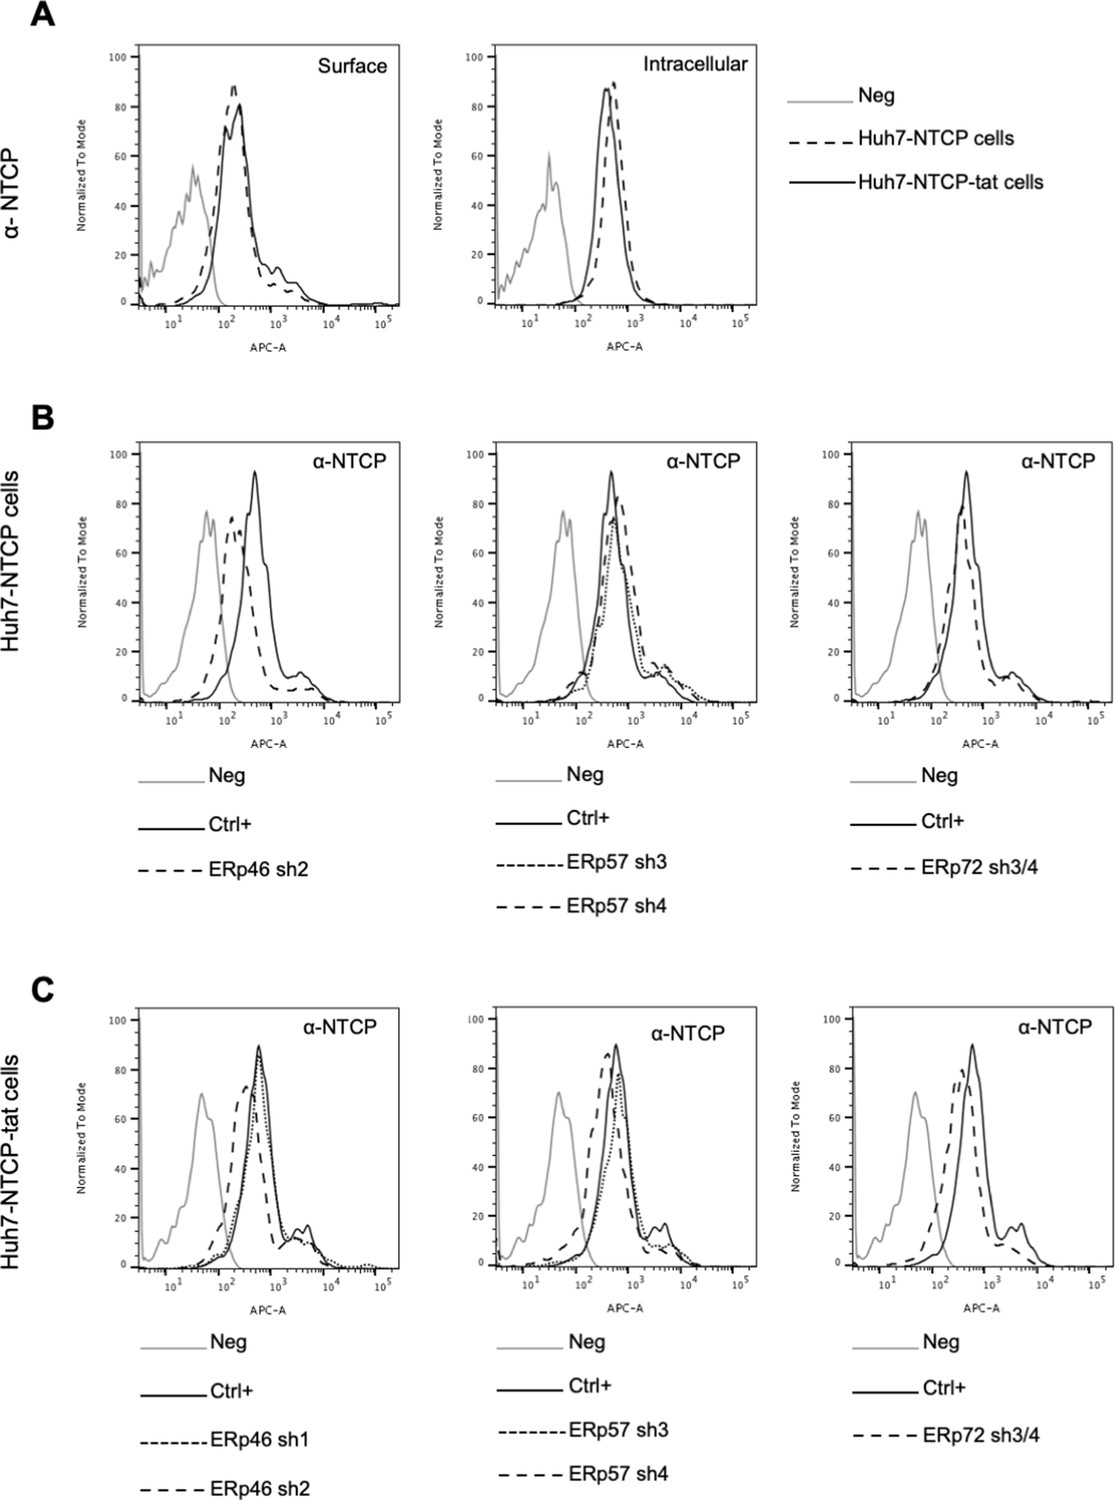
NTCP expression in target cells.
(A) Huh7-NTCP and Huh7-NTCP-tat cells were subjected to flow cytometry analysis, in order to evaluate the expression of sodium taurocholate-cotransporting polypeptide (NTCP) at intracellular and cell-surface levels, as indicated. Cells stained with secondary antibody only (Neg) were used to provide the background of flow cytometry analyses. (B) Huh7-NTCP and (C) Huh7-NTCP-tat cells were subjected to flow cytometry analysis, in order to evaluate the expression of NTCP after the stable expression of shRNAs targeting the indicated protein disulfide isomerases (PDIs). Non-transduced cells were used as positive control (Crtl+) and cells stained with secondary antibody only (Neg) were used to provide the background of flow cytometry analysis.
Figure 8

Intracellular localization of ERp57 in Huh7-NTCP cells.
Huh7-NTCP cells were grown on glass cover slides and fixed 48 hr after seeding. (A) Endogenous ERp57 with Rab5, Rab7, Rab11, or Lamp1 were immune-stained, and the colocalization of ERp57 (red channels) with Rab5, Rab7, Rab11, or Lamp1 (green channels) was analyzed by confocal microscopy. Scale bars of panels and zooms from squared area represent 10 µm and 2 µm, respectively. (B) The degree of colocalization between ERp57 and the different cell markers was assessed by determining the Pearson’s correlation coefficients with the JACoP plugin of ImageJ. Results are expressed as the mean of six individual cells. Error bars correspond to standard deviations.
Figure 9 with 1 supplement
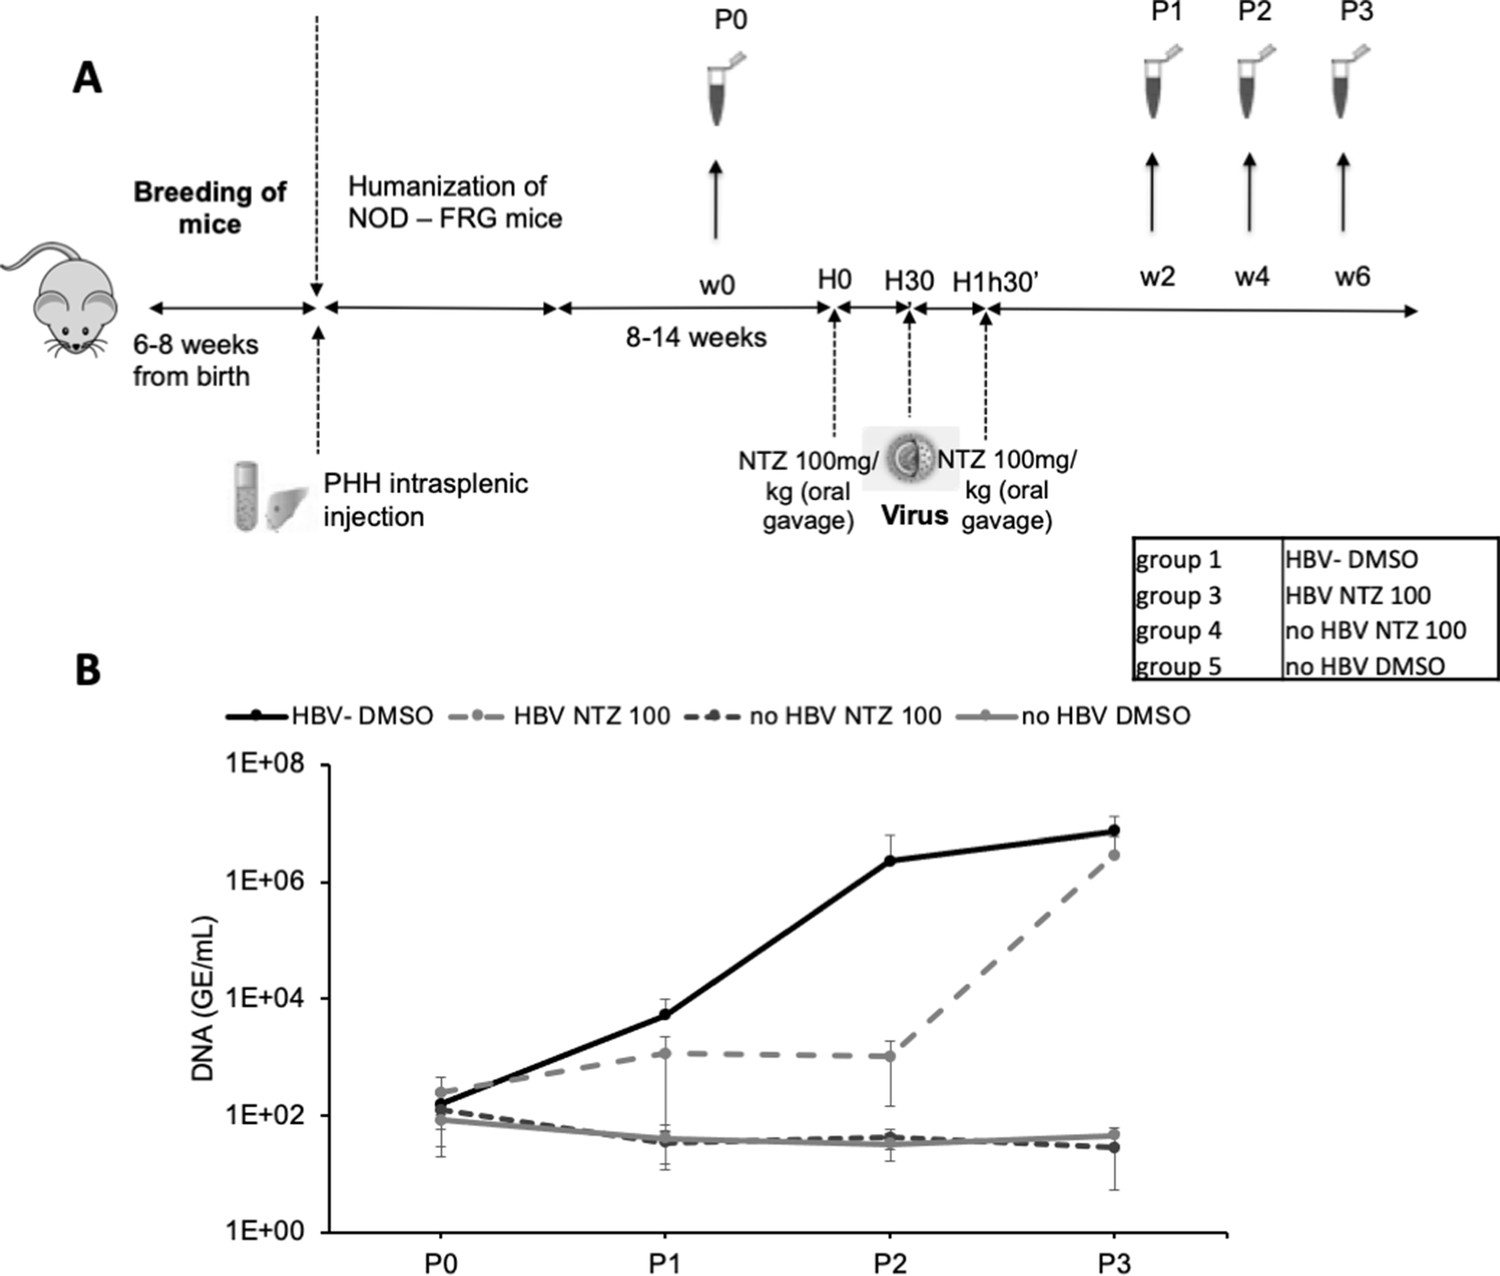
In vivo assessment of ERp57 inhibition.
(A) 4- to 8-week-old NOD-FRG mice were engrafted with primary human hepatocytes (PHH). After approximately 2–3 months, the animals displaying human serum albumin (HSA) levels >15 mg/ml were randomly split into four different groups (N = 3 to N = 5 animals, see Table in the inset) that were infected with hepatitis B virus (HBV) (108 genome equivalent (GE)/mouse), using the displayed nitazoxanide (NTZ) treatment schedule. (B) At different time points post-infection, blood samples (50 µl) were collected and the viremia in sera was monitored by quantitative PCR (qPCR) (GE/ml of serum). The graphs show the results of viremia (means ± SD) of HBV. See results of individual mice in Figure 9—figure supplement 1.
-
Figure 9—source data 1
In vivo assessment of ERp57 inhibition.
The values correspond to the data expressed in the graphs displayed in Figure 9B.
- https://cdn.elifesciences.org/articles/64507/elife-64507-fig9-data1-v2.xlsx
Figure 9—figure supplement 1
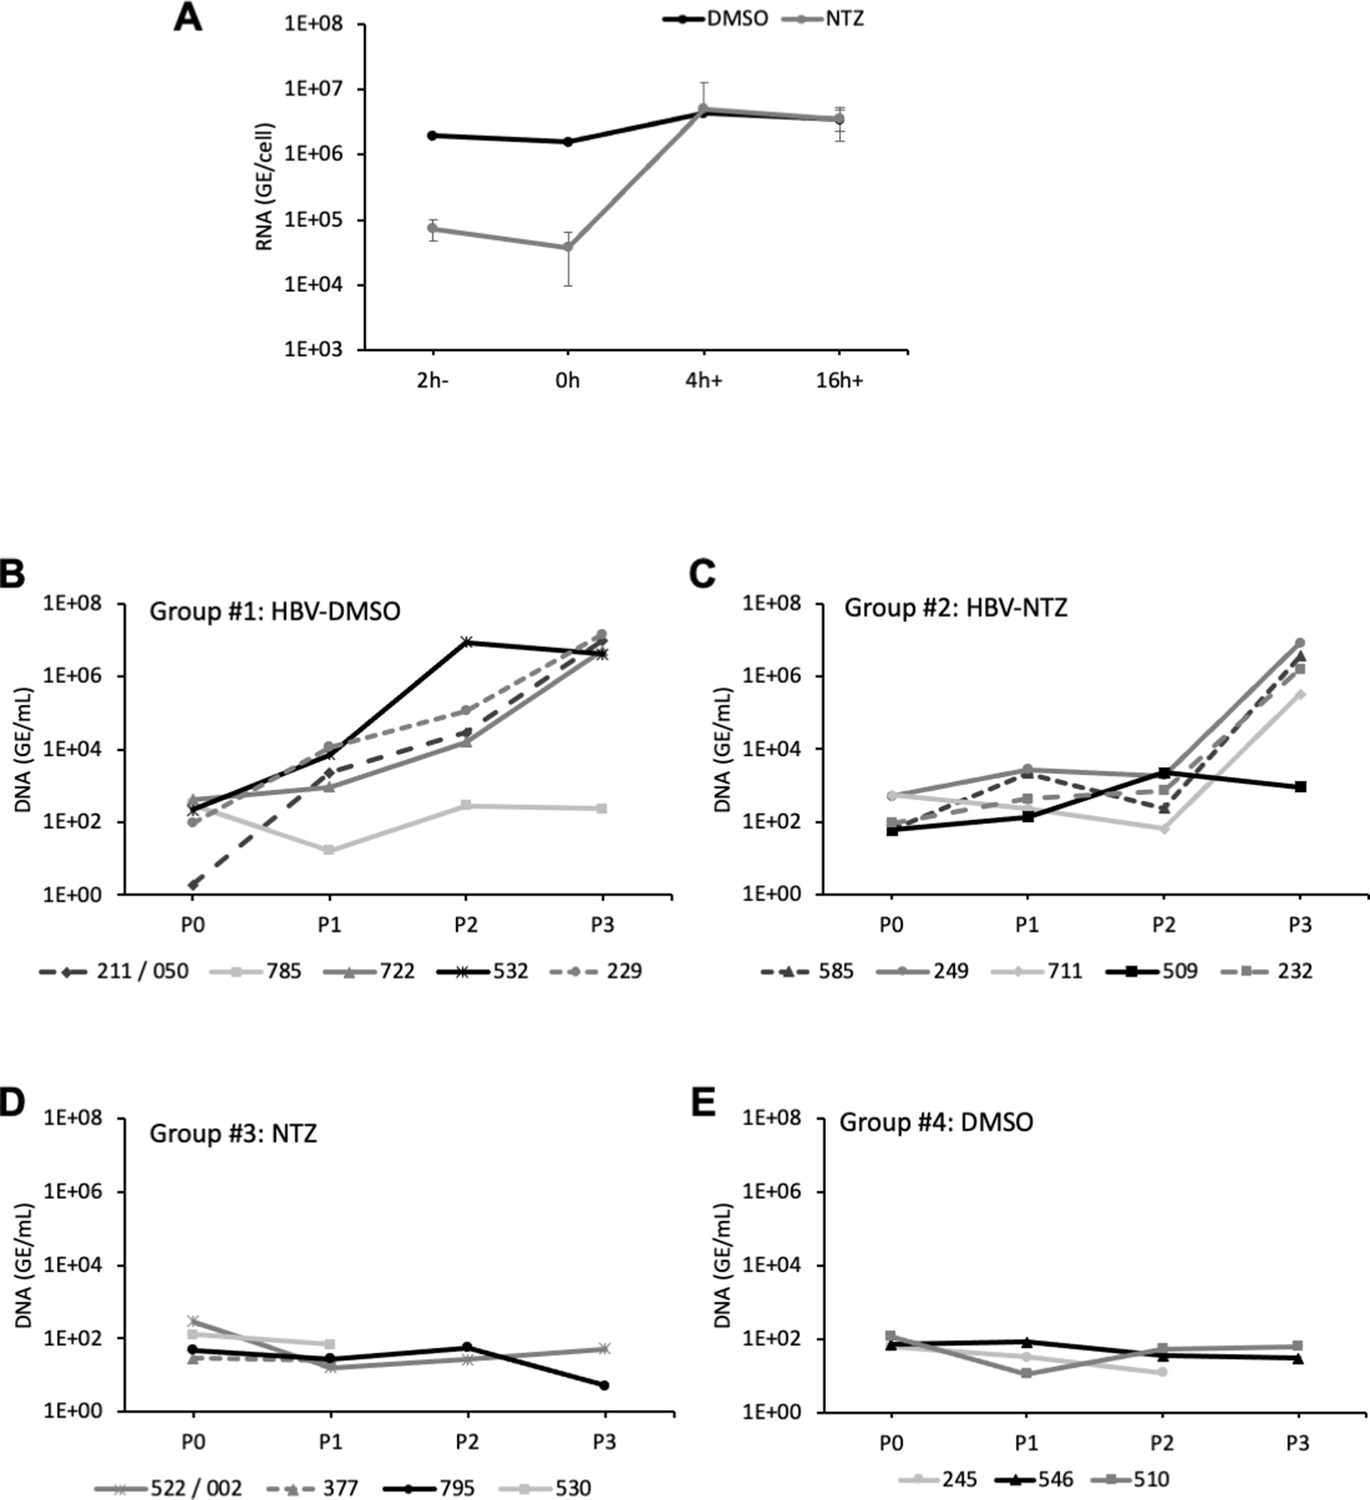
In vivo assessment of ERp57 inhibition.
(A) Nitazoxanide (NTZ) at 30 µg/ml was added to the cell supernatant 2 hr before infection (2h-) vs at the onset of infection (0 hr), at 4 hr (4h+) or at 16 hr (16h+) post-infection. Dimethyl sulfoxide (DMSO) was used as the control vehicle. At 7 days post-infection, hepatitis delta virus (HDV) RNAs were extracted from cells and quantified by quantitative reverse transcription PCR (RTqPCR). The results are expressed after normalization with glyceraldehyde 3-phosphate dehydrogenase (GAPDH) RNAs as means ± SD (N = 4) per ml of cell lysates containing 106 cells. (B–E) Study of NTZ effect in hepatitis B virus (HBV) in vivo. 4- to 8-week-old NOD-FRG mice were engrafted with primary human hepatocytes (PHH). After approximately 2–3 months, the animals displaying human serum albumin (HSA) levels >15 mg/ml were split into four groups that were infected with HBV (108 genome equivalent (GE)/mouse) with or without NTZ. See schedule in Figure 9A. At different time points post-infection, blood samples (50 µl) were collected and the viremia in sera was monitored by quantitative PCR (qPCR) on the HBV genome (GE/ml of serum). The graphs show the results of viremia for individual mice within each group. (B) Group #1: mice were infected and inoculated with DMSO, (C) Group #2: mice were infected and inoculated with NTZ (100 mg/kg), (D) Group #3: mice were only inoculated with NTZ (100 mg/kg), and (E) Group #4: mice were only inoculated with DMSO (used as the control vehicle of NTZ).
Author response image 1
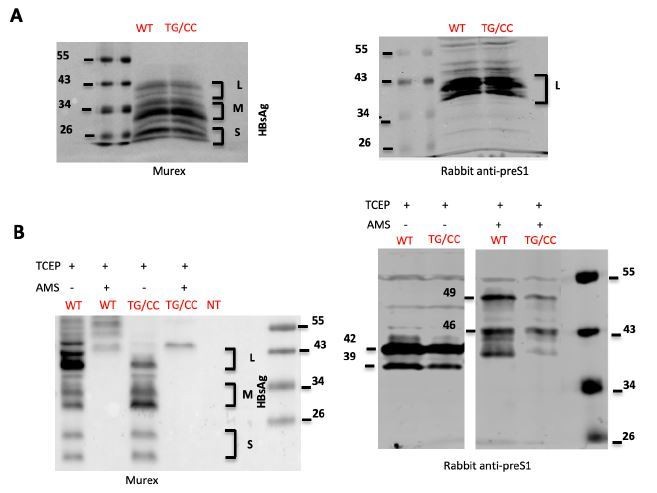
HBsAg characterization.
(A) Lysates of cells transfected with wild type HBV LMS (WT) HBC LMS mutant. T303C/G308C (TG/CC) were treated with β-mercaptoethanol and denatured were analyzed by immunoblotting using Murex (left) ou preS1 (right) antibodies. (B) Lysates of cells transfected with wild type HBV LMS (WT) HBC LMS mutant T303C/G308C (TG/CC) were treated with TCEP, which reduces disulfide bonds, and AMS, which alkylates free thiols, as indicated. Samples were then analyzed by immunoblotting using Murex (left) ou preS1 (right) antibodies. The results show that after treatment with AMS, Murex antibodies did not recognize any more HBV GPs. Using preS1 antibodies, we detected a 7kDa shift in the L protein due to reaction of AMS with free thiols but we were unable to detect 1 kDa difference between wt and the double cysteine TG/CC mutant.
Author response image 2
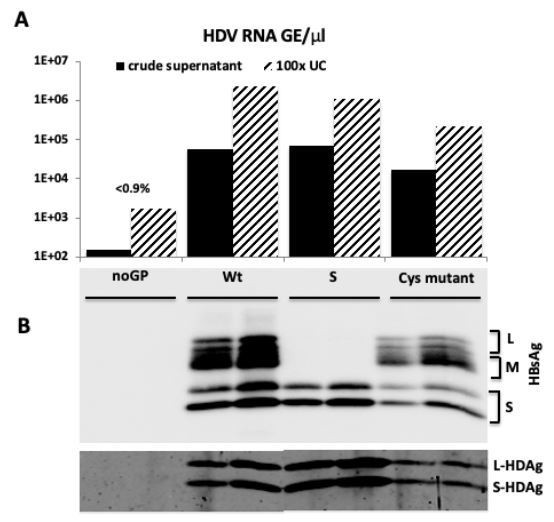
HDV particles characterization.
(A) HDV RNA titers (GE/μl) in crude supernatants from producer cells co-transfected with pSVL-D3 and with i) empty plasmid (noGP), ii) wild type HBV LMS GPs (Wt), iii) HBV S only (S), or iv) HBV LMS mutant T303C (Cys mutant), and in 100-fold concentrated virus samples subjected to ultracentrifugation through 30% sucrose cushion (UC). (B) Western blot analysis of 100-fold concentrated particles (1E7 GE) from ultrafiltrated crude supernatants or pellets after ultracentrifugation with anti-HBsAg antibody (Murex) and rabbit polyclonal serum against HDAg.
Tables
Key resources table
| Reagent type (species) or resource | Designation | Source or reference | Identifiers | Additional information |
|---|---|---|---|---|
| Strain, strain background (Mus musculus, females and males) | NOD-FRG mice | DOI: 10.1038/nbt1326 DOI : 10.1074/jbc.M115.662999 | Breeding and experimentation in PBES – originally purchased to YEcuris corporation | |
| Strain, strain background (HBV) | Hepatitis B virus (HBV) | This paper | HBV, genotype D, produced by co-transfection of HepG2.2.15 cells with plasmids pCiHB(env-) and pT7HB2.7 | |
| Strain, strain background (HDV) | Hepatitis D virus (HDV) | This paper | HDV, genotype 1, produced by co-transfection of Huh7 cells with plasmids pSVLD3 and pT7HB2.7 or variant constructs | |
| Cell line (Homo sapiens) | Huh7 - hepatocarcinoma cells | PMID:6286115 | ||
| Cell line (Homo sapiens) | Huh7-NTCP | This paper | Generated by transduction with pLX304NTCP retroviral vector and selection with blasticidin | |
| Cell line (Homo sapiens) | Huh7-Tat (H-tat) cells | This paper | Generated by transduction with LXSN-tat retroviral vector and selection with G418 | |
| Cell line (Homo sapiens) | H-tat cells down-regulated for ERp46, ERp57, or ERp72 | This paper | Generated by transduction of H-tat cells with shRNA lentiviral vectors against ERp46, ERp57, or ERp72 followed by selection with puromycin | |
| Cell line (Homo sapiens) | Huh7-NTCP-Tat (N-tat) cells | This paper | Generated by transduction of Huh7-NTCP cells with LXSN-tat retroviral vector | |
| Cell line (Homo sapiens) | N-tat cells down-regulated for ERp46, ERp57, or ERp72 | This paper | Generated by transduction of N-tat cells with shRNA lentiviral vectors against ERp46, ERp57, or ERp72 followed by selection with puromycin | |
| Cell line (Homo sapiens) | HepG2.2.15 human hepatoma cells | From David Durantel lab | Production of HBV particles | |
| Cell line (Homo sapiens) | 293T human kidney cells | ATCC | CRL-1573 | Production of retro- and lentiviral particles |
| Cell line (Cricetulus griseus, female) | CHO-K1 Chinese hamster ovary cells | ATCC | CCL-61 | Cell-cell fusion assays |
| Transfected construct (human) | pLX304NTCP | DNASU plasmid repository | HQ447437 | Retroviral construct to transfect and express NTCP |
| Transfected construct (HBV) | pSVLD3 | DOI: 10.1128/JVI.63.5.1945–1950.1989 | Harbors a trimer of the HDV, genotype 1 genome. Used for production of HDV particles | |
| Transfected construct (HBV) | pT7HB2.7 | DOI: 10.1128/JVI.68.6.4063–4066.1994 | Gift from Camille Sureau, used for production of HBV and HDV particles and expression of HBV envelope proteins | |
| Transfected construct (HBV) | pT7HB2.7Mless (noM) | This paper | Generated for expression of HBV L and S proteins (M protein is silenced) | |
| Transfected construct (HBV) | pCiL | DOI: 10.1128/JVI.77.9.5519–5523.2003 | Encodes only the L-HBsAg protein | |
| Transfected construct (HBV) | pCIS | DOI: 10.1128/JVI.80.10.4648–4655.2006 | Encodes only the S-HBsAg protein | |
| Transfected construct (CCHFV) | pCAGGS_GP/wt-M | DOI: 10.1128/JVI.03691–14 | Major open reading frame of CCHFV M-segment subcloned into pCAGGS | |
| Transfected construct (HBV) | pCIHB(env-) | DOI: 10.1128/JVI.00621–06 | Gift from Camille Sureau, used for production of HBV particles | |
| Transfected construct (HIV1-Tat) | LXSN-tat retroviral vector | DOI: 10.1128/JVI.73.3.1956–1963.1999 | HIV-1 tat gene cloned into the LXSN retroviral vector | |
| Transfected construct (HIV1-LTR) | pLTR-luc | DOI: 10.1016/0378-1119(90)90032 m | Gift from Olivier Schwartz, contains a 722-base pair XhoI (−644)-HindIII (+78) fragment from HIV-1 placed in front of the luciferase reporter gene | |
| Transfected construct (VSV) | phCMV-VSV-G | DOI: 10.1016/s0091-679x(08)60600–7 | To express the envelope protein of VSV | |
| Transfected construct (human) | shRNA against ERp46 (ERp46-shRNA 1) | Sigma | NM_022085 / TRCN0000064353 / PLKO.1 | Lentiviral construct to transfect and express the shRNA |
| Transfected construct (human) | shRNA against ERp46 (ERp46-shRNA 2) | Sigma | NM_022085 / TRCN0000064354 / PLKO.1 | Lentiviral construct to transfect and express the shRNA |
| Transfected construct (human) | shRNA against ERp57 (ERp57-shRNA 3) | Sigma | NM_005313 / TRCN0000319038 / PLKO | Lentiviral construct to transfect and express the shRNA |
| Transfected construct (human) | shRNA against ERp57 (ERp57-shRNA 4) | Sigma | NM_005313 / TRCN0000147738 / PLKO.1 | Lentiviral construct to transfect and express the shRNA |
| Transfected construct (human) | shRNA against ERp72 (ERp72-shRNA 3) | Sigma | NM_004911 / TRCN0000289676 / PLKO.1 | Lentiviral construct to transfect and express the shRNA |
| Transfected construct (human) | shRNA against ERp72 (ERp72-shRNA 4) | Sigma | NM_004911 / TRCN0000049334 / PLKO.1 | Lentiviral construct to transfect and express the shRNA |
| Transfected construct (human) | shRNA against ERp72 (ERp72-shRNA 5) | Sigma | NM_004911 / TRCN0000307107 / PLKO.1 | Lentiviral construct to transfect and express the shRNA |
| Biological sample (M. musculus) | Blood samples | PBES (Plateau de Biologie Experimentale de la Souris) SFR Biosciences Lyon | Isolated from NOD-FRG mice | |
| Antibody | Anti-HBsAg antibody, HPR conjugated (goat polyclonal) | DiaSorin | 9F80-01 | WB (1:400) |
| Antibody | Anti-human calnexin (rabbit polyclonal) | Enzo | ADI-SPA-865-F | WB (1:1000) |
| Antibody | Anti-mouse TXNDC5/ERp46 (rabbit polyclonal) | Abcam | Ab10292 | FACS (1:20) WB (1:1000) |
| Antibody | Anti-human ERp57 (mouse monoclonal) | Abcam | Ab13506 | FACS (2 μg/106 cells) WB (1:10,000) IF (1:100) |
| Antibody | Anti-human ERp72 (rabbit polyclonal) | Abcam | Ab155800 | FACS (1:100) WB (1:1000) |
| Antibody | Anti-human NTCP/SLC10A1 antibody, PE conjugated (rabbit polyclonal) | Bioss Antibodies | bs-1958R-PE | FACS (1:100) |
| Antibody | Anti-human Rab5 (rabbit monoclonal) | Cell Signaling Technology | (C8B1):3547 | IF (1:200) |
| Antibody | Anti-human Rab7 (rabbit monoclonal) | Cell Signaling Technology | (D95F2):9367 | IF (1:100) |
| Antibody | Anti-human Rab11 (rabbit monoclonal) | Cell Signaling Technology | (D4F5):5589 | IF (1:50) |
| Antibody | Anti-human Lamp1 (rabbit monoclonal) | Cell Signaling Technology | (D2D11):9091 | IF (1:200) |
| Sequence-based reagent | F52A | This paper | preS1 mutagenesis PCR primers | GTAGGAGCTGGAGCAG CCGGGCTGGGTTTCAC |
| Sequence-based reagent | F52E | This paper | preS1 mutagenesis PCR primers | GTAGGAGCTGGAGCAGA AGGGCTGGGTTTCAC |
| Sequence-based reagent | G53A | This paper | preS1 mutagenesis PCR primers | CTGGAGCATTCGCGCT GGGTTTCAC |
| Sequence-based reagent | F56A | This paper | preS1 mutagenesis PCR primers | TTCGGGCTGGGTGCC ACCCCACCGCA |
| Sequence-based reagent | W66A | This paper | preS1 mutagenesis PCR primers | GAGGCCTTTTGGGGGCG AGCCCTCAGGCTC |
| Sequence-based reagent | W66E | This paper | preS1 mutagenesis PCR primers | GAGGCCTTTTGGGGGAG AGCCCTCAGGCTC |
| Sequence-based reagent | Y129A | This paper | preS2 mutagenesis primers | GAGTGAGAGGCCTGGCTT TCCCTGCTGGTG |
| Sequence-based reagent | F130A | This paper | preS2 mutagenesis primers | GAGAGGCCTGTATGCCCC TGCTGGTGG |
| Sequence-based reagent | S136E | This paper | preS2 mutagenesis primers | CCCTGCTGGTGGCTCCGAA TCAGGAACAGTAAAC |
| Sequence-based reagent | L144A | This paper | preS2 mutagenesis primers | CAGTAAACCCTGTTGCGACT ACTGCCTCTCC |
| Sequence-based reagent | T303C | This paper | CSD mutagenesis primers | CCTCCTGTTGCTGTTGCAAA CCTTCGGACG |
| Sequence-based reagent | G308C | This paper | CSD mutagenesis primers | GTACCAAACCTTCGGACTGT AATTGCACCTGTATTCCC |
| Sequence-based reagent | TG/CC | This paper | CSD mutagenesis primers | GTTGCAAACCTTCGGACTGT AATTGCACCTGTATTCCC |
| Commercial assay or kit | FuGENE HD Trasnfection Reagent | Promega | E2312 | Transfection reagent |
| Commercial assay or kit | Dual-Luciferase Reporter Assay System | Promega | E1910 | Quantification of luciferase activity |
| Commercial assay or kit | iScript cDNA synthesis kit | Bio-Rad | 1708891 | cDNA synthesis |
| Commercial assay or kit | FastStart Universal SYBR Green Master | Roche Sigma | 4913850001 | Real-time qPCR assays |
| Commercial assay or kit | CytoTox-ONE Homogen Membrane Integrity Assay | Promega | G7891 | Cytotoxicity assay |
| Chemical compound, drug | Bacitracin | Sigma | B0125-250KU | Water |
| Chemical compound, drug | NTZ (nitazoxanide) | Sigma | N0290-50MG | DMSO |
| Chemical compound, drug | EGCG ((−)-epigallocatechin gallate) | Sigma | E4268-100MG | Water |
| Chemical compound, drug | Rutin Hydrate | Sigma | R5143-50G | DMSO |
| Chemical compound, drug | PX-12 | Sigma | M5324-5MG | DMSO |
| Chemical compound, drug | DTNB (5,5′-dithiobis(2-nitrobenzoic acid)) | Sigma | D218200-1G | DMSO |
| Chemical compound, drug | EZ-Link Sulfo-NHS-LC-LC-Biotin | Life technologies | 21338 | |
| Software, algorithm | ImaJ software | ImaJ | RRID:SCR_003070 | |
| Software, algorithm | Membrane Protein eXplorer | http://blanco.biomol.uci.edu/mpex/ | RRID:SCR_014077 | |
| Software, algorithm | RaptorX | http://raptorx.uchicago.edu/ | RRID:SCR_018118 | |
| Software, algorithm | Jpred | http://www.compbio.dundee.ac.uk/jpred/ | RRID:SCR_016504 | |
| Software, algorithm | MODELLER | http://salilab.org/modeller/modeller.html | RRID:SCR_008395 | |
| Software, algorithm | Clustal X | http://www.clustal.org/clustal2/ | RRID:SCR_017055 | |
| Software, algorithm | Molecular Modelling Toolkit | http://dirac.cnrs-orleans.fr/MMTK.html | ||
| Software, algorithm | GROMACS | http://www.gromacs.org | RRID:SCR_014565 | |
| Software, algorithm | UCSF Chimera | http://plato.cgl.ucsf.edu/chimera/ | RRID:SCR_004097 | |
| Other | Hoechst 33342 stain | Thermo Fisher | H3570 | 10 μg/ml |
| Other | Streptavidin Agarose Resin | Thermo Fisher | 20353 | |
| Other | TRI-Reagent | Molecular Research Center Euromedex | TR118-200 | RNA extraction |
Author response table 1
Antigenicity of HDV particles.
RT-qPCR assay quantifying HDV RNA in the supernatants of producer cells was used to normalize preparations of viral particles prior to being subjected to ELISA specific for the AGL determinant. The results are presented as fold-change relative to that of the wt. GE: HDV RNA genome equivalents; no-GP: supernatants of Huh7 cells transfected with a trimer of HDV cDNA (pSVL-D3) and an empty plasmid; wt-LMS: supernatants of Huh7 cells transfected with pSVL-D3 and HBV wt LMS envelope proteins; Wt-S: HBV S only; LMS(T303C): HBV LMS envelope proteins bearing a T140C mutation; LMS(TG/CC): HBV LMS envelope proteins bearing T140C and G145C mutations.
| MUREX | 1E4 GE | 1E5 GE | CLIA | 1E4 GE | 1E5 GE |
|---|---|---|---|---|---|
| no-GP | neg | neg | no-GP | neg | neg |
| wt-LMS | 1.00 | 1.00 | wt-LMS | 1.00 | 1.00 |
| wt-S | 1.20 | 1.13 | wt-S | 1.64 | 1.43 |
| LMS(T303C) | 0.91 | 0.97 | LMS(T303C) | neg | neg |
| LMS(TG/CC) | neg | neg | LMS(TG/CC) | neg | neg |
Additional files
-
Supplementary file 1
Oligonucleotide sequences used for shRNAs and mutagenesis.
The sequences correspond to the oligonucleotides used to generate the lentiviral vectors carrying shRNA against the indicated protein disulfide isomerases (PDIs) in Figure 7 or the hepatitis B virus glycoprotein (HBV GP) mutants described in Figure 2 (preS1 and preS2 mutants) and in Figures 4 and 5 (CSD mutants).
- https://cdn.elifesciences.org/articles/64507/elife-64507-supp1-v2.xlsx
-
Transparent reporting form
- https://cdn.elifesciences.org/articles/64507/elife-64507-transrepform-v2.pdf
Download links
A two-part list of links to download the article, or parts of the article, in various formats.
Downloads (link to download the article as PDF)
Open citations (links to open the citations from this article in various online reference manager services)
Cite this article (links to download the citations from this article in formats compatible with various reference manager tools)
A fusion peptide in preS1 and the human protein disulfide isomerase ERp57 are involved in hepatitis B virus membrane fusion process
eLife 10:e64507.
https://doi.org/10.7554/eLife.64507


