Development of antibacterial compounds that constrain evolutionary pathways to resistance
- School of Science, China Pharmaceutical University, China
- Department of Chemistry and Chemical Biology, Harvard University, United States
Figures
Figure 1 with 9 supplements
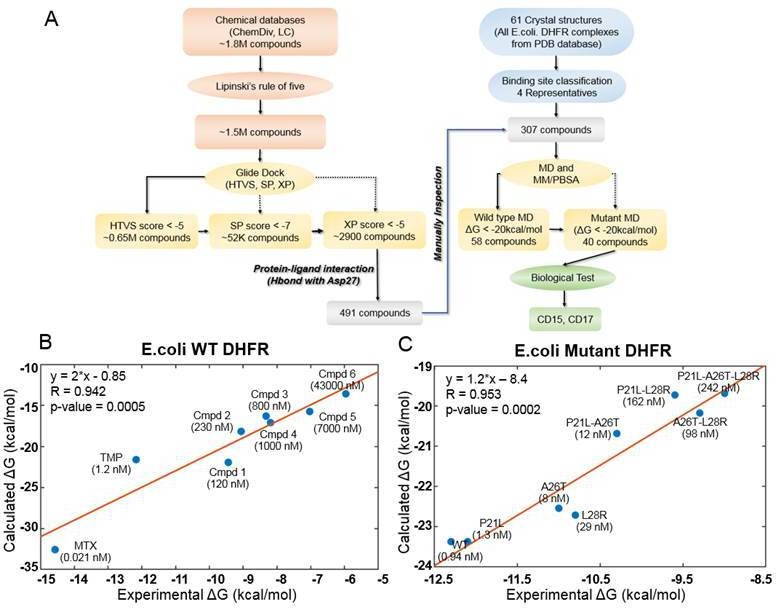
Computational design of broadly neutralizing DHFR inhibitors effective against WT and resistant DHFR mutant strains.
(A) Integrative virtual screening workflow. Detailed description of the virtual screening workflow can be found in Method and Materials: Selection of virtual screening hits. (B) Linear model for binding affinity prediction constructed using known binding affinities of eight known inhibitors of WT E. coli DHFR (Figure 1—figure supplement 4) obtained from Carroll et al., 2012. (C) Linear model for binding affinity prediction constructed using experimental inhibitory activity for TMP against WT DHFR and seven resistant DHFR mutants (Rodrigues et al., 2016). MD simulation and MM/PBSA affinity evaluation protocol (Cheron and Shakhnovich, 2017) was applied to calculated binding free energy of complexes of E. coli DHFR with eight known inhibitors and the calculated values were compared with the reported experimental binding affinities (Kd or Ki values).
Figure 1—figure supplement 1
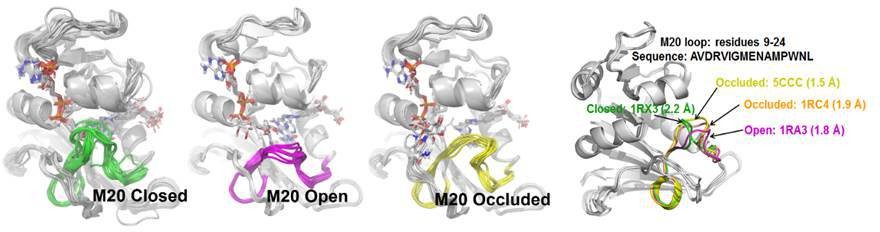
Three different types of M20 loops in E. coli DHFR.
In the crystal structures of E. coli DHFR, the M20 loop (residues 9–24) has three major types of conformation (open, closed and occluded) (Falzone et al., 1994) that are important for catalysis.
Figure 1—figure supplement 2
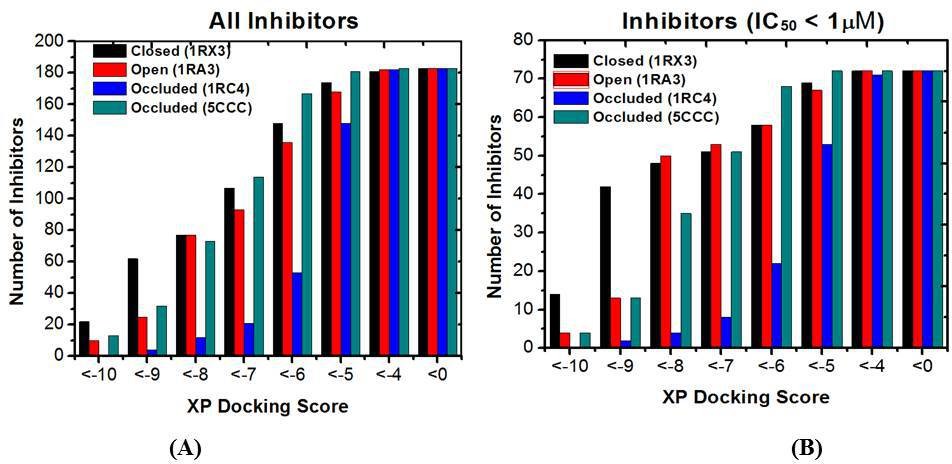
The number distribution of inhibitors with a given XP docking score.
(A) All 183 inhibitors; (B) 72 Inhibitors with IC50 values less than 1 μM. Lower scores correspond to stronger binding.
Figure 1—figure supplement 3

The scatter plot experimentally measured activities of DHFR inhibitors vs their XP docking score with various DHFR conformations as targets.
(A) All 183 inhibitors; (B) 72 Inhibitors with IC50 values less than 1 μM.
Figure 1—figure supplement 4

Compounds used for building the binding affinity prediction model.
Figure 1—figure supplement 5
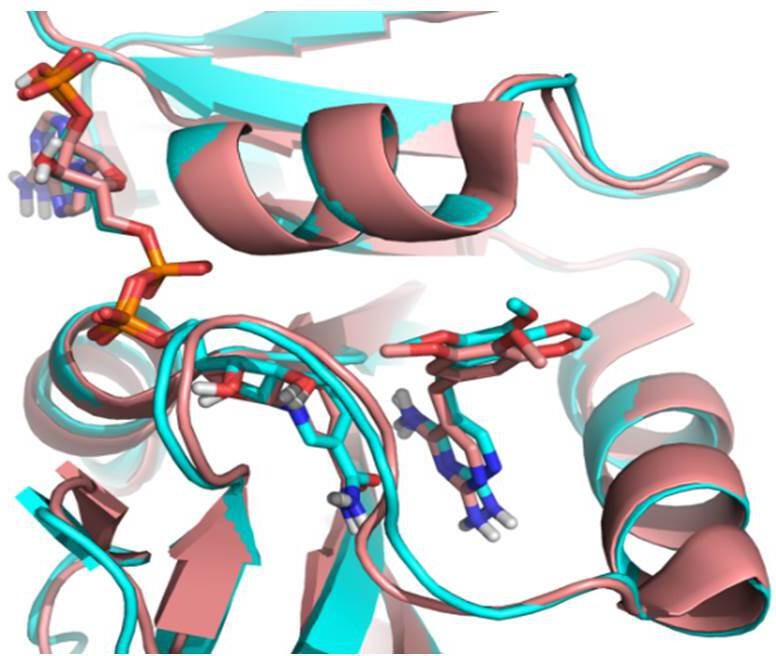
Comparison of docked TMP in E. coli DHFR (cyan, PDB 1RX3) with crystalized TMP with Staphylococcus aureus DHFR (salmon, PDB: 2W9G).
Figure 1—figure supplement 6
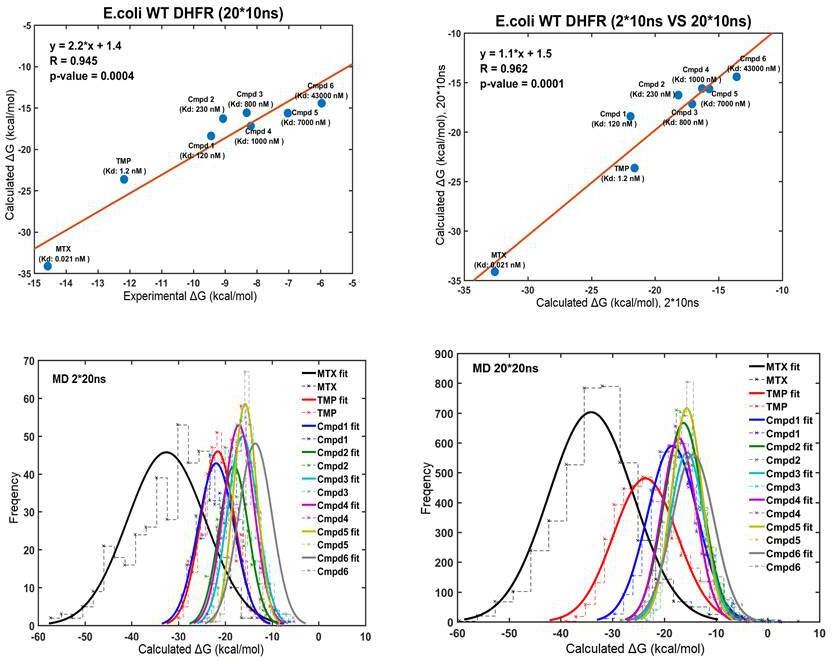
Linear correlation between the computational and experimental binding Gibbs-free energies for eight compounds against WT E. coli DHFR (upper panel).
Normal distribution of binding free energies (lower panel).
Figure 1—figure supplement 7
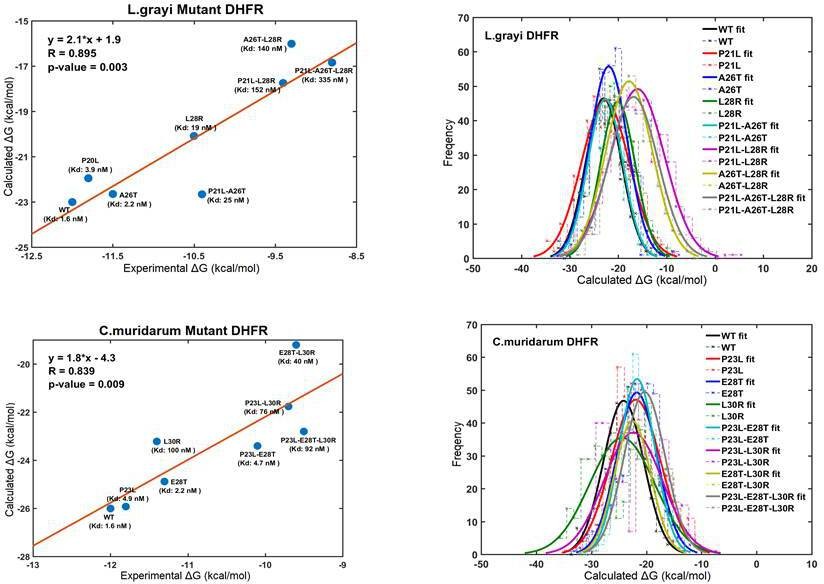
Correlation and linear models for the calculated and experimental binding Gibbs-free energies for TMP against WT and mutant Listeria grayi (upper panel) and Chlamydia muridarum DHFR (lower panel).
Normal distribution of binding free energies (right panel).
Figure 1—figure supplement 8
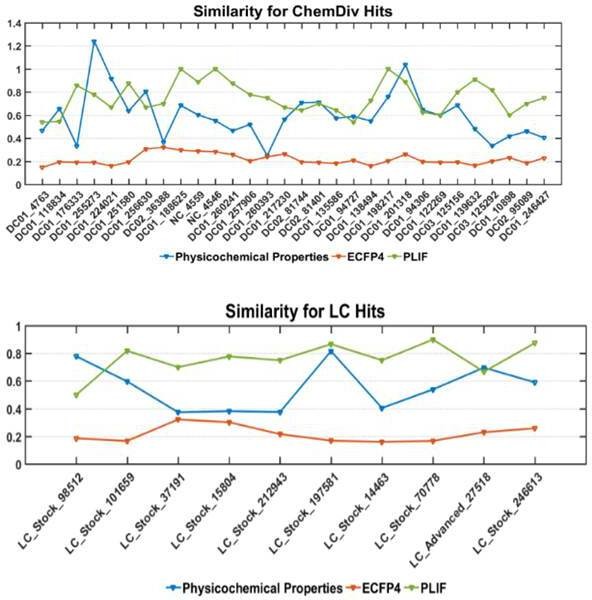
Similarity comparison between the selected hits with the known inhibitors using physicochemical properties, structure (represented by ECFP4) and PLIF. ChemDiv hits and LC hits represent hit compounds screened from ChemDiv and Life Chemicals database, respectively.
Figure 1—figure supplement 9
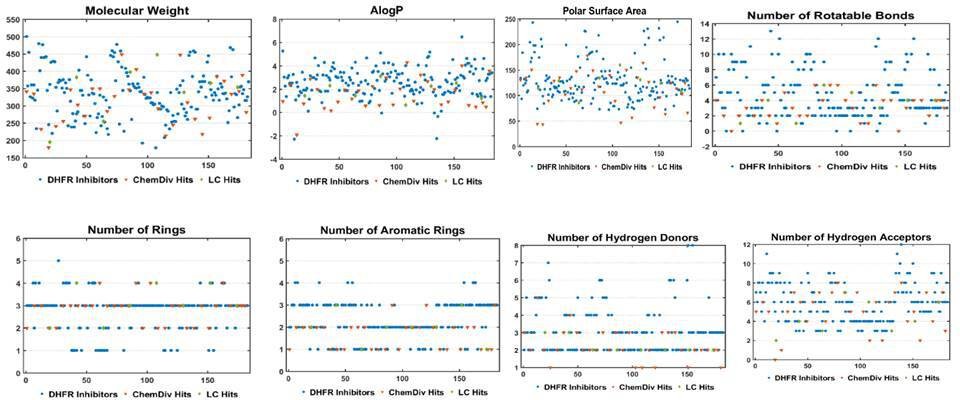
Two-dimensional chemical space of physiochemical properties for the selected hits with the known DHFR inhibitors.
Figure 2 with 1 supplement

Evaluation of the potential hits in vitro and their optimization.
(A–B) An in vitro kinetic assay of DHFR catalytic activity was used to screen inhibitors against WT DHFR and three single mutants resistant to TMP (P21L, A26T and L28R). (C) Chemical structures of the top three compounds showing simultaneously the highest potency against WT and mutant DHFR variants. The structure of trimethoprim is shown for comparison.
Figure 2—figure supplement 1
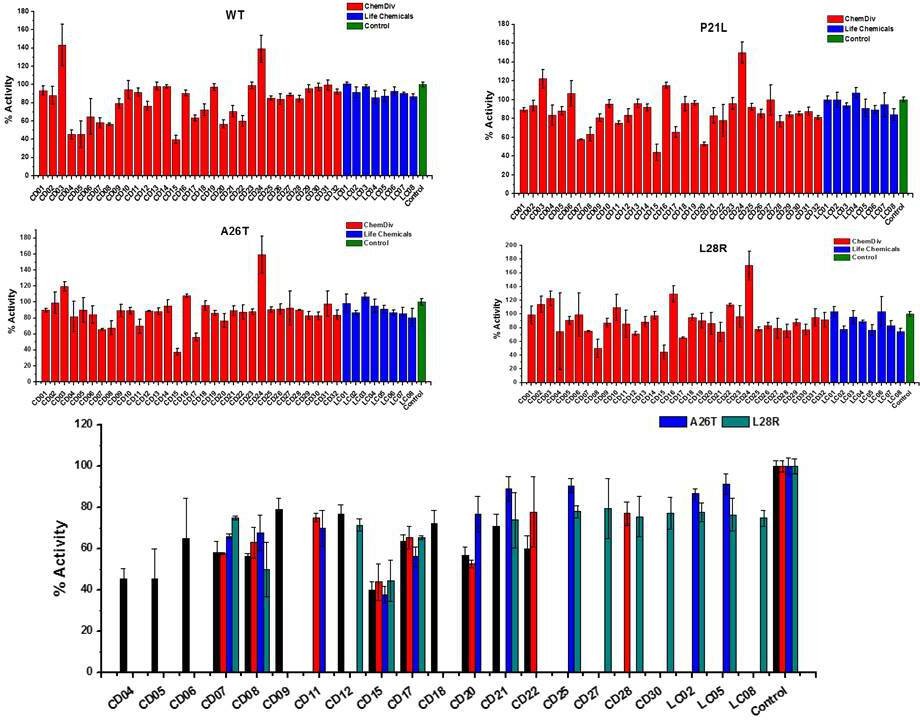
The initial inhibition rate of catalytic activity of the selected 40 hits against WT and three DHFR mutants at a single concentration of 200 µM.
Each experiment was conducted in triplicates.
Figure 3

Inhibition of WT and mutant DHFR from different species by CD15 and CD17.
(A) Concentration-dependent inhibition curves for compound CD15 for WT and mutant DHFR of E. coli (left panel) and for WT DHFR from E. coli, L.grayi, and C.muridarum, respectively (right panel). (B) Concentration-dependent inhibition curves for compound CD17 on WT and mutant DHFR of E. coli (left panel) and of WT DHFR from E. coli, L. grayi, and C. muridarum, respectively (right panel). The %Activity of the y-axis is represented by the decrease of fluorescence at 450 nm for the reaction system (see Materials and methods for more detail).
Figure 4 with 2 supplements
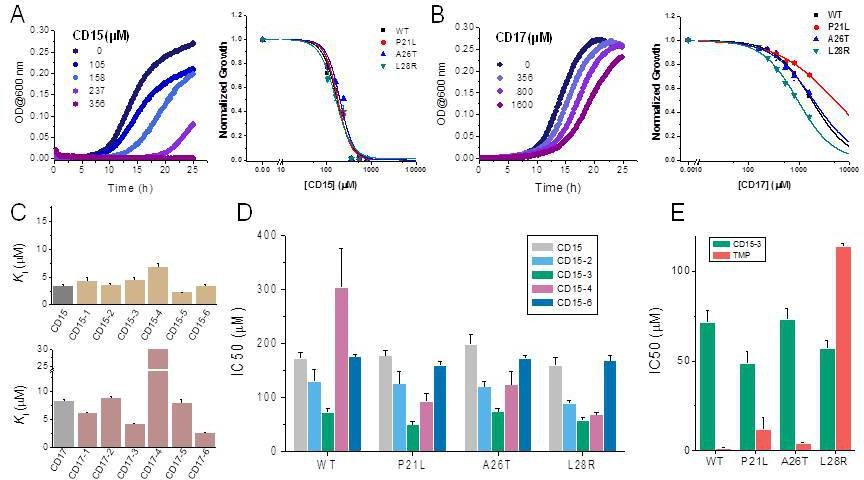
Compounds CD15 and CD17 inhibit growth of WT and TMP-resistant mutant E. coli strains.
(A) Growth curves for WT strain (left panel) at different concentrations of CD15 and normalized (by maximal growth in the absence of stressor) inhibition by CD15 curves for WT and various TMP-resistant DHFR mutants. (B) same as A for CD17. Measurements in the presence of different drug concentrations were performed in a 96-well microplate at 37°C. (C) Optimization of compounds CD15 (upper panel) and CD17 (lower panel) lead to hits with increased in vitro inhibitory potency toward WT E. coli DHFR. (D) The CD15 series compounds inhibit growth of WT and resistant mutant E. coli strains. For each strain, growth measurements were performed in the presence of varying concentrations of compounds. (E) Comparison of IC50 of inhibition of growth of WT and TMP-resistant mutant E. coli strains for CD15-3 and TMP.
Figure 4—figure supplement 1
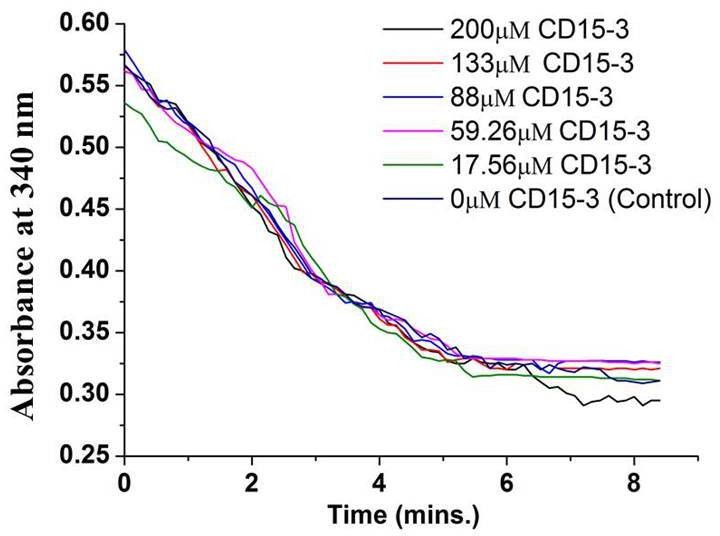
Activity assay for human DHFR in absence (0 µM) and presence of CD15-3 (17.56–200 µM) carried out at 25°C.
Decrease in the fluorescence signal at 450 nm (which corresponds to conversion of NADPH and DHFR-mediated formation of THF from DHF) was found to occur at all the concentrations of CD15-3 used.
Figure 4—figure supplement 2
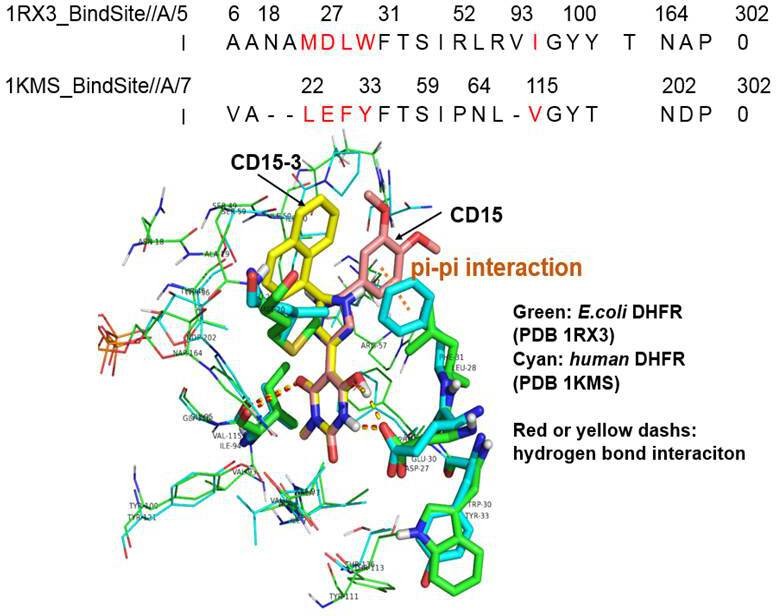
Sequence and structural alignment of the binding site for E. coli DHFR and human DHFR.
The upper panel shows the binding site sequence alignment of E. coli DHFR (PDB 1RX3) and human DHFR (PDB 1KMS), with amino acid/sequence differences shown in red color. The lower panel demonstrates the structural comparison of binding site for E. coli DHFR (PDB 1RX3, colored green) and human DHFR (PDB 1KMS, colored cyan). CD15-3(colored yellow) and CD15 (colored salmon) are docked to the binding site of human DHFR (PDB 1KMS). The red dashes are the hydrogen bond for CD15-3 to E. coli DHFR and human DHFR. The yellow dashes are the hydrogen bond for the CD15 to E. coli DHFR and human DHFR. The orange dash shows the pi-pi interaction between CD15 and human DHFR (PDB 1KMS).
Figure 5 with 1 supplement
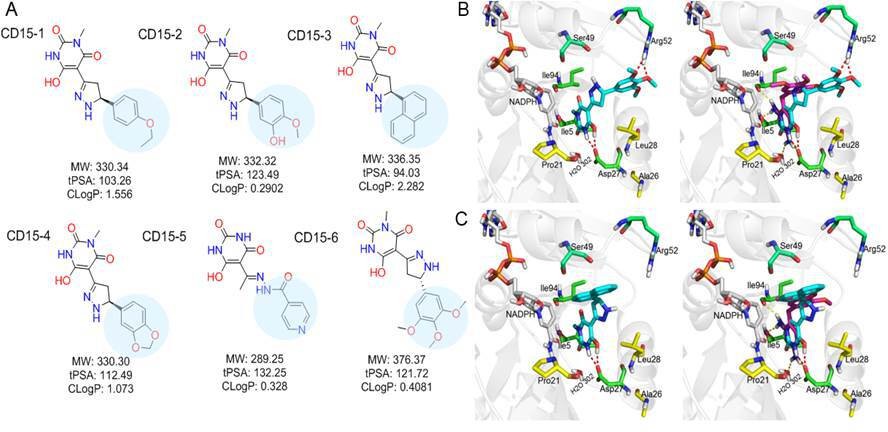
Optimization of the compounds of CD15 series (A) Chemical structures of 2nd generation variants of compound CD15 selected for further experimental testing.
(B) The binding interaction of CD15 with DHFR (left panel) and the alignment of CD15 (cyan stick) with TMP (purple stick) in the binding pocket (right panel). (C) The binding interaction of CD15-3 with DHFR (left panel) and the alignment of CD15-3 (cyan stick) with TMP (purple stick) in the binding pocket (right panel).
Figure 5—figure supplement 1

Growth rate profiles of WT E. coli cells with empty pBAD-plasmid and with WT DHFR and functionally inactive D27F mutant form of DHFR.
Expression was induced using 0.005 % Arabinose and cells were grown in M9 media. Plot shows overexpression of functional form of DHFR that is WT DHFR can recover the growth rates of cells growing in presence of TMP. Overexpression of D27F failed to recover growth rates of TMP-treated cells.
Figure 6
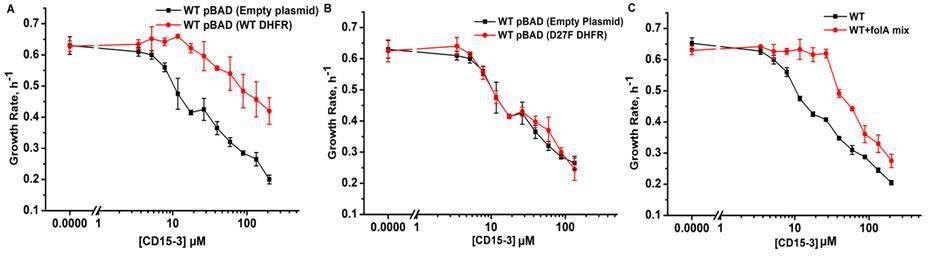
Overexpression of functional (WT) DHFR shows partial recovery from CD15-3 induced growth inhibition.
(A) Overexpression of WT DHFR using pBAD-promoter and at 0.005 % arabinose induction showed improvement in growth rates compared to WT cells with empty pBAD-plasmid (lacking DHFR gene) under conditions of CD15-3 treatment. (B) Comparative growth rate profiles of WT cells (with empty pBAD-plasmid) and WT cells overexpressing D27F inactive mutant of DHFR. The growth rate profiles clearly show that D27F mutant of DHFR could not rescue cells from CD15-3-induced growth inhibition. (C) Comparative growth rate profiles of WT cells grown in presence of folA mix supplement under conditions of CD15-3 treatment. Cells grown in presence of folA mix metabolic supplementation showed partial rescue in growth under conditions of CD15-3 treatment.
Figure 7
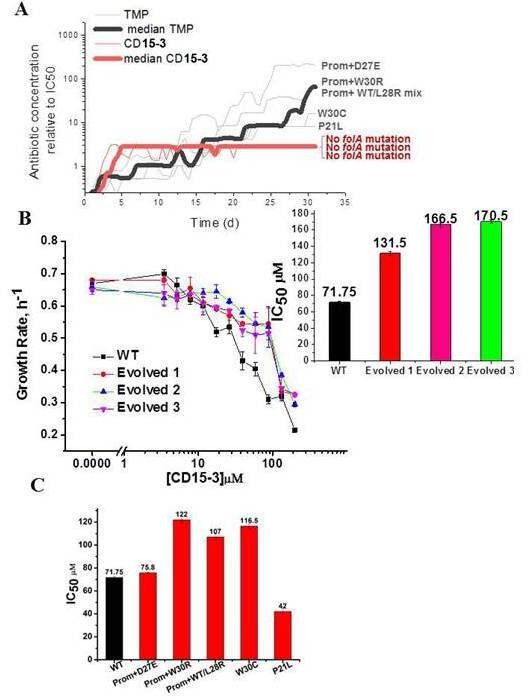
Resistance to CD15-3 evolves slowly.
(A) Gray and red traces show evolution of antibiotic resistance against TMP and CD15-3, respectively. Red (bold) and black (bold) traces shows the median traces of three replicate evolutionary trajectories under selection pressure from CD15-3 and TMP, respectively. Under pressure from TMP cells evolved TMP resistance with IC50 between 8- and 200-fold higher than original naïve E. coli strain. Cells evolved under CD15-3 treatment showed IC50 values for CD15-3 between 131.5µM and 170.5 µM which is about twofold higher in comparison to IC50 for naive WT. The antibiotic concentrations represented were obtained for a single evolutionary trajectory and are normalized to IC50 of naive cells to TMP and CD15-3 (1.3 µM and 71.75 µM, respectively). Cells which evolved under TMP treatment (TMP escape) in individual evolution trajectories showed D27E, W30R, W30C and P21L mutations in the folA locus along with several other mutations outside of folA. One of the TMP trajectories had a mix of WT and L28R population along with promoter mutation. No mutation in the folA locus was observed in the CD15-3 evolved cells. (B) Growth rates in WT and evolved strain in a range of CD15-3 concentrations showing weak resistance of evolved strains. Inset shows the differences in IC50 values in WT and evolved forms (from three evolution trajectories). (C) CD15-3 also inhibits the growth of the TMP escape mutant. D27E escape mutant had similar IC50 to CD15-3 as is observed with the naive/WT. IC50 for CD15-3 obtained for W30R, W30C and WT/L28R mix set was found to be less than twofold higher than the WT.
Figure 8
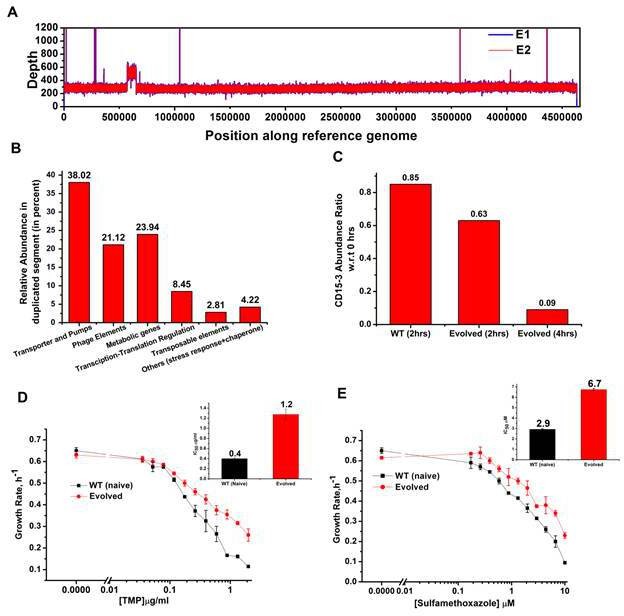
Whole genome sequence of evolved variant revealed region of genome duplication.
(A) Whole genome sequence display of the evolved form on alignment to BW25113 reference genome. The display shows regions of duplication as observed by increased height as per depth axis. (B) Bar plot showing the relative abundance of genes which constitutes duplicate segment in the genome of evolved form. (C) Bar plot showing the relative intracellular concentration of CD15-3 (with respect to the intracellular concentration in naïve cells at zero hour) in naive and evolved strains at various time points of treatment. (D) CD15-3-evolved cells show cross resistance to other antibiotics. Growth rate profiles of WT (naive) and CD15-3-evolved cells grown under varying concentrations of trimethoprim (TMP). CD15-3-evolved cells grow better under TMP treatment and have almost three fold higher IC50 (shown in inset) compared to WT (naive). (E) Growth rate profiles of WT (naive) and CD15-3-evolved cells grown in presence of Sulfamethoxazole shows CD15-3-evolved cells grow better compared to WT (naive) cells (as reflected by the growth rates). CD15-3-evolved cells show somewhat higher IC50 compared to WT (naive) when grown in presence of Sulfamethoxazole (shown in in inset).
Figure 9
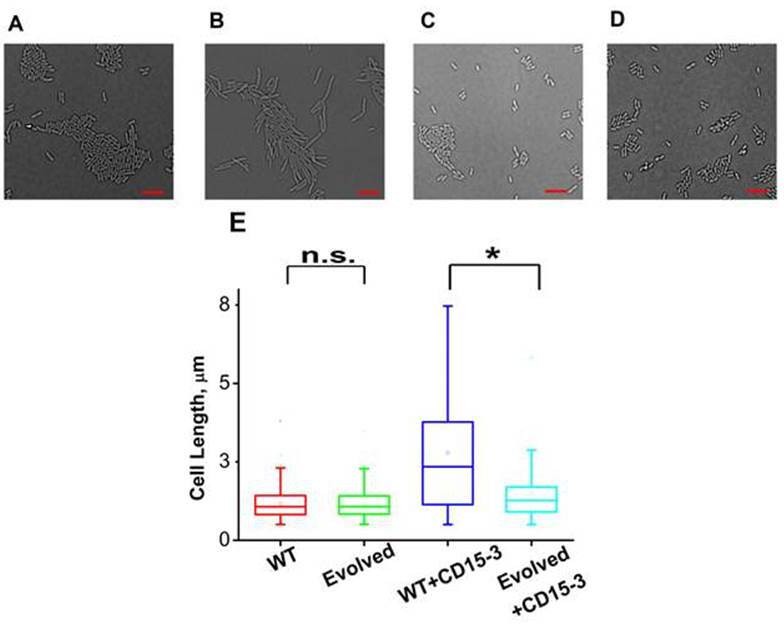
CD15-3 treatment leads to stress-induced morphological changes in WT E. coli cells.
DIC image of WT cells under (A) control (no CD15-3 treatment) and (B) treated (CD15-3 treatment) conditions. (C) DIC image of evolved E. coli cells under control (no CD15-3 treatment) and (D) CD15-3-treated condition. (E) Distribution of cell lengths as derived from DIC imaging of WT and evolved cells under control and CD15-3 treatment conditions. Scale bar corresponds to a cell length of 2 µm. Untreated WT (naive) and evolved cells had comparable cell lengths with median cell lengths of 1.07 µm. (n.s. indicates the distribution of cell lengths were not significantly different, Mann-Whitney test, p-value = 0.961). Both WT and evolved cells were subjected to CD15-3 treatment at IC50 concentrations. WT-treated cells were observed to have a filamentous morphology and the median cell length (2.34 µm.) double of that of the untreated WT set. Evolved cells after CD15-3 treatment had a median cell length of 1.26 µm which is slightly higher than that of untreated set. But the cell size distribution of the evolved cells showed much less change after CD15-3 treatment compared to that observed for the WT (* indicates the distribution of cell lengths were significantly different, Mann-Whitney test, p-value < 0.001).
Tables
Table 1
The Ki values (in µM) for compounds CD15 and CD17.
| Species | DHFR type | CD15 | CD17 | CD15-3 | TMP | |||||
|---|---|---|---|---|---|---|---|---|---|---|
| Ki value | STD* | Ki value | STD | Ki value | STD | Kivalue | STD | |||
| E. coli | WT | 3.35 | 0.28 | 8.18 | 0.29 | 5.52 | 0.98 | 0.90 × 10⁻³ | 0.10 × 10⁻³ | |
| P21L | 1.42 | 0.04 | 3.70 | 0.13 | 2.51 | 0.31 | 1.10 × 10⁻³ | 0.10 × 10⁻³ | ||
| A26T | 2.43 | 0.37 | 6.73 | 1.02 | 3.48 | 0.18 | 8.50 × 10⁻³ | 0.80 × 10⁻³ | ||
| L28R | 1.04 | 0.07 | 3.65 | 0.33 | 0.98 | 0.11 | 29.0 × 10⁻³ | 2.00 × 10⁻³ | ||
| P21L-A26T | 3.26 | 0.21 | 9.20 | 0.71 | ||||||
| P21L-L28R | 0.56 | 0.05 | 1.37 | 0.06 | ||||||
| A26T-L28R | 0.61 | 0.04 | 2.04 | 0.11 | ||||||
| L. grayi | WT | 5.01 | 0.29 | 16.17 | 1.70 | |||||
| C. muridarum | WT | 14.60 | 0.64 | 32.38 | 2.53 | |||||
| Human | WT | 0.38 | 0.05 | 0.74 | 0.10 | NT† | ||||
-
*
STD means the standard error from three duplicate experiments.
-
†
NT means no inhibition was detected at the maximal compound concentration tested.
Table 2
The IC50 values for the in vivo inhibition of several CD15 and CD17 series compounds.
| DHFR | Bacterial growth inhibition IC50 (μM) | |||||||||||
|---|---|---|---|---|---|---|---|---|---|---|---|---|
| CD15 | STD* | CD15-2 | STD | CD15-3 | STD | CD15-4 | STD | CD15-6 | STD | TMP | STD | |
| WT | 170 | 12 | 129 | 22 | 72 | 6 | 302 | 74 | 175 | 4 | 1.3 | 0.4 |
| P21L | 176 | 10 | 125 | 24 | 57 | 7 | 92 | 15 | 159 | 6 | 12 | 2 |
| A26T | 197 | 18 | 119 | 11 | 73 | 6 | 123 | 25 | 172 | 4 | 3.9 | 0.7 |
| L28R | 159 | 14 | 88 | 6 | 48 | 5 | 67 | 4 | 167 | 10 | 114 | 7 |
| DHFR | Bacterial growth inhibition IC50 (μM) | |||||||||||
| CD17 | STD | CD17-3 | STD | CD17-4 | STD | |||||||
| WT | 1,774 | 22 | 2,946 | 967 | ND† | ND | ||||||
| P21L | 5,048 | 809 | 2,845 | 437 | ND | ND | ||||||
| A26T | 1920 | 135 | 2,152 | 265 | ND | ND | ||||||
| L28R | 932 | 44 | 907 | 57 | 1,857 | 272 | ||||||
-
*
STD means the standard error from three duplicate experiments.
-
†
ND (not determined) indicates no result was obtained for the compound against WT and three mutant DHFR.
Table 3
folA locus mutation and IC50 values of TMP and CD15-3 resistant colonies which appeared on the TMP and CD15-3 plates.
| Colony no | Selection | folA mutation | Mean IC50 fold increase (w.r.t. WT) | Colony no | Selection | folA mutation | Mean IC50 fold increase (w.r.t. WT) | |
|---|---|---|---|---|---|---|---|---|
| Culture 1 | 1 | TMP | L28R | 100 | 1 | CD15-3 | no | 1.9 |
| 2 | TMP | L28R | 110 | 2 | CD15-3 | no | 1.8 | |
| 3 | TMP | M20I | 7 | 3 | CD15-3 | no | 2 | |
| 4 | TMP | no | 10.6 | 4 | CD15-3 | no | 2.3 | |
| 5 | TMP | W30C | 23.3 | 5 | CD15-3 | no | 2.3 | |
| 6 | TMP | no | 14 | 6 | CD15-3 | no | 2.2 | |
| Culture 2 | 1 | TMP | no | 12 | 1 | CD15-3 | no | 2.1 |
| 2 | TMP | no | 10 | 2 | CD15-3 | no | 1.7 | |
| 3 | TMP | L28R | 100 | 3 | CD15-3 | no | 2.3 | |
| 4 | TMP | L28R | 114 | 4 | CD15-3 | no | 2.3 | |
| 5 | TMP | no | 10.4 | 5 | CD15-3 | no | 2 | |
| 6 | TMP | P21L | 2.5 | 6 | CD15-3 | no | 1.9 | |
| Culture 3 | 1 | TMP | P21L | 3 | 1 | CD15-3 | no | 2.3 |
| 2 | TMP | no | 12 | 2 | CD15-3 | no | 2 | |
| 3 | TMP | M20I | 5 | 3 | CD15-3 | no | 1.8 | |
| 4 | TMP | no | 10 | 4 | CD15-3 | no | 1.7 | |
| 5 | TMP | no | 7 | 5 | CD15-3 | no | 1.9 | |
| 6 | TMP | L28R | 110 | 6 | CD15-3 | no | 2.1 |
Table 4
Number of known inhibitors binding DHFR with different M20 loops through molecular docking.
| XP docking score threshold | All inhibitors (IC50: 1 nM~240 μM) | Inhibitors (IC50 <1 μM) | ||||||
|---|---|---|---|---|---|---|---|---|
| Closed (1RX3) | Open (1RA3) | Occluded (1RC4) | Occluded (5CCC) | Closed (1RX3) | Open (1RA3) | Occluded (1RC4) | Occluded (5CCC) | |
| < –10 | 22 | 10 | 1 | 13 | 14 | 4 | 0 | 4 |
| < –9 | 62 | 25 | 4 | 32 | 42 | 13 | 2 | 13 |
| < –8 | 77 | 77 | 12 | 73 | 48 | 50 | 4 | 35 |
| < –7 | 107 | 93 | 21 | 114 | 51 | 53 | 8 | 51 |
| < –6 | 148 | 136 | 53 | 167 | 58 | 58 | 22 | 68 |
| < –5 | 174 | 168 | 148 | 181 | 69 | 67 | 53 | 72 |
| < –4 | 181 | 182 | 182 | 183 | 72 | 72 | 71 | 72 |
| < 0 | 183 | 183 | 183 | 183 | 72 | 72 | 72 | 72 |
Author response table 1
Calculated binding free energy of TMP, CD15 and CD15-3 against E. coli WT and L28R DHFR and human DHFR, respectively.
| Molecular Dynamics a | MM/PBSA (kcal/mol) | ||
|---|---|---|---|
| 1st | 2nd | Average | |
| EcDHFRb WT_TMP | -25.24 | -26.23 | -25.74 |
| EcDHFR L28R_TMP | -24.44 | -21.57 | -23.01 |
| hDHFRc_TMP | -20.49 | -24.04 | -22.27 |
| EcDHFR WT_CD15 | -33.22 | -34.30 | -33.76 |
| EcDHFR L28R_CD15 | -27.68 | -28.61 | -28.15 |
| hDHFR_CD15 | -31.75 | -32.16 | -31.96 |
| EcDHFR WT_CD15-3 | -32.38 | -31.80 | -32.09 |
| EcDHFR L28R_CD15-3 | -31.60 | -34.29 | -32.95 |
| hDHFR_CD15-3 | -20.02 | -11.72 | -15.87 |
Additional files
-
Transparent reporting form
- https://cdn.elifesciences.org/articles/64518/elife-64518-transrepform1-v2.pdf
-
Supplementary file 1
Compound Information.
- https://cdn.elifesciences.org/articles/64518/elife-64518-supp1-v2.xlsx
-
Supplementary file 2
Duplicated Genome Stretch.
- https://cdn.elifesciences.org/articles/64518/elife-64518-supp2-v2.xlsx
Download links
A two-part list of links to download the article, or parts of the article, in various formats.
Downloads (link to download the article as PDF)
Open citations (links to open the citations from this article in various online reference manager services)
Cite this article (links to download the citations from this article in formats compatible with various reference manager tools)
Development of antibacterial compounds that constrain evolutionary pathways to resistance
eLife 10:e64518.
https://doi.org/10.7554/eLife.64518


