CDK control pathways integrate cell size and ploidy information to control cell division
- Cell Cycle Laboratory, The Francis Crick Institute, United Kingdom
- College of Engineering, Swansea University, United Kingdom
- Imaging Platform, Broad Institute of Harvard and MIT, United States
- Laboratory of Yeast Genetics and Cell Biology, Rockefeller University, United States
Figures
Figure 1 with 6 supplements
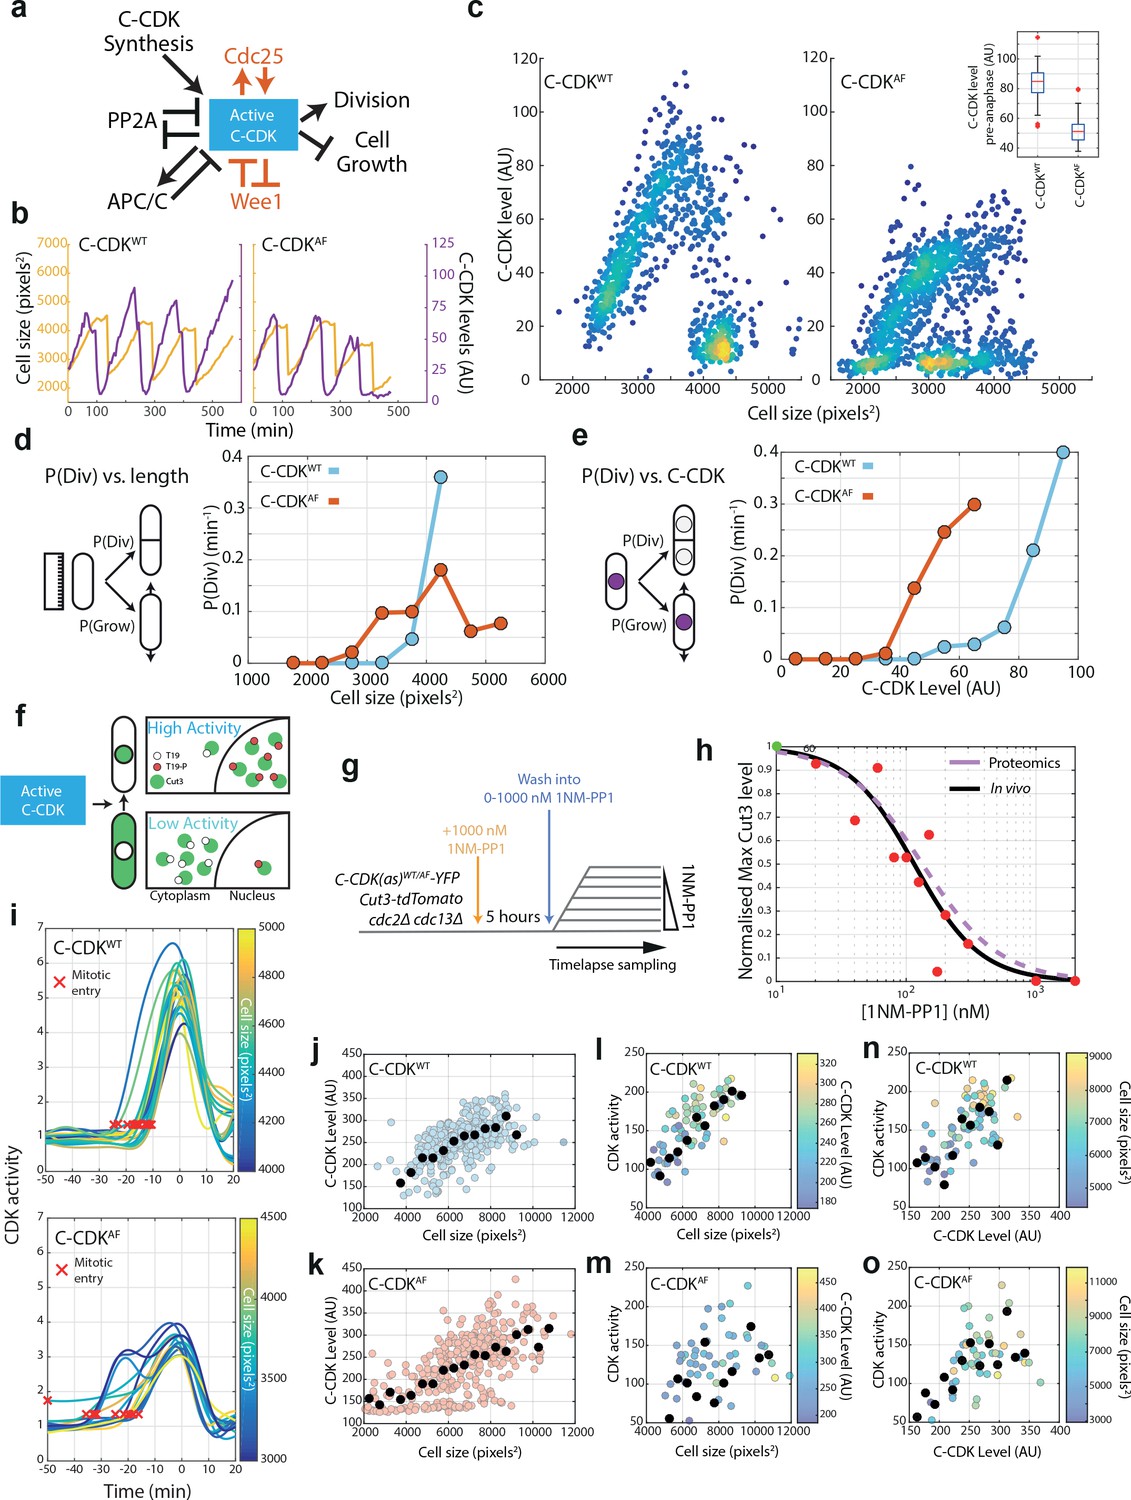
Cell size and C-CDK concentration dictate probability of division and CDK activity in C-CDKWT and C-CDKAF cells.
(a) Schematic of major components influencing C-CDK activity at mitosis, and in red, the pathways that do not influence C-CDKAF. The negative relationship between C-CDK activity and cell growth refers to the block of cell length extension in mitosis. PP2A opposes CDK activity by dephosphorylating CDK substrates, and also by opposing the activation of CDK at mitosis by opposing the phosphorylation of Wee1 and Cdc25. Reciprocally, CDK causes the downregulation of PP2A activity in mitosis. (b) Example cell lineage traces from time-lapse microscopy. Cell size in pixels2 is given in orange, and C-CDK-YFP fluorescence intensity is given in purple. Steep decreases in cell size traces correspond to cell division. (c) Scatter plot of mean C-CDK level vs cell size from time-lapse microscopy data. C-CDK level is a measure of C-CDK-YFP fluorescence intensity. Colours indicate density of data. Inset boxplot is mean nuclear C-CDK concentration immediately prior to degradation at anaphase. Boxes represent interquartile range, with whiskers delimiting 5th–95th percentiles. C-CDKWT n = 28, C-CDKAF n = 44 full cycles. (d) Plot of the probability of division at the next timepoint (P(Div)) vs cell length for CDKWT and CDKAF. Cells were followed through time-lapse microscopy with measurements taken each frame. P(Div) defined as the proportion of cells that undergo C-CDK degradation at anaphase by the next timepoint, given as rate per minute. Points represent cells binned by size, with points plotted at bin centre. C-CDKWT n = 685, C-CDKAF n = 961 timepoints. (e) Plot of P(Div) function vs C-CDK level for CDKWT and CDKAF. C-CDKWT n = 685, C-CDKAF n = 961 timepoints. C-CDK-YFP intensity measurements taken every frame from time-lapse microscopy, and binned by C-CDK level. (f) Schematic of Cut3 as a CDK activity reporter. Mitotic CDK-dependent phosphorylation of Cut3 on T19 results in nuclear translocation of the protein. (g) Experimental outline of block and release time-lapse experiment for panels (h, j–o). Asynchronous cells possessing an analogue sensitive (as) CDK were blocked in G2 using 1 μM 1NM-PP1 for 5 hr and then released into a range of 1NM-PP1 concentrations. Cells were then followed and monitored for their Cut3-tdTomato nuclear/cytoplasmic (N/C) ratio (C-CDK activity) and C-CDK-YFP level using fluorescence time-lapse microscopy (see Materials and methods). Data for (l–o) were acquired 15 min following release from 1NM-PP1. (h) Maximum CDK activity (normalized against maximum level, obtained by release into DMSO) against 1NM-PP1 concentration. Red points are the median of the data sets for each drug concentration (N = 324), and green point is median in DMSO. Black line is the Hill equation fit to the median data by a nonl-inear fitting algorithm (IC50 = 115.4, Hill coefficient = −1.71). Purple dashed line is Hill curve derived from Swaffer et al., 2016 dose–response data (IC50 = 133.4, Hill coefficient = −1.47). (i) Time-lapse quantification of CDK activity in asynchronous cells. Traces are aligned so that 0 min corresponds to peak Cut3-tdTomato N/C ratio. Curve smoothing could move Cut3 peak earlier/later than exactly 0 min. Trace colour indicates cell size. Red X indicates automatically defined mitotic entry point. C-CDKWTn = 23 and C-CDKAFn = 14. (j) Scatter plot of C-CDK-YFP levels against cell size. Experiment described in (g), with measurements taken before release from 1NM-PP1 block. Black points indicate binned data, bin window size 500 pixels2. n = 324. Pearson correlation coefficient: 0.55. (k) As in (j), but with C-CDKAF, n = 312. Pearson correlation coefficient: 0.62. (l) Scatter plot of peak Cut3-tdTomato level vs cell size. Experiment described in (g), with measurements taken 20 min after release from 1NM-PP1 block into DMSO. Black points indicate binned data, bin window size 500 pixels2. Points are coloured by YFP C-CDK levels at release. n = 83. R2 = 0.5040. Pearson correlation coefficient: 0.50. (m) As in (l), but with C-CDKAF, n = 81. R2 = 0.2150. Pearson correlation coefficient: 0.22. (n) Scatter plot of peak Cut3-tdTomato level vs C-CDK-YFP intensity level 20 min after release from 1NM-PP1 block into DMSO. Black points indicate binned data, bin window size 15 AU. Points are coloured by cell size at release. n = 83. R2 = 0.3668. Pearson correlation coefficient: 0.60. (o) As in (n), but with C-CDKAF, n = 81. R2 = 0.5501. Pearson correlation coefficient: 0.74.
Figure 1—figure supplement 1

Automated image analysis pipeline for wide-field imaging.
(a) Definition of the initial gross cell region and removal of excess background. A threshold was automatically computed using the Otsu algorithm from the standard deviation projection image. The blue region shows the binary mask of all pixels above this threshold. (b) The top z-stack image is both normalised and filtered to remove excess background and intensity variations using a Gaussian filter that removes most of the cell character, but retains information on gross brightfield intensity differences. The original image is then divided by this filter, homogenising the signal from the image. Once the brightfield image is processed, the previously generated cell region mask is applied. To generate an initial mask of single cells, a threshold is computed on the pixels within the initial cell region mask. (c) True cell–cell contacts exhibit concavities at both sides of any false contact, and the presence of the concavities can be used to license potential ‘cut’ lines. To generate potential cut lines, a watershed algorithm is applied to the distance image of the initial single-cell segmentation mask. (d) To remove any spuriously segmented background regions the standard deviation of the difference between the top and bottom z-stack images are used. A difference image generates heterogeneous pixel values in cell regions but has almost no effect on background regions. An example of an image with this standard deviation metric quantified in each mask can be seen is given, where non-cell masks feature a low value. (e) An example of the final segmented image after steps outlined in (a–d).
Figure 1—figure supplement 2
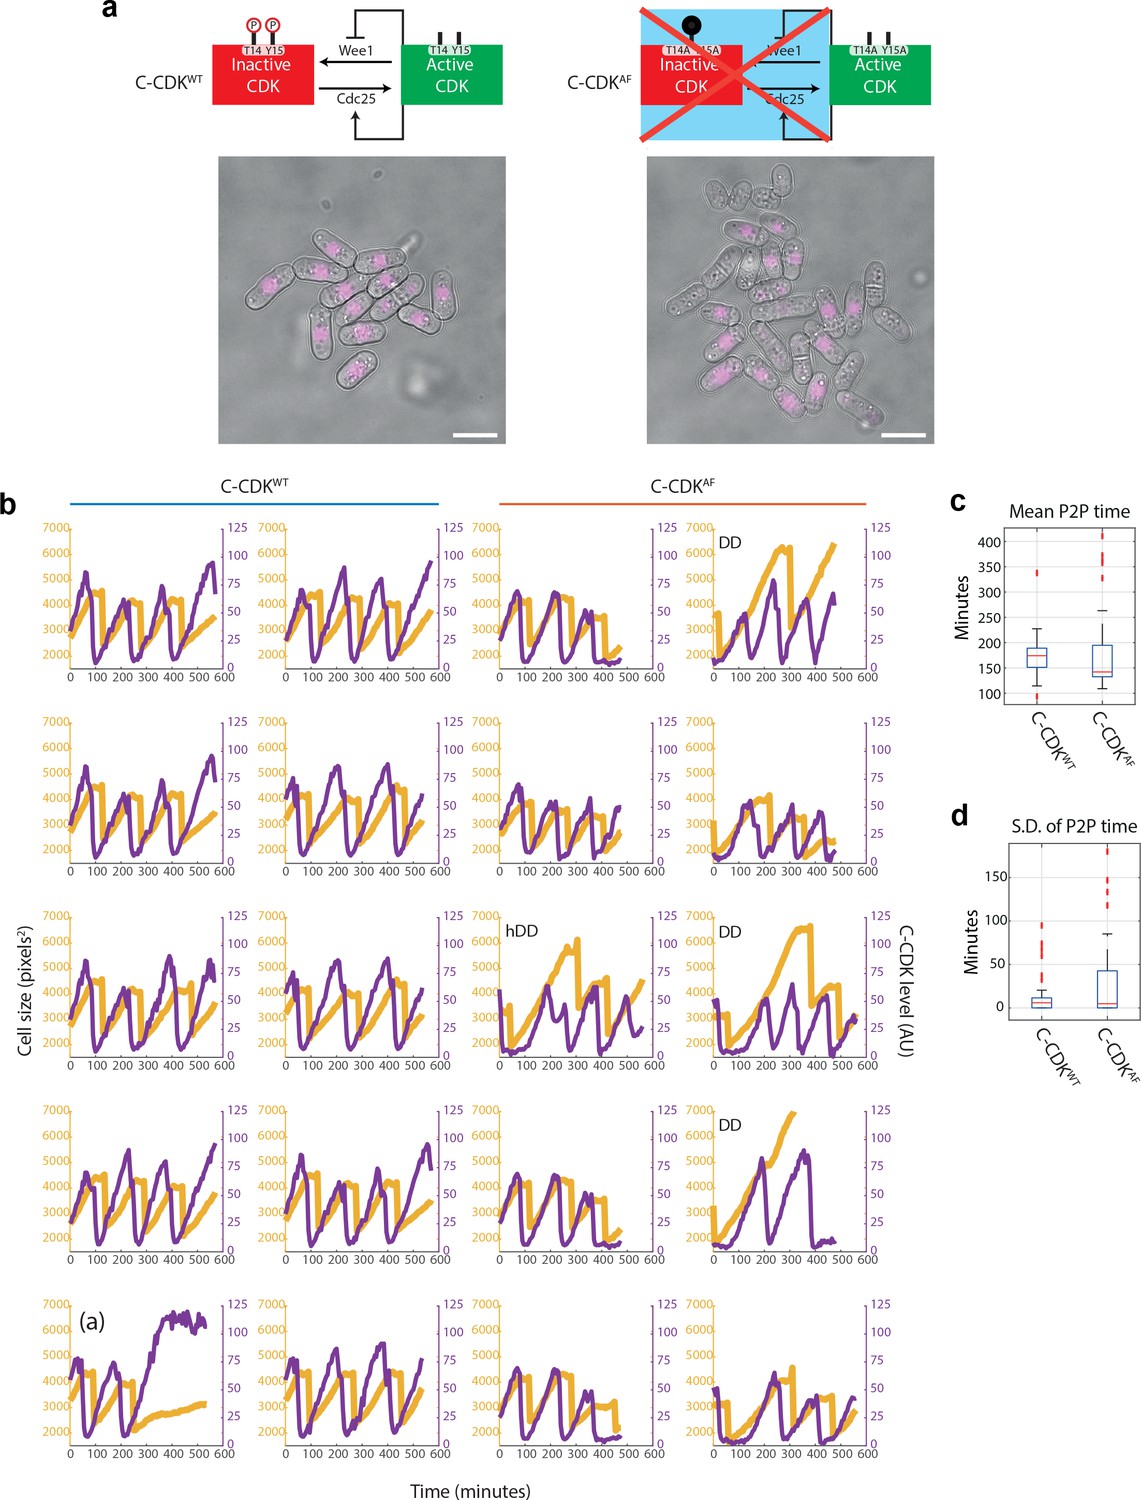
Fluorescence time-lapse quantification of C-CDK dynamics in unperturbed cell cycles.
(a) Schematics of C-CDKWT and C-CDKAF regulation by Wee1 kinase and Cdc25 phosphatase. C-CDKAF has T14 mutated to A and Y15 mutated to F to mimic constitutive dephosphorylation of both residues. Example images of a FOV from time-lapse movie is shown. Cells were grown in a Cellasics microfluidics plate following 2 days of culture in YE4S at 32°C. C-CDK-YFP is seen in purple. Scale bar = 10 μm. (b) Purple lines indicate C-CDK levels (mean nuclear concentration) and yellow lines indicate cell size (measured by cell mask area in pixels2). Cell mask and lineage tracing generated by Pomseg and Pomtrack (see Materials and methods). DD = double dip cell, hDD = half double dip cell. DD cells undergo complete cyclin degradation without cell division. hDD cells undergo incomplete cyclin degradation without division. Trace marked (a) represents an abberant cycle in a C-CDKWT expressing cell. (c) Boxplot of C-CDK oscillation period. Period was calculated by measuring the peak to peak (P2P) distance on the autocorrelation function of each C-CDK level lineage trace. C-CDKWT, N = 32; C-CDKAF, N = 57. Box represents median value delimited by 25th and 75th percentiles. See Materials and methods for outlier points. (d) Boxplot of intra-lineage standard deviation of period length. C-CDKWT, N = 32; C-CDKAF, N = 57. Box represents median value delimited by 25th and 75th percentiles. See Materials and methods for outlier points.
Figure 1—figure supplement 3
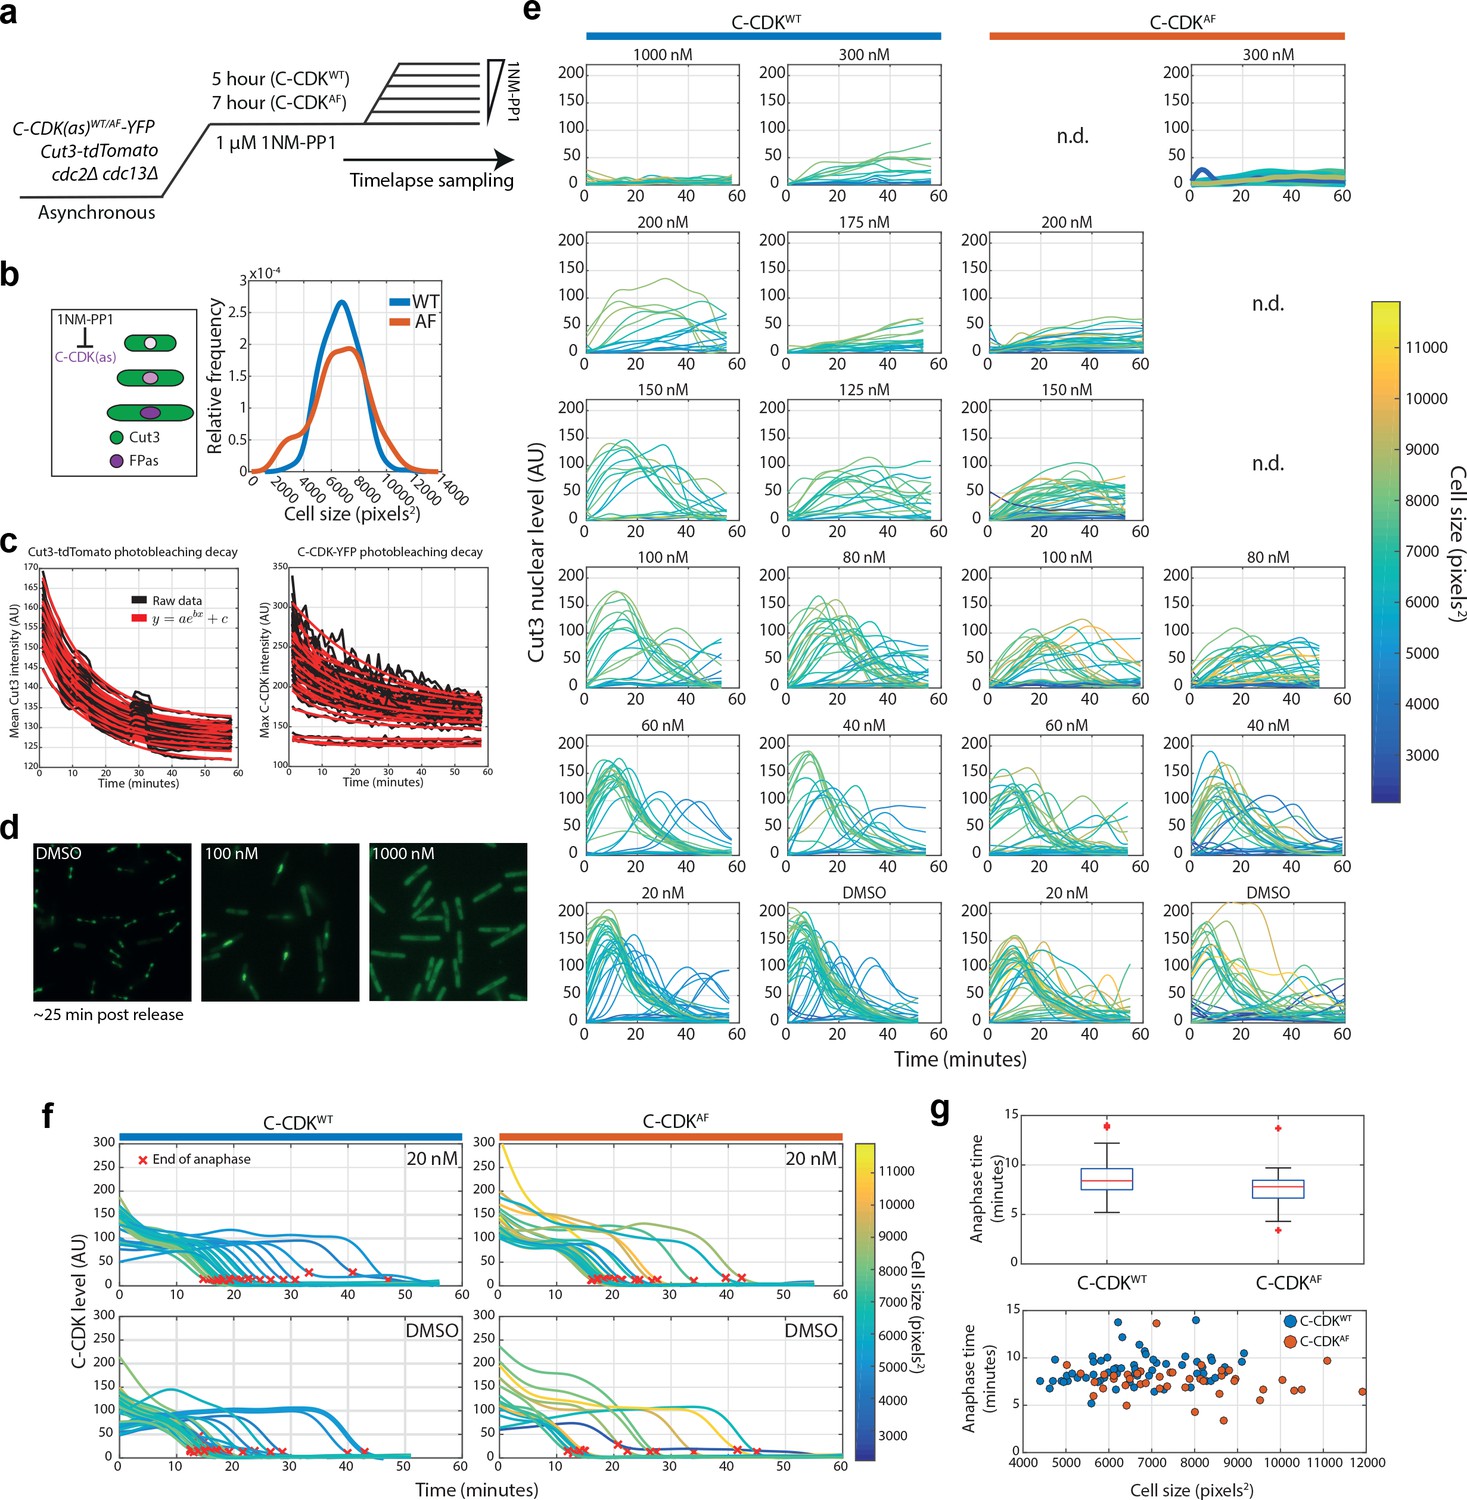
A time-lapse block and release assay to measure the effect of CDK inhibition on CDK activity in single cells.
(a) Experimental outline for (b–g). 1NM-PP1-sensitive C-CDKWT and C-CDKWT cells are blocked by addition of 1NM-PP1. C-CDKAF cells were block for longer (7 hr against 5 hr) to allow cells to reach a similar size distribution as C-CDKWT cells. Cells were then released into a range of 1NM-PP1 concentrations. After release, images were acquired every minute. Time between washing and image acquisition is ~5 min. Cells were grown in EMM at 32°C. (b) Left: Schematic demonstrating that as cells are blocked at G2/M, they continue to grow and accumulate C-CDK but do not translocate Cut3 into the nucleus or alter their levels of Cut3. Right: Density plot demonstrates the overlap population cell lengths of C-CDKWT and C-CDKWT cells after variable block times. (c) Black traces indicate raw data. Red traces indicate exponential curve fit to data. Photobleaching curves were derived from the 1000 nM release using C-CDKWT-YFP and Cut3-tdTomato. All subsequent measurements were corrected for photobleaching from derived curves. (d) Images of Cut3-GFP channel from representative FoV ~25 min after release from a 1 μM block into indicated drug concentrations. (e) Plots of nuclear Cut3-GFP levels against time after release over a range of 1NM-PP1 concentrations. Lines are coloured by cell size at T = 0 of the release. (f) Single-cell C-CDK-YFP traces in DMSO and 20 nM of release. Red x indicates end of anaphase. Traces are coloured by cell size at Time = 0. Only traces which undergo anaphase are shown. End of anaphase defined as first timepoint at which C-CDK-YFP trace is equal to post-anaphase YFP plateau level +10 AU. (g) Boxplot of anaphase time in WT and AF strains. Anaphase time is calculated as end of anaphase time – peak Cut3 time. Difference is non-significant. C-CDKWT, N = 69 and C-CDKAF, N = 47. Lower panel, scatter plot of anaphase time vs cell size, with strain indicated by colour. Box represents median value delimited by 25th and 75th percentiles. See Materials and methods for outlier points.
Figure 1—figure supplement 4
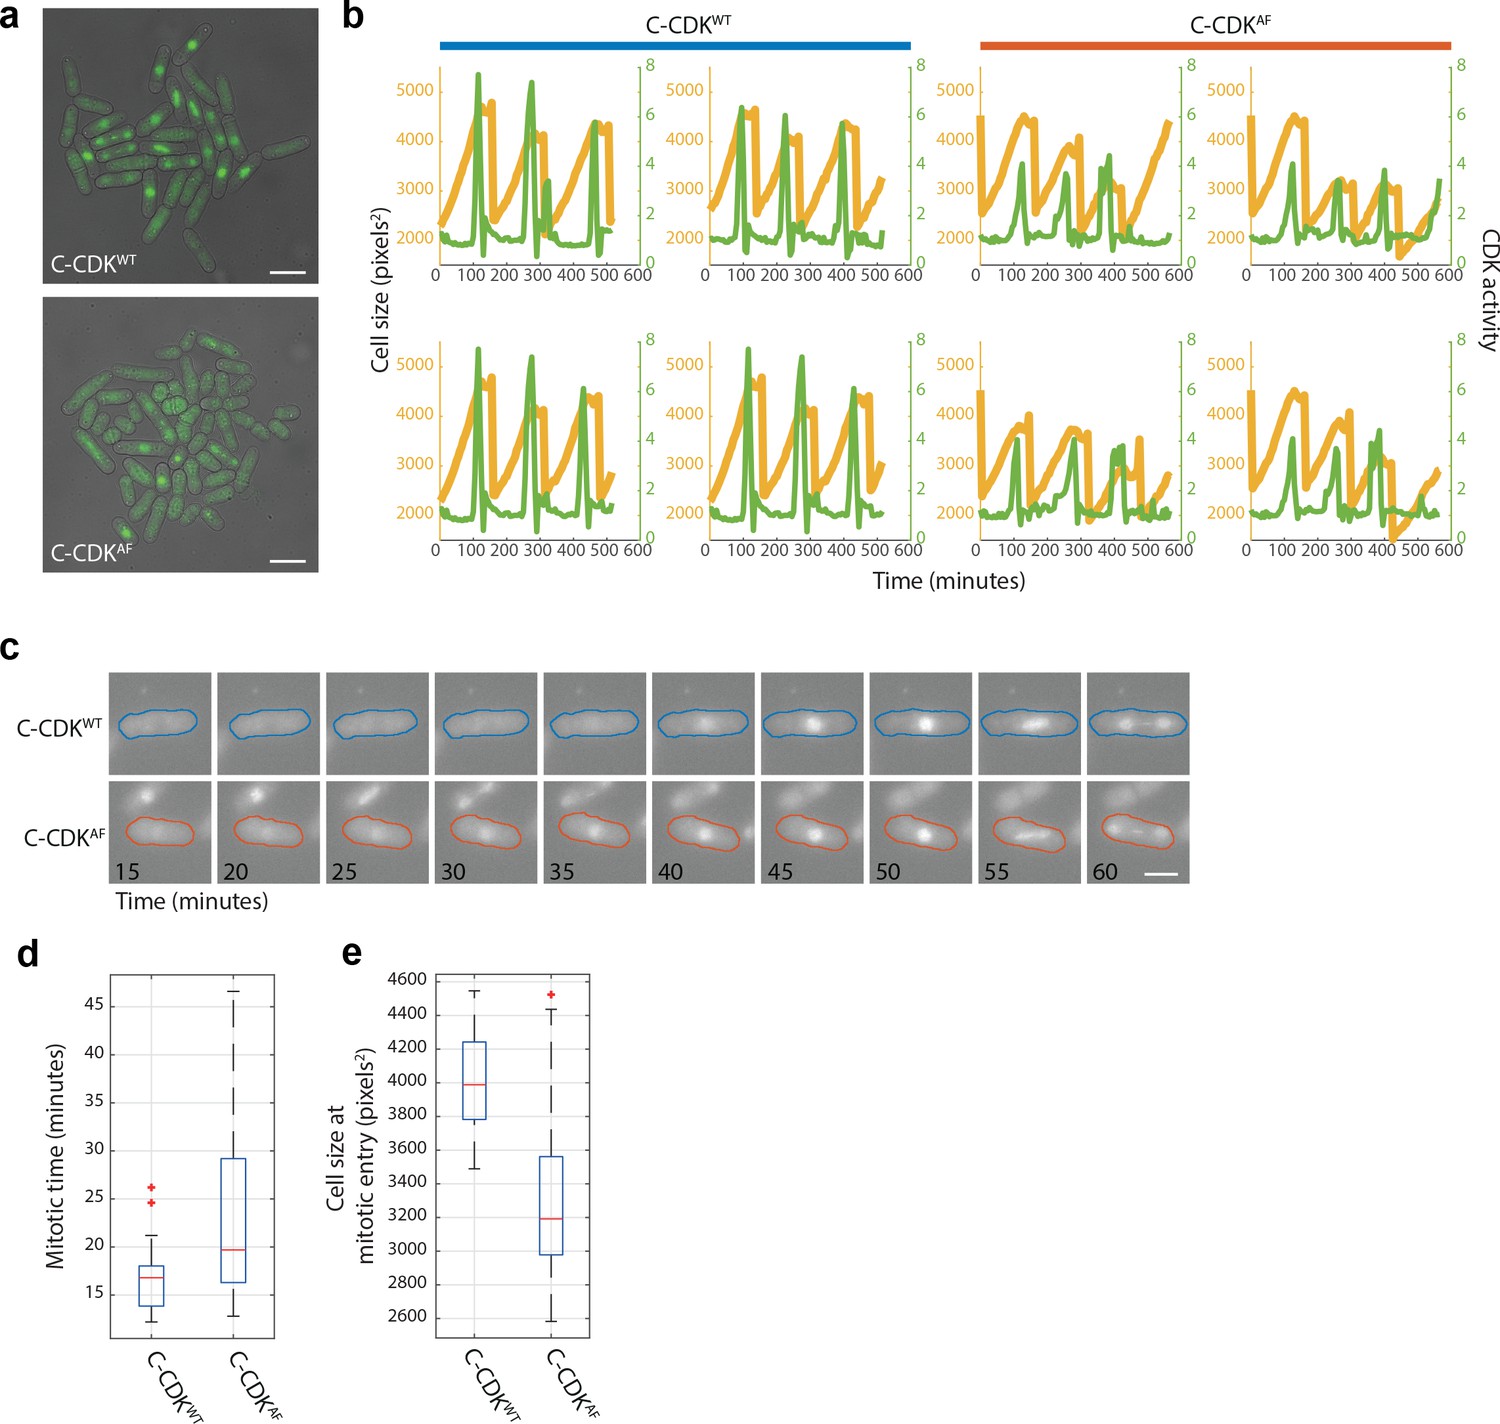
Cut3-GFP as a marker of CDK activity in WT and AF cell strains.
(a) Still images of Cut3-GFP tagged in strains expressing C-CDKWT and C-CDKAF. Cells were grown in a Cellasics microfluidics device in YE4S at 32°C. Scale bar = 10 μm. (b) Example cell length and Cut3-GFP single-cell lineages. Quantification is performed by Pomseg and Pomtrack (see Materials and methods). Cut3-GFP nuclear/cytoplasmic (N/C) ratio is calculated by dividing mean cytoplasmic Cut3 intensity by mean nuclear Cut3 intensity after background subtraction. Orange lines = cell size, green lines = CDK activity (measured by Cut3 N/C ratio). (c) Montage of tagged C-CDKWT and C-CDKAF strains from time-lapse. Colour outline indicates strain and is derived from Pomseg-based segmentation of the brightfield image. Scale bar = 5 μm. (d) Boxplot of mitotic times in C-CDKWT and C-CDKAF strains. Mitotic time is calculated as peak time – mitotic entry time. Difference is significant by two-sample t-test (p=0.006). Box represents median value delimited by 25th and 75th percentiles. See Materials and methods for outlier points. (e) Boxplot of cell size at mitotic entry (cell size sampled at red x position in Figure 1i). Note high variability in the C-CDKAF population (CoV = 0.18 vs 0.08 in WT). Box represents median value delimited by 25th and 75th percentiles. See Materials and methods for outlier points.
Figure 1—figure supplement 5
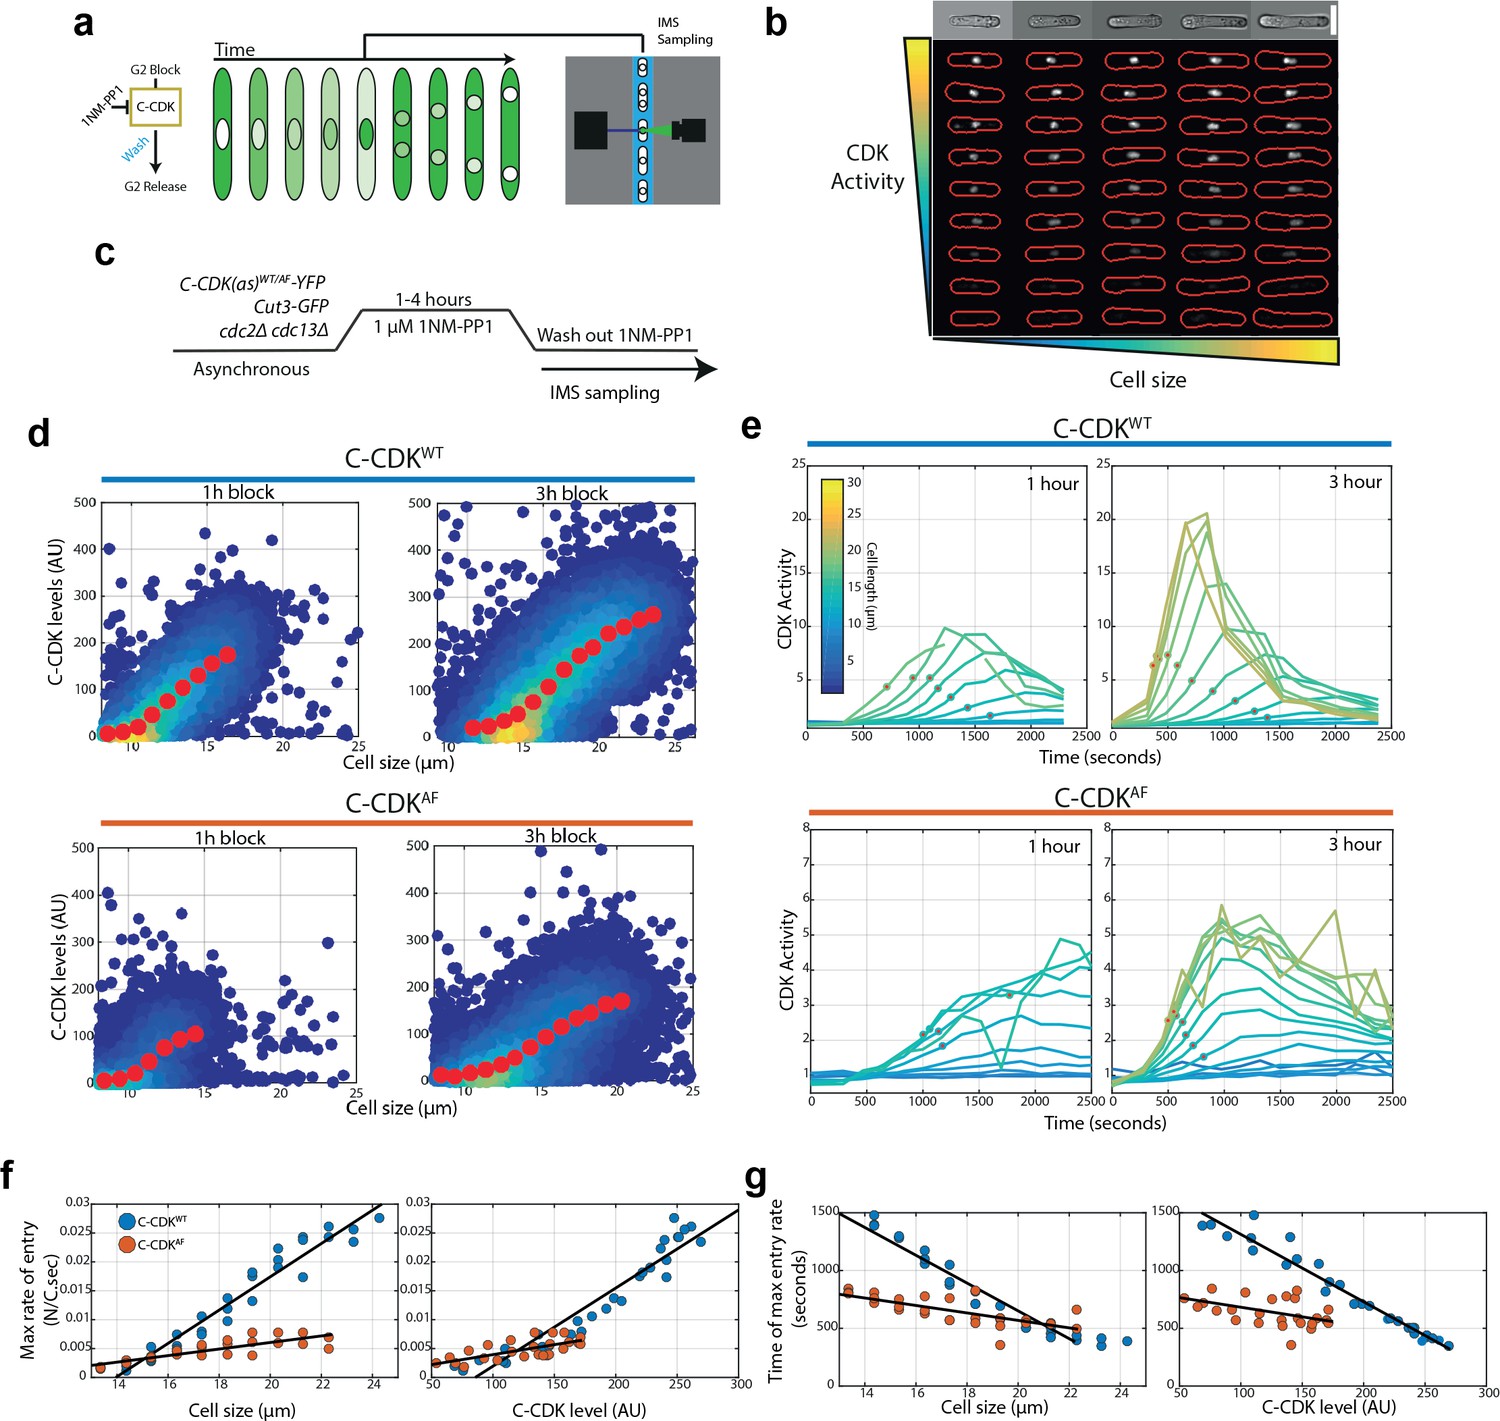
An imaging flow cytometry assay reveals that size, C-CDK level, and tyrosine phosphorylation dictate the rate and timing of CDK activation at mitosis.
(a) Schematic of the high-throughput imaging flow cytometry block and release assay. Cells are arrested in G2 using 1NM-PP1 for various lengths of time, before being washed of 1NM-PP1 and sampled on an imaging flow cytometer. (b) Representative images of single cells with computed cell masks overlaid on fluorescent Cut3 images in red. Top row of images is from the brightfield channel of the top row of fluorescent images. Representative images taken from Cut3-GFP cells in EMM at 32°C. Scale bar = 10 μm. (c) Experimental outline for panels (d–g). C-CDKWT/AF cells sensitive to the CDK inhibitor 1NM-PP1 are blocked for variable amounts of time. Cells are then washed of 1NM-PP1 and released into mitosis. After release, cells are monitored via sequential sampling using imaging flow cytometry. Block performed using 1 μM 1NM-PP1. Cells were grown in EMM at 32°C. (d) Quantification of C-CDK-YFP levels after indicated block time. Colours indicate density of data; yellow represents high density. Red data points indicate mean of binned data, bin widths 0.33 μm. (e) Plots of mean CDK activity (as measured by Cut3 N/C ratio) within size bins indicated by line colours. Red dots indicate points of maximum Cut3 N/C ratio change, as derived from the first derivative of a smoothing spline fit to raw data (raw data is shown). Each point on line has >50 cells. N = 3000–12,000 per timepoint, with ~400,000 single-cell images analysed in total. Background subtraction for N/C ratio performed using wild-type cells lacking Cut3-GFP after indicated block time. (f) Maximum Cut3 N/C ratio change against cell size or C-CDK level. C-CDK level is predicted from data in (d). Data is taken from 2, 3, and 4 hr releases. Black line represents linear regression line. (g) Time of maximum Cut3 N/C ratio change against cell size or C-CDK level. C-CDK level is predicted from data in (d) Data is taken from 2, 3, and 4 hr releases. Black line is the linear regression line. Colours represent the same as (f).
Figure 1—figure supplement 6
Size-dependent grading of mitotic entry rates and timing are dose responsively dependent on CDK inhibition.
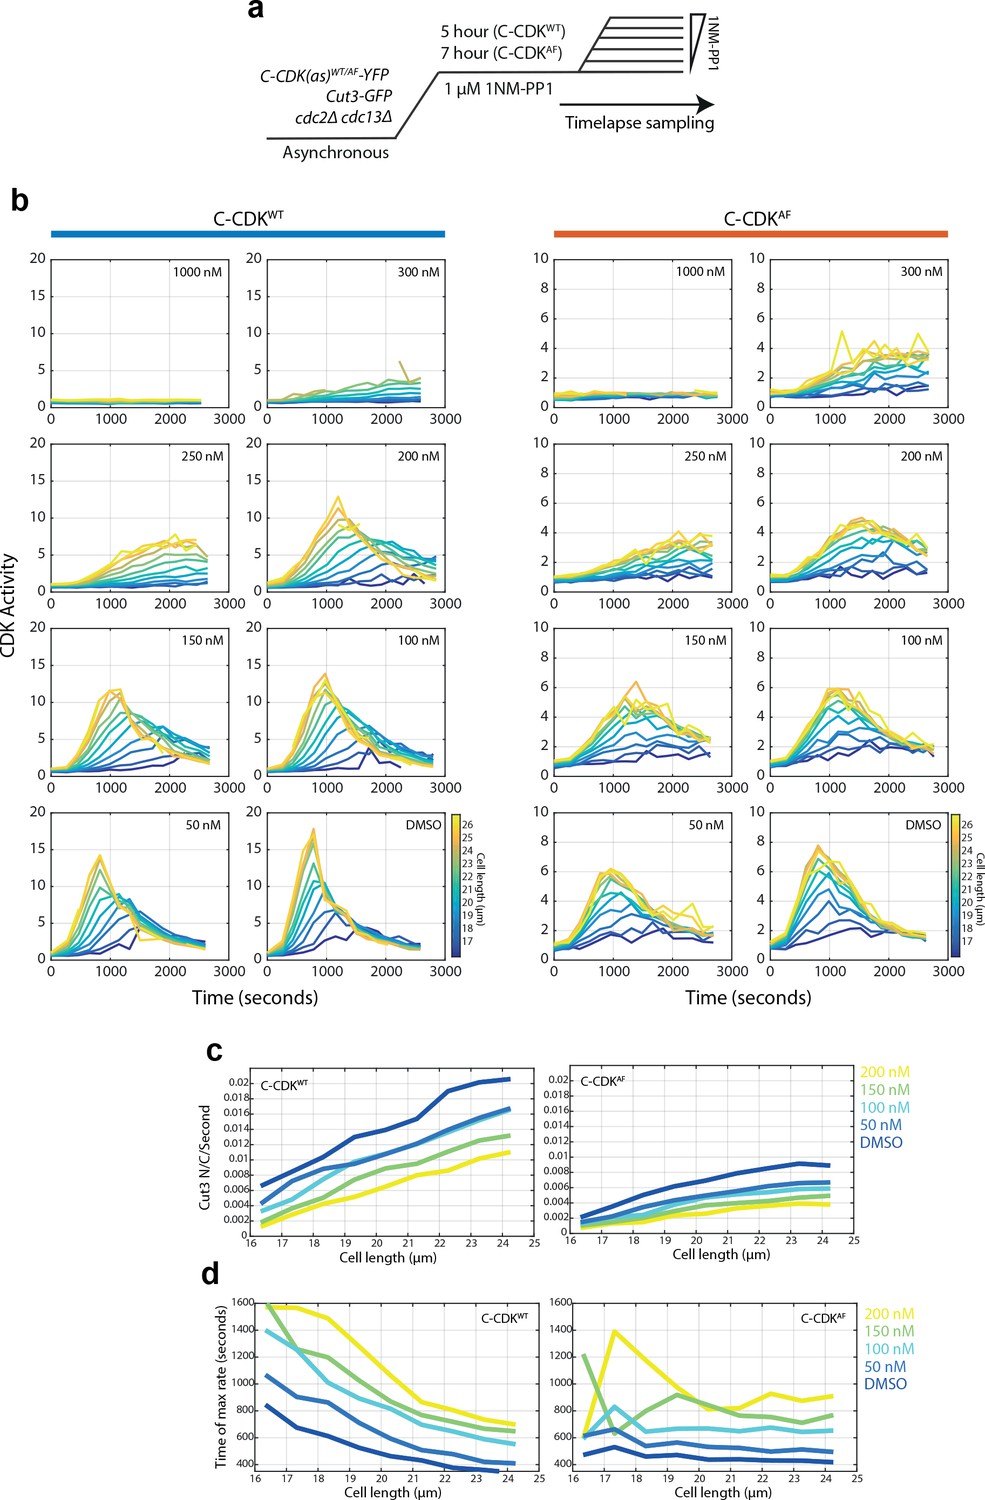
(a) Experimental outline for panels B-D. 1NM-PP1 sensitive C-CDKWT and C-CDKAF cells are blocked by addition of 1NM-PP1. C-CDKAF cells were blocked for longer (7 hr against 5 hr) to allow cells to reach a similar size distribution to C-CDKWT cells. Cells were then released into a range of 1NM-PP1 concentrations. After release, images were acquired every minute. Time between washing and image acquisition is ~5 min. Cells were grown in EMM at 32°C. Cells are sampled during the region marked time-lapse. (b) Plots of mean CDK activity (as measured by Cut3-GFP N/C ratio) against time from release in indicated size bins at annotated 1NM-PP1 levels. N = 1000–4000 cells per timepoint, >10 cells averaged within each bin. (c) Plots of maximum Cut3 nuclear translocation rates against cell size in C-CDKWT and C-CDKAF cells. Maximum rates were taken from the first derivative of a smoothing spline fit to data in (b). Line colours indicate 1NM-PP1 concentration. Key given on the right hand side. (d) Plots of time of maximum Cut3 translocation rate timing vs cell size in WT and AF cells. Maximum rates were taken from the first derivative of a smoothing spline fit to data in (b). Line colours indicate 1NM-PP1 concentration.
Figure 2 with 2 supplements
Cell size is able to modulate CDK activity independently of canonical CDK regulation.
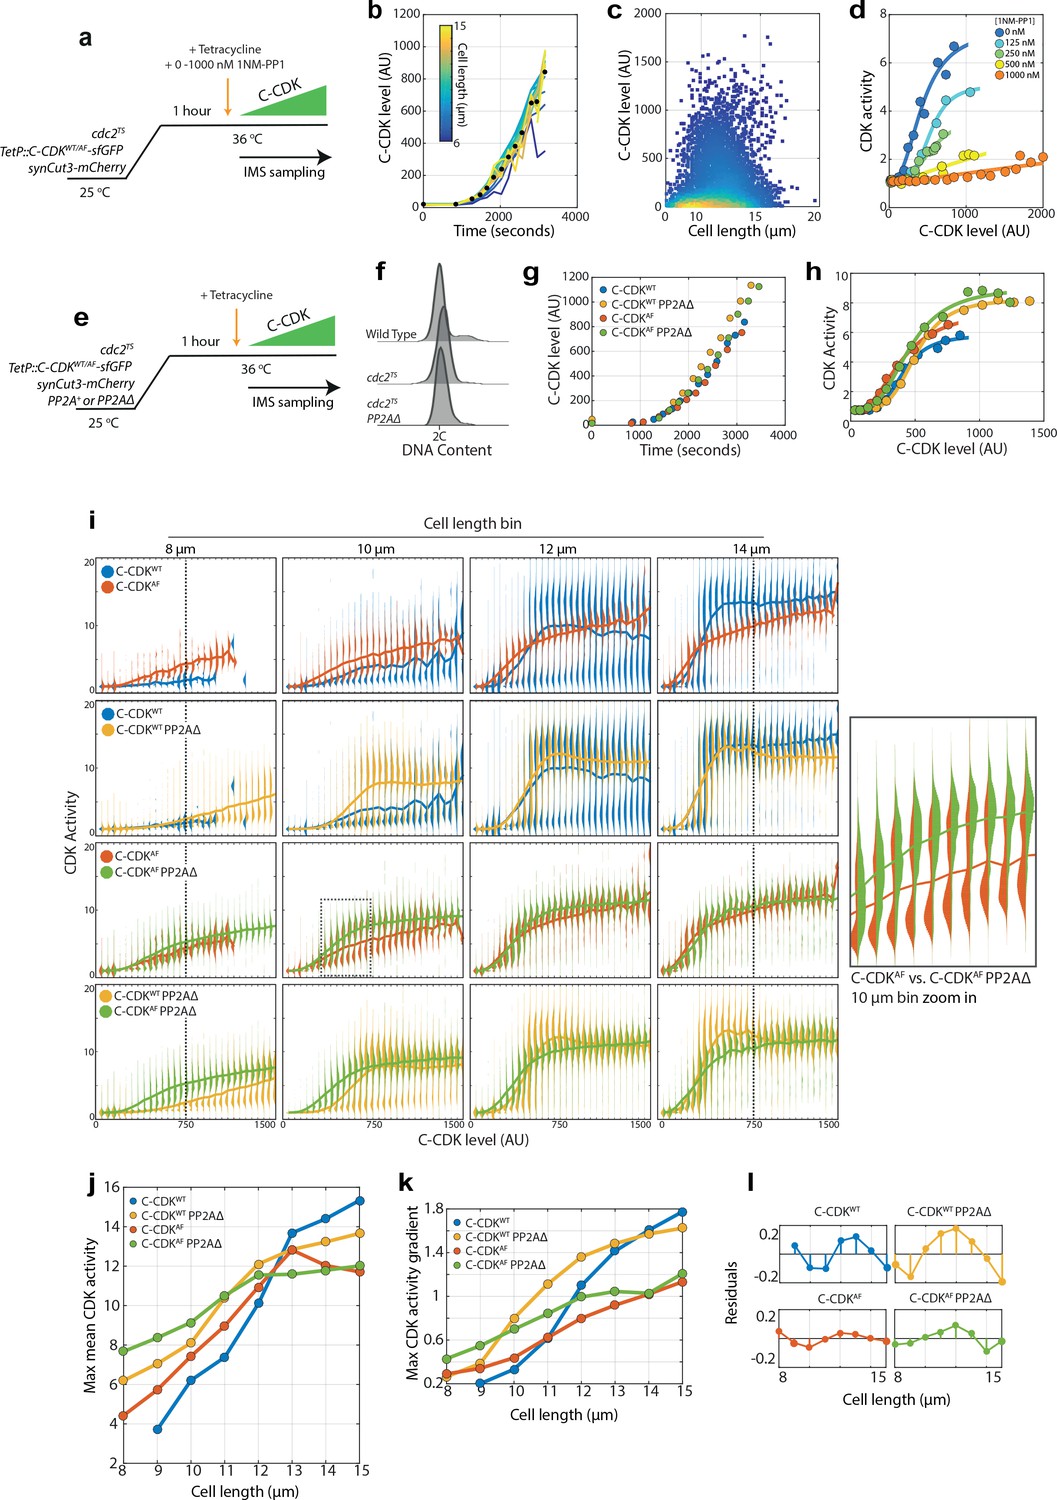
(a) Experimental outline for figure for (b–d). Cells were held at 36°C for 1 hr to ablate the function of the temperature-sensitive (TS) cdc2 allele. C-CDK-sfGFP expression was induced by addition of tetracycline, and ectopic C-CDK concentration and CDK activity were measured by sequential sampling during induction. Induced C-CDK-sfGFP lacks its degron box sequence, and therefore is not degraded at anaphase. Sequential sampling during C-CDK-sfGFP induction begins at the point of tetracycline addition, with roughly one sample taken every 3 min after the start of C-CDK production. Sampling is conducted using an imaging flow cytometer (IMS). (b) Expression of C-CDKWT from point of tetracycline addition. Different coloured lines represent different size bins. Black dots represent mean C-CDK-sfGFP level over all size bins for given timepoint. After lag period of ~1000 s after tetracycline addition, samples are taken roughly every 3 min. n = 759,633. (c) Scatter plot of cell length vs C-CDK-sfGFP levels. Coloured by density of data points. Data collected throughout induction. n = 759,633. (d) Mean CDK activity dose–response against C-CDK-sfGFP in the presence of annotated levels 1NM-PP1. Circles represent average CDK activities across all cells from a single sample taken after induction. 0 nM n = 166,081; 125 nM n = 60,759; 250 nM n = 165,128; 500 nM n = 135,670; and 1000 nM n = 231,995. (e) Experimental outline for (f–k). Cells were held at 36°C for 1 hr to ablate cdc2TS function. After 1 hr, C-CDKWT or C-CDKAF fused to sfGFP was induced with tetracycline in cells with either the major PP2A catalytic subunit (encoded by the ppa2 gene) deleted or present. Induced C-CDK-sfGFP lacks its degron box sequence, and therefore is not degraded at anaphase. Sequential sampling during C-CDK-sfGFP induction begins at the point of tetracycline addition, with timepoints taken roughly every 3 min after 1000s lag period in C-CDK-sfGFP induction. (f) Flow cytometric DNA content analysis for wild-type cells, cdc2-M26 cells, and cdc2-M26 PP2AΔ cells. The major PP2A, ppa2, was deleted in PP2AΔ cells. Cells were fixed for sampling after the block lengths specified in (e), before the addition of tetracycline. (g) Induction of C-CDK after tetracycline addition. Points represent mean concentration of C-CDK-sfGFP across all size bins at indicated timepoints. CDKWTn = 166,081. C-CDKWT PP2AΔ n = 175,247. C-CDKAFn = 177,292. C-CDKΑF PP2AΔ n = 174,847. (h) C-CDK activity against C-CDK-sfGFP level in given genetic backgrounds defined in (g). Points represent mean C-CDK activity of all cells. Data is pooled from experiment in (e), from all timepoints following tetracycline induction. Key is the same as (g). (i) Violin plots of single-cell C-CDK-sfGFP level against CDK activity in annotated size bins and strain backgrounds. Solid line through violin plot indicates the mean CDK activity within the C-CDK level bin. (j) Maximum mean CDK activity vs cell length in annotated strain backgrounds. Max mean CDK activity is the maximum mean CDK activity within a C-CDK fluorescence level bin for a given cell size. The mean CDK activity level across all fluorescence bins is shown by the solid line in the violin plots in (i). (k) Maximum gradient of the mean lines in (i) plotted against cell length. Maximum gradient of change is derived from a spline fit to the mean CDK activity vs C-CDK-sfGFP level trace. (l) Linear regression lines were fit to data in (k), and residuals were plotted (actual value – predicted value). Non-linear residuals indicate bistability in CDK activation.
Figure 2—figure supplement 1
A new synthetic CDK sensor for S. pombe.
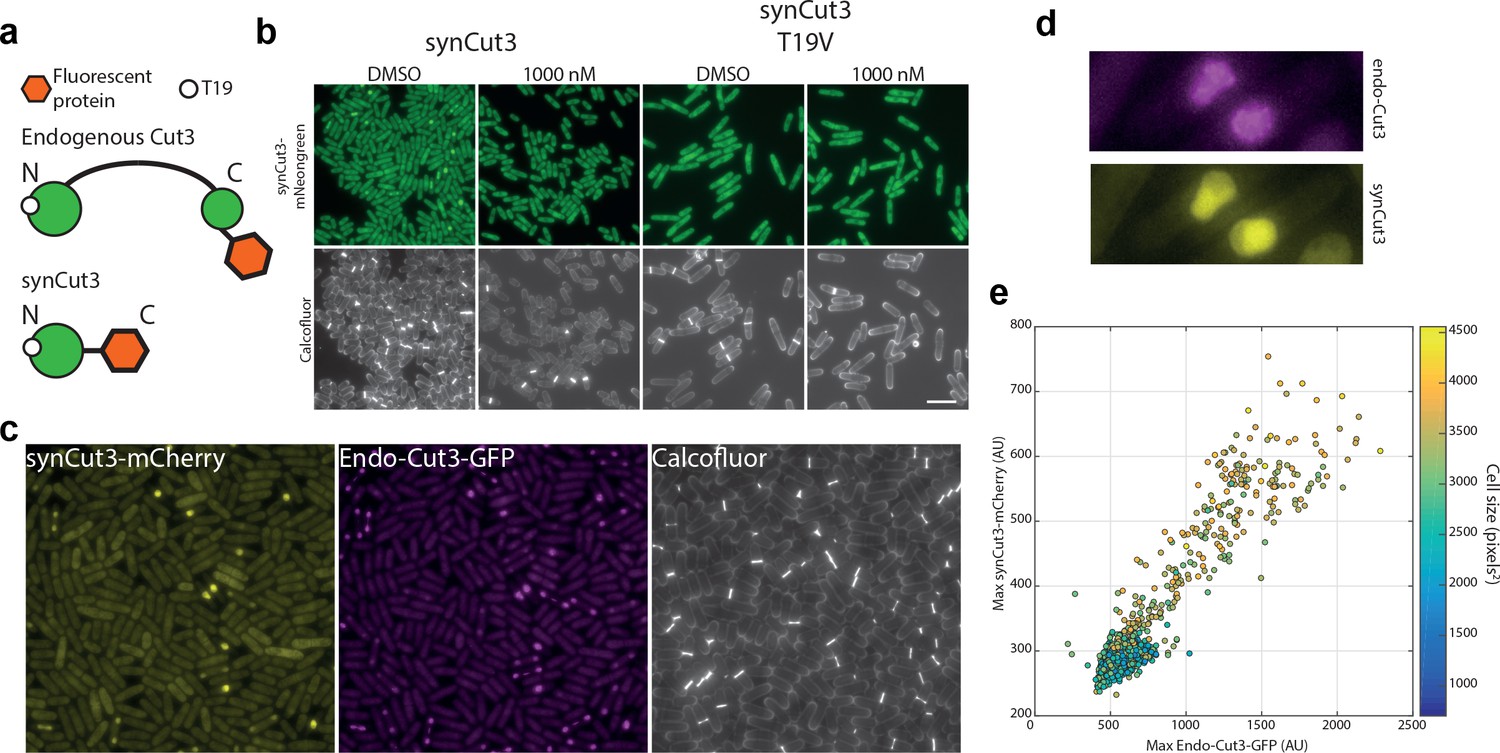
(a) Design of the synthetic Cut3 (synCut3) sensor. The design includes the first 528 amino acids of Cut3 (and has previously been shown to translocate into the nucleus at mitosis [Fantes et al., 1975]). (b) Example images of synCut3-mNeonGreen expressed from the eno101 promoter, in the presence or absence of 1NM-PP1 (for 1 hr) or a mutated T19 residue. The T19V mutation does not allow CDK phosphorylation, therefore preventing nuclear translocation. Scale bar = 20 μm. (c) Examples images of exogenous synCut3-mCherry and endogenous Cut3-GFP expressing cells. Scale bar = 20 μm. (d) Detailed view of two mitotic cells expressing both synCut3-mCherry and Cut3-GFP. (e) Quantification of exogenous synCut3 signal vs endogenous Cut3 nuclear levels. Data points coloured to indicate cell size. Note endogenous Cut3 signal is smoothed to remove foci containing condensed chromatin regions.
Figure 2—figure supplement 2

A single-cell in vivo biochemistry approach permits decoupling of cell size from C-CDK concentration.
(a) Experimental outline for (b–d). Cells were held at 36°C for 1 hr to ablate cdc2-M26 function. After 1 hr, C-CDKWT or C-CDKAF was induced with tetracycline. Induced C-CDK lacks its degron box sequence, and therefore is not degraded at anaphase. Sequential sampling during C-CDK induction begins at the point of tetracycline addition. Concurrent with tetracycline addition, 1NM-PP1 was added to the specified concentration to inhibit the induced C-CDK. (b) Mean CDK activity against C-CDK level, within specified size bins. Colours within subplot indicate cell size bin (see colour bar). Different subplots represent cells released into different 1NM-PP1 concentrations. (c) Violin plots of single-cell C-CDK level against CDK activity data. Individual subplots are the single-cell data from a given size bin and 1NM-PP1 level. Rows correspond to the same size bin, columns to the same 1NM-PP1 level. Although bistable behaviour is observed, lines through data represent the population mean C-CDK activity level within a given C-CDK level bin. (d) Heatmap of annotated features, extracted from the single-cell dose–response data. Max mean CDK activity is the maximum mean CDK activity within a C-CDK fluorescence level bin. C-CDK slope breadth is the change in C-CDK between the C-CDK bin at which CDK activity is greater than 1.1× of minimum and less than 0.8× of maximum. C-CDK level when P(CDK>5) > 0.1 indicates the C-CDK level required to increase CDK activity in 10% of cells to a level greater than 5. (e) Experimental outline for panels F and G. Cells were held at 36°C for 1 hr to ablate cdc2-M26 function. After 1 hr, C-CDKWT or C-CDKAF was induced with tetracycline to different levels by adding variable amounts of tetracycline. C-CDK was induced in the presence of 10 μM 1NM-PP1 to inhibit the induced C-CDK. After 60 min, 1NM-PP1 was washed from cells and cells were sequentially sampled using imaging flow cytometry (IMS). All time measurements are given as time from washing 1NM-PP1. (f) Scatter plot of C-CDK levels against cell size after C-CDK induction. Data represent pooled data from all cells encompassing all 1NM-PP1 release concentrations Colours indicate local data point density. N > 10,000. (g) synCut3 N/C ratio (representing CDK activity) against time in the presence of induced C-CDKWT or C-CDKAF. Line colours indicate size bins. N > 50 cells per data point.
Figure 3
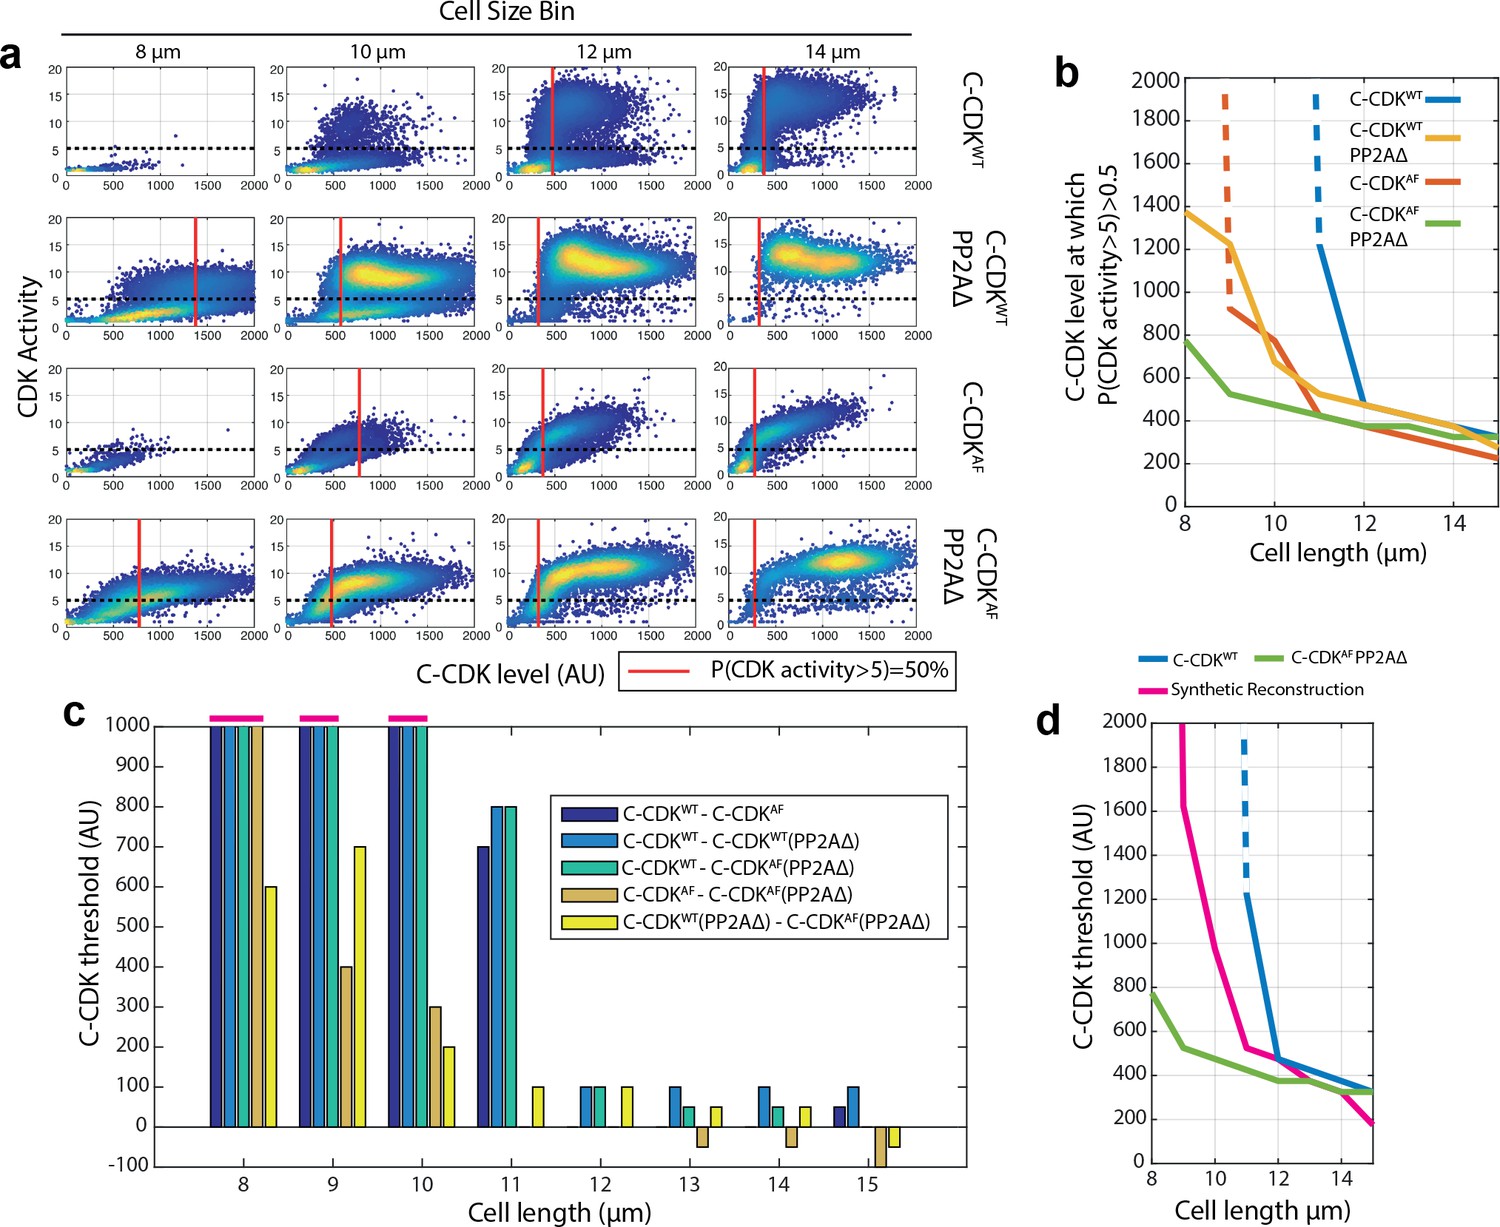
CDK tyrosine phosphorylation and PP2A act synergistically to restrict division in small cells.
(a) Scatter plots of C-CDK level against CDK activity. Either C-CDKWT or C-CDKAF fused to sfGFP was induced in backgrounds with PP2A either lacking or present. PP2AΔ refers to a deletion of the ppa2 gene. Red line indicates the C-CDK-sfGFP level at which 50% of cells have a CDK activity greater than 5. Black dashed line marks CDK activity of 5. Data taken from Figure 2i. (b) C-CDK-sfGFP level at which 50% of cells have C-CDK activity of >5. Data is taken from (a) across all size bins. Y-axis represents the C-CDK-sfGFP threshold at which 50% of cells will have a C-CDK activity of 5. Dashed lines indicate values where this C-CDK-sfGFP threshold level is undefined due to the threshold being unattainable in experimental conditions. (c) Piecewise dissection of the amount of C-CDK-sfGFP a particular component of the cell cycle network is able to prevent from switching to an ‘on’ state (C-CDK activity level of 5) in different size bins. Bar chart shown is of subtractions of curves described in key (inset). For example, C-CDKWT–C-CDKAF gives the C-CDK threshold tyrosine phosphorylation alone (in a background with PP2A present) is able to generate to restrict C-CDK activation. Values that are undefined due to undefined original threshold values from (a) are taken to be 1000 units and are marked above the axis (pink). (d) Cell length against C-CDK level threshold of annotated curves. Here, a synthetic threshold curve is built (pink), by adding the individual component regulatory contributions of CDK tyrosine phosphorylation (c, yellow) and PP2A (c, orange) to the base curve of C-CDKAF PP2AΔ (green) to try and re-capitulate the WT behaviour (blue). Dashed line indicates undefined threshold values.
Figure 4
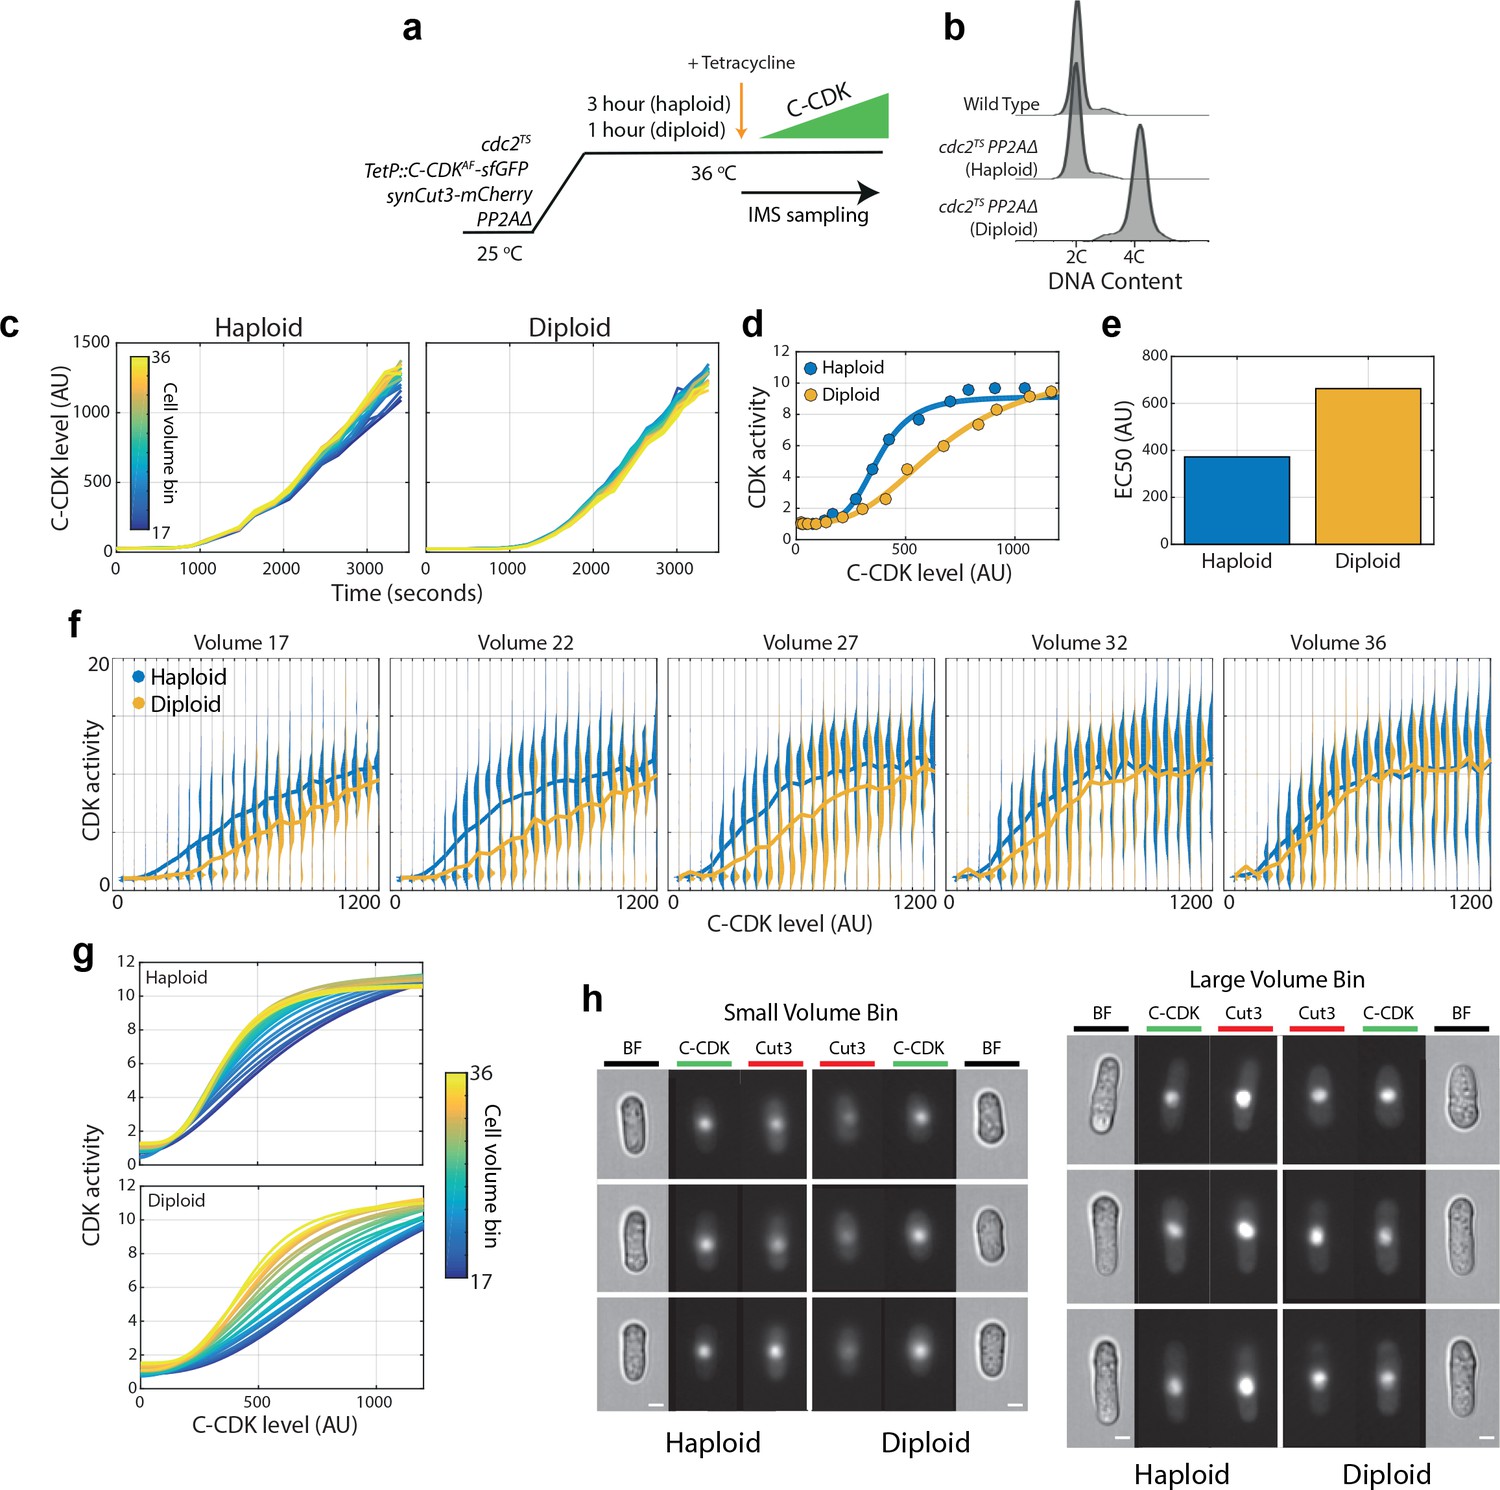
Cellular DNA content inhibits CDK activity independently of tyrosine phosphorylation or PP2A activity.
(a) Experimental outline for panels (b)-(h). PP2A Δ/Δ diploids and PP2AΔ haploids were arrested using cdc2TS. PP2AΔ refers to a deletion of the ppa2 gene. Diploids were held at 36°C for 1 hr, whilst haploids were held for 3 hr to generate blocked cell populations with similar cell volumes despite ploidy differences. C-CDKAF expression was induced by addition of tetracycline, and C-CDKAF-sfGFP concentration and CDK activity were measured by sequential sampling from time of induction in an imaging flow cytometer. (b) Flow cytometric DNA content analysis for wild-type cells, haploid cdc2-M26 PP2AΔ cells and diploid cdc2-M26/cdc2-M26 PP2AΔ/PP2AΔ cells. PP2AΔ refers to a deletion of the ppa2 gene. Cells were fixed for sampling after the block lengths specified in (a), before the addition of tetracycline. (c) Expression of C-CDKAF fused to sfGFP from point of tetracycline addition in haploid and diploid strains. Different coloured lines represent different size bins. Haploid n = 125,021, diploid n = 139,557. (d) Mean CDK activity against C-CDKAF-sfGFP level in haploids and diploids. Solid line is a sigmoid fit to data. (e) EC50 from sigmoid curves in (d). Haploid EC50: 372 AU. Diploid EC50: 663 AU. Haploid EC50 is 56% of diploid EC50. (f) Violin plots of single-cell C-CDKAF-sfGFP level against CDK activity in annotated volume bins and ploidy status. Solid line through violin plot indicates the mean CDK activity within the C-CDK-sfGFP level bin. Volume bins span a physiological range of diploid cell sizes. Volume bin 17 corresponds to a haploid cell length of 12.1 μm and a diploid cell length of 9.53 μm. Volume bin 36 corresponds to a haploid length of 18.7 μm and a diploid length of 14.4 μm. (g) Mean intra volume-bin dose–response of C-CDK-sfGFP level vs CDK activity in annotated ploidy level. Lines are sigmoid curves fit to raw data. Cell volume bin indicated by line colour. (h) Example raw images from experiment. Brightfield (BF) channel displaying cell morphology, C-CDK-sfGFP channel and synCut3-mCherry CDK activity indicator are shown. C-CDK level is the same across all images. Scale bars = 3 μm.
Tables
Table 1
S. pombe strains.
| Strain ID | Strain genotype | Source |
|---|---|---|
| JP223 | h? leu1::cdc13P:cdc13-cdc2.as†-YFP:cdc13T::ura4 cdc13Δ::natMX6 cdc2::scLeu2 | This work |
| JP224 | h? leu1::cdc13P:cdc13-cdc2AF.as†-YFP:cdc13T::ura4 cdc13Δ::natMX6 cdc2::scLeu2 | This work |
| JP670 | h? leu1::cdc13P:cdc13-cdc2.as†-YFP:cdc13T::ura4 cdc13Δ::natMX6 cdc2::scLeu2 ura4::Ppcna1-CFP-pcna cut3-mCherry::hphMX6 | This work |
| JP671 | h? leu1::cdc13P:cdc13-cdc2AF.as†-YFP:cdc13T::ura4 cdc13Δ::natMX6 cdc2::scLeu2 ura4::Ppcna1-CFP-pcna cut3-mCherry::hphMX6 | This work |
| JP310 | h? leu1::cdc13P:cdc13-cdc2.as†:cdc13T::ura4 cdc13Δ::natMX6 cdc2::scLeu2 cut3-tdTomato::hphMX6 | This work |
| JP311 | h? leu1::cdc13P:cdc13-cdc2AF.as†:cdc13T::ura4 cdc13Δ::natMX6 cdc2::scLeu2 cut3-tdTomato::hphMX6 | This work |
| JP295 | h? leu1::cdc13P:cdc13-cdc2AF.as†:cdc13T::ura4 cdc13Δ::natMX6 cdc2::scLeu2 cut3-GFP::ura4 | This work |
| JP296 | h? leu1::cdc13P:cdc13-cdc2.as†:cdc13T::ura4 cdc13Δ::natMX6 cdc2::scLeu2 cut3-GFP::ura4 | This work |
| JP501 | h? cdc2.as‡::blastMX6 synCut3-mNeongreen:: leu1+ | This work |
| JP507 | h? cdc2.as‡::blastMX6 synCut3-T19V-mNeongreen:: leu1+ | This work |
| JP601 | h? synCut3-mCherry:: leu1 + cut3-GFP::ura4 | This work |
| JP602 | h? cdc2.as‡::blastMX6 synCut3-mCherry::leu1 + cut3-GFP::ura4 | This work |
| JP591 | h? cdc2-M26 synCut3-mCherry::leu1 + leu1::enoTetP:cdc13-sfGFP-cdc2.as†:adh1T::hphMX6 TetR13 | This work |
| JP593 | h? cdc2-M26 synCut3-mCherry::leu1 + leu1::enoTetP:cdc13-sfGFP-cdc2AF.as†:adh1T::hphMX6 TetR1* | This work |
| JP603 | h? cdc2-M26 synCut3-mCherry::leu1 + leu1::enoTetP:DBΔcdc13-sfGFP-cdc2.as†:adh1T::hphMX6 TetR1* | This work |
| JP605 | h? cdc2-M26 synCut3-mCherry::leu1+ (JPp178) leu1::enoTetP:DBΔcdc13-sfGFP-cdc2AF.as†:adh1T::hphMX6 TetR1* | This work |
| JP679 | h? cdc2-M26::blastMX6 synCut3-mCherry::leu1 + leu1::enoTetP:DBΔcdc13-sfGFP-cdc2.as†:adh1T::hphMX6 TetR1* ppa2Δ::kanMX6 | This work |
| JP680 | h? cdc2-M26::blastMX6 synCut3-mCherry::leu1 + leu1::enoTetP:DBΔcdc13-sfGFP-cdc2AF.as†:adh1T::hphMX6 TetR1* ppa2Δ::kanMX6 | This work |
| SB175 | h? cdc2-M26 synCut3-mCherry::leu1 + leu1::enoTetP: DBΔcdc13-sfGFP-cdc2AF.as†:adh1T::hphMX6 TetR1* ppa2Δ::kanMX6 | This work |
| SB176 | h?/h? cdc2-M26/cdc2-M26_ synCut3-mCherry::leu1+/synCut3-mCherry::leu1+ _leu1::enoTetP: DBΔcdc13-sfGFP-cdc2AF.as†:adh1T::hphMX6/leu1::enoTetP: DBΔcdc13-sfGFP-cdc2AF.as†:adh1T::hphMX6_ TetR1*/ TetR1*_ppa2Δ::kanMX6/ppa2Δ::kanMX6 | This work |
-
*TetR1 – CMVP:TetOx1:TetR-tup11Δ70 (described originally by Patterson et al., 2019).
†Cdc2(F84G).
-
‡Cdc2(F84G, K79E).
Additional files
Download links
A two-part list of links to download the article, or parts of the article, in various formats.
Downloads (link to download the article as PDF)
Open citations (links to open the citations from this article in various online reference manager services)
Cite this article (links to download the citations from this article in formats compatible with various reference manager tools)
CDK control pathways integrate cell size and ploidy information to control cell division
eLife 10:e64592.
https://doi.org/10.7554/eLife.64592


