Olig3 regulates early cerebellar development
- Max-Delbrück-Centrum in the Helmholtz Association, Germany
- Institute for Cell Biology and Neurobiology, Charité Universitätsmedizin Berlin, Germany
- Institute of Neuroscience, Lobachevsky University of Nizhny Novgorod, Russian Federation
- The First Affiliated Hospital of Jinan University, Guangzhou province, China
Figures
Figure 1 with 2 supplements

Olig3 marks rhombic lip and ventricular zone progenitor cells during early cerebellar development.
(A) Doughnut chart illustrating the expression of 110 bHLH transcription factors during cerebellar development. For details on individual gene names within each category please see Table 1. (B) Left, a sagittal section of the cerebellum stained against Olig3 (red) and counterstained with DAPI (blue) at E11.5. Right, quantification of Olig3+ cells in the rhombic lip (RL) and ventricular zone (VZ) between E10.5 and E14.5. See also Figure 1—figure supplement 2A. The rhombic lip and ventricular zone domains were defined in this study according to the expression of Atoh1 and Ptf1a, respectively (see Figure 1—figure supplement 2B). (C) Left, magnifications of the rhombic lip and ventricular zone of a sagittal cerebellar section stained against Olig3 (red) and Sox2 (blue) at E11.5. The boxed area displayed in the ventricular zone is illustrated to the right of the main photograph. Right, quantification of the proportion of Olig3+ cells co-expressing Sox2 between E10.5 and E14.5. Dots in the graphs represent the mean of individual analyzed animals. (D) Left, immunofluorescence characterization of rhombic lip progenitor cells stained against Olig3 (red) and Atoh1 (green) at E11.5. Right, quantification of the proportion of Olig3+ rhombic lip cells co-expressing Atoh1 between E10.5 and E14.5. (E) Left, immunofluorescence characterization of ventricular zone progenitor cells stained against Olig3 (red), Ptf1a (green), and the Purkinje cell marker Foxp2 (blue) at E11.5. The boxed area on the micrograph is illustrated to the right of the main photograph. Right, quantification of the proportion of Olig3+ ventricular zone cells co-expressing Ptf1a or Foxp2. The mean and SD are plotted in all graphs. n = 4 mice per age. Photomicrographs were acquired using the automatic tile scan modus (10% overlap between tiles) of the Zeiss LSM700 confocal microscope.
-
Figure 1—source data 1
Source data for Figure 1.
- https://cdn.elifesciences.org/articles/64684/elife-64684-fig1-data1-v1.xlsx
Figure 1—figure supplement 1
Expression pattern of selected bHLH factors during cerebellar development.
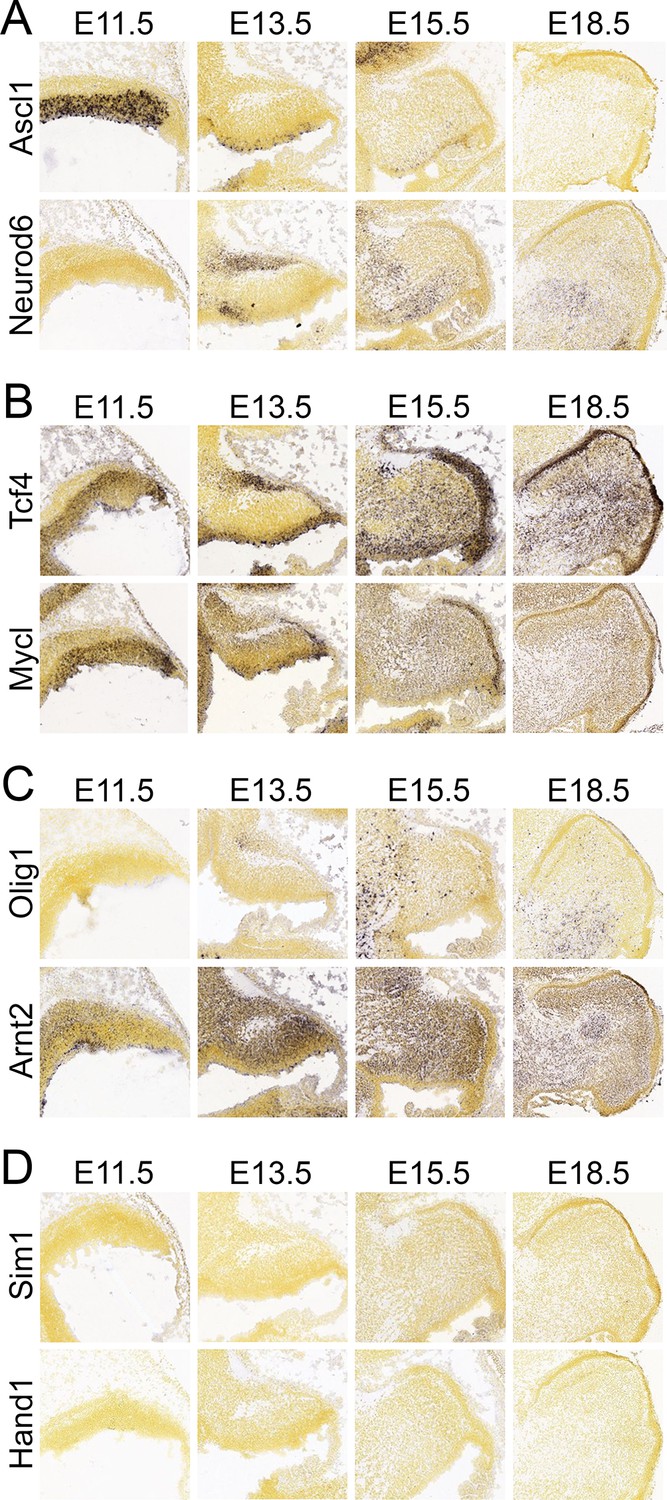
The expression of 110 bHLH transcription factors was analyzed during cerebellar development using publicly available data from the Allen Developing Mouse Brain Atlas. (A–D) Representative examples of genes classified in this study as differentially expressed in cerebellar progenitor regions (A), generically expressed in cerebellar progenitor cells (B), expressed in postmitotic cells (C) or not expressed during cerebellar development (D). The full list of analyzed genes can be found in Table 1. Photomicrographs used in this figure were taken from the Allen Developing Mouse Brain Atlas without adjusting either the brightness or contrast.
Figure 1—figure supplement 2

Characterization of Olig3 expression during cerebellar development.
(A) Sagittal wildtype cerebellar sections stained with antibodies against Olig3 (red) and counterstained with DAPI (blue) between E10.5 and E14.5. The ventricular zone (VZ) and rhombic lip (RL) are indicated. In this study, the expression of Atoh1 and Ptf1a was used to define the rhombic lip and ventricular zone boundaries, respectively, see B. (B) Sagittal wildtype cerebellar sections stained with antibodies against Olig3 (red) and Atoh1 (green, upper panels) or with Olig3 and Ptf1a (green, lower panels) at E12.5. Sections were counterstained with DAPI (blue). Note that the use of Atoh1 and Ptf1a expression allows for the delimitation of the rhombic lip and ventricular zone. (C, D) Immunofluorescence analysis and quantification of proliferative BrdU+ (green) cells co-expressing Olig3 (red) in the rhombic lip (C) and ventricular zone (D) between E10.5 and E14.5. The mean and SD are plotted in all graphs, and the dots represent the mean of individual animals. n = 4 mice per age. Photomicrographs were acquired using the automatic tile scan modus (10% overlap between tiles) of the Zeiss LSM700 confocal microscope. Microphotographs displayed in A were mounted on a black frame to maintain figure panel proportions.
-
Figure 1—figure supplement 2—source data 1
Source data for Figure 1—figure supplement 2.
- https://cdn.elifesciences.org/articles/64684/elife-64684-fig1-figsupp2-data1-v1.xlsx
Figure 2 with 1 supplement

Lineage-tracing of cerebellar neurons arising from Olig3+ progenitor cells.
(A–D) Analysis of Tomato+ (red) cells in Olig3creERT2/+;Rosa26lsl-tdT/+ mice that were recombined with tamoxifen (TAM) at E10.5 and imaged at E19. See Figure 2—figure supplement 1A and Video 1 for a description of the genetic strategy and a complete reconstruction of a recombined Olig3creERT2/+;Rosa26lsl-tdT/+ brain. (A, A’) A sagittal three-dimensional reconstruction of the cerebellum. Tomato+ cells were broadly distributed across the cerebellum and densely packed in the DCN nuclei (asterisks in A’). (B) A coronal three-dimensional reconstruction of the cerebellum. DCN nuclei are marked with asterisks. The pontine nuclei (Pn) and their axons (arrowhead), which develop from Olig3+ progenitor cells in the medulla oblongata, are labeled with Tomato. (C) A sagittal section stained against Tomato and DAPI (blue). Other known Olig3 derivatives, such as the thalamus (Th) including its projections to the cortex (Cx), pontine nuclei (Pn), inferior olive (Io) and many neurons in the medulla oblongata (Mo) are marked with Tomato. A magnification of the cerebellum is displayed with (C’) or without (C’’) DAPI. The external granule cell layer (EGL), Purkinje cell layer (PL), and DCN neurons are labeled with Tomato. (D) Left, schematic display of DCN nuclei positive for Brn2 (dentatus and interpositus) and Tbr1 (fastigii). Right, sagittal cerebellar sections stained against Tomato and Brn2 or Tbr1 (green). The boxed areas are illustrated to the bottom of the main photographs displaying individual and merged fluorescent signals. Asterisks mark double positive cells. (E–H) Analysis of cerebellar neurons with a history of Olig3 (βgal+) expression. Olig3creERT2/+;MaptnLacZ/+ mice were recombined with tamoxifen (TAM) at different embryonic stages and analyzed at E19. See Figure 2—figure supplement 1B for a description of the experiment. Sagittal cerebellar sections from these mice were stained against βgal (red) and markers for the EGL and granule cells (Pax6, blue in E), DCN neurons (Tbr1, blue in F), Purkinje cells (Foxp2, blue in G), and inhibitory interneurons (Pax2, blue in H). Double-positive (βgal+/marker+) cells were quantified at E19. The boxed areas on the micrographs are illustrated to the bottom of the main photographs displaying individual and merged fluorescent signals. The mean and SD are plotted in all graphs, and the dots represent the mean of individual animals. n = 3 mice per age. Significance was obtained using one-way ANOVA followed by post hoc Tukey’s test, see Table 2 for statistical details. Photomicrographs were acquired using the automatic tile scan modus (10% overlap between tiles) of the Zeiss LSM700 confocal microscope. The main microphotograph displayed in G was mounted on a black frame to maintain figure panel proportions.
-
Figure 2—source data 1
Source data for Figure 2.
- https://cdn.elifesciences.org/articles/64684/elife-64684-fig2-data1-v1.xlsx
Figure 2—figure supplement 1
Lineage-tracing of Olig3-derived cells.
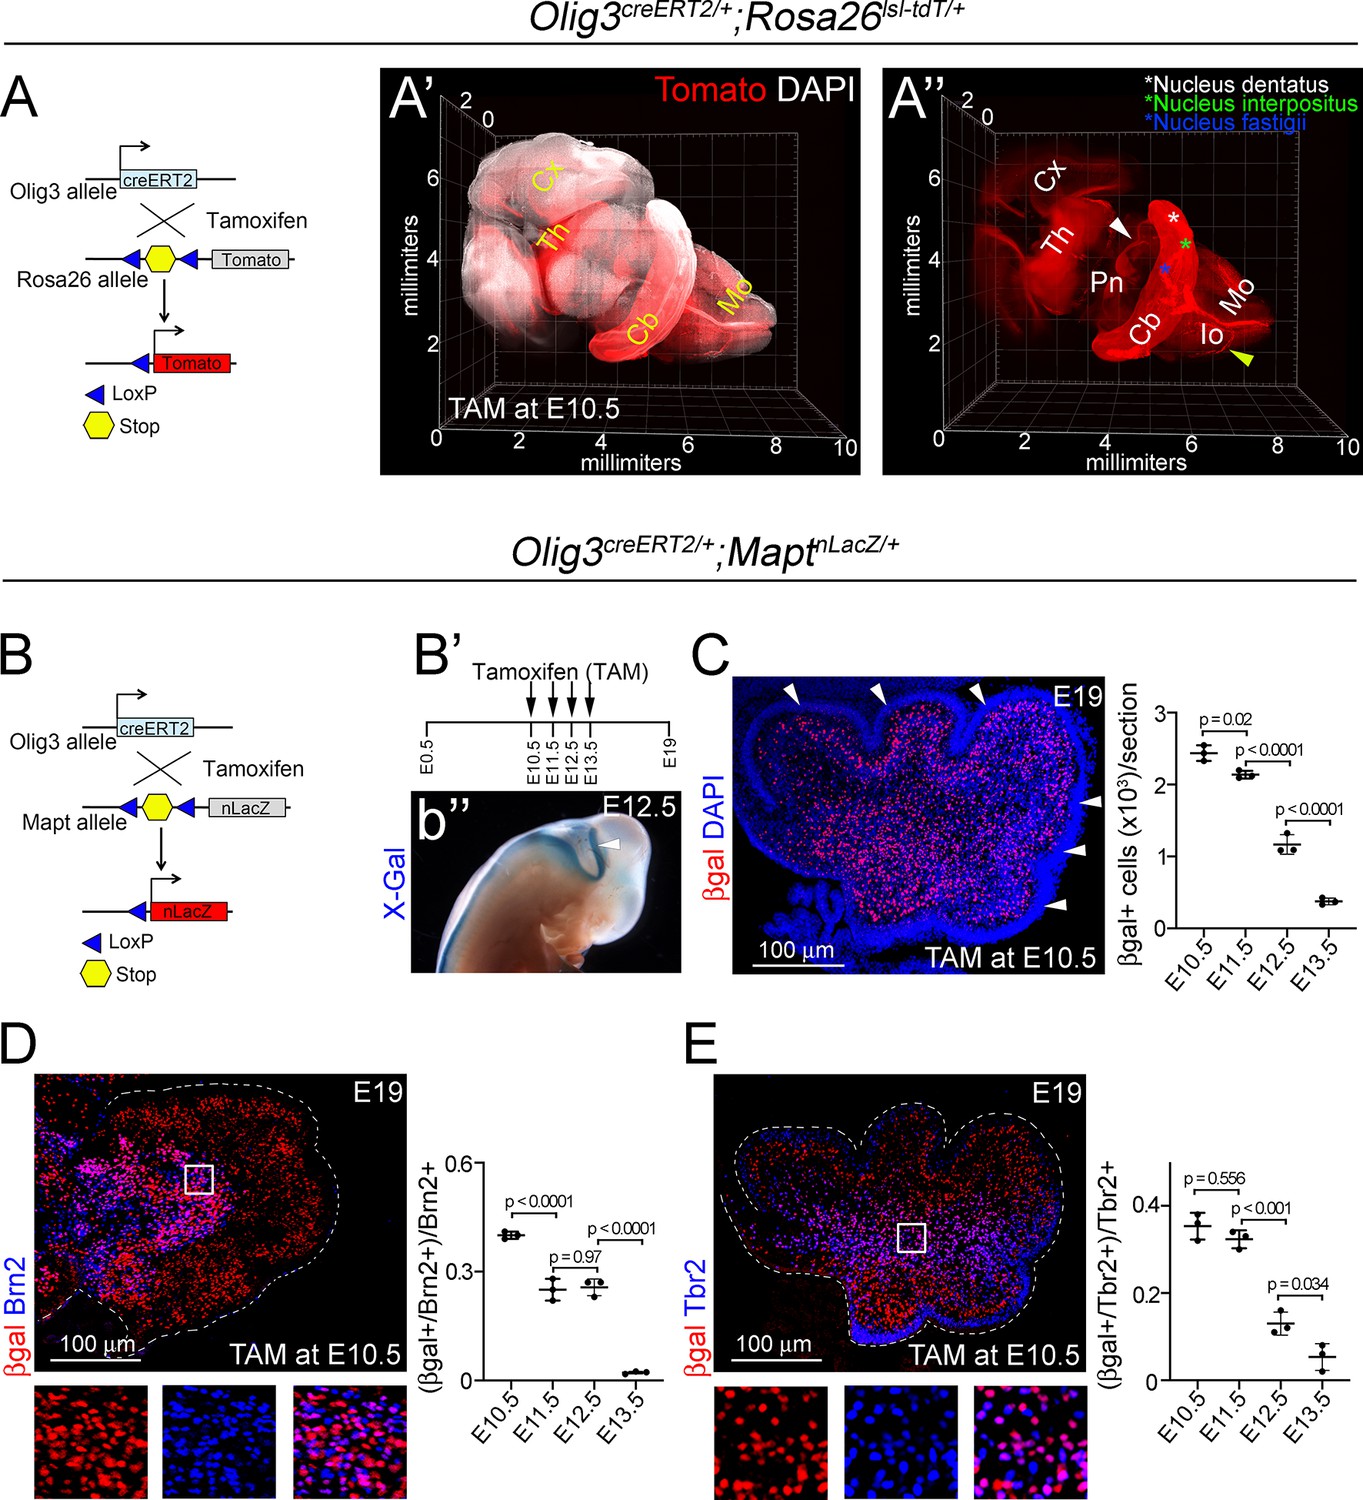
(A) Strategy to label Olig3-derived cells using a tamoxifen-dependent cre recombinase driven by Olig3 and the indicator allele Ai14 (Olig3creERT2/+;Rosa26lsl-tdT/+ mice). Upon tamoxifen (TAM) treatment, a stop cassette upstream of the Tomato coding sequence is removed. Recombined cells are visualized by Tomato fluorescence (red). (A’, A’’) A whole-mount three-dimensional reconstruction of an Olig3creERT2/+;Rosa26lsl-tdT/+ brain that was recombined at E10.5 and imaged at E19. DAPI (white) was used as a counterstain (A’). Note the distribution of Tomato+ cells across the cerebellum and DCN nuclei (asterisks in A’’). Other derivatives of Olig3+ progenitors, such as the thalamus (Th) and its projections to the cortex (Cx), the pontine nuclei (Pn) and their projections (white arrowhead) or the inferior olive (Io) and its projections (yellow arrowhead) in the medulla oblongata (Mo) are also marked with Tomato. (B) Strategy to label Olig3-derived neurons using Olig3creERT2 and the indicator allele Mapt-nuclear-LacZ (Olig3creERT2/+;MaptnLacZ/+ mice). (B’) To visualize Olig3 derivatives throughout development, one dose of tamoxifen was given to pregnant dams (note that mice only received tamoxifen on 1 day during development). Recombined animals were analyzed at E19. (B’’) Lateral view of an E12.5 Olig3creERT2/+;MaptnLacZ/+ embryo that was recombined at E10.5. Note the broad expression of βgal, visualized using X-Gal staining, in the entire cerebellar anlage (arrowhead). (C) Left, a sagittal cerebellar section, of an E19 Olig3creERT2/+;MaptnLacZ/+ mouse that was recombined with tamoxifen at E10.5, and stained against βgal (red) and DAPI (blue). Note that the external granule cell layer (arrows) does not express βgal (see text). Right, quantification of βgal+ cells in the cerebellum of E19 Olig3creERT2/+;MaptnLacZ/+ mice that were recombined at different embryonic stages (E10.5-E13.5). (D, E) Olig3creERT2/+;MaptnLacZ/+ mice were recombined with tamoxifen at different embryonic stages and analyzed at E19. Sagittal sections from these mice were stained against βgal (red) and markers for dentatus/interpositus DCN neurons (Brn2, blue in D) and unipolar brush cells (Tbr2, blue in E). Double-positive (βgal+/marker+) cells were quantified at E19. The boxed areas on the micrographs are illustrated to the bottom of the main photographs displaying individual and merged fluorescent signals. The mean and SD are plotted in all graphs, and the dots represent the mean of individual animals. n = 3 mice per age. Significance was obtained using one-way ANOVA followed by post hoc Tukey’s test, see Table 2 for statistical details. Photomicrographs were acquired using the automatic tile scan modus (10% overlap between tiles) of the Zeiss LSM700 confocal microscope.
-
Figure 2—figure supplement 1—source data 1
Source data for Figure 2—figure supplement 1.
- https://cdn.elifesciences.org/articles/64684/elife-64684-fig2-figsupp1-data1-v1.xlsx
Figure 3 with 3 supplements
Severe cerebellar hypoplasia and neuronal loss in Olig3 mutant mice.
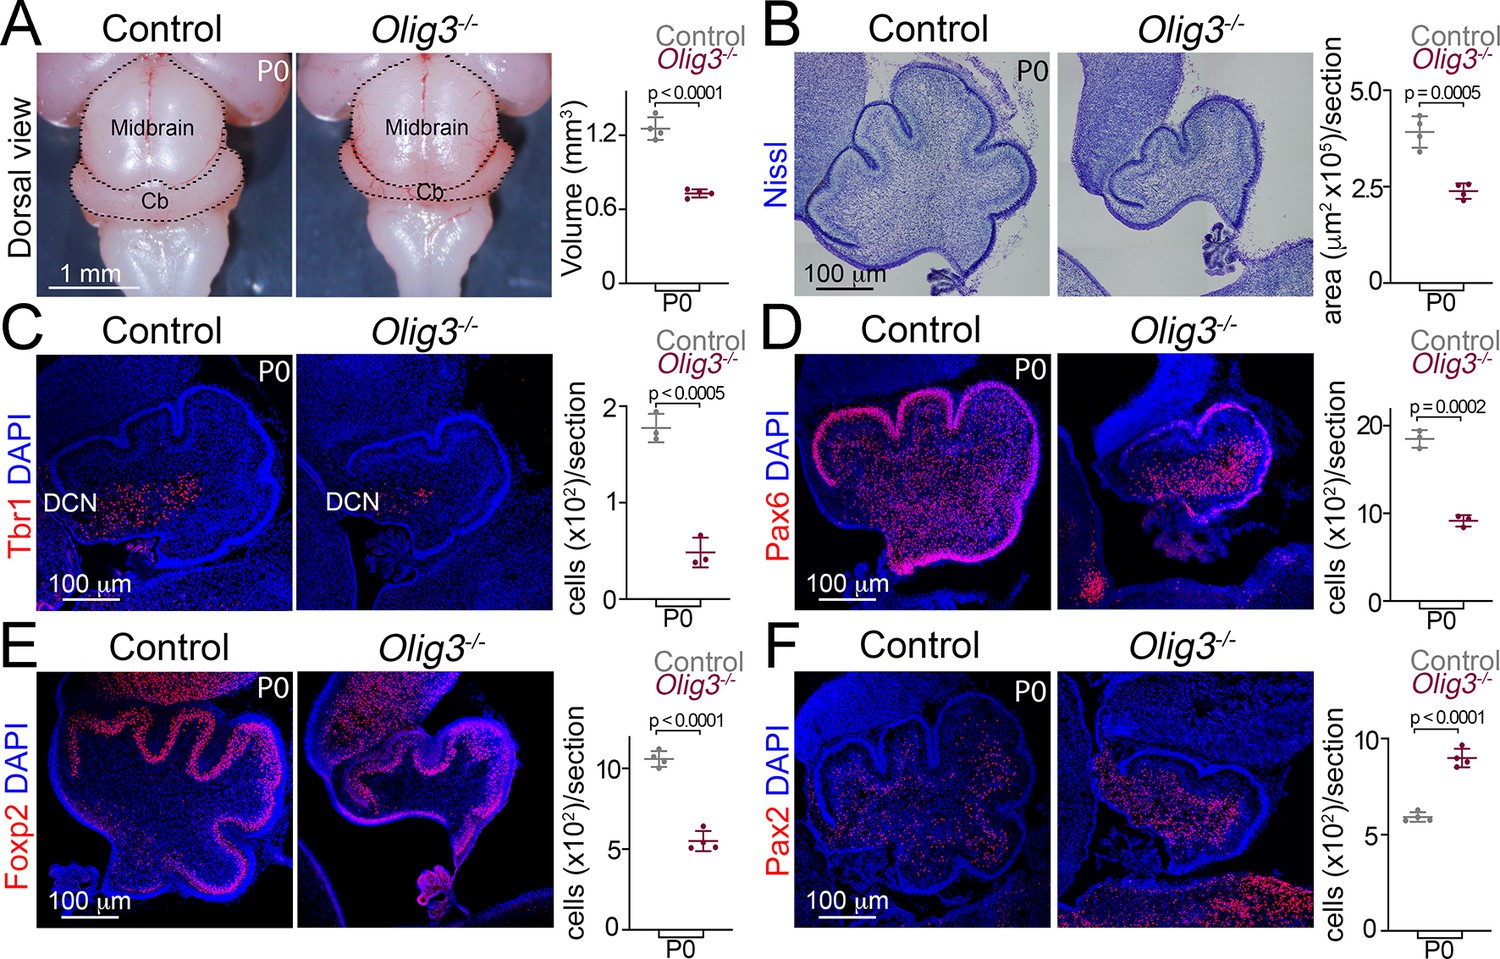
(A) Left, dorsal views of control (Olig3+/-) and Olig3 mutant (Olig3-/-) cerebella at birth (P0). Right, quantification of cerebellar volume in newborn control and Olig3-/- mice. (B) Left, sagittal sections of newborn control and Olig3-/- cerebella stained with Nissl. Right, quantification of cerebellar area in newborn control and Olig3-/- mice. (C–F) Immunofluorescence characterization and quantification of Tbr1+ DCN neurons (C, in red), Pax6+ EGL and granule cells (D, in red), Foxp2+ Purkinje cells (E, in red) and Pax2+ inhibitory interneurons (F, in red) in newborn control and Olig3-/- mice. All cerebellar sagittal sections were counterstained with DAPI (blue). The mean and SD are plotted in all graphs, and the dots represent the mean of individual animals. n = 4 mice per genotype in A, B, E, and F; n = 3 mice per genotype in C and D. Two-tailed t-tests were performed to determine statistical significance. See Table 2 for statistical details. Photographs in A and B were acquired with a conventional bright-field microscope and photomicrographs in C-F were acquired using the automatic tile scan modus (10% overlap between tiles) of the Zeiss LSM700 confocal microscope.
-
Figure 3—source data 1
Source data for Figure 3.
- https://cdn.elifesciences.org/articles/64684/elife-64684-fig3-data1-v1.xlsx
Figure 3—figure supplement 1
Hypoplasia and loss of defined neurons in the cerebellum of Olig3 mutant mice.
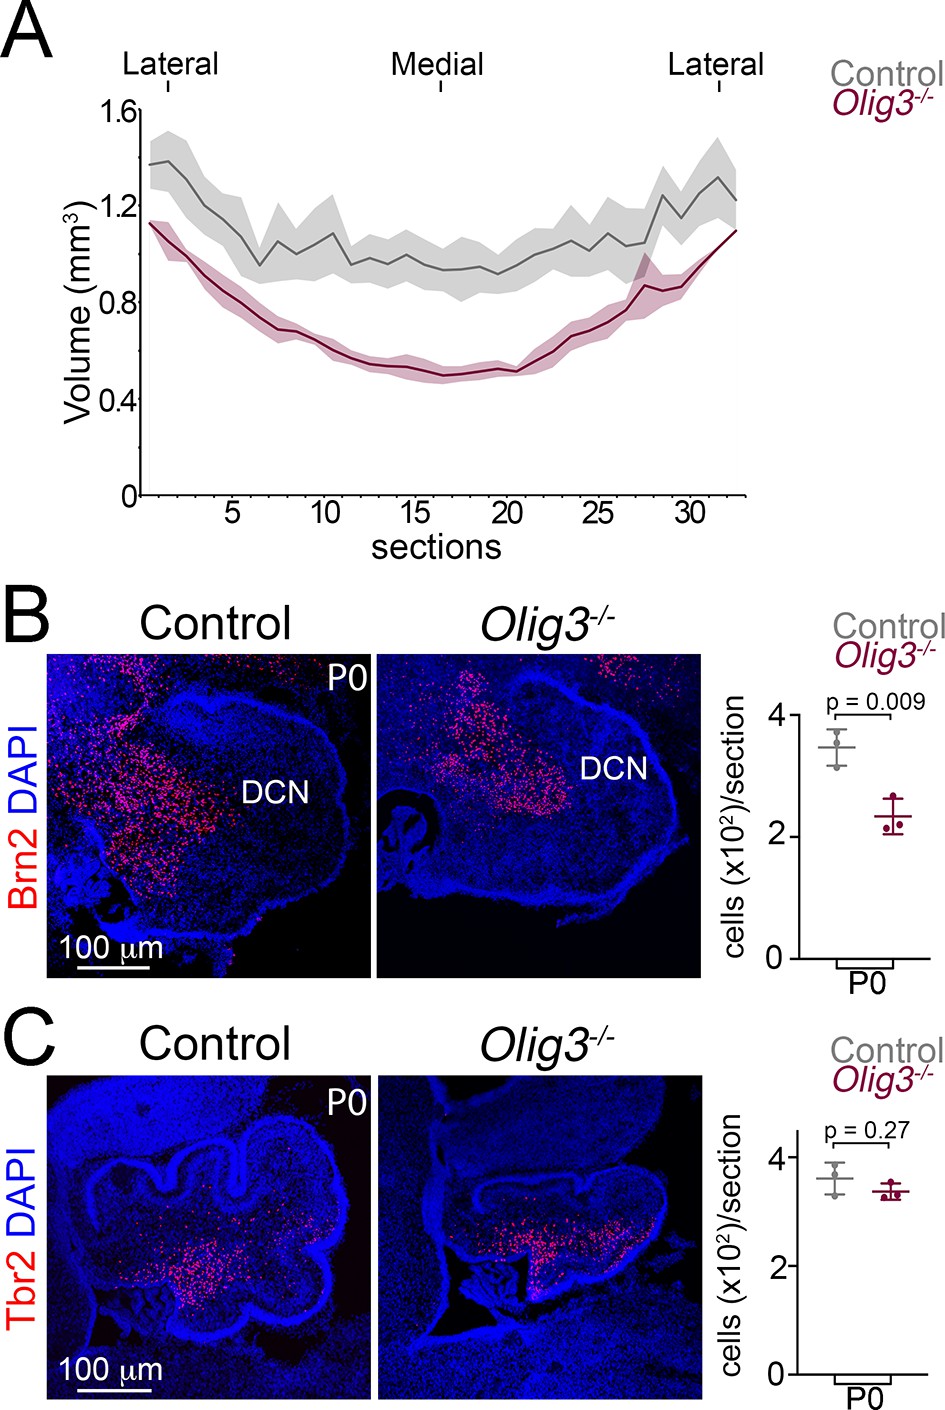
(A) Estimation of cerebellar volume in newborn control (Olig3+/-) and Olig3 mutant (Olig3-/-) mice. The solid lines represent the mean of analyzed animals and the shaded areas the SD (n = 4 mice per genotype), see also Figure 3A. (B, C) Immunofluorescence characterization and quantification of Brn2+ DCN neurons (B, in red) and Tbr2+ unipolar brush cells (C, in red) in newborn control and Olig3-/- mutant mice. All cerebellar sagittal sections were counterstained with DAPI (blue). The mean and SD are plotted in all graphs, and the dots represent the mean of individual animals. n = 3 mice per genotype in B and C. Statistical significance was determined with a two-tailed t-test, see Table 2 for statistical details. Photomicrographs were acquired using the automatic tile scan modus (10% overlap between tiles) of the Zeiss LSM700 confocal microscope.
-
Figure 3—figure supplement 1—source data 1
Source data for Figure 3—figure supplement 1.
- https://cdn.elifesciences.org/articles/64684/elife-64684-fig3-figsupp1-data1-v1.xlsx
Figure 3—figure supplement 2
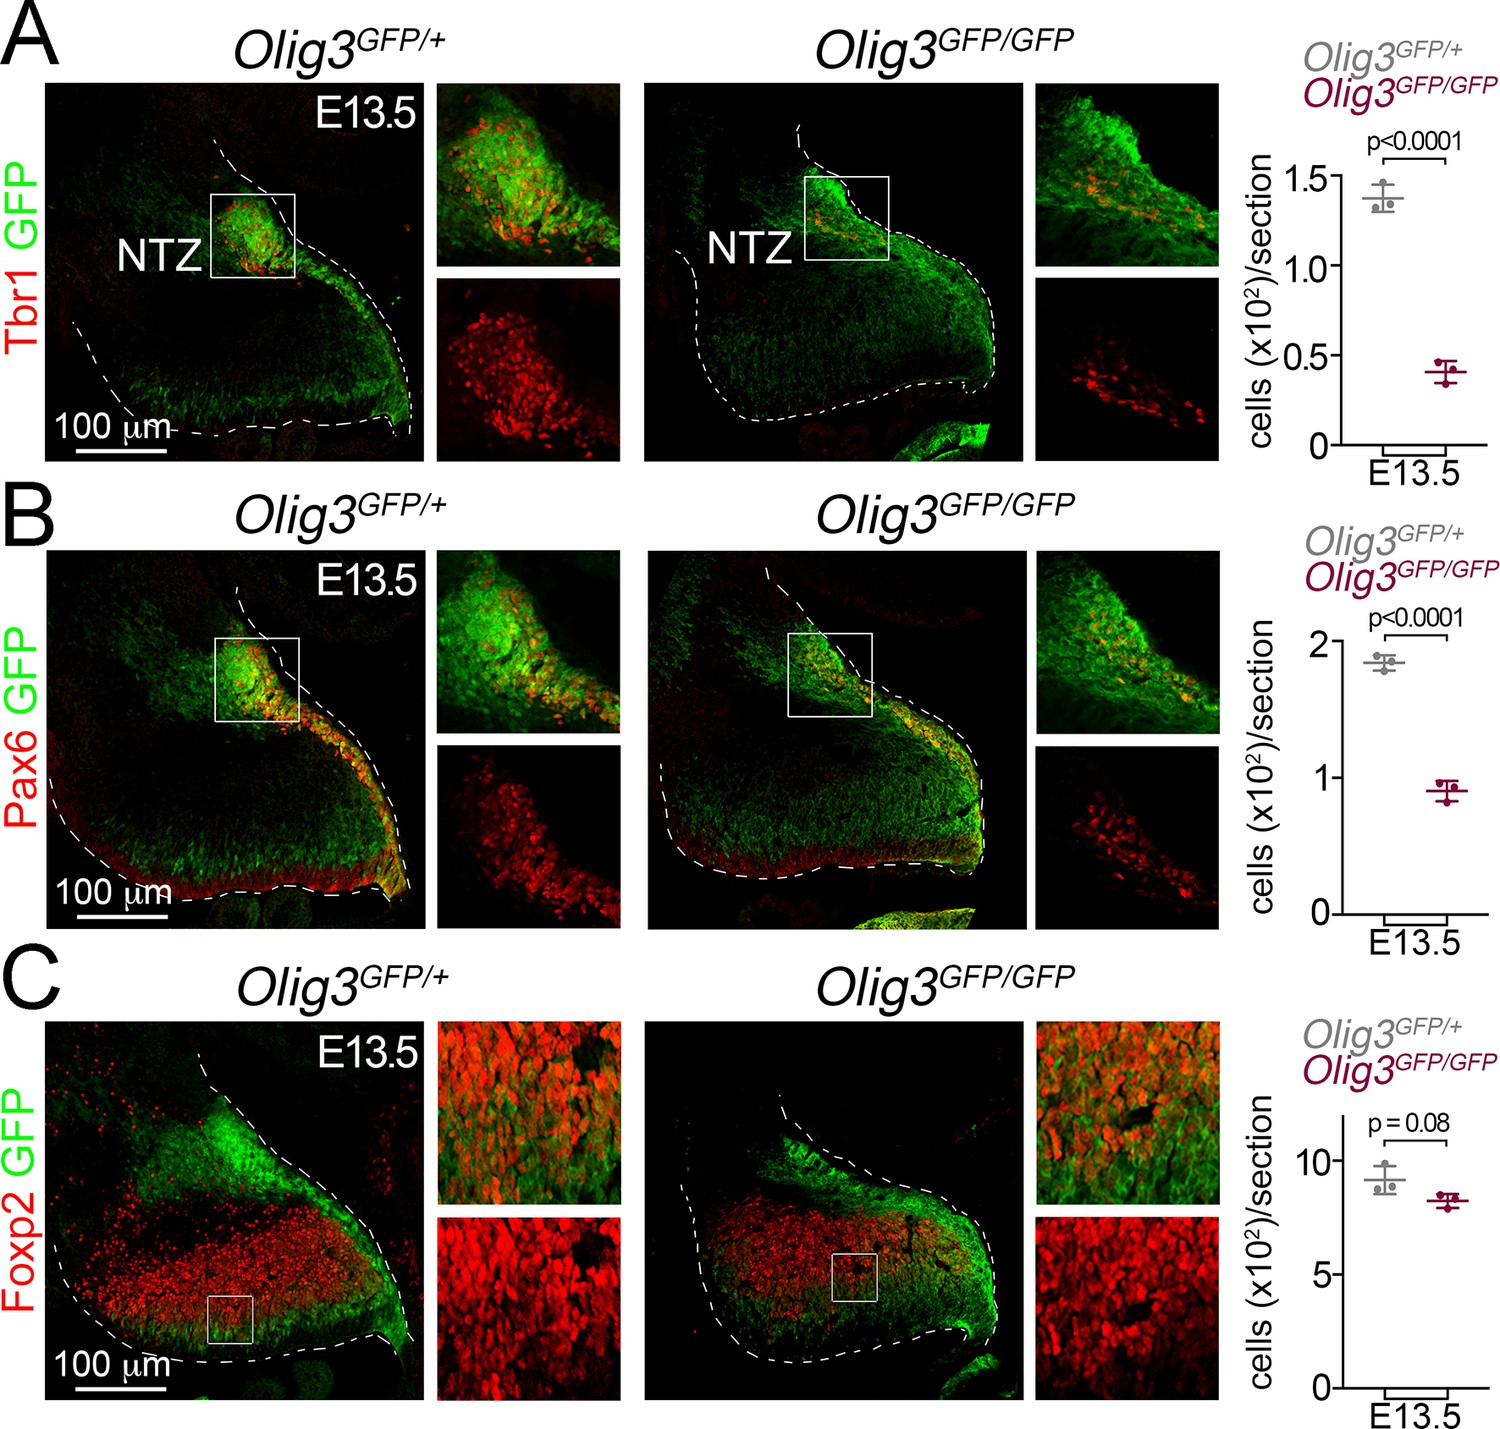
Cerebellar neuron loss in Olig3 mutant embryos.
(A–C) Immunofluorescence characterization and quantification of Tbr1+ DCN neurons (A, in red), Pax6+ EGL cells (B, in red) and Foxp2+ Purkinje cells (C, in red) in E13.5 control (Olig3GFP/+) and Olig3 (Olig3GFP/GFP) mutant embryos. The nuclear transitory zone (NTZ) is marked in A. All cerebellar sagittal sections were stained against GFP (green). The boxed areas on the micrographs are illustrated to the right of the main photographs with or without GFP staining for a better visualization of the Tbr1+, Pax6+ and Foxp2+ cells. The mean and SD are plotted in all graphs, and the dots represent the mean of individual animals. n = 3 mice per genotype. Statistical significance was determined with a two-tailed t-test, see Table 2 for statistical details. Photomicrographs were acquired using the automatic tile scan modus (10% overlap between tiles) of the Zeiss LSM700 confocal microscope.
-
Figure 3—figure supplement 2—source data 1
Source data for Figure 3—figure supplement 2.
- https://cdn.elifesciences.org/articles/64684/elife-64684-fig3-figsupp2-data1-v1.xlsx
Figure 3—figure supplement 3
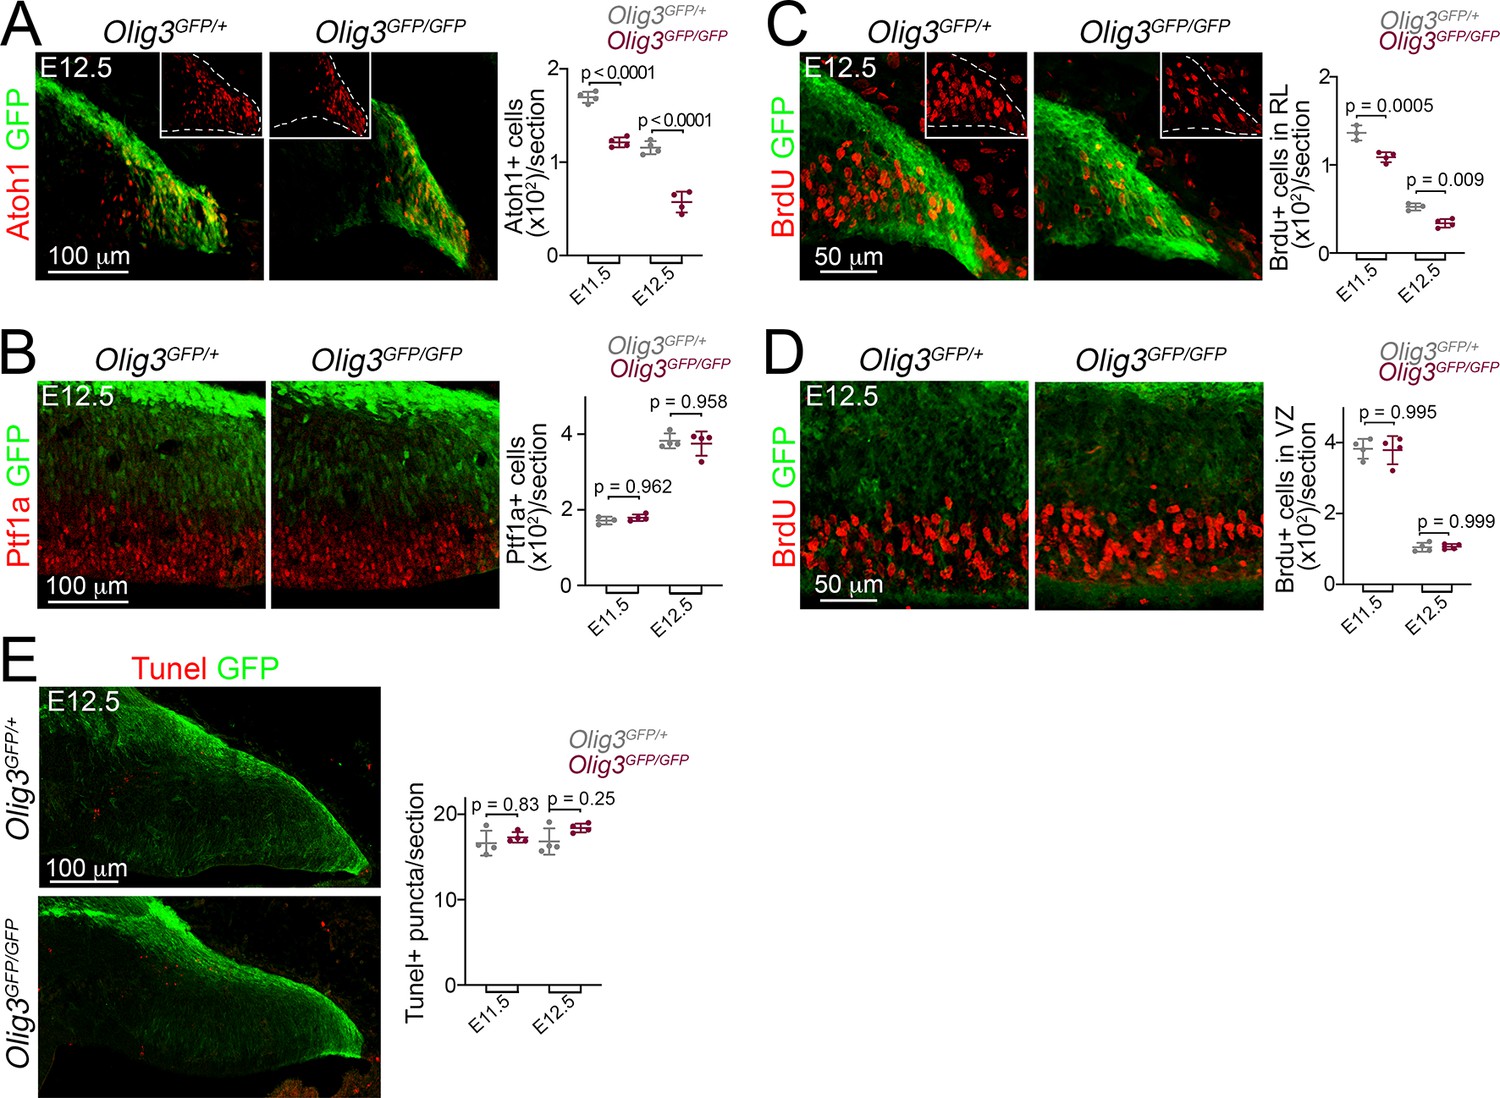
Deficits of rhombic progenitor cells in Olig3 mutant embryos.
(A, B) Left, immunofluorescence characterization of Atoh1+ rhombic lip cells (A, in red) and Ptf1a+ ventricular zone cells (B, in red) in control (Olig3GFP/+) and Olig3 mutant (Olig3GFP/GFP) embryos at E12.5. The insets in A show Atoh1+ cells in the photographs without GFP in control and mutant mice. Right, quantification of Atoh1+ (in A) and Ptf1a+ (in B) cells in control and Olig3 mutant mice at E11.5 and E12.5. All cerebellar sagittal sections were stained against GFP (green). (C–D) Left, immunofluorescence characterization of proliferative BrdU+ (red) in the rhombic lip (C) and ventricular zone (D) of control (Olig3GFP/+) and Olig3 mutant (Olig3GFP/GFP) mice at E12.5. The insets in C show BrdU+ cells in the photographs without GFP in control and mutant mice. Right, quantification of BrdU+ cells in the rhombic lip (RL, in C) and ventricular zone (VZ, in D) in control and Olig3 mutant mice at E11.5 and E12.5. All cerebellar sagittal sections were stained against GFP (green). (E) Left, immunofluorescence characterization of Tunel+ apoptotic bodies (puncta, red) in control (Olig3GFP/+) and Olig3 mutant (Olig3GFP/GFP) mice at E12.5. Right, quantification of Tunel+ apoptotic bodies in control and Olig3 mutant mice at E11.5 and E12.5. All cerebellar sagittal sections were stained against GFP (green). The mean and SD are plotted in all graphs, and the dots represent the mean of individual animals. n = 3 or four mice per genotype. Significance was obtained using a one-way ANOVA followed by post hoc Tukey’s test, see Table 2 for statistical details. Photomicrographs were acquired using the automatic tile scan modus (10% overlap between tiles) of the Zeiss spinning disk confocal microscope (in A and E) and the Zeiss LSM700 confocal microscope (in B, C, and D).
-
Figure 3—figure supplement 3—source data 1
Source data for Figure 3—figure supplement 3.
- https://cdn.elifesciences.org/articles/64684/elife-64684-fig3-figsupp3-data1-v1.xlsx
Figure 4 with 2 supplements
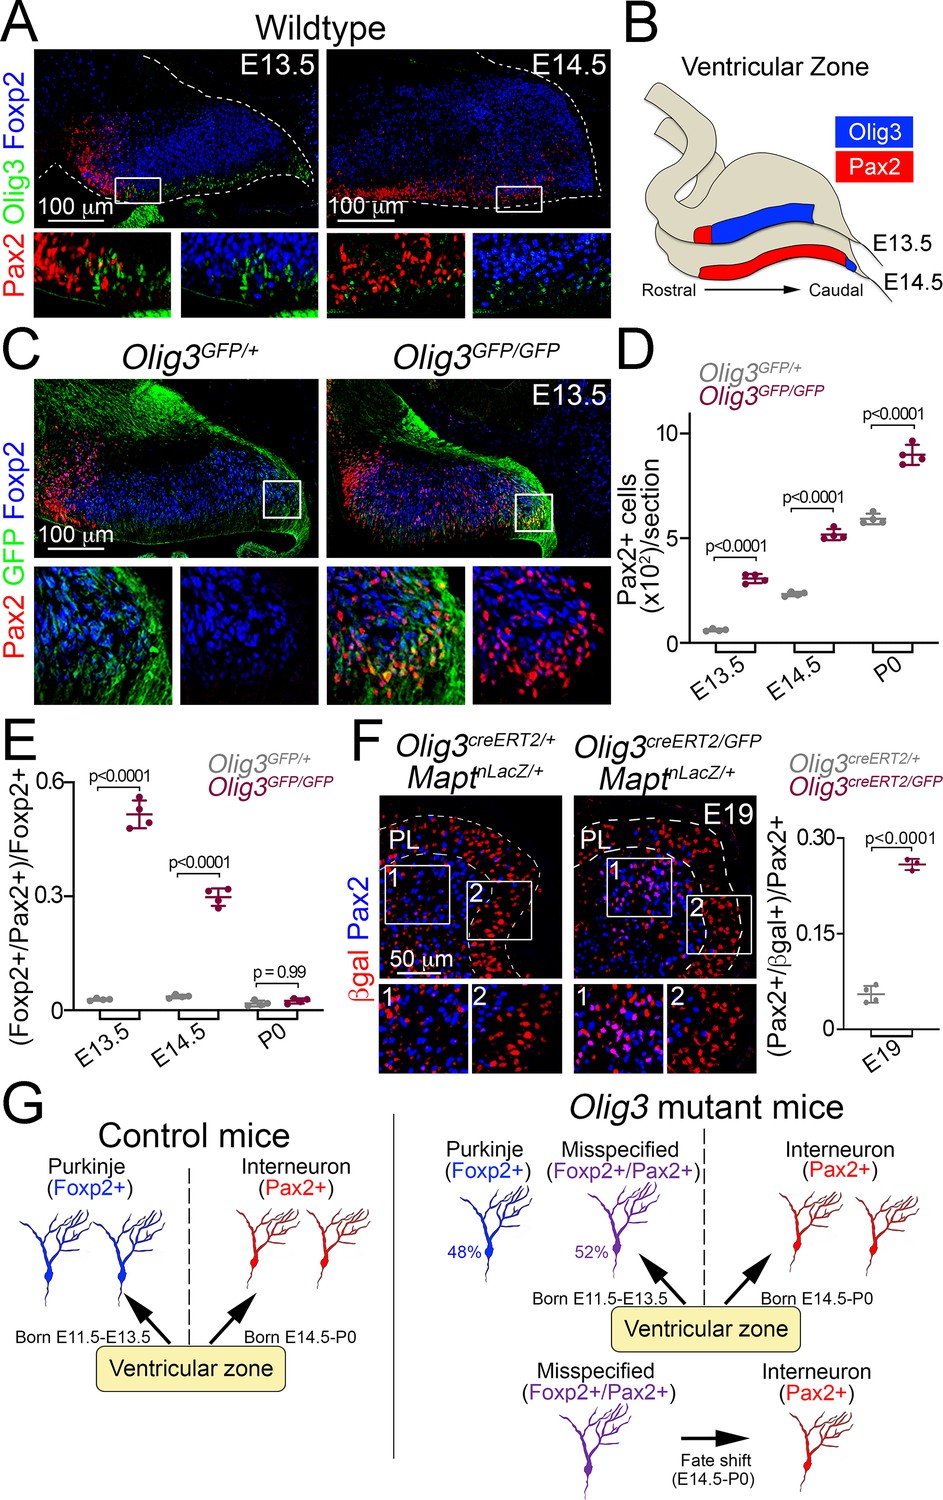
Ablation of Olig3 misspecifies Purkinje cells which become inhibitory interneurons.
(A) Immunofluorescence characterization of Foxp2+ (blue) Purkinje cells, Pax2+ (red) inhibitory interneurons and Olig3+ (green) progenitor cells in wildtype mice at the indicated stages. Boxed areas are magnified underneath the main photographs. (B) Schema illustrating the development of Pax2+ inhibitory interneurons. At E13.5, inhibitory interneurons develop in a rostral domain of the ventricular zone that lacks Olig3 expression. At E14.5, Pax2+ cells span most of the ventricular zone as Olig3 expression becomes extinguished. (C) Immunofluorescence characterization of Foxp2+ (blue) Purkinje cells and Pax2+ (red) inhibitory interneurons in E13.5 control (Olig3GFP/+) and Olig3 mutant (Olig3GFP/GFP) mice. All cerebellar sagittal sections were stained against GFP (green). Boxed areas are magnified underneath the main photographs. Note that GFP+ and Foxp2+ cells ectopically express Pax2 in Olig3GFP/GFP mice. See Figure 4—figure supplement 1 for additional examples and magnifications illustrating the co-expression of Pax2 and Foxp2 in Olig3GFP/GFP mice. (D) Quantification of Pax2+ cells in Olig3GFP/+ and Olig3GFP/GFP mice at the indicated stages. (E) Quantification of the proportion of Foxp2+ Purkinje cells co-expressing Pax2+ in Olig3GFP/+ and Olig3GFP/GFP mice at the indicated stages. (F) Immunofluorescence characterization and quantification of the proportion of Pax2+ (blue) inhibitory interneurons co-expressing βgal (red) in E19 control (Olig3creERT2/+;MaptnLacZ/+) and Olig3 mutant (Olig3creERT2/GFP;MaptnLacZ/+) mice that were recombined at E10.5. (G) Schema illustrating the above findings. In control mice, the ventricular zone generates two sets of GABAergic neurons: Foxp2+ Purkinje cells (E11.5-E13.5) and Pax2+ inhibitory interneurons (E14.5- P0). In Olig3 mutant mice, about half of the Foxp2+ cells are misspecified and co-expressed Pax2. These cells subsequently undergo a fate shift and transform into inhibitory interneurons. The mean and SD are plotted in all graphs, and the dots represent the mean of individual animals. n = 4 mice per genotype in D and E; n = 4 control mice and n = 3 Olig3 mutant mice in F. Significance was determined using a one-way ANOVA followed by post hoc Tukey’s (in D and E) or two-tailed t-test (in F) analyses, see Table 2 for statistical details. Photomicrographs were acquired using the automatic tile scan modus (10% overlap between tiles) of the Zeiss spinning disk confocal microscope (in A and C) and the Zeiss LSM700 confocal microscope (in F).
-
Figure 4—source data 1
Source data for Figure 4.
- https://cdn.elifesciences.org/articles/64684/elife-64684-fig4-data1-v1.xlsx
Figure 4—figure supplement 1

Misspecification of Foxp2+ Purkinje cells in Olig3 mutant mice.
Sagittal cerebellar sections taken from Olig3GFP/+ (control) and Olig3GFP/GFP (mutant) mice at E13.5. The sections were stained against Pax2 (red) and Foxp2 (blue). The boxed areas on the lower panels are displayed to the bottom of the main photographs illustrating individual and merged fluorescent signals. Note that numerous Foxp2+ cells co-express Pax2 (arrowheads) in Olig3 mutant mice. Photomicrographs were acquired using the automatic tile scan modus (10% overlap between tiles) of the Zeiss LSM700 confocal microscope.
Figure 4—figure supplement 2

Misspecified Foxp2+/Pax2+ cell numbers decline over the time in Olig3 mutant mice.
(A) Analysis of Foxp2+ (blue) and Pax2+ (red) cells in control (Olig3GFP/+) and Olig3 mutant (Olig3GFP/GFP) mice at E14.5 (upper panels) and P0 (lower panels). The numbered boxed areas are displayed as magnifications to the right of the main photographs. GFP (green) expressed from the Olig3 locus can be seen at E14.5 but no longer by P0. (B) Quantification of the proportion of Pax2+ cells co-expressing Foxp2 in control and Olig3-/- mutant mice at the indicated stages. The mean and SD are plotted in the graph, and the dots represent the mean of individual animals. n = 4 mice per genotype. Significance was obtained using a one-way ANOVA followed by post hoc Tukey’s test, see Table 2 for statistical details. Photomicrographs were acquired using the automatic tile scan modus (10% overlap between tiles) of the Zeiss spinning disk confocal microscope (upper panels in A) and the Zeiss LSM700 confocal microscope (lower panels in A).
-
Figure 4—figure supplement 2—source data 1
Source data for Figure 4—figure supplement 2.
- https://cdn.elifesciences.org/articles/64684/elife-64684-fig4-figsupp2-data1-v1.xlsx
Figure 5 with 2 supplements
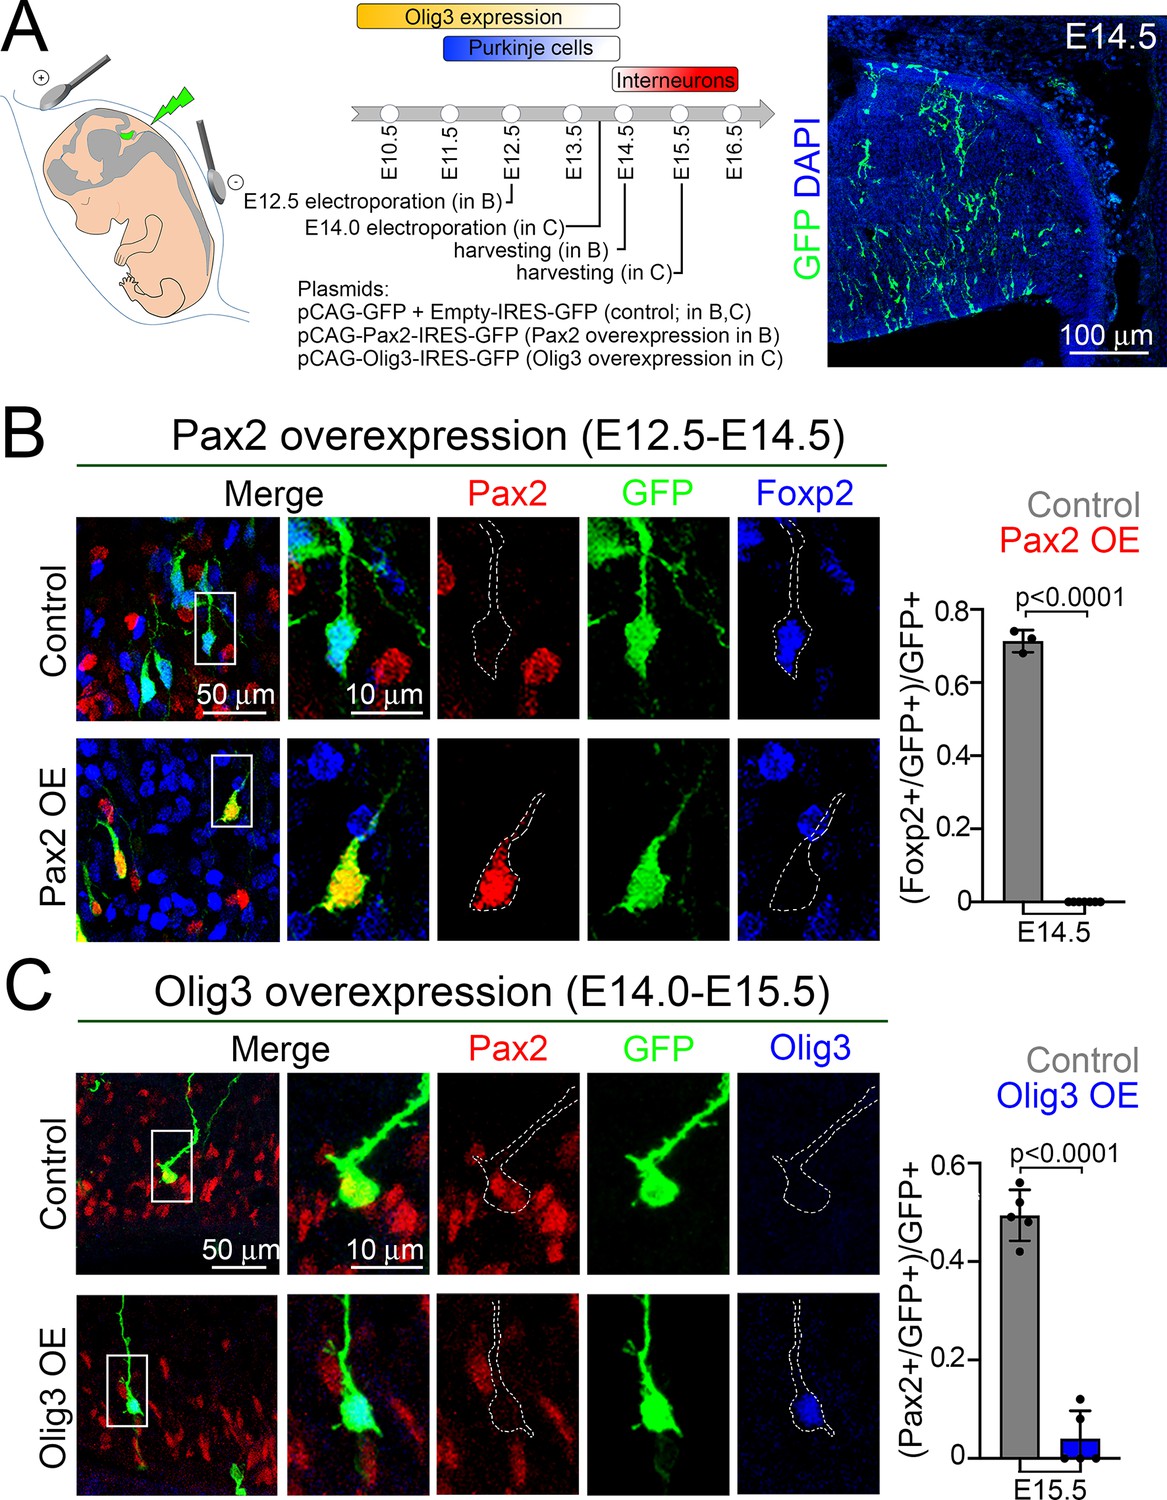
Olig3 cell-autonomously curtails Pax2 expression to prevent the suppression of Foxp2 in newborn Purkinje cells.
(A) Strategy to force Olig3 and Pax2 expression in the ventricular zone of wildtype mouse embryos. Left, illustration of the electrode position required to target the ventricular zone. Middle top, schema illustrating the temporal expression of Olig3, and the generation of Purkinje cells and inhibitory interneurons. Middle bottom, Pax2 and Olig3 expressing vectors were electroporated at E12.5 and E14.0, respectively. Electroporated embryos were harvested at the indicated stages. Electroporated plasmids are shown. Right, a representative cerebellar section stained with GFP (green) and DAPI (blue) of an E14.5 mouse that was electroporated with control plasmids at E12.5. (B) Analysis of E14.5 wildtype mice that were electroporated at E12.5 with control (pCAG-GFP + Empty-IRES-GFP) or Pax2-overexpression (pCAG-Pax2-IRES-GFP) plasmids. Left, representative analyzed cells in the cerebellum of electroporated embryos that were stained against Pax2 (red), GFP (green), and Foxp2 (blue). Right, quantification of the proportion of GFP+ cells co-expressing Foxp2 in electroporated control (Pax2-; n = 3) and Pax2-overexpressing (Pax2+; n = 7) mice. (C) Analysis of E15.5 wildtype mice that were electroporated at E14.0 with control (pCAG-GFP + Empty-IRES-GFP) or Olig3-overexpression (pCAG-Olig3-IRES-GFP) plasmids. Left, representative analyzed cells in the cerebellum of electroporated embryos that were stained against Pax2 (red), GFP (green) and Olig3 (blue). Right, quantification of the proportion of GFP+ cells co-expressing Pax2 in electroporated control (Olig3-; n = 5) and Olig3-overexpressing (Olig3+; n = 5) mice. See Figure 5—figure supplement 2 for additional examples of electroporated cells. The mean and SD are plotted in all graphs, and the dots represent the mean of individual animals. Significance was determined using two-tailed t-tests, see Table 2 for statistical details. Photomicrographs were manually acquired using a Leica SPL confocal microscope.
-
Figure 5—source data 1
Source data for Figure 5.
- https://cdn.elifesciences.org/articles/64684/elife-64684-fig5-data1-v1.xlsx
Figure 5—figure supplement 1
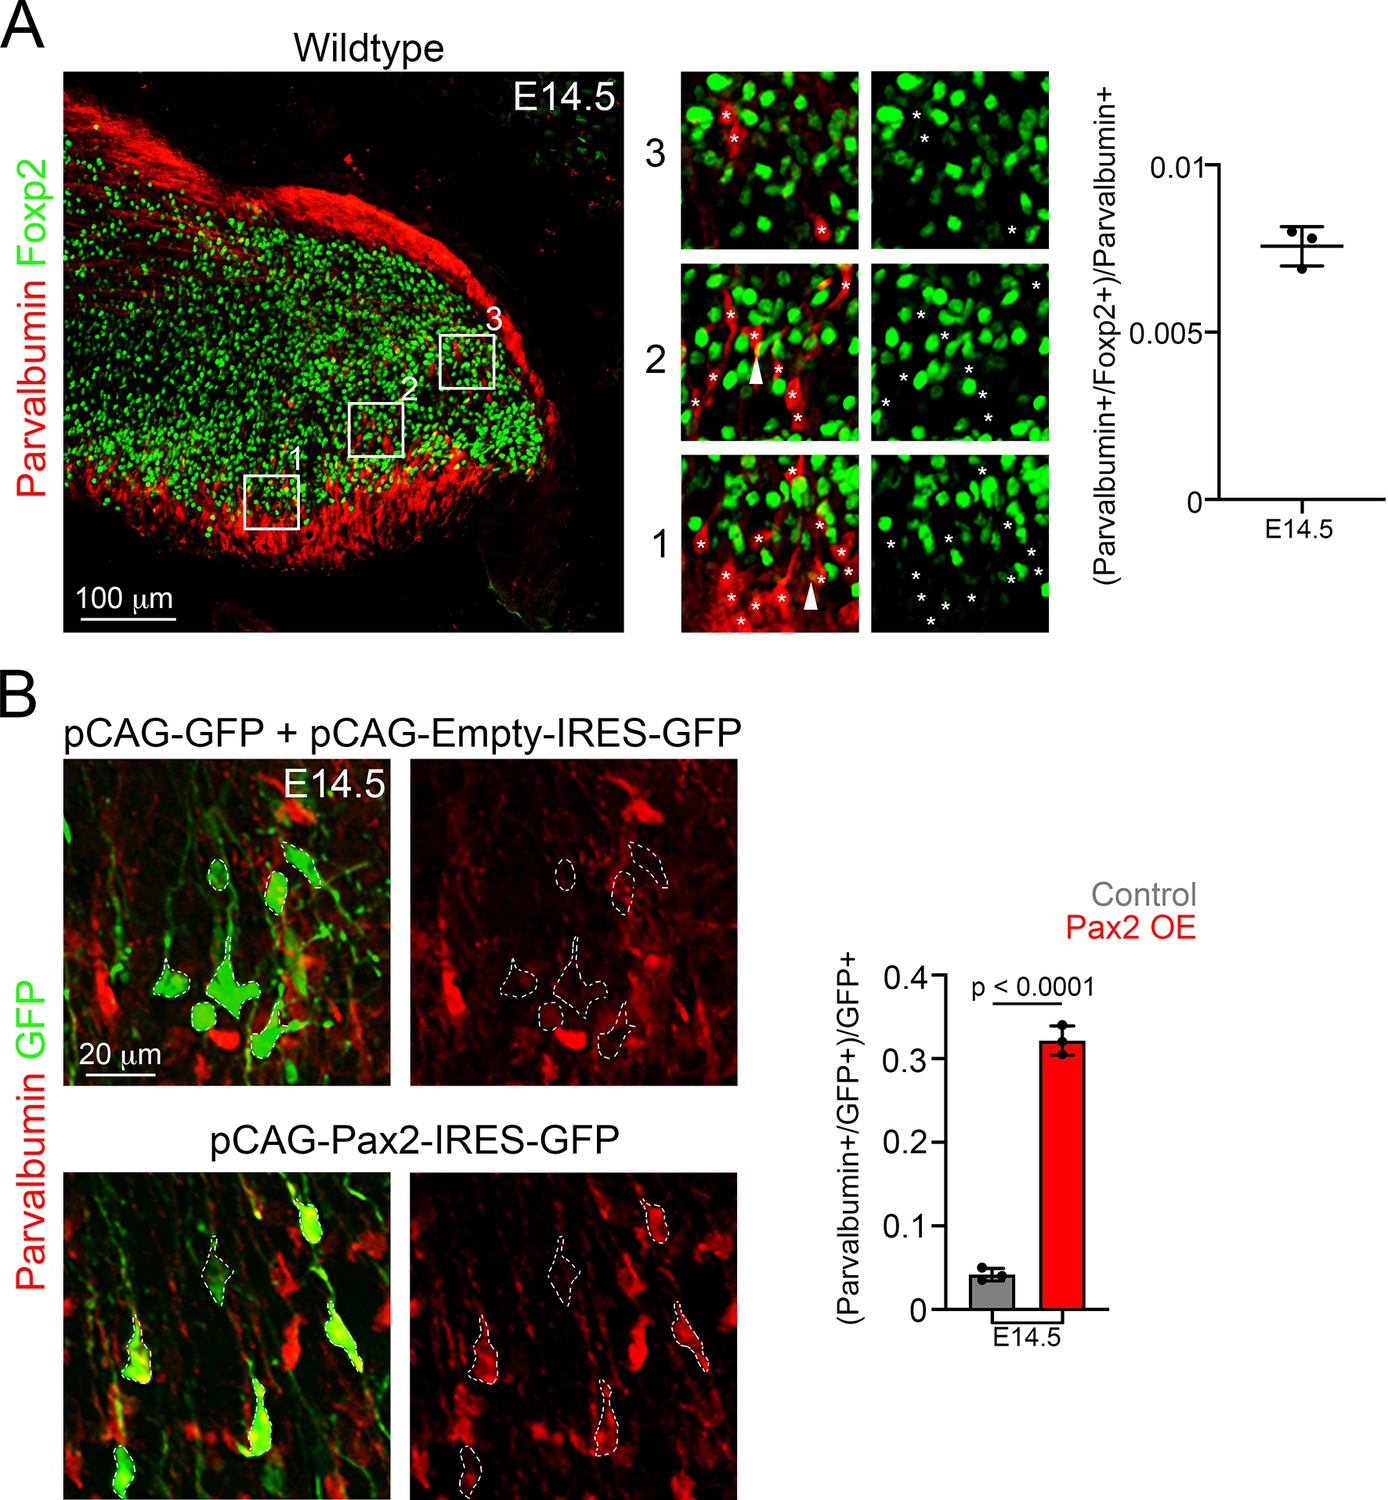
Some Pax2-electroporated cells become Parvalbumin+ interneurons.
(A) Left, a sagittal wildtype cerebellar section stained with Parvalbumin (red) and Foxp2 (green) antibodies at E14.5. The numbered boxed areas are displayed to the right of the main photograph illustrating merged (Foxp2 and Parvalbumin) or individual (Foxp2) fluorescent signals. The asterisks indicate the position of Parvalbumin+ cells. Parvalbumin is cytoplasmatic and marks the soma and neurites of Parvalbumin+ cells. Note that when Parvalbumin+ neurites cross Foxp2+ nuclei it gives the false impression of overlap between both markers (see arrowheads in 1 and 3). Right, quantification of the proportion of Parvalbumin+ cells co-expressing Foxp2 in wildtype mice at E14.5 (n = 3). (B) Analysis of E14.5 wildtype mice that were electroporated at E12.5 with control (pCAG-GFP + Empty-IRES-GFP) or Pax2-overexpression (pCAG-Pax2-IRES-GFP) plasmids. Left, representative analyzed cells in the cerebellum of electroporated embryos that were stained against Parvalbumin (red) and GFP (green). Right, quantification of the proportion of GFP+ cells co-expressing Parvalbumin in electroporated control (Pax2-; n = 3) and Pax2-overexpressing (Pax2+; n = 3) mice. The mean and SD are plotted in all graphs, and the dots represent the mean of individual animals. Significance was determined using two-tailed t-tests, see Table 2 for statistical details. Photomicrographs were acquired using the automatic tile scan modus (10% overlap between tiles) of the Zeiss spinning disk confocal microscope.
-
Figure 5—figure supplement 1—source data 1
Source data for Figure 5—figure supplement 1.
- https://cdn.elifesciences.org/articles/64684/elife-64684-fig5-figsupp1-data1-v1.xlsx
Figure 5—figure supplement 2

Olig3 cell autonomously suppresses Pax2.
Analysis of E15.5 wildtype mice that were electroporated at E14.0 with control (pCAG-GFP + Empty-IRES-GFP) or Olig3-overexpression (pCAG-Olig3-IRES-GFP) plasmids. Representative cells from electroporated embryos that were stained against Pax2 (red) and GFP (green). See Figure 5C for quantifications. Photomicrographs were manually acquired using a Leica SPL confocal microscope.
Figure 6 with 1 supplement
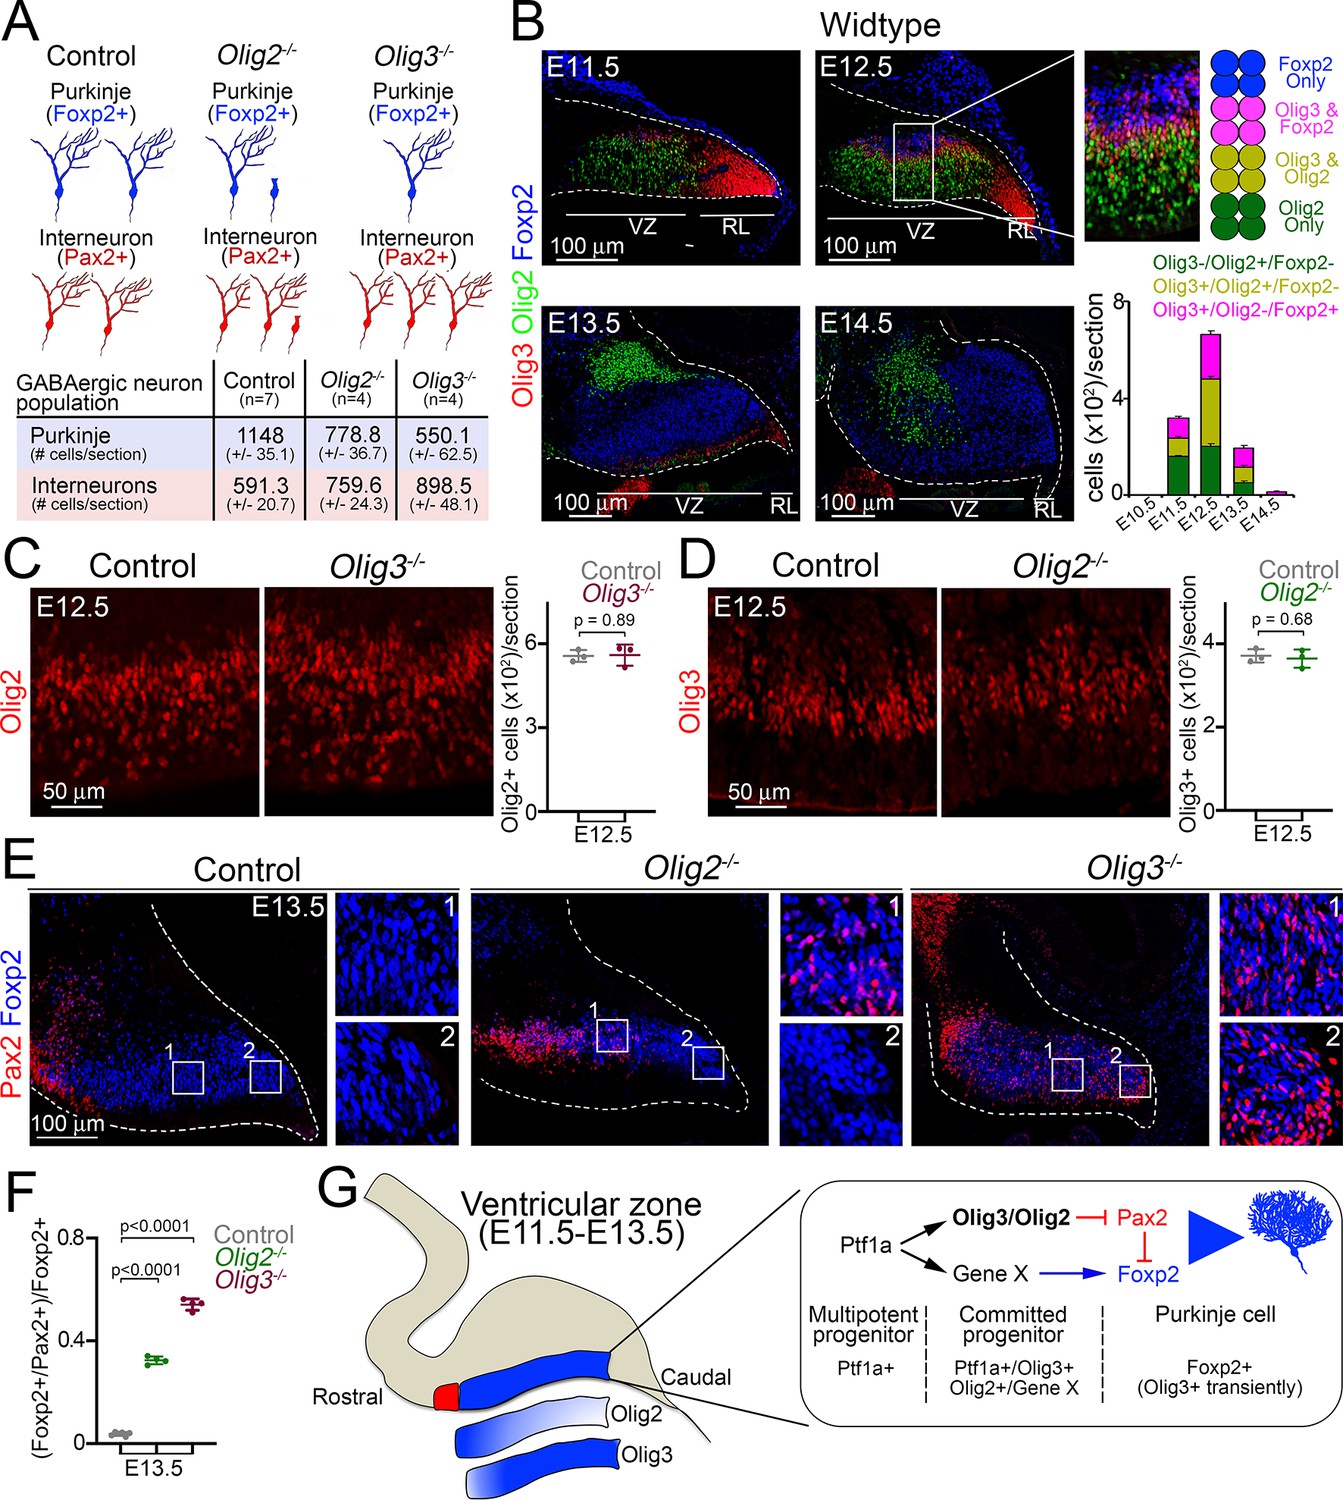
Complementary functions of Olig3 and Olig2 during Purkinje cell development.
(A) Schema and quantification of the phenotypes observed in Olig2 and Olig3 mutant mice with respect to the development of GABAergic cerebellar neurons. See also Figure 3E and F (Olig3 mutant analysis) and Figure 6—figure supplement 1A and B. (Olig2 mutant analysis). n numbers are indicated in the brackets. (B) Immunofluorescence characterization and quantification of Olig3+ (red), Olig2+ (green), and Foxp2+ (blue) cells in the ventricular zone at indicated embryonic stages (n = 4 mice per age). (C) Immunofluorescence characterization and quantification of Olig2+ (red) cells in the ventricular zone of Olig3 (Olig3-/-) mutant mice at E12.5 (n = 3 mice per genotype). See also Figure 6—figure supplement 1E (D) Immunofluorescence characterization and quantification of Olig3+ (red) cells in the ventricular zone of Olig2 (Olig2-/-) mutant mice at E12.5 (n = 3 mice per genotype). See also Figure 6—figure supplement 1F. (E) Immunofluorescence comparison of Foxp2+ (blue) Purkinje cells and Pax2+ (red) inhibitory neurons in control versus Olig2-/- and Olig3-/- mutant mice at E13.5. Numbered boxed areas are displayed to the right of the main photographs. (F) Quantification of the proportion of Foxp2+ cells co-expressing Pax2 in control (n = 6), Olig2-/- (n = 4), and Olig3-/- (n = 4) mutant mice at E13.5. (G) Schematic summary explaining the function of Olig3 and Olig2 in the ventricular zone during the specification of Purkinje cells. Induction of Olig3 and Olig2, in committed Ptf1a+ progenitor cells, curtails the expression of Pax2 to allow for the correct specification of Purkinje cells. Olig2 predominantly operates in the rostral ventricular zone, whereas Olig3 has a broader function and is transiently retained in newborn Purkinje cells. The suppression of Pax2 is critical for Purkinje cell development, as it can override the Purkinje cell differentiation program. The mean and SD are plotted in all graphs, and the dots represent the mean of individual animals. Significance was determined using a one-way ANOVA followed by post hoc Tukey (in F) or two-tailed t-test (in C and D) analyses, see Table 2 for statistical details. Photomicrographs were acquired using the automatic tile scan modus (10% overlap between tiles) of the Zeiss spinning disk confocal microscope (in C-E) and the Zeiss LSM700 confocal microscope (in B).
-
Figure 6—source data 1
Source data for Figure 6.
- https://cdn.elifesciences.org/articles/64684/elife-64684-fig6-data1-v1.xlsx
Figure 6—figure supplement 1
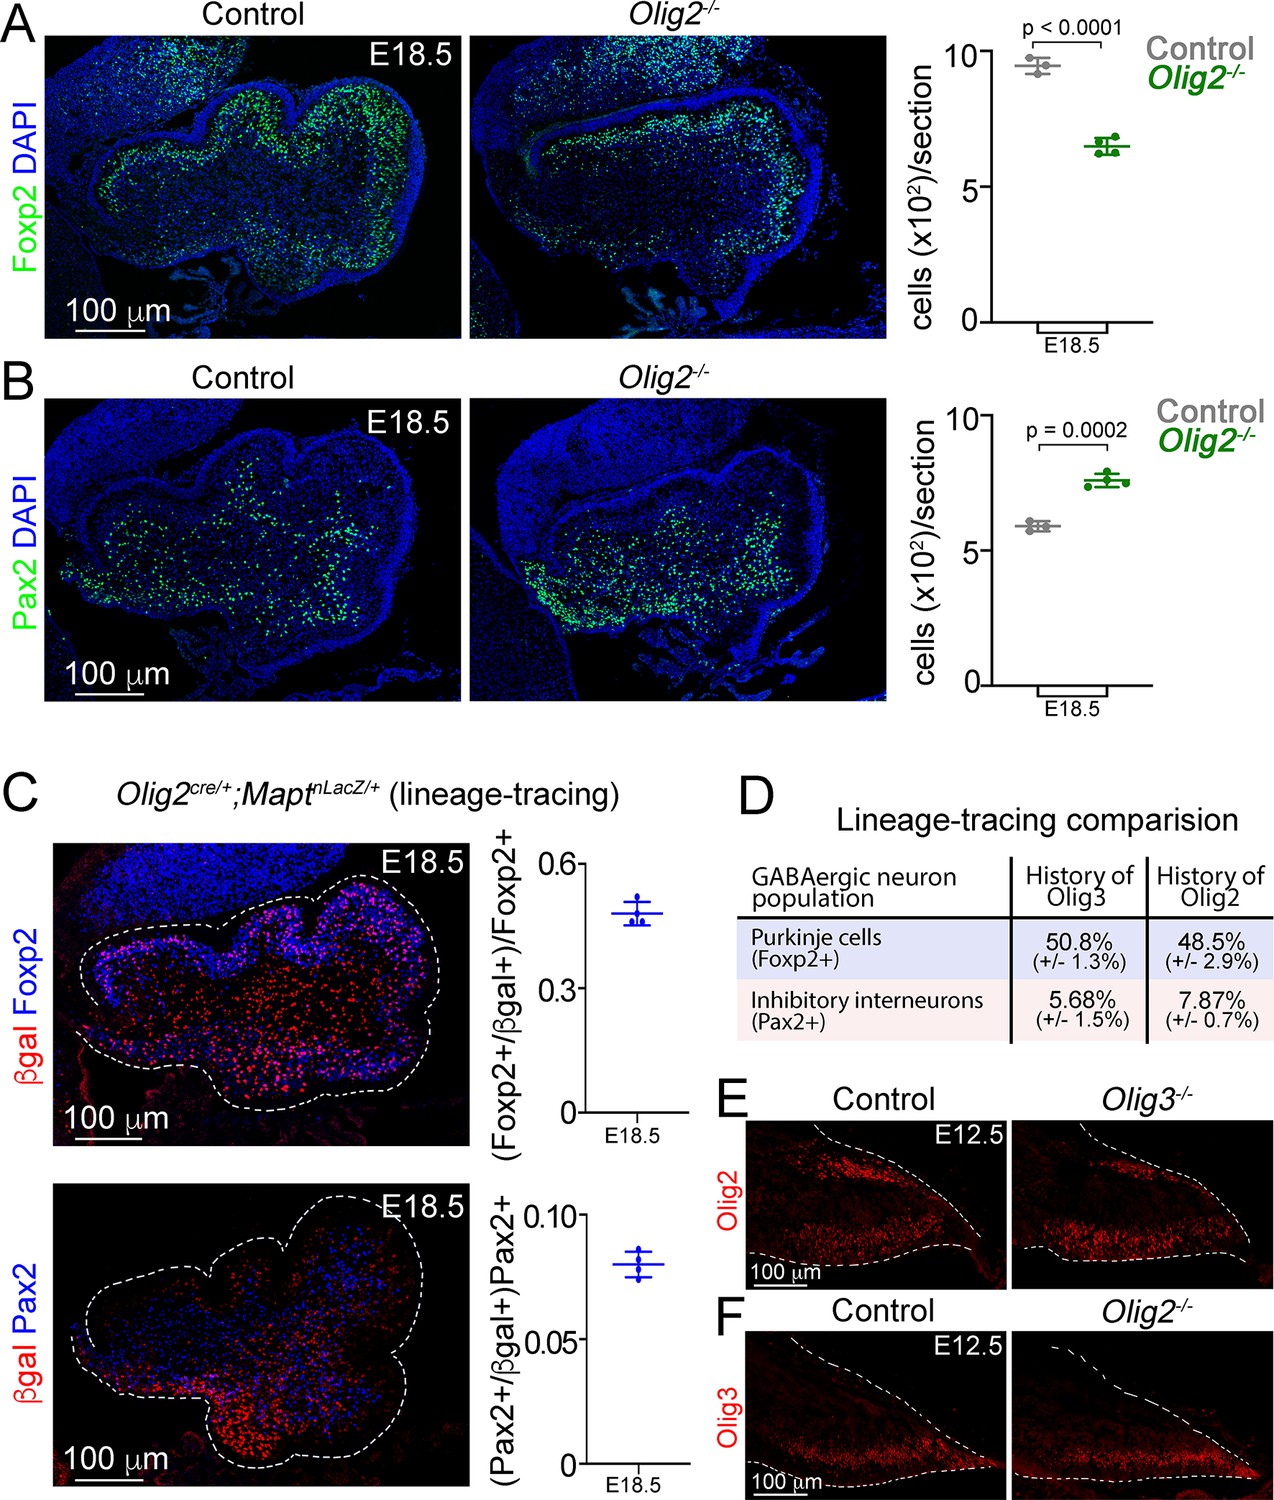
Analysis of GABAergic neurons in Olig2 mutant mice.
(A) Immunofluorescence characterization and quantification of Foxp2+ (green) cells in control (Olig2+/-) and Olig2 mutant (Olig2-/-) mice at E18.5. All cerebellar sagittal sections were counterstained with DAPI (blue). (B) Immunofluorescence characterization and quantification of Pax2+ (green) cells in control and Olig2-/- mutant mice at E18.5. All cerebellar sagittal sections were counterstained with DAPI (blue). (C) Analysis of cerebellar GABAergic neurons with a history of Olig2 (βgal+) expression. Olig2cre/+;MaptnLacZ/+ mice were analyzed at E18.5. Sagittal sections from these mice were stained against βgal (red) and markers for Purkinje cells (Foxp2, blue in upper panel) and inhibitory interneurons (Pax2, blue in lower panel). Double-positive (βgal+/marker+) cells were quantified at E18.5. (D) Summarized comparison of the percentage of GABAergic neurons with a history of Olig3 and Olig2 expression. See Figure 2G and H (for Olig3 analysis) and panel C in this figure for Olig2 analysis. (E) Immunofluorescence characterization of Olig2+ (red) cells in control (Olig3+/-) and Olig3 mutant (Olig3-/-) mice at E12.5. For quantifications see Figure 6C. (F) Immunofluorescence characterization of Olig3+ (red) cells in control (Olig2+/-) and Olig2 mutant (Olig2-/-) mice at E12.5. For quantifications see Figure 6D. The mean and SD are plotted in all graphs, and the dots represent the mean of individual animals. n = 4 mice per genotype. Statistical significance was obtained with a two-tailed t-test, see Table 2 for statistical details. Photomicrographs were acquired using the automatic tile scan modus (10% overlap between tiles) of the Zeiss spinning disk confocal microscope (in A, B, E, and F) and the Zeiss LSM700 confocal microscope (in C).
-
Figure 6—figure supplement 1—source data 1
Source data for Figure 6—figure supplement 1.
- https://cdn.elifesciences.org/articles/64684/elife-64684-fig6-figsupp1-data1-v1.xlsx
Author response image 1
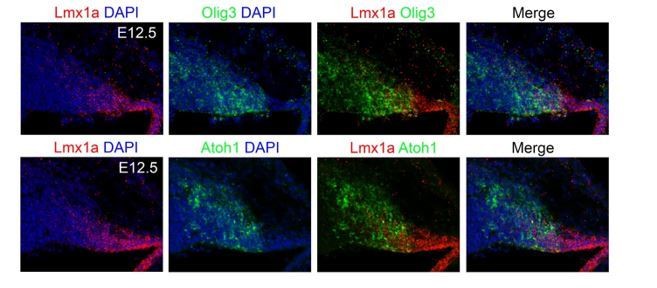
Fluorescent in situ hybridization for Olig3 and Lmx1a transcripts.
Videos
Video 1
Three-dimensional reconstruction of an E19 Olig3creERT2/+; Rosa26lsl-tdT/+ mouse brain that was recombined at E10.5.
Red fluorescence represents the somas and axons of all cells with a history of Olig3 expression. See also Figure 2—figure supplement 1A.
Tables
Table 1
Categorization of bHLH transcription factors expressed or not expressed during cerebellar development in mice.
| bHLH factors expressed in cerebellar progenitor niches: Rhombic lip (RL), Ventricular zone (VZ) and/or external granule cell layer (EGL) | |||||
|---|---|---|---|---|---|
| Gene name | Expressed in progenitors? | Developmental stage: embryonic (E) day | |||
| E11.5 | E13.5 | E15.5 | E17.5/E18.5 | ||
| Ascl1 | Yes | VZ | VZ | Weak in VZ | Not expressed |
| Atoh1 | Yes | RL | RL and EGL | RL and EGL | RL and EGL |
| Hes1 | Yes | Not expressed | RL and VZ | Not expressed | Not expressed |
| Hes5 | Yes | RL and VZ | RL and VZ | RL and VZ | Postmitotic cells |
| Hes6 | Yes | RL and VZ | RL, VZ and EGL | EGL | No data |
| Hes7 | Yes | RL and VZ | Weak in RL, VZ | Weak in RL, VZ | Not expressed |
| Hey1 | Yes | Not expressed | Not expressed | EGL | EGL |
| Hif1a | Yes | RL and VZ | Weak in RL, VZ | Not expressed | Not expressed |
| Id1 | Yes | RL and VZ | In blood vessels | In blood vessels | In blood vessels |
| Id3 | Yes | RL and VZ | RL, VZ and EGL | RL, VZ and EGL | EGL |
| Max | Yes | Weak in RL and VZ | Not expressed | Not expressed | Not expressed |
| Mxd3 | Yes | RL and VZ | RL, VZ and EGL | EGL | EGL |
| Mxi1 | Yes | Weak in RL and VZ | RL, VZ and EGL | RL, VZ and EGL | Weak in EGL |
| Mycl | Yes | RL and VZ | RL, VZ and EGL | EGL | EGL |
| Mycn | Yes | Strong in RL and VZ | Not expressed | Not expressed | Not expressed |
| Neurod1 | Yes | Not expressed | Not expressed | Strong in EGL | Strong in EGL |
| Neurod6 | Yes | Not expressed | Weak in VZ | VZ | Broad expression |
| Neurog1 | Yes | Not expressed | VZ | Not expressed | Not expressed |
| Neurog2 | Yes | Not expressed | Weak in VZ | Strong in VZ | Not expressed |
| Olig2 | Yes | Weak in VZ | Strong in VZ | Postmitotic cells | Postmitotic cells |
| Olig3 | Yes | RL and weak in VZ | RL and VZ | Not expressed | Not expressed |
| Ptf1a | Yes | Strong in VZ | Strong in VZ | Weak in VZ | Not expressed |
| Srebf1 | Yes | Not expressed | RL, VZ and EGL | Weak in EGL | Not expressed |
| Srebf2 | Yes | Weak in RL and VZ | RL and VZ | Postmitotic cells | Postmitotic cells |
| Tcf12 | Yes | RL and VZ | RL, VZ and EGL | RL, VZ and EGL | RL, VZ and EGL |
| Tcf3 | Yes | RL and VZ | RL, VZ and EGL | RL, VZ and EGL | RL, VZ and EGL |
| Tcf4 | Yes | RL and VZ | RL, VZ and EGL | RL, VZ and EGL | RL, VZ and EGL |
| bHLH factors expressed in postmitotic cerebellar cells during development | bHLH factors not expressed in the cerebellum during development | ||||
| Gene name: | Arntl, Arnt2, Bhlhe22, Clock, Epas1, Id2, id4, Mlx, Mnt, Mxd1, Mxd4, Myc, Ncoa1, Ncoa2, Neurod2, Neurog3, Nhlh1, Nhlh2, Npas3, Npas4, Olig1, Scx, Sim2, Usf1 and Usf2 | Gene name: | Ahr, Ahrr, Arnt, Arntl2, Ascl2, Ascl3, Ascl4, Ascl5, Atoh7, Atoh8, Bhlha15, Bhlha9, Bhlhb9, Bhlhe23, Bhlhe40, Bhlhe41, Ferd3l, Figla, Hand1, Hand2, Helt, Hes2, Hes3, Hes4, Hey2, Heyl, Hif3a, Lyl1, Mesp1, Mesp2, Mitf, Mlxip, Mlxipl, Msc, Myf5, Myf6, Myod1, Myog, Ncoa3, Neurod4, Npas1, Npas2, Sim1, Sohlh1, Sohlh2, Tal1, Tal2, Tcf15, Tcf21, Tcf23, Tcf24, Tcfl5, Tfap4, Tfe3, Tfeb, Tfec, Twist1 and Twist2 | ||
Key resources table
| Reagent type (species) or resource | Designation | Source or reference | Identifiers | Additional information |
|---|---|---|---|---|
| Strain, strain background (M. musculus) | Olig3CreERT2 | Storm et al., 2009. | RRID:MGI:3833734 | |
| Strain, strain background (M. musculus) | Olig3GFP | Müller et al., 2005. | ||
| Strain, strain background (M. musculus) | MaptnLacZ | Hippenmeyer et al., 2005. | The Jackson Laboratory, Stock No: 021162 | |
| Strain, strain background (M. musculus) | Rosa26lsl-tdT (Ai14) | Madisen et al., 2010. | The Jackson Laboratory, Stock No. 007908 | |
| Strain, strain background (M. musculus) | Olig2Cre | Dessaud et al., 2007. | ||
| Antibody | Anti-β-gal (Chicken polyclonal) | Abcam | ab9361 RRID:AB_307210 | (1:1,000) |
| Antibody | Anti-GFP (Chicken polyclonal) | Abcam | ab13970 RRID:AB_300798 | (1:500) |
| Antibody | Anti-Brn2 (Goat polyclonal) | Abcam | ab101726 RRID:AB_10710183 | (1:1,000) |
| Antibody | Anti-Foxp2 (Goat polyclonal) | Abcam | ab58599 RRID:AB_941649 | (1:1,000) |
| Antibody | Anti-Olig3 (Guinea pig polyclonal) | Gift from T. Muller | Homemade | (1:5,000) |
| Antibody | Anti-Foxp2 (Rabbit polyclonal) | Abcam | ab16046 RRID:AB_2107107 | (1:1,000) |
| Antibody | Anti-GFP (Rabbit polyclonal) | Abcam | ab290 RRID:AB_303395 | (1:500) |
| Antibody | Anti-Pax2 (Rabbit monoclonal) | Abcam | EP3251 RRID:AB_1603338 | (1:1,000) |
| Antibody | Anti-Sox2 (Rabbit polyclonal) | Abcam | ab97959 RRID:AB_2341193 | (1:1,000) |
| Antibody | Anti-Tbr1 (Rabbit polyclonal) | Abcam | ab31940 RRID:AB_2200219 | (1:1,000) |
| Antibody | Anti-Tbr2 (Rabbit polyclonal) | Abcam | ab23345 RRID:AB_778267 | (1:1,000) |
| Antibody | Anti-Ptf1a (Rabbit polyclonal) | Gift from J. Johnson | Homemade | (1:5,000) |
| Antibody | Anti-Olig2 (Rabbit polyclonal) | Merck Millipore | AB9610 RRID:AB_570666 | (1:1,000) |
| Antibody | Anti-Pax6 (Rabbit polyclonal) | Merck Millipore | AB2237 RRID:AB_1587367 | (1:1,000) |
| Antibody | Anti-RFP (Rabbit polyclonal) | Rockland | 600-401-379 RRID:AB_2209751 | (1:500) |
| Antibody | Anti-Caspase-3 (Rabbit polyclonal) | R and D Systems | AF835 RRID:AB_2243952 | (1:1,000) |
| Antibody | Anti-Parvalbumin (Rabbit polyclonal) | Swant | PV 27 RRID:AB_2631173 | (1:3,000) |
| Antibody | Anti-Atoh1 (Rabbit polyclonal) | Gift from T. Jessell | Homemade | (1:10,000) |
| Antibody | Anti-BrdU (Rat monoclonal) | Abcam | ab6326 RRID:AB_305426 | (1:2,000) |
| Antibody | Anti-GFP (Rat monoclonal) | Nacalai Tesque | GF090R RRID:AB_10013361 | (1:2,000) |
| Antibody | Donkey anti-species Alexa Fluor488/568/647 | Jackson ImmunoResearch | Various | (1:500) |
| Commercial Assay or kit | BrdU | Sigma-Aldrich | B5002-1G | 16 mg/ml in 0.9% saline solution |
| Recombinant DNA reagent | pCAG-GFP | Addgene | Plasmid #11150 RRID:Addgene_11150 | |
| Recombinant DNA reagent | pCAG-Empty-IRES-GFP | This paper | ||
| Recombinant DNA reagent | pCAG-Olig3-IRES-GFP | This paper | vector: pCAG; cDNA fragment: mouse Olig3 | |
| Recombinant DNA reagent | pCAG-Pax2-IRES-GFP | This paper | vector: pCAG; cDNA fragment: mouse Pax2 | |
| Sequence-based reagent (M. musculus) | Mouse Olig3 forward primer | Olig3FW | PCR Primer | ATGAATTCTGATTCGAGC |
| Sequence-based reagent (M. musculus) | Mouse Olig3 reverse primer | Olig3RV | PCR Primer | TTAAACCTTATCGTCGTC |
| Sequence-based reagent (M. musculus) | Mouse Pax2 forward primer | Pax2FW | PCR Primer | ATGGATATGCACTGCAAAGCAG |
| Sequence-based reagent (M. musculus) | Mouse Pax2 reverse primer | Pax2RV | PCR Primer | GTGGCGGTCATAGGCAGC |
| Software, algorithm | GraphPad Prism | GraphPad Software | RRID:SCR_002798 | Prism 8 |
| Software, algorithm | Adobe Photoshop | Adobe | RRID:SCR_014199 | Adobe Photoshop CS6 |
| Software, algorithm | ImageJ | NIH | RRID:SCR_002285 | |
| Software, algorithm | Arivis Vision4D | Arivis | RRID:SCR_018000 | Arivis Vision4D 3.2 |
Table 2
Description of the statistical analyses used in this study.
| Fig. | N | Descriptive statistics | Test used | p Value | Degrees of freedom and F/t/z/R/ETC | Pos hoc analysis | Adjusted p value |
|---|---|---|---|---|---|---|---|
| 2E | Three mice (E10.5) three mice (E11.5) three mice (E12.5) three mice (E13.5) | Mean and SD | Ordinary one-way ANOVA | <0.0001 | F: 67.20 F(DFn, DFd): 0.1441 (3, 8) | Tukey’s multiple comparative test | As indicated in the figure |
| 2F | Three mice (E10.5) three mice (E11.5) three mice (E12.5) three mice (E13.5) | Mean and SD | Ordinary one-way ANOVA | <0.0001 | F: 93.57 F(DFn, DFd): 1.868 (3, 8) | Tukey’s multiple comparative test | As indicated in the figure |
| 2G | Three mice (E10.5) three mice (E11.5) three mice (E12.5) three mice (E13.5) | Mean and SD | Ordinary one-way ANOVA | <0.0001 | F: 122.2 F(DFn, DFd): 1.096 (3, 8) | Tukey’s multiple comparative test | As indicated in the figure |
| 2H | Three mice (E10.5) three mice (E11.5) three mice (E12.5) three mice (E13.5) | Mean and SD | Ordinary one-way ANOVA | <0.0001 | F: 13.65 F(DFn, DFd): 0.8851 (3, 8) | Tukey’s multiple comparative test | As indicated in the figure |
| 3A | Four control mice four mutant mice | Mean and SD | Unpaired t-test (two-tailed) | <0.0001 | t = 15.13; df = 6 | - | - |
| 3B | Four control mice four mutant mice | Mean and SD | Unpaired t-test (two-tailed) | 0.0005 | t = 6.742; df = 6 | - | - |
| 3C | Three control mice three mutant mice | Mean and SD | Unpaired t-test (two-tailed) | 0.0005 | t = 10.47; df = 4 | - | - |
| 3D | Three control mice three mutant mice | Mean and SD | Unpaired t-test (two-tailed) | 0.0002 | t = 13.45; df = 4 | - | - |
| 3E | Four control mice four mutant mice | Mean and SD | Unpaired t-test (two-tailed) | <0.0001 | t = 16.89; df = 6 | - | - |
| 3F | Four control mice four mutant mice | Mean and SD | Unpaired t-test (two-tailed) | <0.0001 | t = 11.26; df = 6 | - | - |
| 4D | Four control (E13.5) four mutant (E13.5) four control (E14.5) four mutant (E14.5) four control (P0) four mutant (P0) | Mean and SD | Ordinary one-way ANOVA | <0.0001 | F: 498.6 F(DFn, DFd): 1.252 (5, 18) | Tukey’s multiple comparative test | As indicated in the figure |
| 4E | Four control (E13.5) four mutant (E13.5) four control (E14.5) four mutant (E14.5) four control (P0) four mutant (P0) | Mean and SD | Ordinary one-way ANOVA | <0.0001 | F: 514.2 F(DFn, DFd): 7.873 (5, 18) | Tukey’s multiple comparative test | As indicated in the figure |
| 4F | Four control mice three mutant mice | Mean and SD | Unpaired t-test (two-tailed) | <0.0001 | t = 22.92; df = 5 | - | - |
| 5B | Three control-OE mice 7 Pax2-OE mice | Mean and SD | Unpaired t-test (two-tailed) | <0.0001 | t = 67.67; df = 8 | - | - |
| 5C | Five control-OE mice 5 Olig3-OE mice | Mean and SD | Unpaired t-test (two-tailed) | 0.0001 | t = 13.24; df = 8 | - | - |
| 6C | Three control mice three mutant mice | Mean and SD | Unpaired t-test (two-tailed) | 0.8969 | t = 0.1380; df = 4 | - | - |
| 6D | Three control mice three mutant mice | Mean and SD | Unpaired t-test (two-tailed) | 0.6835 | t = 0.4387; df = 4 | - | - |
| 6F | Four control 4 Olig3 mutant 4 Olig2 mutant | Mean and SD | Ordinary one-way ANOVA | <0.0001 | F: 1416 F(DFn, DFd): 0.8767 (2, 11) | Tukey’s multiple comparative test | As indicated in the figure |
| 2-fs 1C | Three mice (E10.5) three mice (E11.5) three mice (E12.5) three mice (E13.5) | Mean and SD | Ordinary one-way ANOVA | <0.0001 | F: 299.8 F(DFn, DFd): 0.3133 (3, 8) | Tukey’s multiple comparative test | As indicated in the figure |
| 2-fs 1D | Three mice (E10.5) three mice (E11.5) three mice (E12.5) three mice (E13.5) | Mean and SD | Ordinary one-way ANOVA | <0.0001 | F: 100.9 F(DFn, DFd): 0.2601 (3, 8) | Tukey’s multiple comparative test | As indicated in the figure |
| 2-fs 1E | Three mice (E10.5) three mice (E11.5) three mice (E12.5) three mice (E13.5) | Mean and SD | Ordinary one-way ANOVA | <0.0001 | F: 85.64 F(DFn, DFd): 0.08333 (3, 8) | Tukey’s multiple comparative test | As indicated in the figure |
| 3-fs 1B | Three control mice three mutant mice | Mean and SD | Unpaired t-test (two-tailed) | 0.0093 | t = 4.707; df = 4 | - | - |
| 3-fs 1C | Three control mice three mutant mice | Mean and SD | Unpaired t-test (two-tailed) | 0.2799 | t = 1.249; df = 4 | - | - |
| 3-fs 2A | Three control mice three mutant mice | Mean and SD | Unpaired t-test (two-tailed) | <0.0001 | t = 16.84; df = 4 | - | - |
| 3-fs 2B | Three control mice three mutant mice | Mean and SD | Unpaired t-test (two-tailed) | <0.0001 | t = 17.51; df = 4 | - | - |
| 3-fs 2C | Three control mice three mutant mice | Mean and SD | Unpaired t-test (two-tailed) | 0.0801 | t = 2.331; df = 4 | - | - |
| 3-fs 3A | Four control (E11.5) four mutant (E11.5) four control (E12.5) four mutant (E12.5) | Mean and SD | Ordinary one-way ANOVA | <0.0001 | F: 139.7 F(DFn, DFd): 2.328 (3, 12) | Tukey’s multiple comparative test | As indicated in the figure |
| 3-fs 3B | Three control (E11.5) four mutant (E11.5) four control (E12.5) four mutant (E12.5) | Mean and SD | Ordinary one-way ANOVA | <0.0001 | F: 118.9 F(DFn, DFd): 0.3083 (3, 11) | Tukey’s multiple comparative test | As indicated in the figure |
| 3-fs 3C | Three control (E11.5) four mutant (E11.5) three control (E12.5) four mutant (E12.5) | Mean and SD | Ordinary one-way ANOVA | <0.0001 | F: 232.2 F(DFn, DFd): 0.4627 (3, 10) | Tukey’s multiple comparative test | As indicated in the figure |
| 3-fs 3D | Four control (E11.5) four mutant (E11.5) four control (E12.5) four mutant (E12.5) | Mean and SD | Ordinary one-way ANOVA | <0.0001 | F: 156.3 F(DFn, DFd): 0.9549 (3, 12) | Tukey’s multiple comparative test | As indicated in the figure |
| 3-fs 3E | Four control (E11.5) four mutant (E11.5) four control (E12.5) four mutant (E12.5) | Mean and SD | Ordinary one-way ANOVA | 0.1739 | F: 1.960 F(DFn, DFd): 0.4100 (3, 12) | Tukey’s multiple comparative test | As indicated in the figure |
| 4-fs 2B | Four control (E13.5) four mutant (E13.5) four control (E14.5) four mutant (E14.5) four control (P0) four mutant (P0) | Mean and SD | Ordinary one-way ANOVA | <0.0001 | F: 850.2 F(DFn, DFd): 3.630 (5, 18) | Tukey’s multiple comparative test | As indicated in the figure |
| 5-fs 1B | Three control-OE mice 3 Pax2-OE mice | Mean and SD | Unpaired t-test (two-tailed) | <0.0001 | t = 22.79; df = 4 | - | - |
| 6-fs 1A | Three control mice four mutant mice | Mean and SD | Unpaired t-test (two-tailed) | <0.0001 | t = 12.82; df = 5 | - | - |
| 6-fs 1B | Three control mice four mutant mice | Mean and SD | Unpaired t-test (two-tailed) | 0.0002 | t = 10.1; df = 5 | - | - |
-
OE, overexpression; fs, figure supplement.
Additional files
Download links
A two-part list of links to download the article, or parts of the article, in various formats.
Downloads (link to download the article as PDF)
Open citations (links to open the citations from this article in various online reference manager services)
Cite this article (links to download the citations from this article in formats compatible with various reference manager tools)
Olig3 regulates early cerebellar development
eLife 10:e64684.
https://doi.org/10.7554/eLife.64684


