Mitochondrial copper and phosphate transporter specificity was defined early in the evolution of eukaryotes
- Department of Biological Sciences, Auburn University, United States
- Department of Biochemistry, Microbiology and Immunology, University of Saskatchewan, Canada
Figures
Figure 1
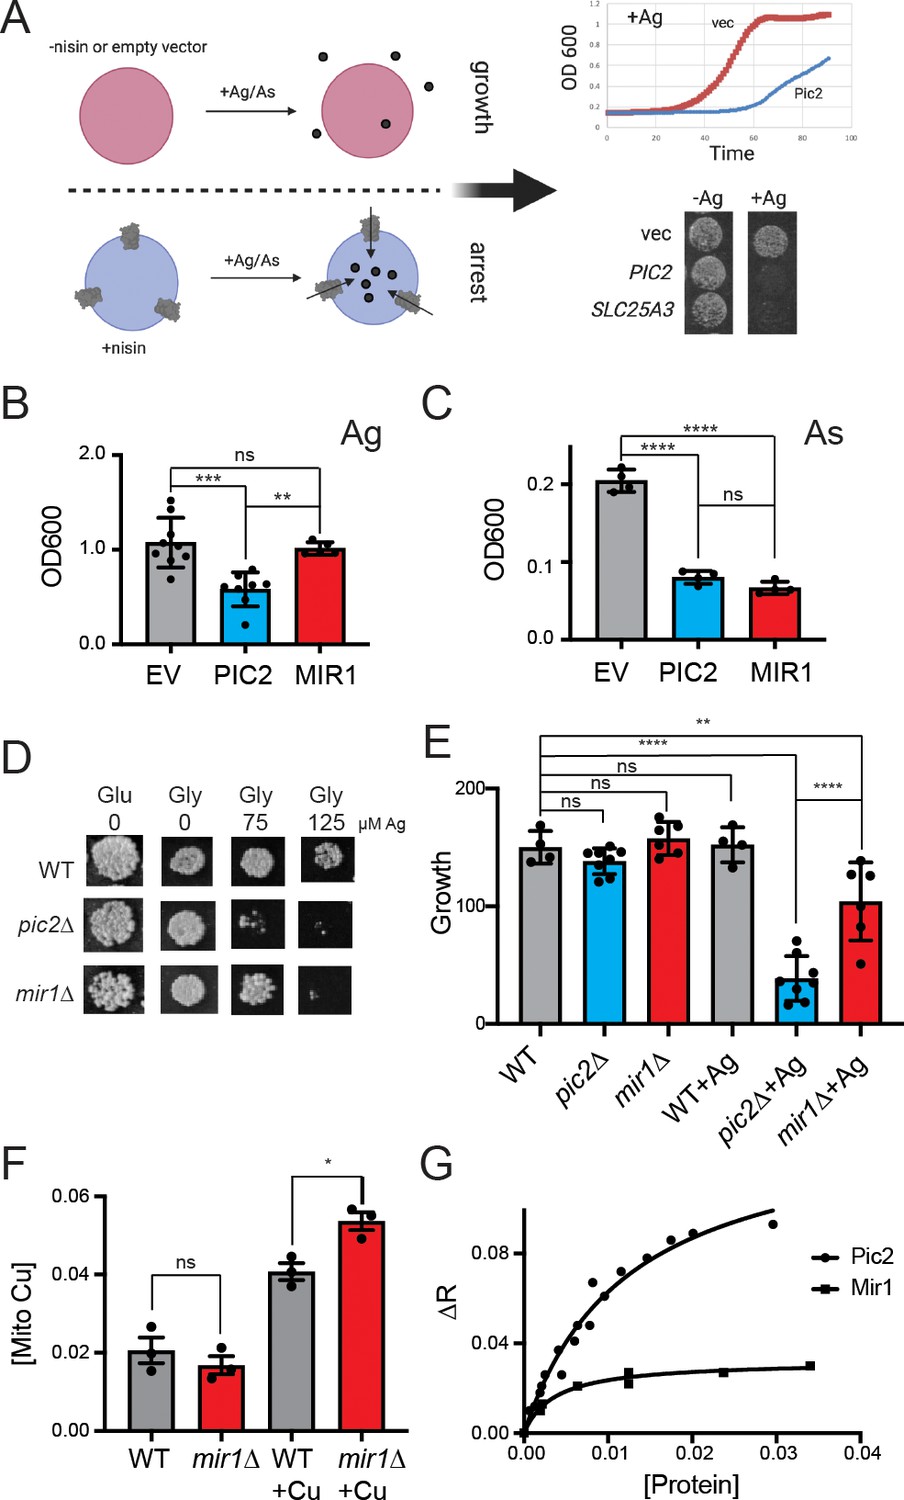
S.cerevisiae MIR1 does not transport Cu.
(A) Schematic representation of the L. lactis expression system used to quantify transport characteristics. Survival is determined by the growth rate in liquid culture or by visual inspection of cells grown on agar plates containing Ag+ or AsO43− in the presence of the inducer nisin. (B) Quantification of the growth of L. lactis expressing empty vector (EV), S. cerevisiae PIC2, or S. cerevisiae MIR1 after 12 hr in 80 µM Ag+-containing media (n > 5). (C) Quantification of the growth of L. lactis expressing EV, PIC2, or MIR1 after 12 hr in 1.6 mM AsO43−-containing media (n = 5). (D) Wild-type (WT), pic2∆, or mir1∆ yeast grown in rich medium with a fermentable (Glu: glucose) or a non-fermentable (glycerol: Gly) carbon source in the absence (0) or presence of Ag+ (75 or 125 µM). All strains were spotted on media as a 10−3 dilution of OD600 of 1. (E) Densitometry measurements of serial dilutions (10, 102, 103, 104) of cells in D on Glu, Gly, and Gly plus 75 µM Ag (WT n = 4, pic2∆ n = 8, mir1∆ n = 6). (F) Cu content of purified intact mitochondria from mir1Δ cells assayed by Inductively coupled plasma - optical emission spectrometry (ICP-OES) and compared with that of parental WT cells. Both strains were grown in YP medium with glucose as a carbon source containing 10 μM bathocuproinedisulfonic acid (BCS) or 100 μM Cu (+Cu) (n = 3). (G) Fluorescence anisotropy (FA) of CuL (Ex320, Em400) upon the addition of reconstituted PIC2 or MIR1 in proteoliposomes prepared from extracted egg yolk lipids. Control FA of equal quantity of lipids without protein added was subtracted from each data point. Protein concentrations were determined by Bradford assay, and curves are fit with a nonlinear regression that assumes a single binding site. In all panels, data are plotted as the mean ± standard deviation and a one-way ANOVA was used for statistical analysis; ns: not statistically significant; *p<0.05, **p<0.01, ***p<0.001, ****p<0.0001.
Figure 2 with 3 supplements
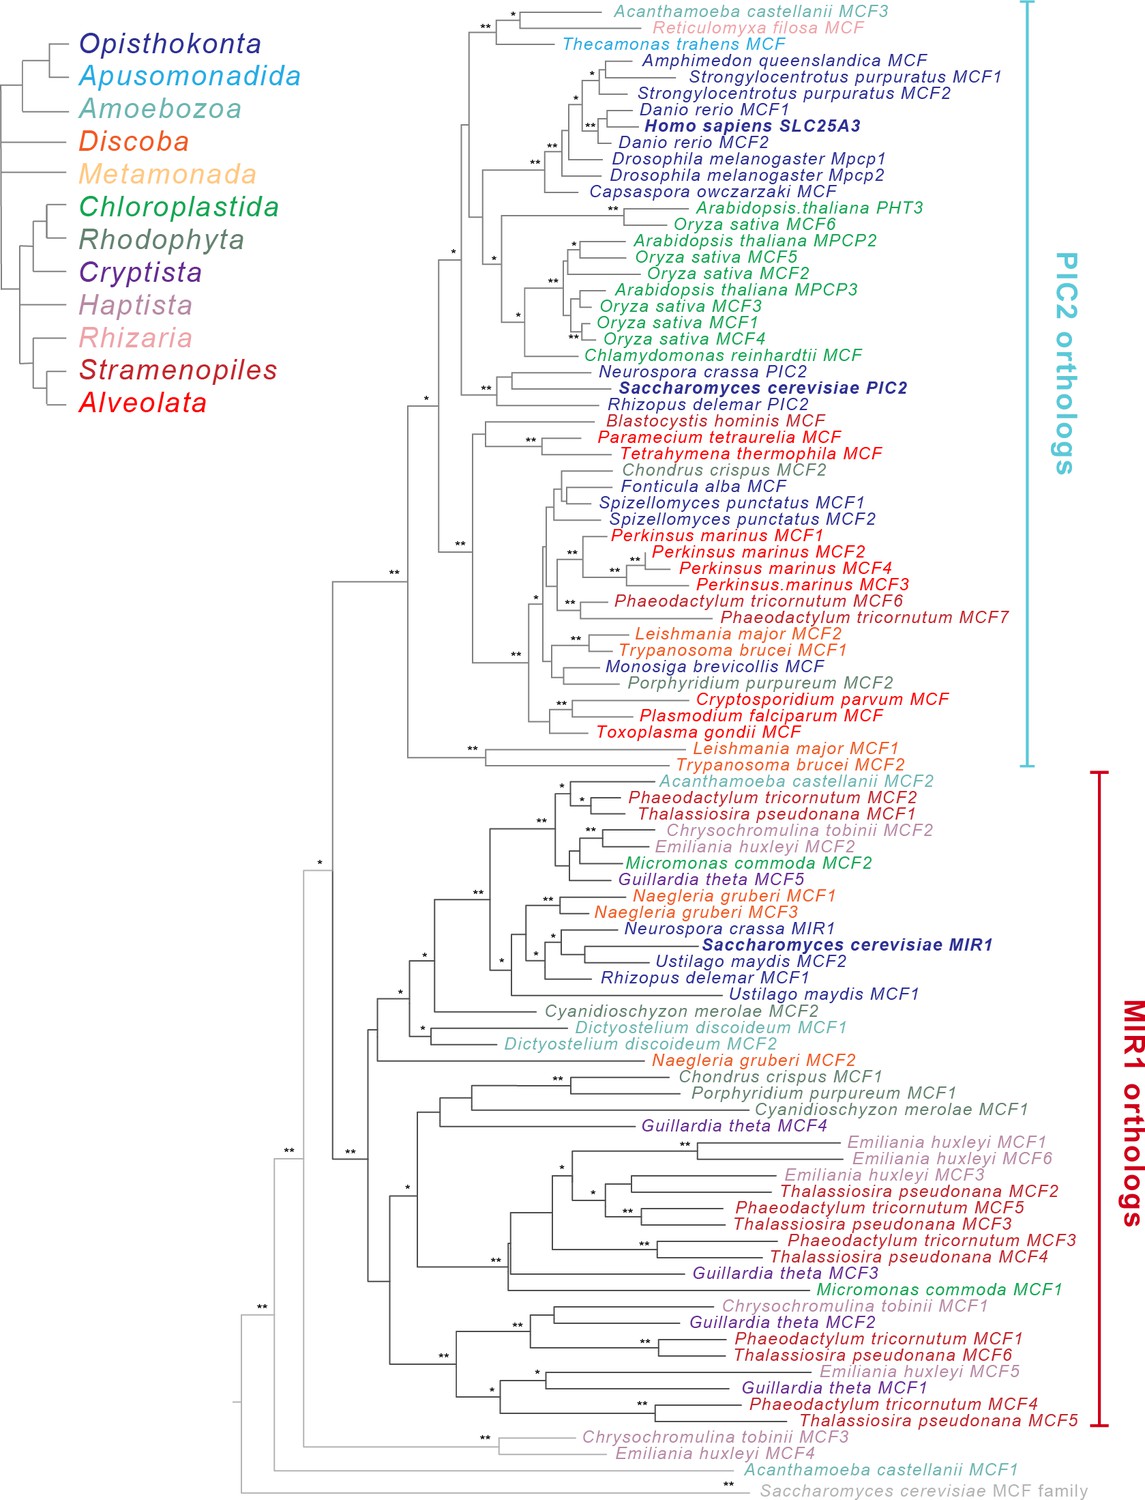
Phylogenetic analysis of the PIC2/MIR1 orthologs from 47 taxa reveals two major clades.
Amino acid sequences of the eukaryotic MIR1/PIC2/SLC25A3 orthologs were aligned with the complete set of mitochondrial carrier family (MCF) proteins from S. cerevisiae. The maximum-likelihood tree shown was constructed in iQ-TREE using a general codon exchange matrix for nuclear genes with amino acid frequencies determined empirically from the data and seven rate categories (LG+F+R7). Support for the nodes was calculated using 1000 replications and is indicated as follows: **>95%; *>75%. Taxa names for the MIR1/PIC2/SLC25A3 sequences are color-coded according to the eukaryotic Tree of Life supergroups as indicated; the S. cerevisiae MCF outgroup sequences (gray) have been collapsed to a single branch. Accession numbers for each of the sequences are available in Supplementary file 1 and Figure 2—figure supplement 2.
Figure 2—figure supplement 1
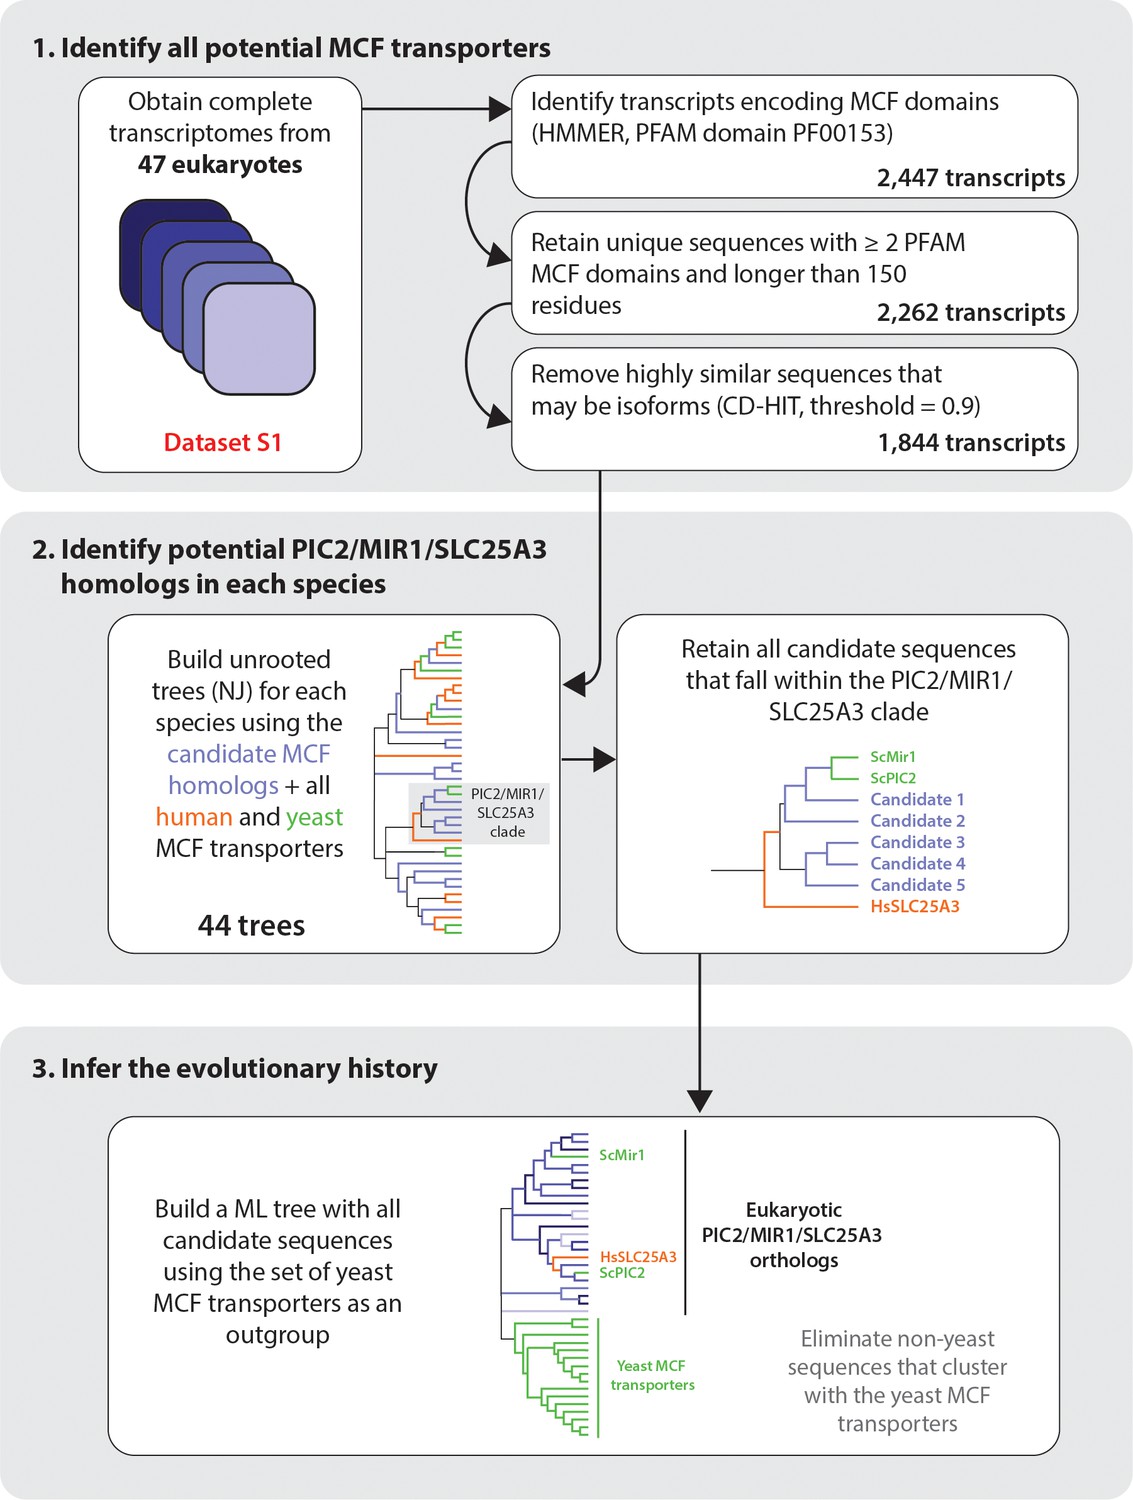
Pipeline for bioinformatic analysis.
We confirmed that PIC2/MIR1 sequences eliminated by threshold of 90% similarity were duplicate sequences from the same locus where possible. The majority of eliminated sequences at this threshold were isoforms from genomes with deep transcriptomic datasets. To account for very recent duplications, we included them in the analysis only if they could be unambiguously assigned to a different chromosomal location to allow for more even comparison across diverse datasets that differed in depth of coverage (Supplementary file 1).
Figure 2—figure supplement 2
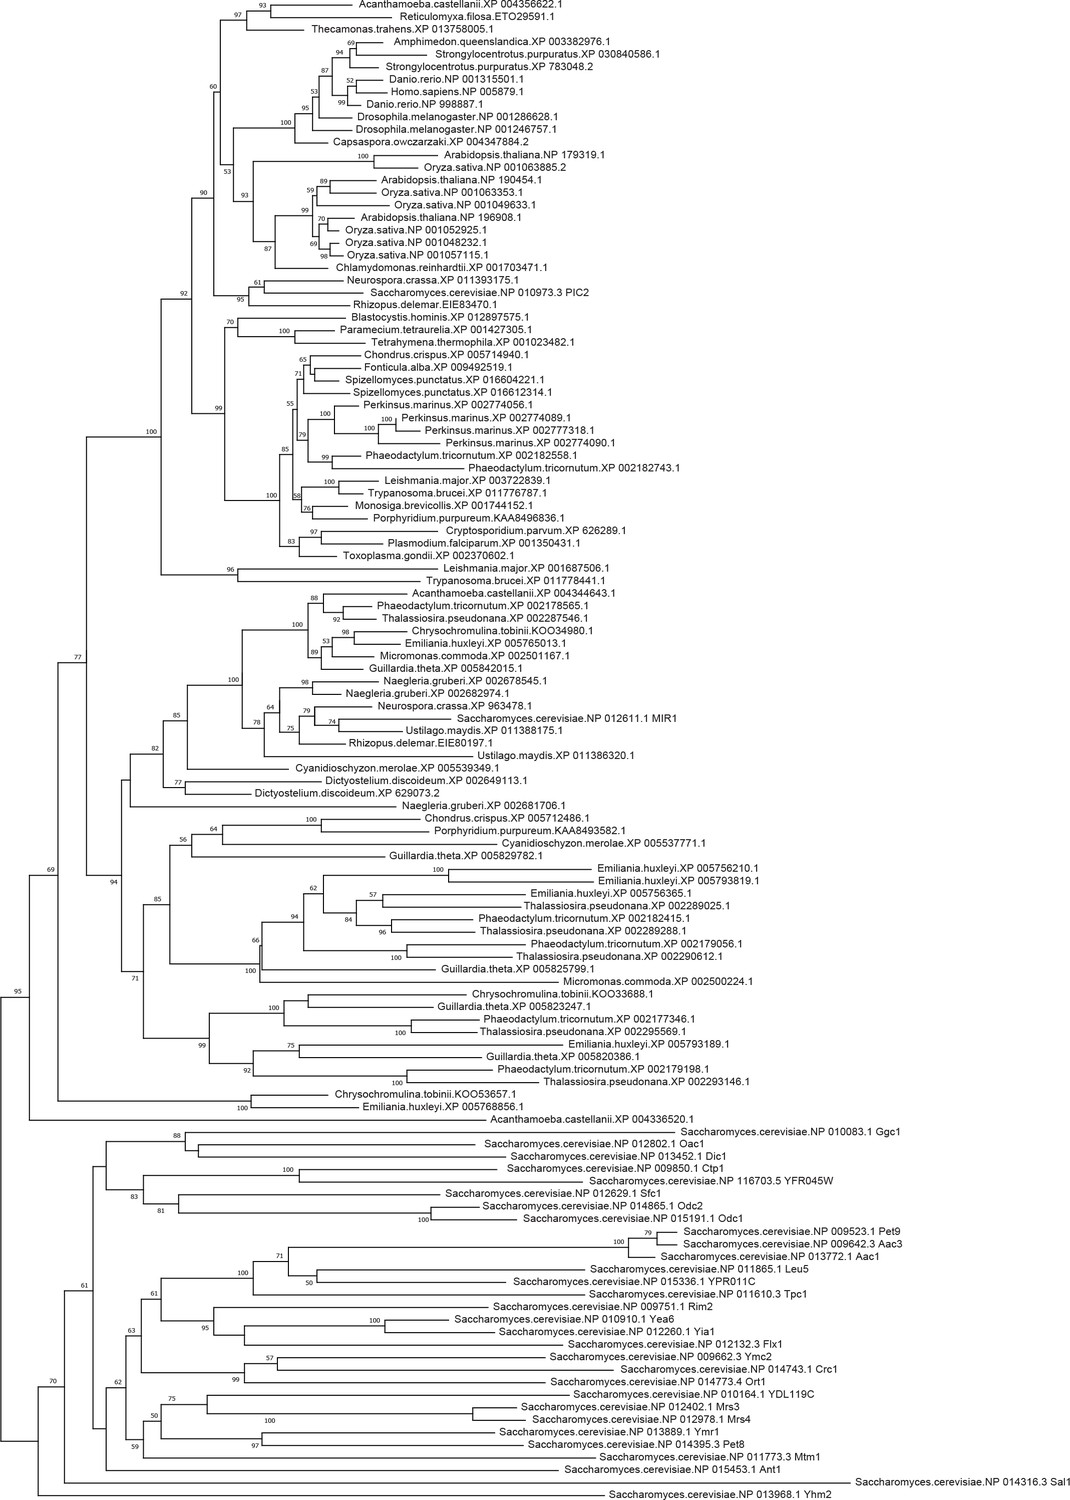
Phylogenetic analysis of the PIC2/MIR1 orthologs.
Amino acid sequences of the eukaryotic MIR1/PIC2/SLC25A3 orthologs were aligned with the complete set of mitochondrial carrier family proteins from S. cerevisiae. The tree shown includes all bootstrap values and individual accession numbers.
Figure 2—figure supplement 3
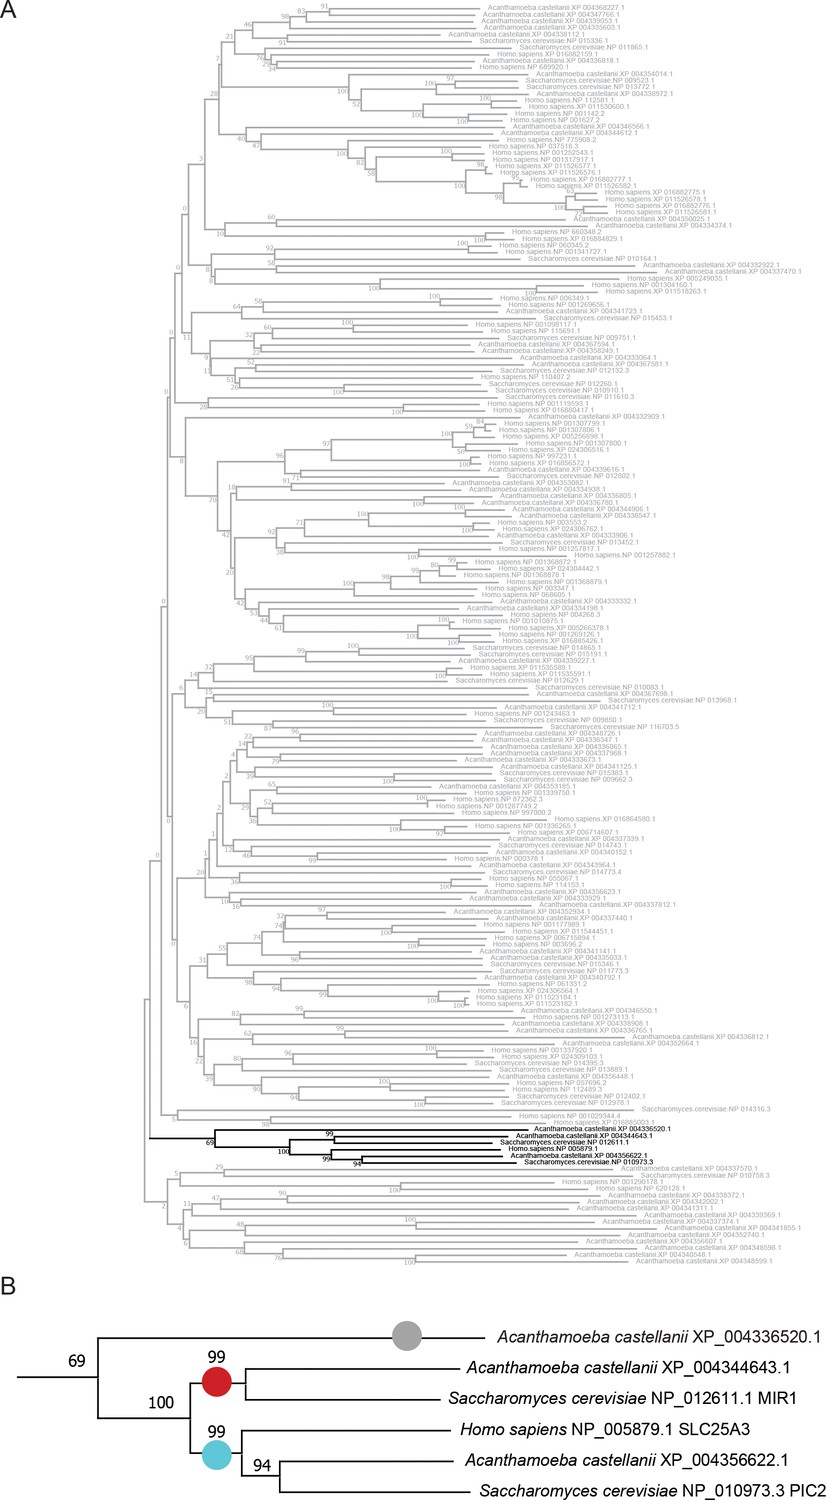
Neighbor joining tree of mitochondrial carrier families (MCFs) from Acanthamoeba castellanii.
(A) The complete neighbor joining tree of proteins designated to contain at least two MCF domains (PFAM PF00153) and 150 amino acids and complete set of human and yeast MCFs. (B) Enlargement of the PIC2/MIR1/SLC25A3 clade showing the initial classification of XP_004356622.1 as PIC2-like, XP_004344643.1 as MIR1-like, and XP_004336520.1 as supported potential PIC2/MIR1 ‘other’. These sequences were advanced to the analysis of the maximum likelihood tree shown in Figure 2.
Figure 3
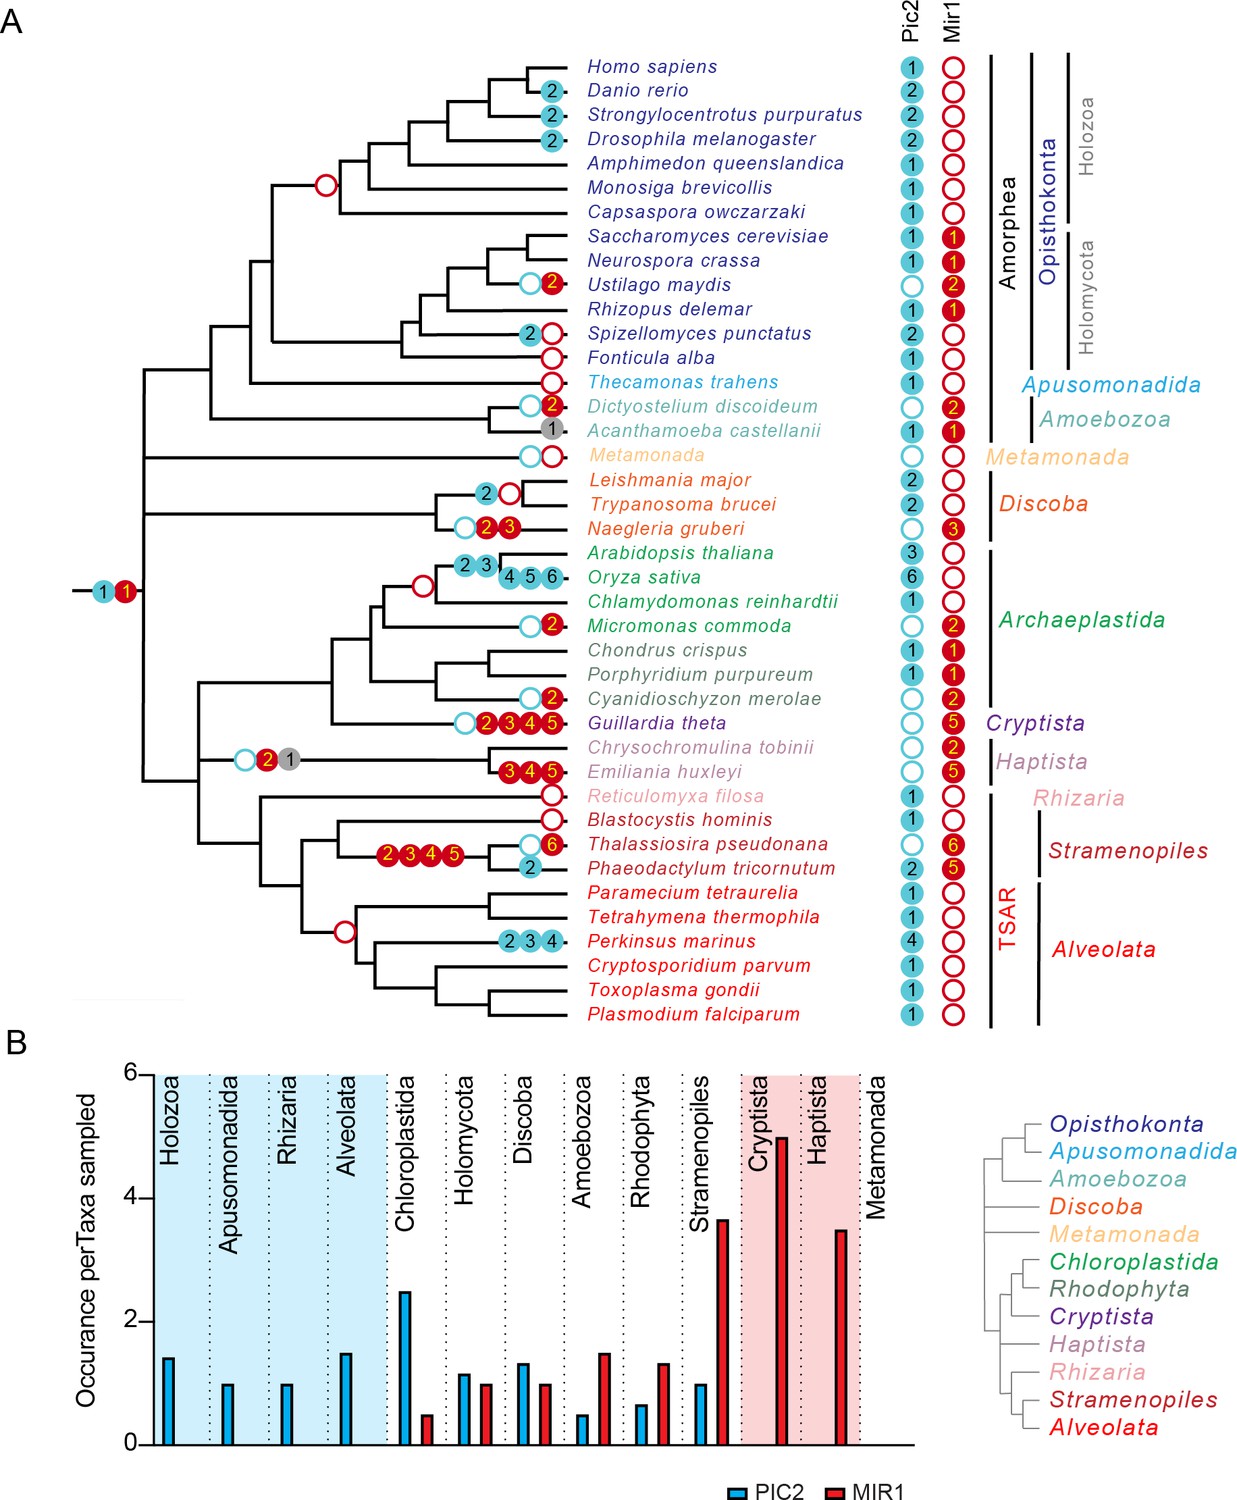
The PIC2/MIR1 family of mitochondrial carrier family transporters is ancient within eukaryotes.
(A) Using the presence or absence of orthologs within the eukaryotic lineages, we inferred the evolutionary timings of gene duplications (solid circles) and losses (hollow circles) of the PIC2-like (blue), MIR1-like (red), and other (gray) sequences. (B) The average number of PIC2 and MIR1 orthologs identified in the sampled taxa from eight of the nine eukaryotic supergroups.
Figure 4 with 2 supplements
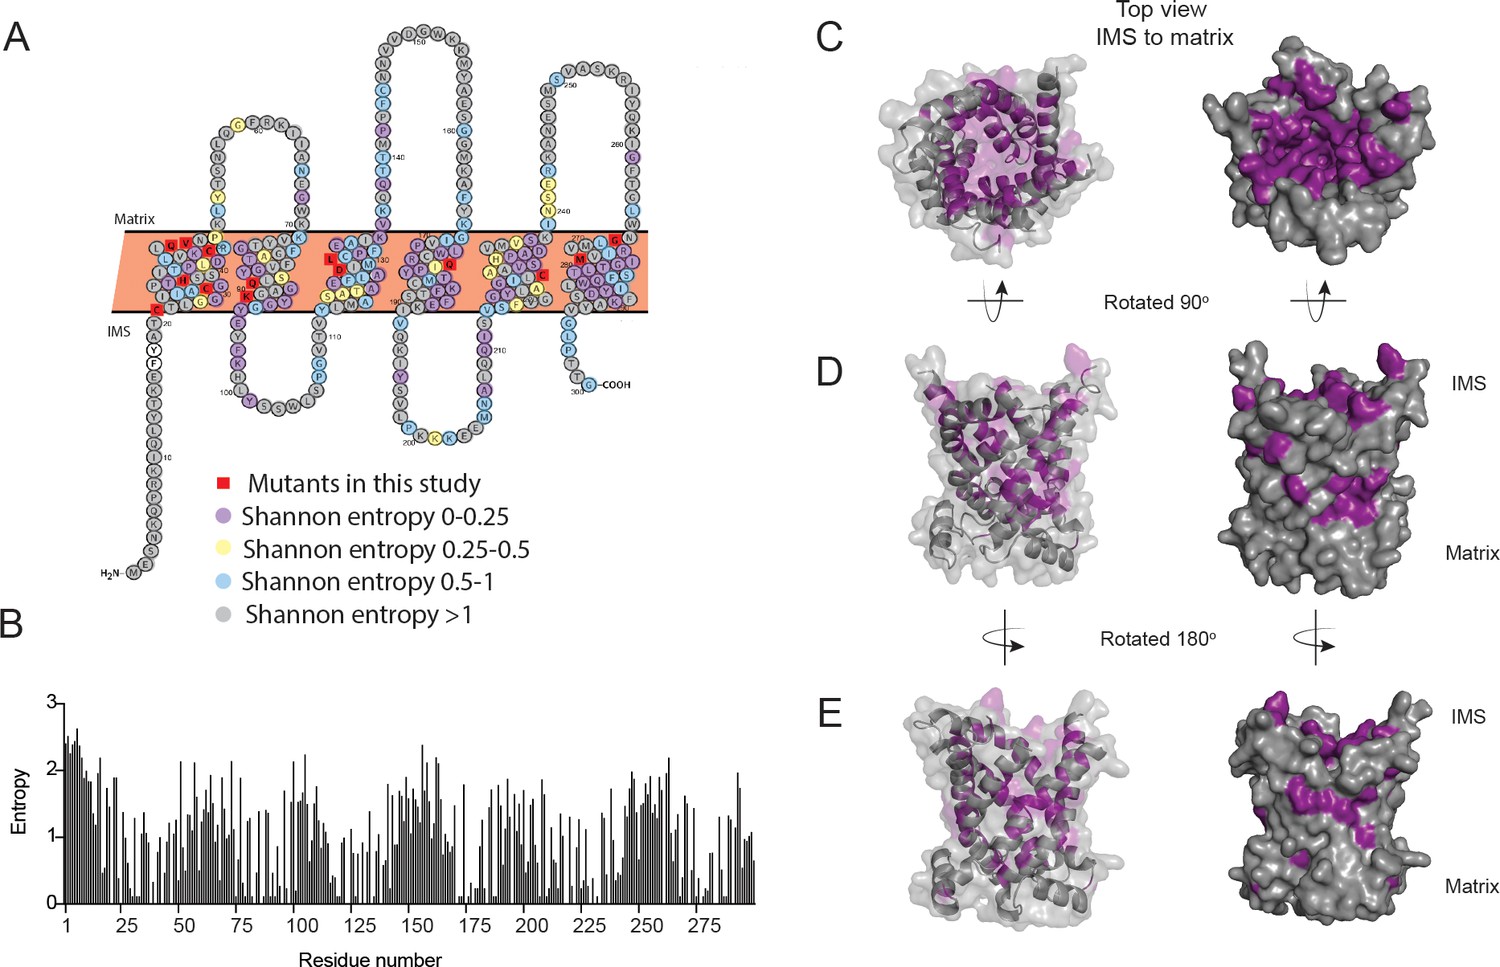
Conservation of residues in PIC2.
(A) A Protter representation of the PIC2 amino acid sequence was generated and colored based on Shannon entropy scores for conservation of a given residue. (B) The Shannon entropy for each residue in PIC2 based on all sequences in the PIC2-specific clade (see Supplementary file 1). (C) Structure of PIC2 in the c-state viewed from the intermembrane space side, with conserved residues (Shannon entropy <0.5) highlighted in purple and all other residues shown in gray. (D) A 90° rotation of the structure to view it from side, and (E) a 180° rotation to view it from the opposite side.
Figure 4—figure supplement 1
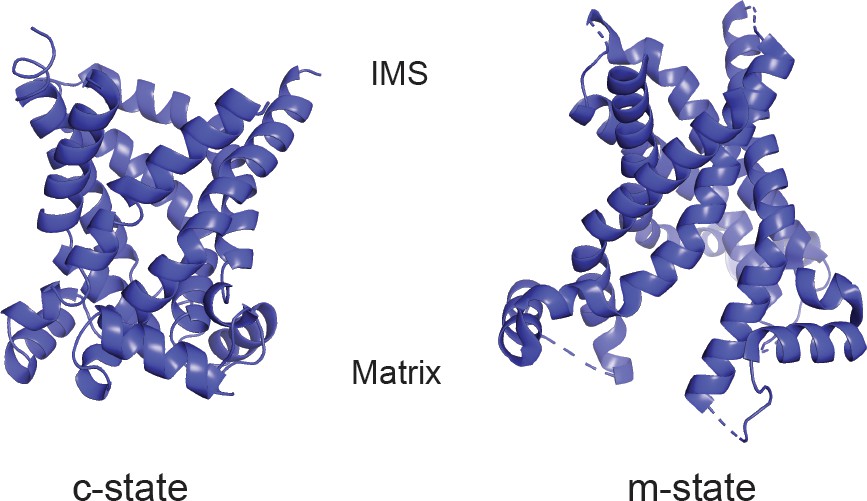
Structural models of PIC2.
Cartoon ribbon structure of PIC2 modeled onto ADP-ATP carrier in the c-state and m-state.
Figure 4—figure supplement 2
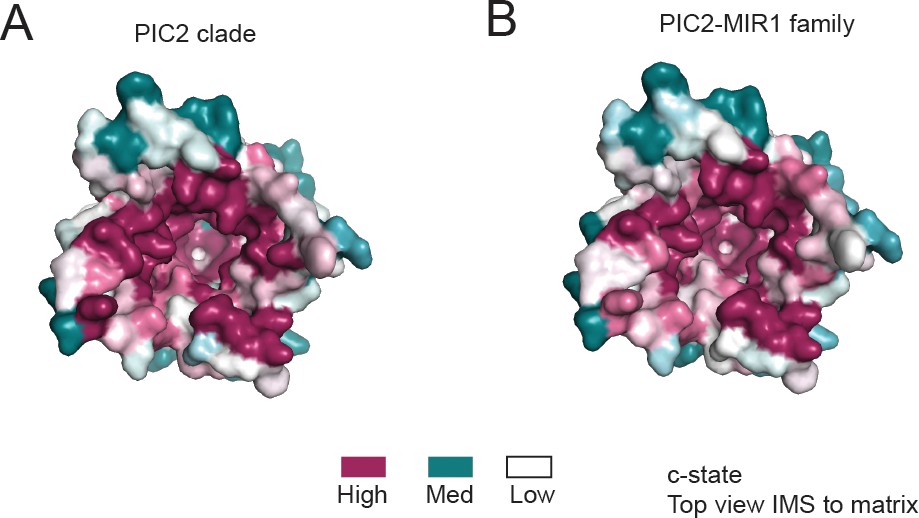
Conservation surface of PIC2 viewed from the intermembrane space.
(A) The c-state model of PIC2 with surface representation colored based on the conservation of residues using the sequences designated as PIC2-like based on the PIC2 clade as defined in Figure 3. (B) The c-state model of PIC2 with surface coloring representing the level of conservation when using the complete PIC2-MIR1 family as defined in Figure 3.
Figure 5 with 2 supplements
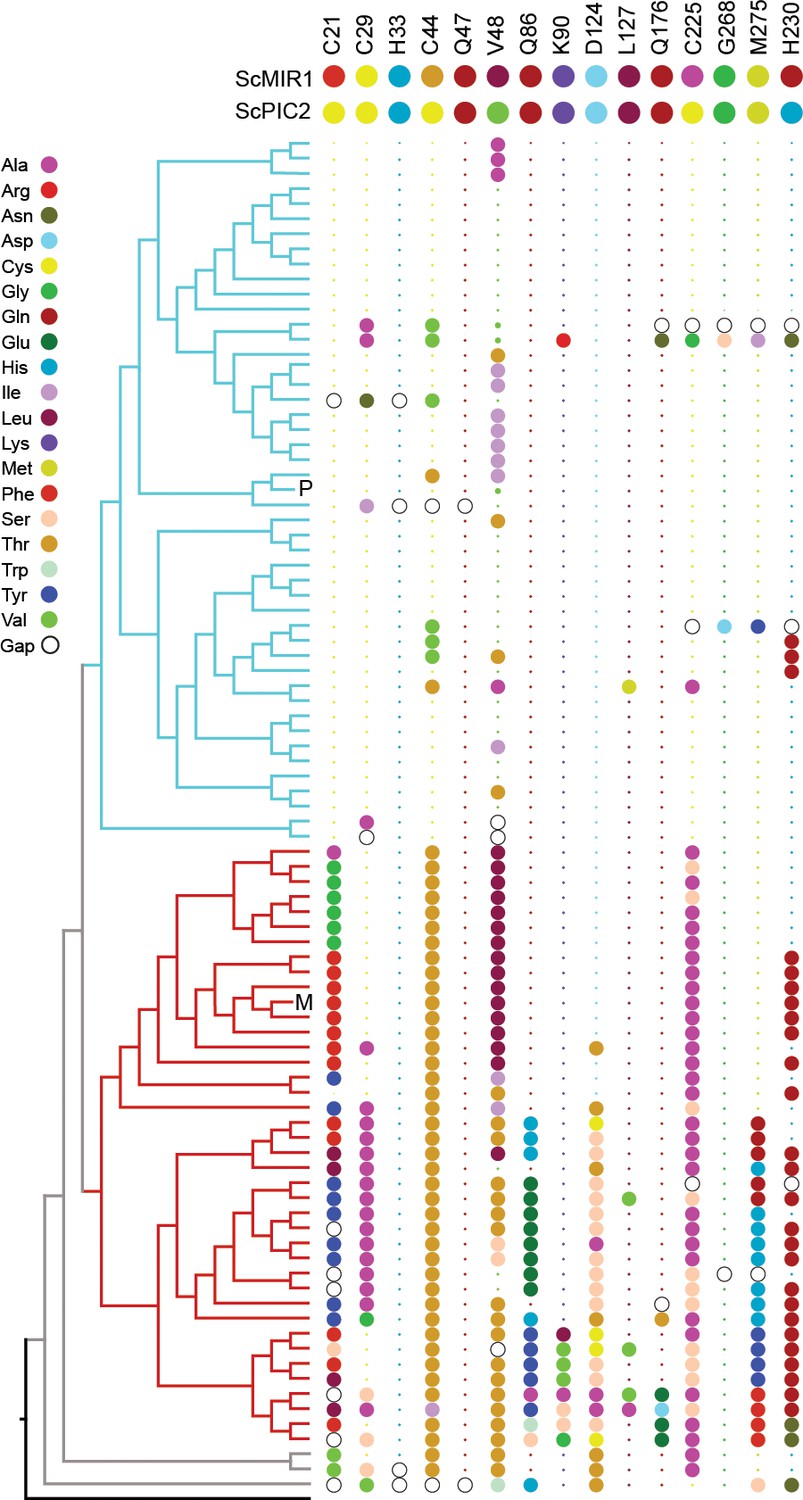
Conservation of selected residues in the PIC2/MIR1 family of transporters.
The tree topology is identical to that shown in Figure 2. Amino acids are colored according to the key, and insertion/deletion events that lead to gaps within the alignment are indicated by the hollow circles. P indicates position of S. cerevisiae PIC2, and M indicates S. cerevisiae MIR1. Small dots indicate that the residue is identical to that of PIC2 (shown at the top), and large dots indicate differences.
Figure 5—figure supplement 1
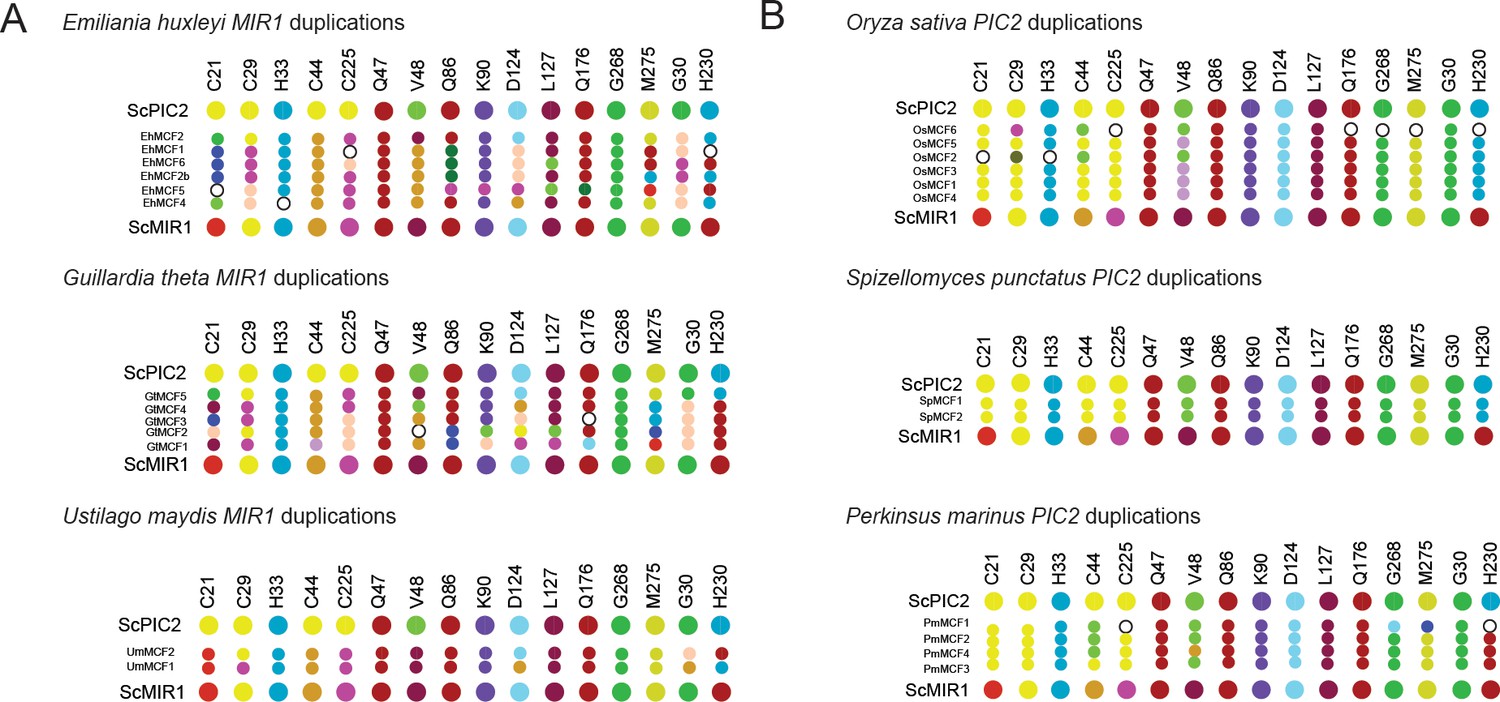
Map of the residues found in gene duplications.
(A) Graphical representation of the residues in organisms that have duplicated MIR1 and lack PIC2. (B) Graphical representation of the residues in organisms that have duplicated PIC2 and lack MIR1. Larger dots are residues in S. cerevisiae PIC2 or MIR1 while smaller dots are the residues encoded by the gene duplicates.
Figure 5—figure supplement 2
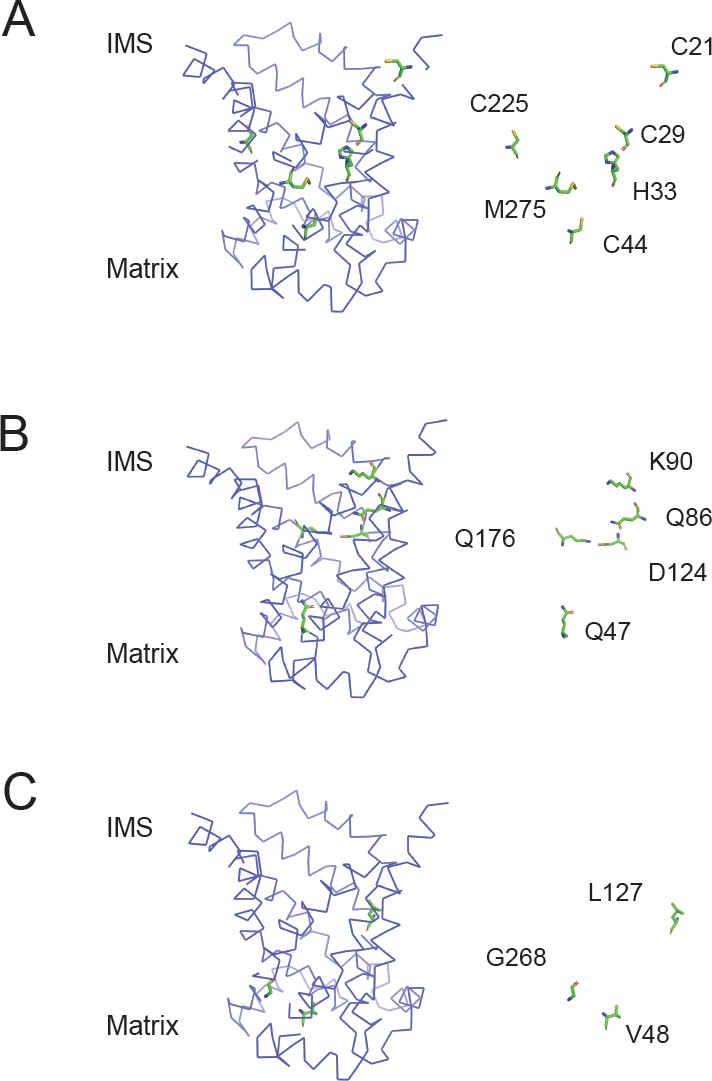
Position of residues mutated in the aqueous binding pocket of PIC2.
(A) Model of the c-state of PIC2 with C21, C29, C44, C225, H33, and M275 highlighted in sticks format and with the backbone cartoon representation removed. (B) Model of the c-state of PIC2 with Q47, Q86, K90, D124, and Q176 highlighted in sticks format and with the backbone cartoon representation removed. (C) Model of the c-state of PIC2 with V48, L127, and G268 residues highlighted in sticks format and with the backbone cartoon representation removed.
Figure 6 with 3 supplements
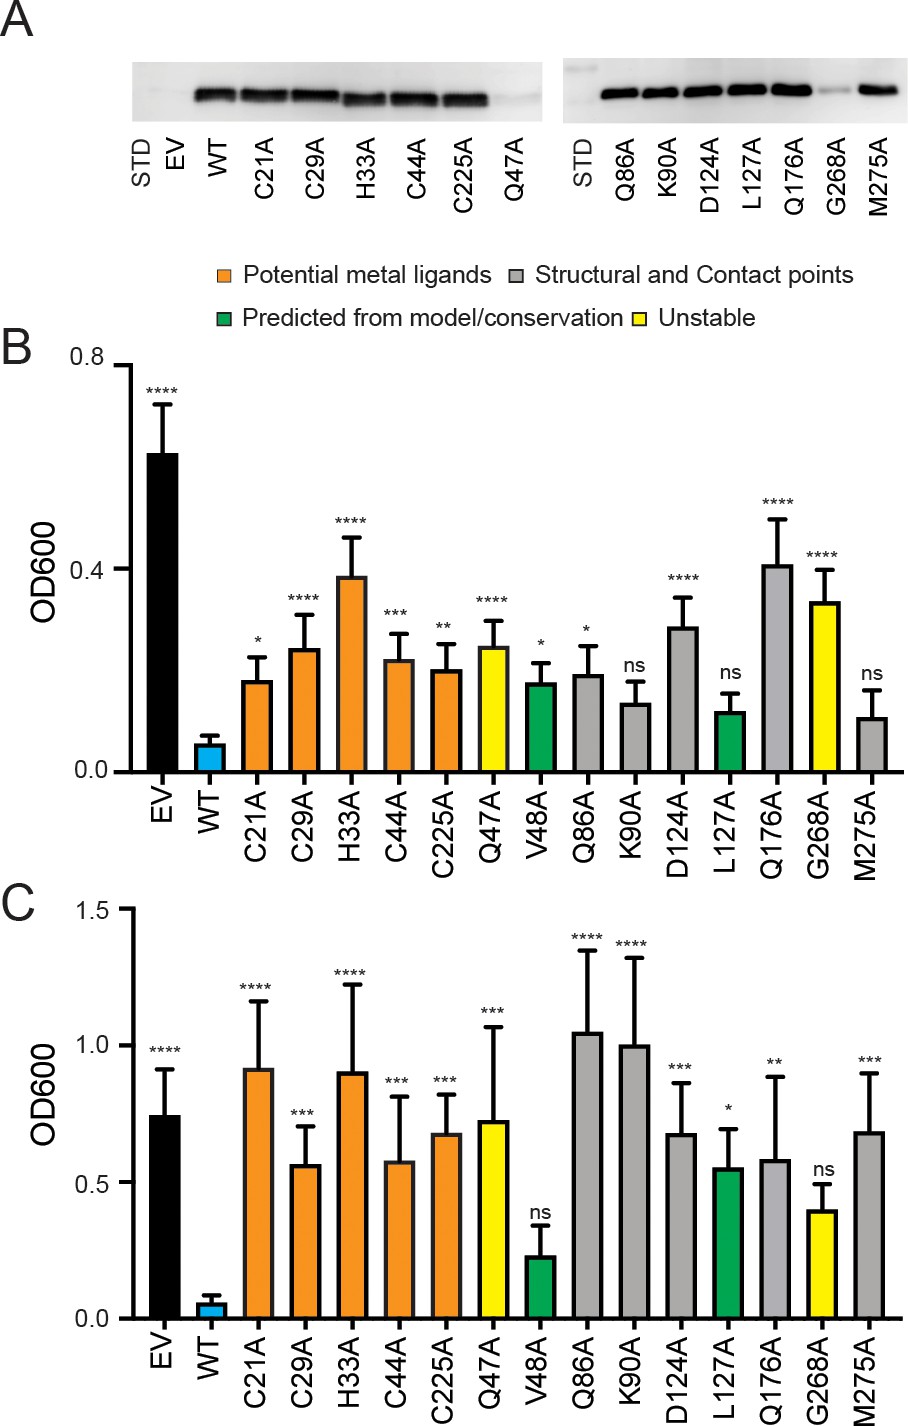
Expression of PIC2 and variants in L. lactis.
(A) Immunoblot of L. lactis extracts expressing empty vector (EV), wild-type PIC2 (WT), or a given PIC2 variant in which each of the listed residues was converted to an alanine prepared from equal numbers of cells based on optical density after induction with nisin. (B) Growth of L. lactis expressing EV, wild-type PIC2 (WT), or a given PIC2 variant in Ag+-containing media. Each bar represents the median of 10–18 independent cultures with 95% confidence interval as error bars (*p<0.05, **p<0.01, ***p<0.001, ****p<0.0001 based on one-way ANOVA relative to PIC2 wild-type control). The color of the bar indicates one of four major groupings: Cu-binding (orange), structural motifs or contact points (gray), evolutionarily conserved and present in the aqueous binding pocket of the transporter (green), and unstable in L. lactis (yellow). (C) As described in (B) except L. lactis strains were grown in AsO43−-containing media.
Figure 6—figure supplement 1
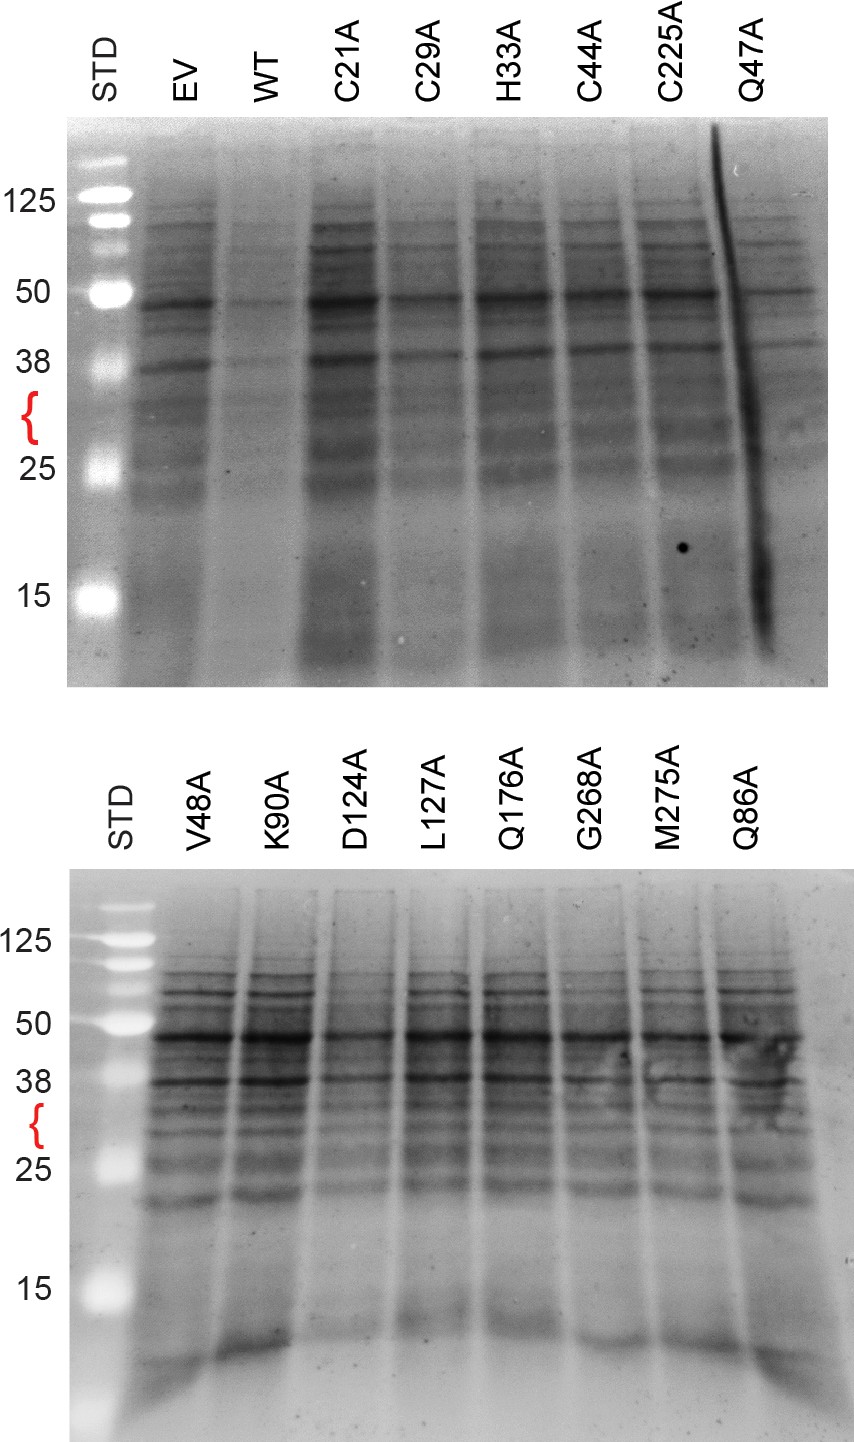
Protein expression in L. lactis.
Extracts of L. lactis expressing empty vector (EV), wild-type PIC2 (WT), or a given PIC2 alanine point mutation were prepared from equal numbers of cells based on optical density after induction with nisin. The total protein extracts were run on 10–15% tris-tricine SDS-PAGE gels and transferred to nitrocellulose membranes for staining with Sypro-Ruby and visualized under UV irradiation. The red bracket shows the expected size for PIC2. No obvious band is detected in any lane compared to EV, suggesting that the expression is only detectable by immunoblot analysis. Note that these membranes are independent gels not shown in Figure 6 or Figure 6—figure supplement 2. The size of each standard in kDa is shown (the unmarked standards are 260, 90, and 70 kDa).
Figure 6—figure supplement 2
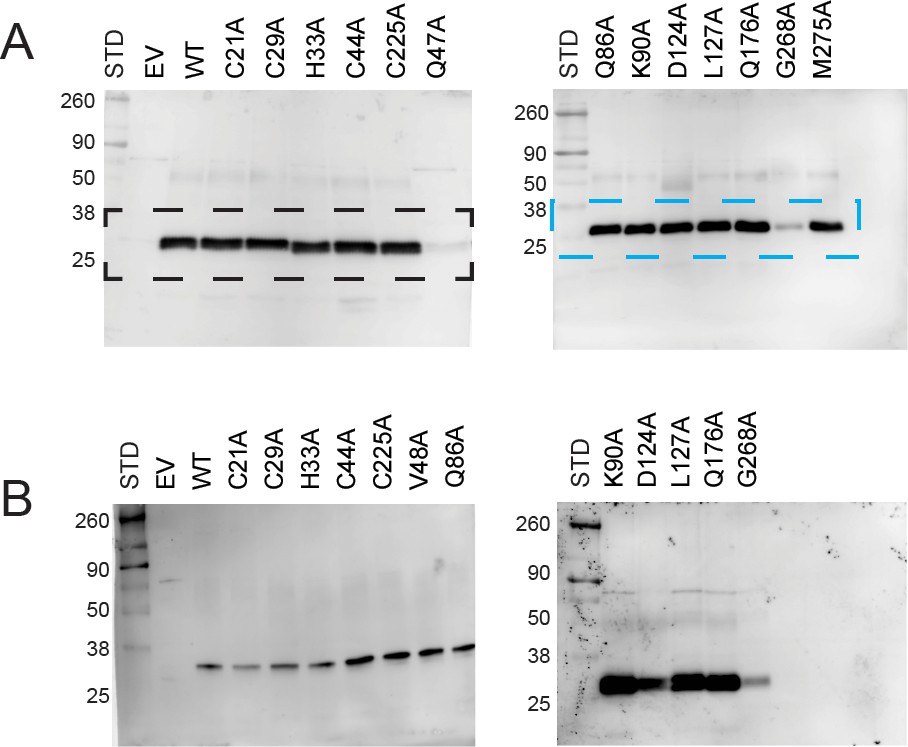
Immunoblot analysis of PIC2 expressed in L. lactis.
(A) Extracts of L. lactis expressing empty vector (EV), wild-type PIC2 (WT), or a given PIC2 alanine point mutant were prepared from equal numbers of cells based on optical density after induction with nisin. The total protein extracts were run on SDS-PAGE gels and transferred to nitrocellulose membranes probed with a polyclonal PIC2 antibody. Black and blue dashed boxes represent region cropped to become part of Figure 6A. (B) Independent gels of L. lactis extracts expressing EV, wild-type PIC2 (WT), or variant forms of PIC2. The size of each standard in kDa is shown (the unmarked standards are 125, 70, and 15 kDa).
Figure 6—figure supplement 3

Substitution of PIC2 residues for MIR1 residues.
(A) Alignment of amino acid sequences from MIR1, PIC2, and SLC25A3. (B) Model of the c-state of PIC2 with residues mutated highlighted in sticks format and with the backbone cartoon representation removed. (C) Growth of L. lactis expressing empty vector (EV), wild-type PIC2 (WT), or a given PIC2 variant in which each of the listed residues was converted to an alanine in Ag+-containing media. Each bar represents the median of six independent cultures with 95% confidence interval as error bars (*p<0.05, **p<0.01, ***p<0.001, ****p<0.0001 based on one-way ANOVA relative to PIC2 wild-type control).
Figure 7
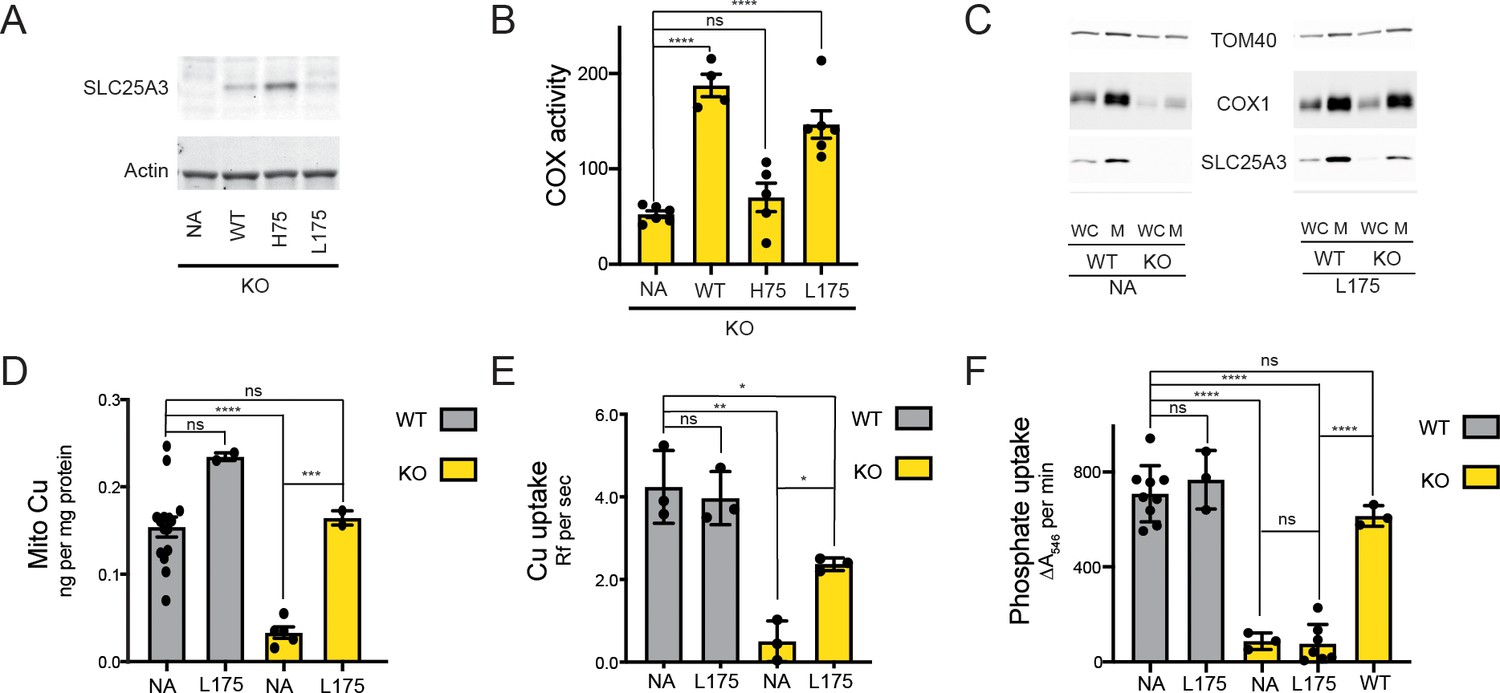
The SLC25A3 L175A variant restores mitochondrial Cu levels and rescues the cytochrome c oxidase (COX) deficiency in KO MEFs.
(A) Immunoblot analysis of SLC25A3 abundance in Slc25a3 KO MEFs alone or those transduced with wild-type SLC25A3 (WT), a H75A variant (H75), or a L175A variant (L175). Actin served as an internal loading control. (B) COX activity in KO MEFs alone (n = 6) or transduced with WT SLC25A3 (n = 4), a H75A variant (H75) (n = 5), or a L175A variant (L175) (n = 6). ns, p>0.05, ****, p<0.0001 based on a one-way ANOVA. (C) Immunoblot analysis of SLC25A3, TOM40, and COX1 abundance in whole cells (WC) or isolated mitochondrial (M) from WT or KO MEFs alone (NA) or transduced with the SLC25A3 L175A variant (L175). (D) Total Cu levels in mitochondria from WT or KO cells as in (C), determined by ICP-OES. (E) Cu uptake in mitochondrially derived liposomes created by the membranes of mitochondria in (C) with additional lipids. Liposomes contain Phen Green to monitor the uptake of Cu. (F) Mitochondrial swelling rate in the presence of phosphate as a measure of phosphate uptake.
Figure 8 with 1 supplement
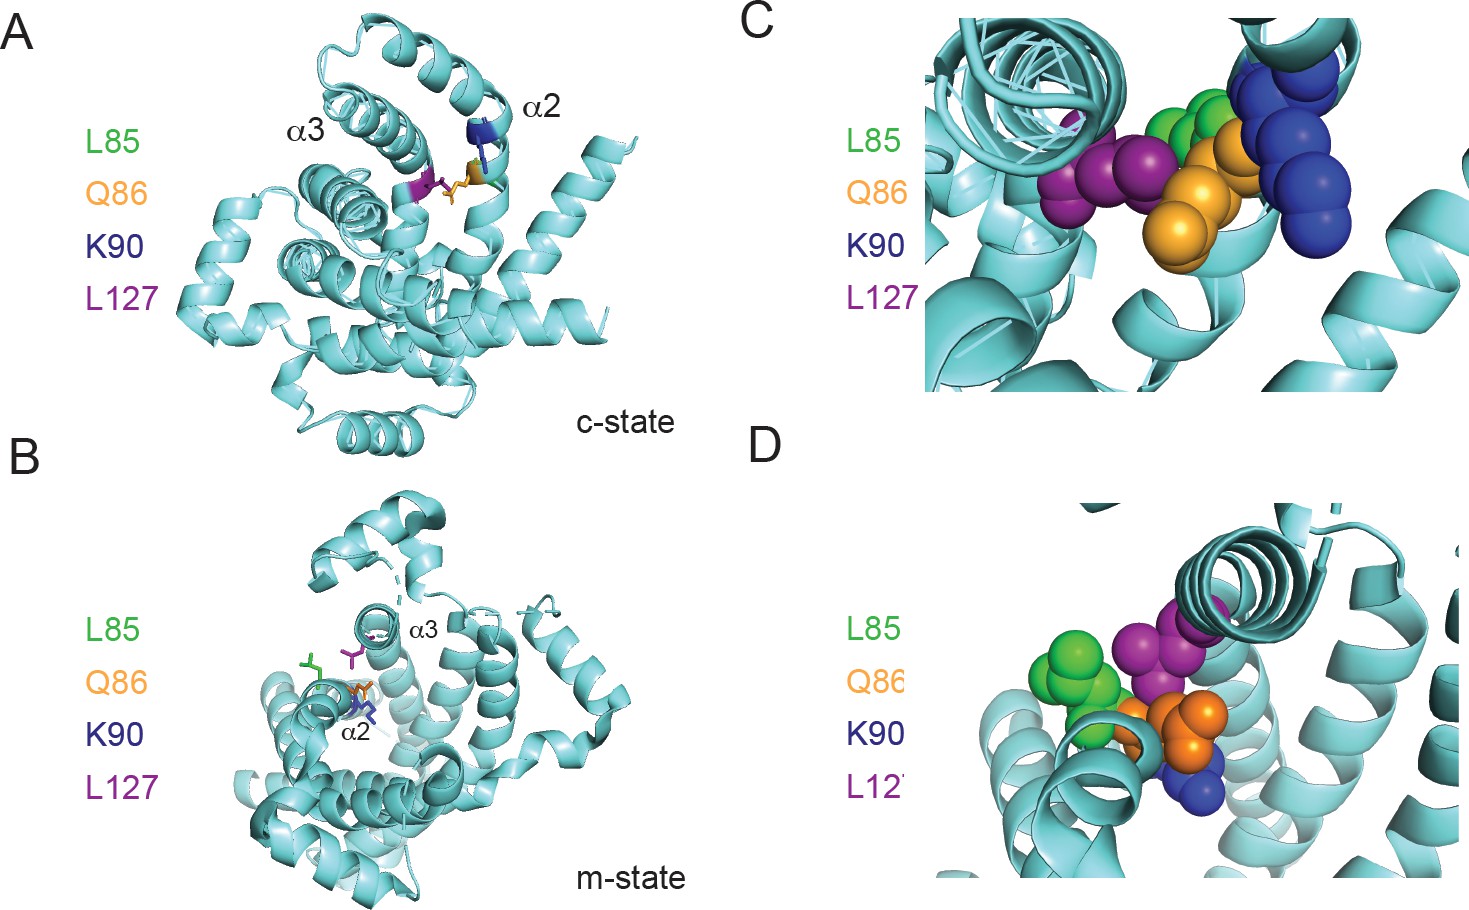
Positioning of Leu127 relative to adjacent residues on helix 2.
Ribbon diagrams of PIC2 (A) c-state and (B) m-state structures. The polypeptide is shown as a ribbon trace (aquamarine) and the side chains as stick models. The Leu127 is colored purple to distinguish it from the adjacent Leu85 (green), Gln86 (orange), and Lys90 (blue) residues on helix 2 (α2). Enlargement of the Leu127 interaction with the surrounding residues shown as spheres in (C) c-state and (D) m-state.
Figure 8—figure supplement 1
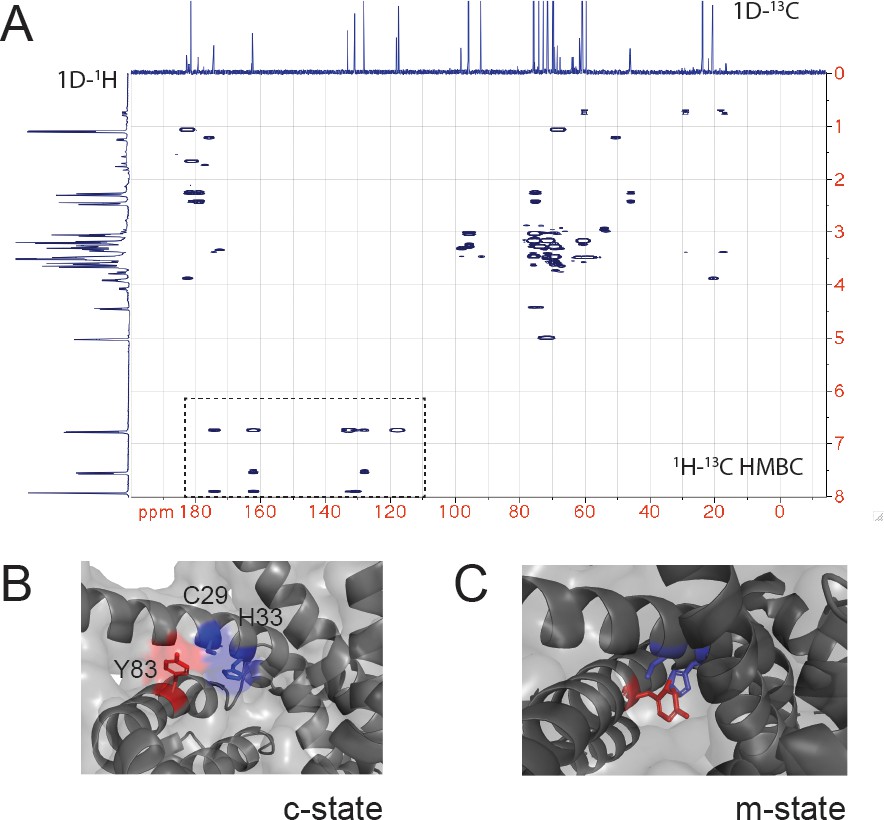
NMR of the CuL and role of Y83 in interactions with the proposed C29-H33 binding site.
(A) 1H-13C heteronuclear multiple bond correlation (HMBC) spectrum of the purified CuL complex. The 1D 1H and 13C spectrum are shown. The box highlights the signals consistent with a benzene ring (carbon shifts 110–175 ppm and proton shifts 6.75–7.9 ppm) in the CuL. (B) Enlargement of the C29-H33 region of c-state with C29, H33, and Y83 shown in sticks. (C) Enlargement of the C29-H33 region of m-state with C29, H33, and Y83 shown in sticks with Y83 between the C29-H33 ‘replacing/occluding’ a potential site for CuL binding.
Tables
Key resources table
| Reagent type (species) or resource | Designation | Source or reference | Identifiers | Additional information |
|---|---|---|---|---|
| Gene (Saccharomyces cerevisiae) | PIC2 | Saccharomyces Genome Database | SGD:S000000855 | |
| Gene (Saccharomyces cerevisiae) | MIR1 | Saccharomyces Genome Database | SGD:S000003838 | |
| Gene (Mus musculus) | SLC25A3 | doi:10.1074/jbc.RA117.000265 | Ensembl: ENSMUSG00000061904 | |
| Strain, strain background (Saccharomyces cerevisiae) | BY4741 | Thermo Scientific | ||
| Strain, strain background (Lactococcus lactis) | NZ9000 pepN::nisRK | doi:10.1007/s00253-005-0107-6 | ||
| Strain, strain background (Escherichia coli) | BL21(DE3) | New England Biolabs | Cat# C2527H | |
| Transfected construct (Mus musculus) | SLC25A3 | doi:10.1074/jbc.RA117.000265 | ||
| Cell line (Mus musculus) | MEF | doi:10.1074/jbc.RA117.000265 | ||
| Antibody | SLC25A3 (rabbit polyclonal) | This paper | See 'Materials and methods' for details WB(1:2000) | |
| Antibody | PIC2 (rabbit polyclonal) | doi:10.1074/jbc.M113.470674 | WB(1:1000) | |
| Antibody | COX1 (mouse monoclonal) | Abcam | ab14705 | WB(1:2000) |
| Antibody | TOM40 (rabbit polyclonal) | ProteinTech | 18409-1-AP | WB(1:2000) |
| Recombinant DNA reagent | EV | MoBiTec | Cat# ELV00200-01 | pNZ8148 expression vector containing the nisA promoter |
| Recombinant DNA reagent | WT; C21A; C29A; H33A; C44A; C225A; Q47A; V48A; Q86A; K90A; D124A; L127A; Q176A; G268A | This paper | See Supplementary file 1 | pNZ8148 with wild-type PIC2 sequence or with individual residue mutated |
| Recombinant DNA reagent | pHis.Parallel.1 | doi:10.1006/prep.1998.1003 | Expression vector for E. coli | |
| Chemical compound, drug | Nisin | MoBiTec | Cat# VS-ELK01000-02 | |
| Chemical compound, drug | Silver | SPEX certiPrep | Lot #19-13 AGX | |
| Chemical compound, drug | Arsenate | Alfa Aesar | Lot #U21A031 | |
| Chemical compound, drug | Phen Green SK | Invitrogen | Lot #2034143 | |
| Software, algorithm | BioEdit | Ibis Biosciences, USA | RRID:SCR_007361 | http://www.mbio.ncsu.edu/ BioEdit/bioedit.html |
| Software, algorithm | Coot | doi:10.1107/S0907444904019158 | RRID:SCR_014222 | |
| Software, algorithm | CD-HIT | doi:10.1093/bioinformatics/bts565 | RRID:SCR_007105 | |
| Software, algorithm | ConSurf server | doi:10.1093/nar/gkw408 | RRID:SCR_002320 | |
| Software, algorithm | Fiji (ImageJ) | doi:10.1038/nmeth.2019 | RRID:SCR_002285 | |
| Software, algorithm | HMMER, v3.3 | doi:10.1093/nar/gkr367 | RRID:SCR_005305 | http://hmmer.org |
| Software, algorithm | IQ-TREE, v2.0.3 | doi:10.1093/molbev/msu300 | RRID:SCR_017254 | http://www.iqtree.org/ |
| Software, algorithm | MEGA Software, v10.1.8 | doi:10.1093/molbev/msz312 | RRID:SCR_000667 | https://www.megasoftware.net/ |
| Software, algorithm | PHENIX | doi:10.1107/S2059798319011471 | RRID:SCR_014224 | https://www.phenix-online.org/ |
| Software, algorithm | Prism | Graph Pad, Inc | RRID:SCR_002798 | |
| Software, algorithm | PyMOL | Schrödinger, LLC | RRID:SCR_000305 | http://www.pymol.org/ |
| Software, algorithm | SWISS-MODEL | doi:10.1093/nar/gkg520 | RRID:SCR_018123 | https://swissmodel.expasy.org/ |
| Other | Bovine ADP/ATP carrier | doi:10.1038/nature02056 | PDB:1OKC | Crystal structure of the bovine ADP/ATP carrier |
| Other | Yeast ADP/ATP carrier, c-state | doi:10.1073/pnas.1320692111 | PDB:4C9G | Crystal structure of the yeast ADP/ATP carrier in the cytoplasmic-open state |
| Other | Yeast ADP/ATP carrier, m-state | doi:10.1016/j.cell.2018.11.025 | PDB:6GCI | Crystal structure of the yeast ADP/ATP carrier in the matrix-open state |
Additional files
-
Supplementary file 1
The accession numbers of the genome sequences, accession number of all mitochondrial carrier family-containing transcripts, PIC2/MIR1 sequences, the sequences removed by CD-HIT 0.9 threshold, the comparison of PIC2 and MIR1 entropy scores and conservation of residues, and multiple sequence alignment used for structural modeling of PIC2 and c-state model of PIC2.
- https://cdn.elifesciences.org/articles/64690/elife-64690-supp1-v2.xlsx
-
Transparent reporting form
- https://cdn.elifesciences.org/articles/64690/elife-64690-transrepform-v2.pdf
Download links
A two-part list of links to download the article, or parts of the article, in various formats.
Downloads (link to download the article as PDF)
Open citations (links to open the citations from this article in various online reference manager services)
Cite this article (links to download the citations from this article in formats compatible with various reference manager tools)
Mitochondrial copper and phosphate transporter specificity was defined early in the evolution of eukaryotes
eLife 10:e64690.
https://doi.org/10.7554/eLife.64690


