Early postnatal interactions between beige adipocytes and sympathetic neurites regulate innervation of subcutaneous fat
- Laboratory of Molecular Metabolism, The Rockefeller University, United States
- Laboratory of Metabolic Regulation and Genetics, The Rockefeller University, United States
Figures
Figure 1 with 5 supplements
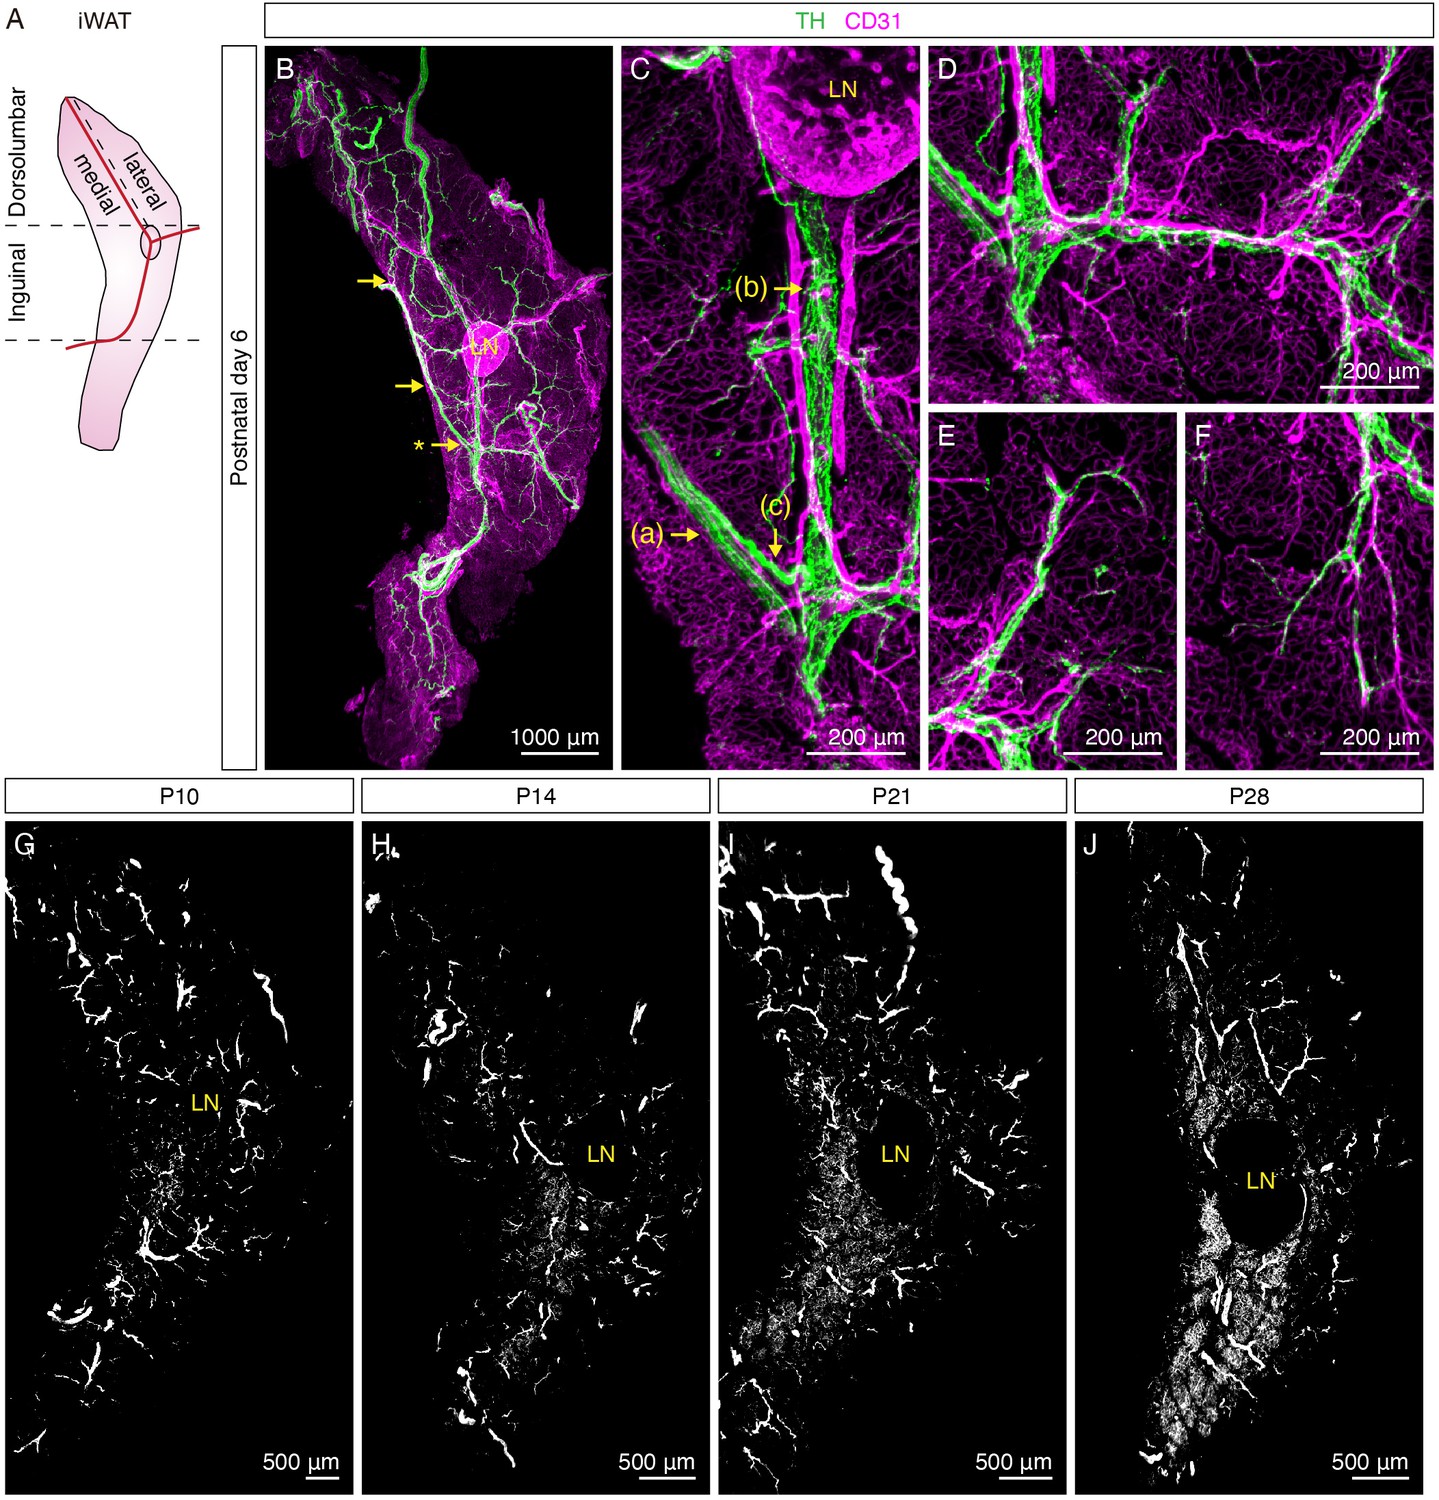
Sympathetic innervation of iWAT is established during early postnatal development.
(A) Schematic view of iWAT. Red lines represent main blood vessels. Using the lymph node and blood vessels as landmarks, iWAT depot is divided into the inguinal and dorsolumbar regions. Dorsolumbar region is further divided into medial and lateral subregions, hereafter referred to as the dorsomedial and dorsolateral regions. Dotted lines indicate boundaries of each region. (B–F) Representative images of iWAT from a P6 C57BL6/J mouse immunolabeled with TH (green) and CD31 (magenta). (B) Maximum intensity projection (MIP) from a 1000 μm z-stack. Arrows indicate convergence points where nerve fibers deviate from nerve bundles to establish blood vessel innervation. (C) High-magnification image of the indicated (*) convergence point in (B). Arrows indicate distinct features of sympathetic innervation in iWAT: (a) nerve fascicle, (b) blood vessel innervation, (c) a nerve fiber departing from a nerve fascicle to join blood vessel innervation. (D) High-magnification image showing sympathetic innervation from main blood vessel extending to arterioles or venules. (E–F) High-magnification images showing discrete nerve endings project into tissue parenchyma. (G–J) Representative whole-tissue images of iWAT from (G) P10, (H) P14, (I) P21, and (J) P28 C57BL6/J mice immunolabeled with TH. MIPs from 50 μm z-stacks are shown. Lymph nodes are indicated as LN. Scale bars are indicated. All imaging studies were performed in at least three independent animals, and representative images are shown.
Figure 1—figure supplement 1
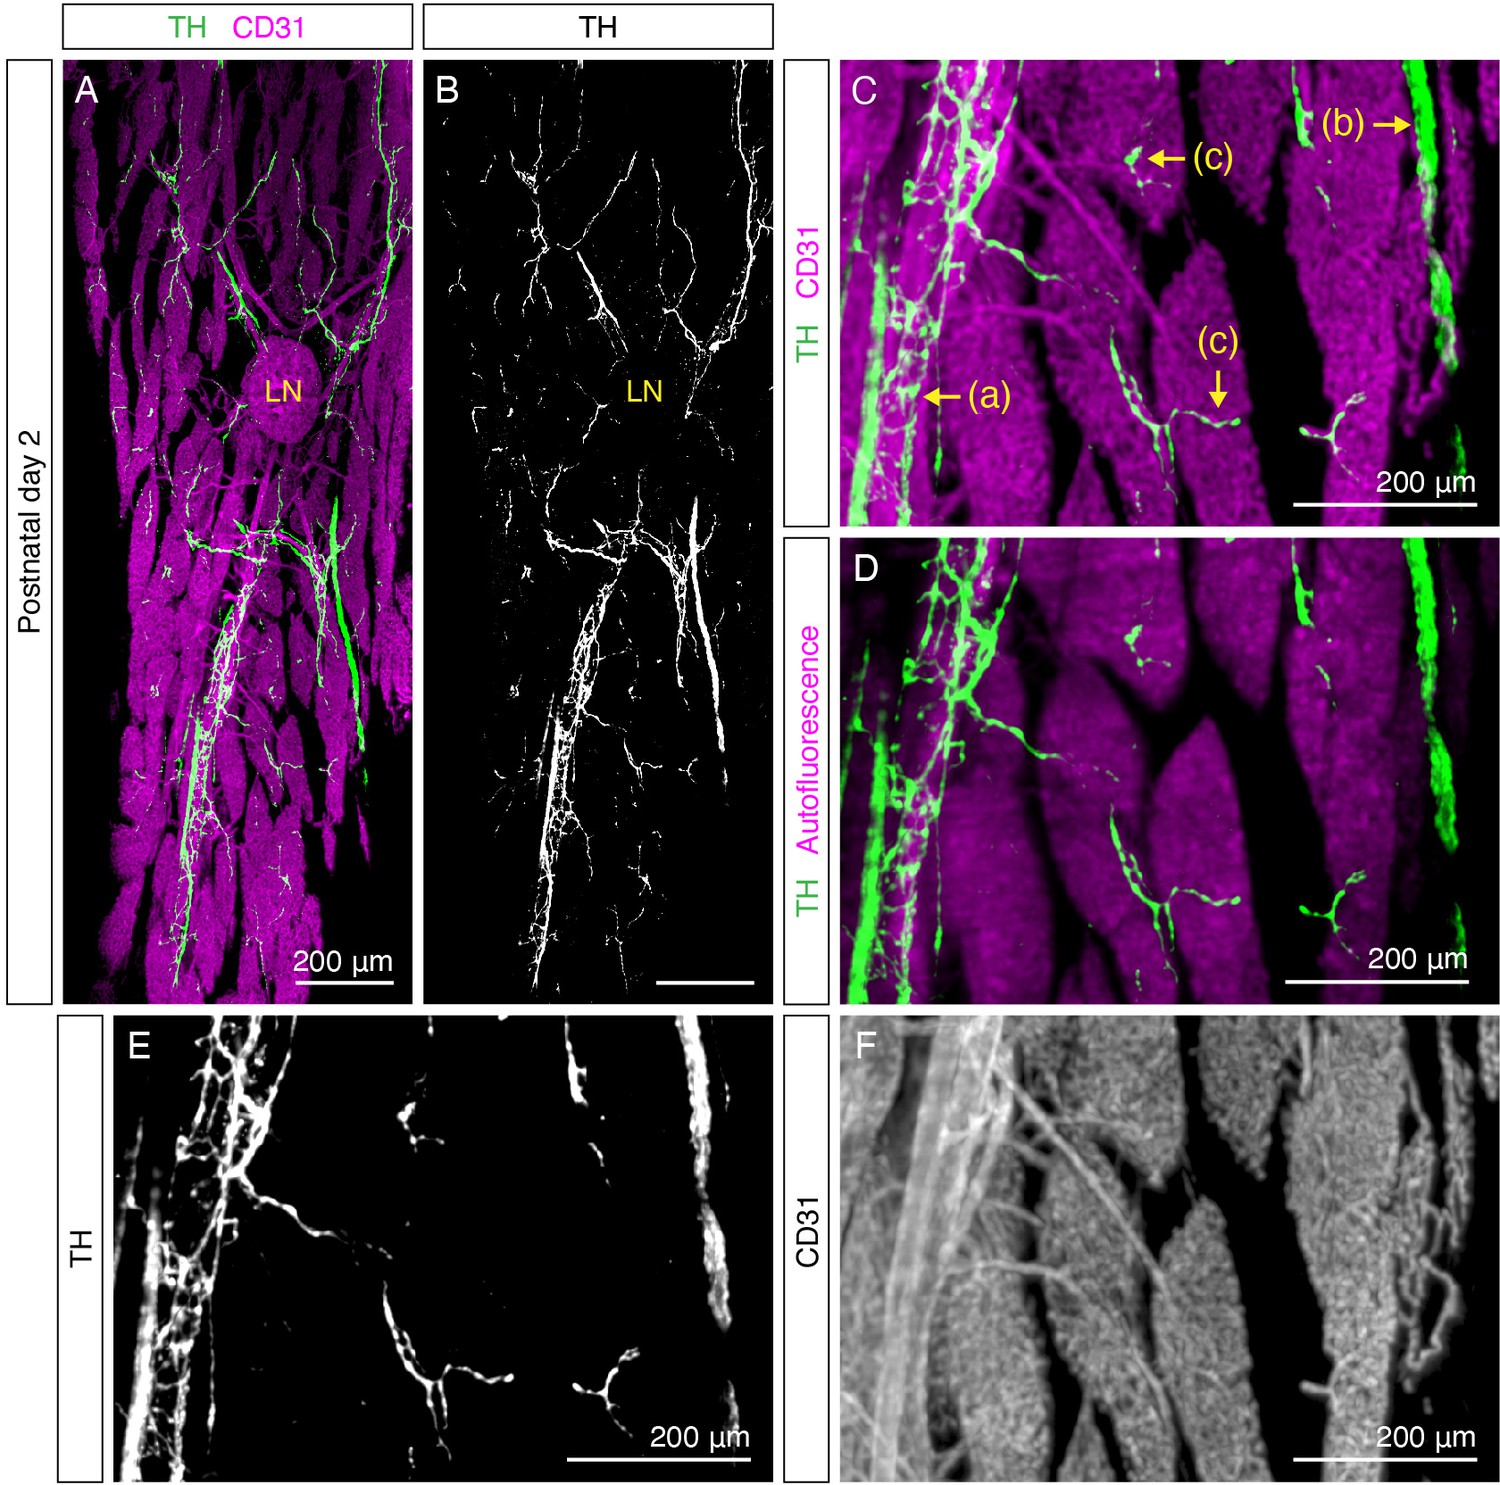
Organization of sympathetic nervous system in iWAT at P2.
(A–B) Representative whole-tissue maximum intensity projections (MIPs) of 50 μm z-stacks of iWAT from a P2 mouse. (A) TH (green) and CD31 (magenta). (B) TH only. (C–F) High-magnification images showing distinct sympathetic innervation patterns: (a) fibers wrapping around blood vessel, (b) nerve fascicle, and (c) fibers reaching lobules. (C) TH (green), CD31 (magenta). (D) TH (green), tissue autofluorescence (magenta). (E) TH. (F) CD31. Lymph nodes are indicated as LN. Scale bars are indicated.
Figure 1—figure supplement 2
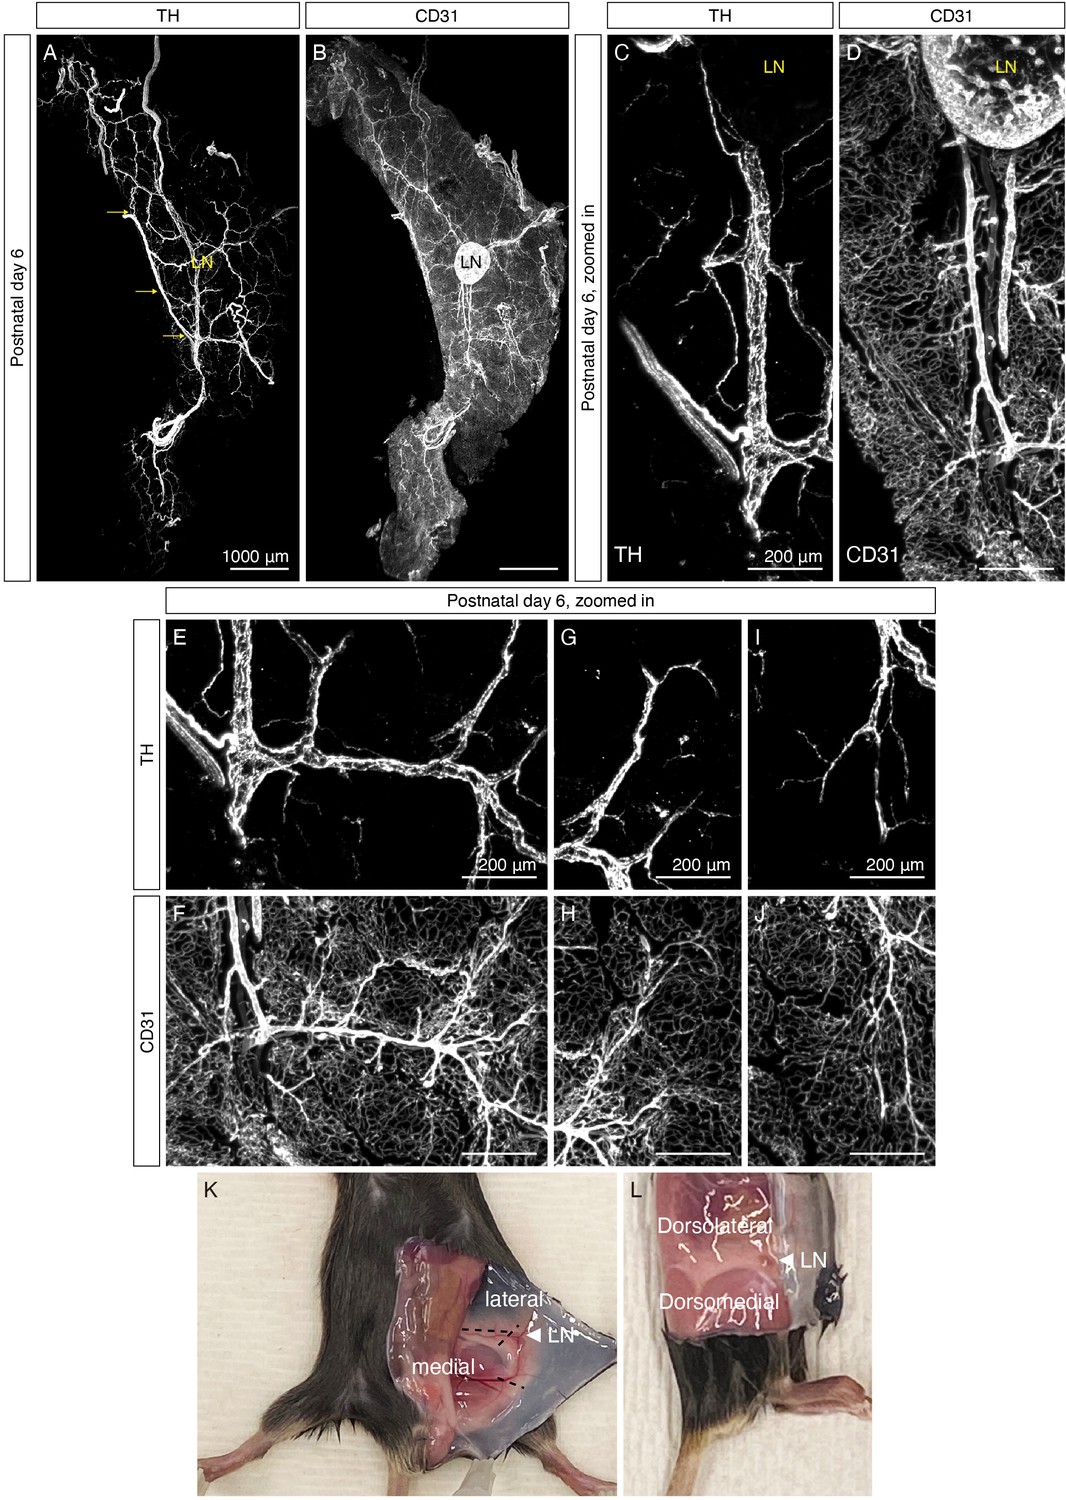
Organization of sympathetic nervous system in iWAT at P6.
(A–B) Single channel images corresponding to Figure 1B: (A) TH, (B) CD31. (C–D) Single channel images corresponding to Figure 1C: (C) TH, (D) CD31. (E–F) Single channel images corresponding to Figure 1D: (E) TH, (F) CD31. (G–H) Single channel images of Figure 1E: (G) TH, (H) CD31. (I–J) Single channel images of Figure 1F: (I) TH, (J) CD31. Scale bars are indicated. (K–L) Photographs of iWAT with various regions labeled. Dotted lines correspond to region boundaries shown in Figure 1A and cutting sites to isolate various regions for molecular analysis as described in Materials and methods. Lymph nodes are indicated as LN.
Figure 1—figure supplement 3
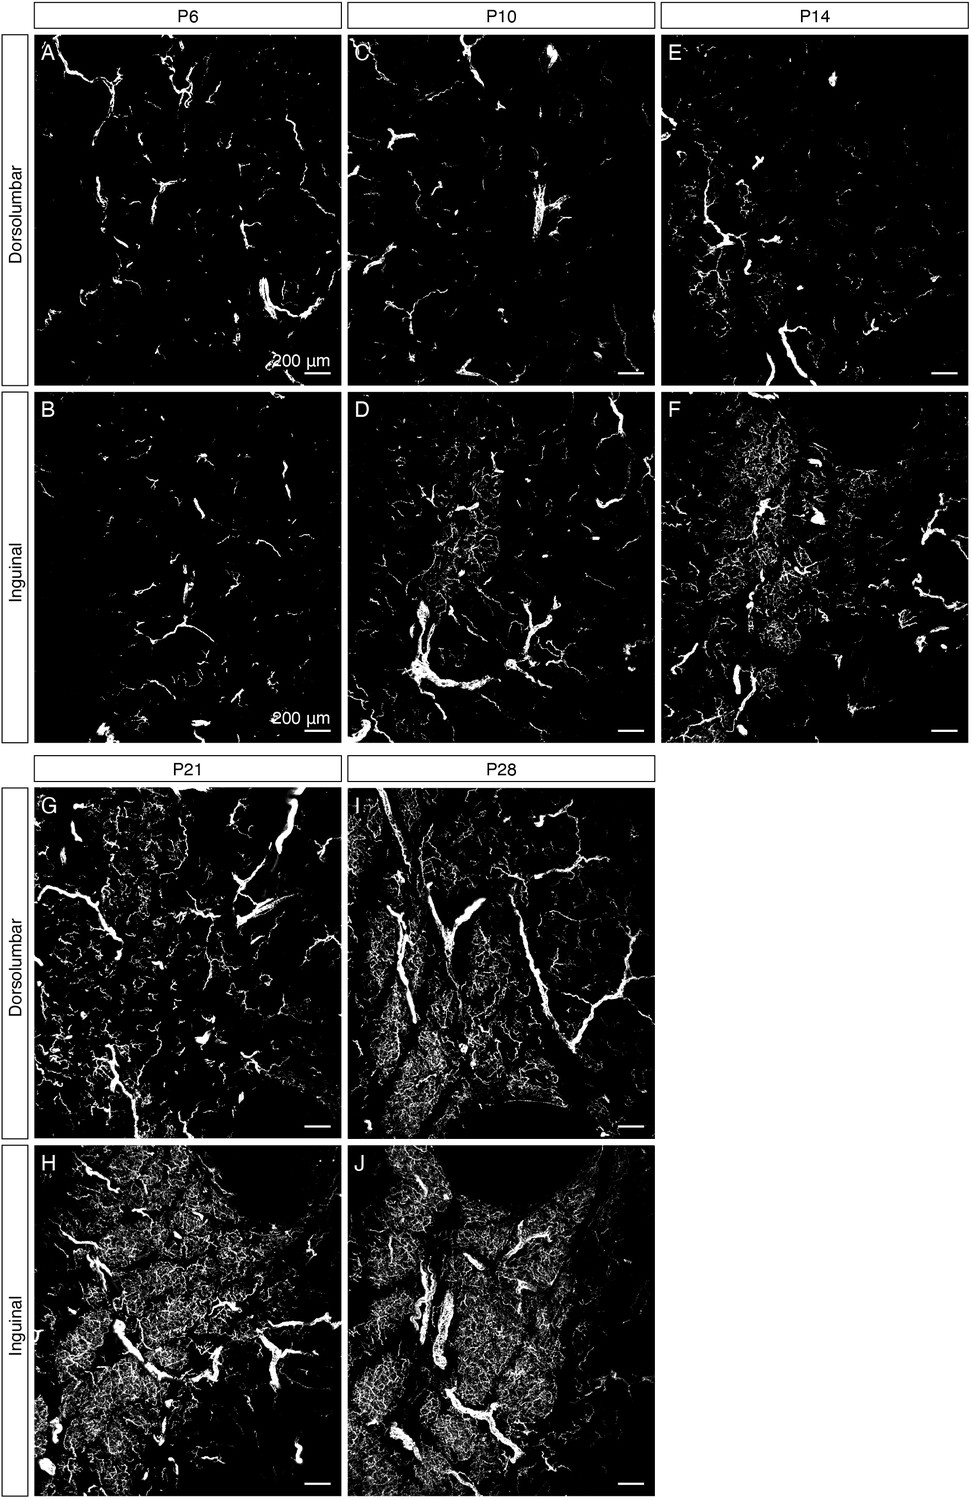
Development of sympathetic parenchymal innervation in iWAT.
High-magnification images corresponding to Figure 1G,H,I & J. MIPs of 50 μm z-stacks from iWAT of (A–B) P6, (C–D) P10, (E–F) P14, (G–H) P21, and (I–J) P28 immunolabeled with TH. (A, C, E, G, and I) Images of the dorsolumbar region. (B, D, F, H, and J) Images of the inguinal region. Scale bars are indicated.
Figure 1—video 1
Corresponding to Figure 1B–C.
Organization of sympathetic nervous system in iWAT at P6. The video first shows a rotating 3D projection of a whole iWAT from a P6 C57BL/6J mouse immunolabeled with TH, followed by a fly-through of continuous MIPs of 50 μm z-stacks revealing distinctive sympathetic innervation patterns within the same pad (nerve bundle, blood vessel innervation, and parenchymal projections). Arrows indicate convergence points where a nerve fiber deviate from the nerve bundle to project into the tissue.
Figure 1—video 2
Corresponding to Figure 1—figure supplement 3.
Development of sympathetic parenchymal innervation in iWAT. The video shows fly-throughs of optical sections from iWAT samples of P6, P10, and P14 C57BL/6J mice immunolabeled with TH, followed by fly-throughs of the same samples showing an overlay between TH (green) and UCP1 (magenta). The second part of the video shows fly-throughs of optical sections from iWAT samples of P21 and P28 C57BL/6J mice immunolabeled with TH, followed by fly-throughs of the same samples with an overlay between TH (green) and UCP1 (magenta).
Figure 2 with 3 supplements

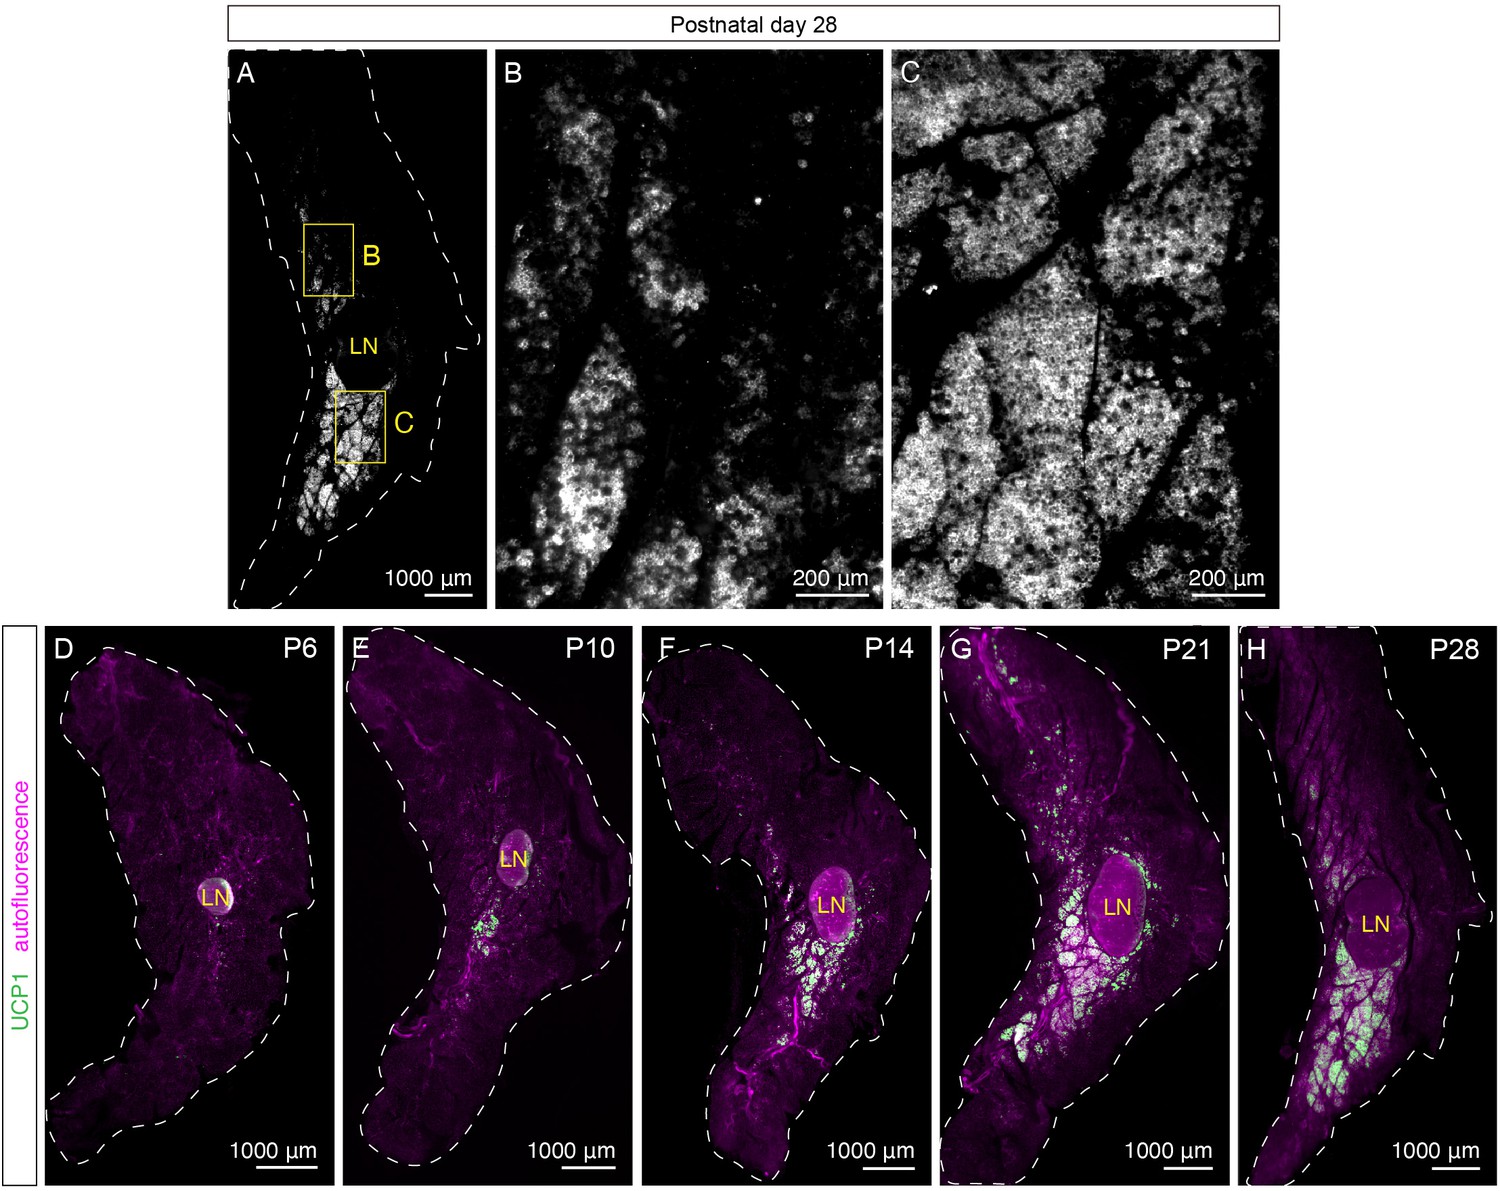
UCP1+ beige adipocytes emerge during early postnatal development.
(A–J) Representative optical sections of iWAT from P6, P10, P14, and P21 C57BL6/J mice immunolabeled with UCP1. (A) Whole-tissue optical section of a P6 iWAT. (B) High-magnification view of the boxed inguinal region in (A). (C) Whole-tissue optical section of a P10 iWAT. (D) High-magnification view of the boxed inguinal region in (C). (E) Whole-tissue optical section of a P14 iWAT. (F) High-magnification view of the boxed dorsolumbar region in (E). (G) High-magnification view of the boxed inguinal region in (E). (H) Whole-tissue optical section of a P21 iWAT. (I) High-magnification view of the boxed dorsolumbar region in (H). (J) High-magnification view of the boxed inguinal region in (H). Lymph nodes are indicated as LN. Dotted lines indicate tissue boundaries based on tissue autofluorescence signals shown in Figure 2—figure supplement 1D–H. Scale bars are indicated. All imaging studies were performed in at least three independent animals, and representative images are shown.
Figure 2—figure supplement 1
UCP1+ beige adipocytes emerge during early postnatal development.
(A–C) Representative optical sections of iWAT from a P28 C57BL6/J mouse immunolabeled with UCP1. (A) Whole-tissue optical section of a P28 iWAT. (B) High-magnification view of the boxed dorsolumbar region in (A). (C) High-magnification view of the boxed inguinal region in (A). (D–H) Two-channel images corresponding to Figure 2A,C,E,H, and (A). Tissue autofluorescence (magenta) and UCP1 (green) are shown. Lymph node is indicated as LN. Scale bars are indicated. Imaging was performed in three independent animals, and representative images are shown.
Figure 2—figure supplement 2
UCP1+ beige adipocytes emerge during early postnatal development.
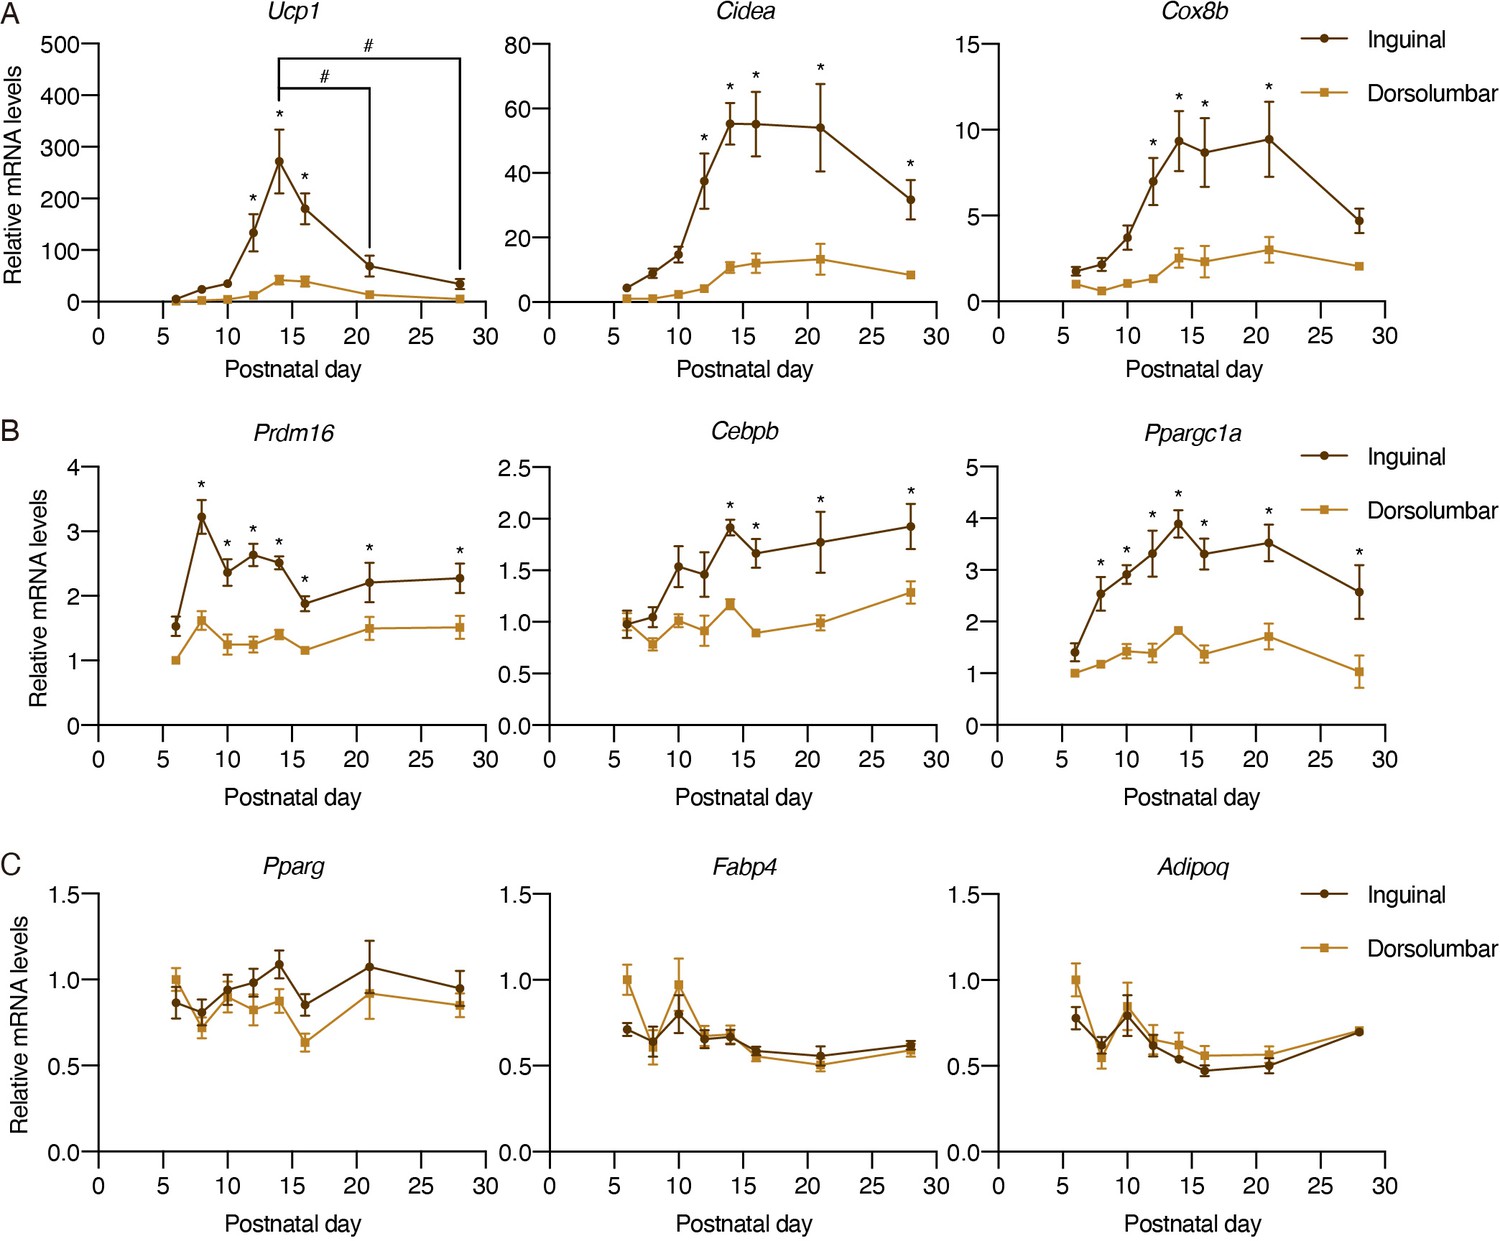
(A–C) Normalized gene expression of dorsolumbar vs. inguinal regions in iWAT from P6, P8, P10, P12, P14, P16, P21, and P28 C57BL6/J mice, n = 4. Representative genes involved in (A) the thermogenic program, (B) transcriptional regulation of beige adipocyte development and function, and (C) the adipogenic program. Data are presented as mean ± SEM and analyzed by two-way ANOVA followed by Bonferroni’s multiple comparisons test. * denotes p<0.05 dorsolumbar vs. inguinal region at each time point. # denotes p<0.05 inguinal region at P14 in comparison to inguinal regions at other time points.
Figure 2—figure supplement 3
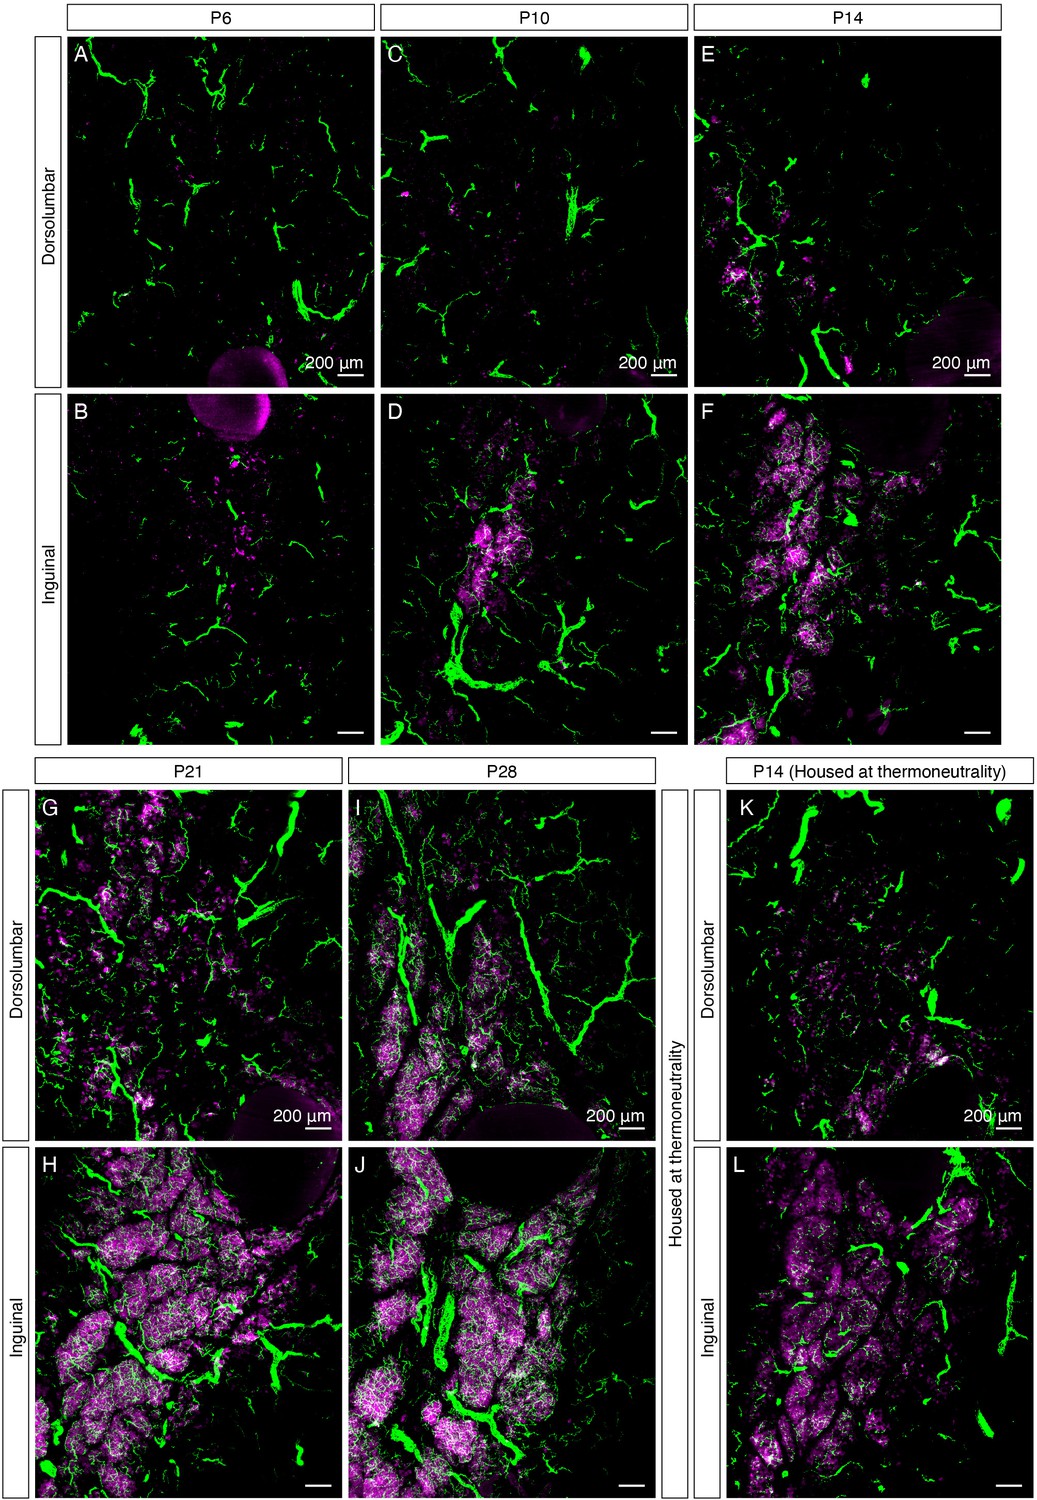
UCP1+ beige adipocytes and dense sympathetic parenchymal innervation emerge together during early postnatal development.
(A–J) High-magnification MIPs of 50 μm z-stacks from iWAT of (A–B) P6, (C–D) P10, (E–F) P14, (G–H) P21, and (I–J) P28 immunolabeled with TH (green) and UCP1 (magenta), corresponding to Figure 1—figure supplement 3. (K–L) High-magnification MIPs of 50 μm z-stacks from iWAT of a P14 C57BL6/J mouse housed at thermoneutrality (30°C), immunolabeled with TH (green) and UCP1 (magenta). (A, C, E, G, I and K) Images of the dorsolumbar region. (B, D, F, H, J and L) Images of the inguinal region. Scale bars are indicated.
Figure 3 with 2 supplements
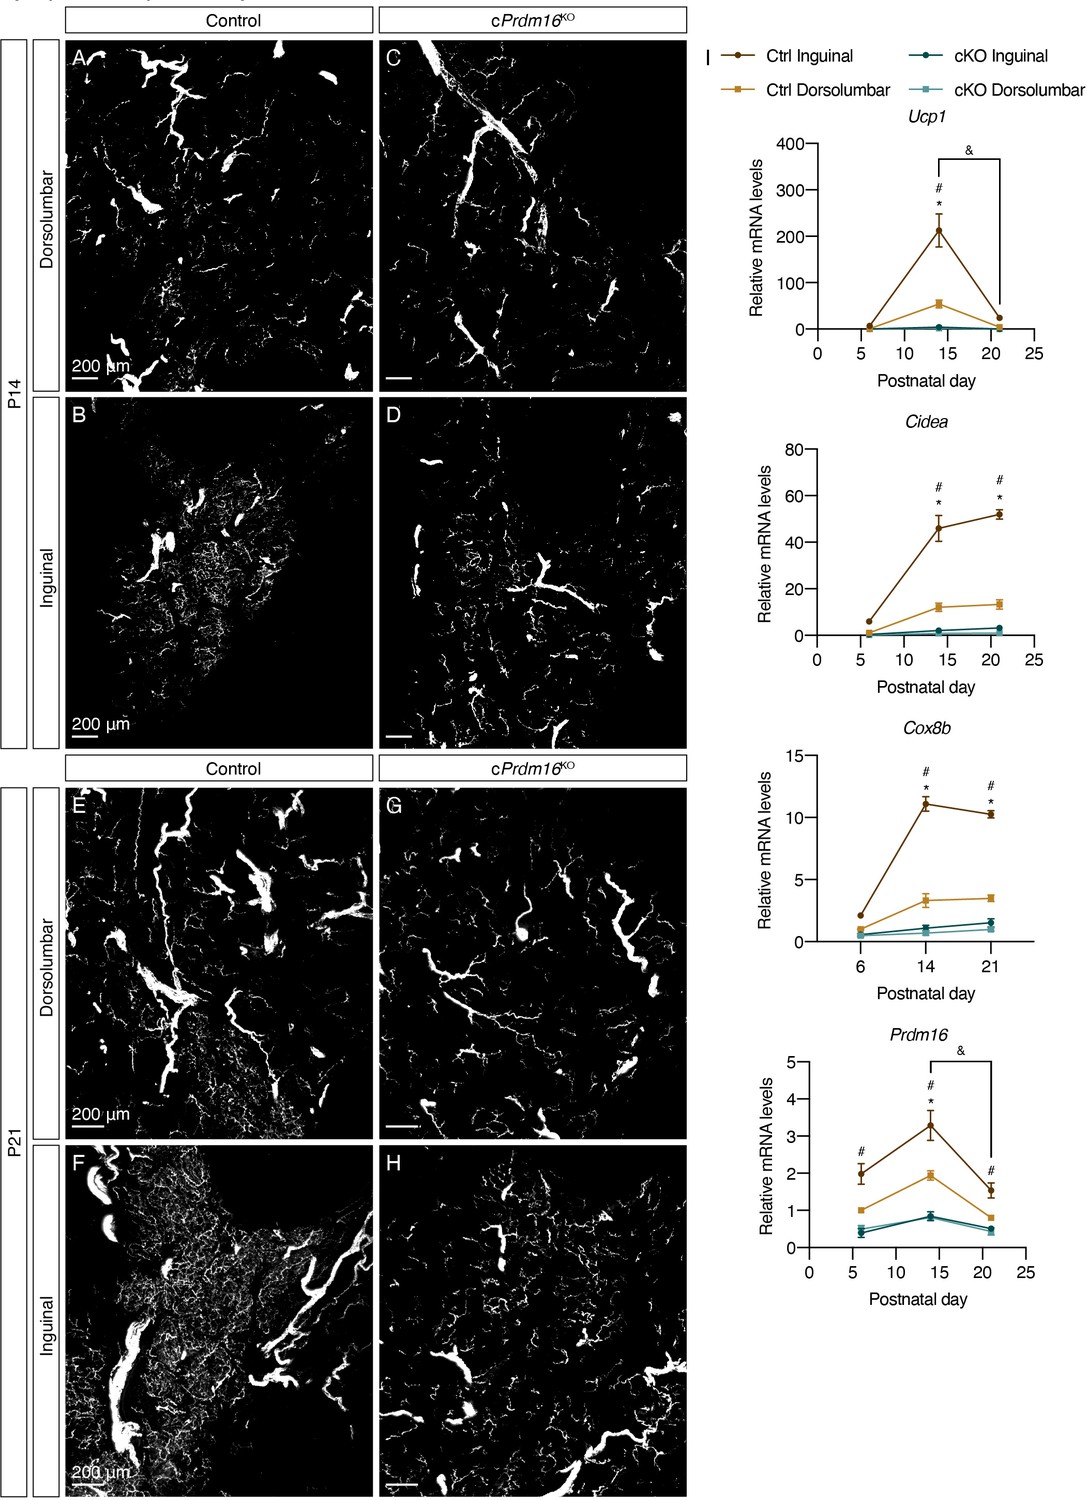
Prdm16 regulates the emergence of early postnatal beige adipocytes and dense sympathetic parenchymal innervation.
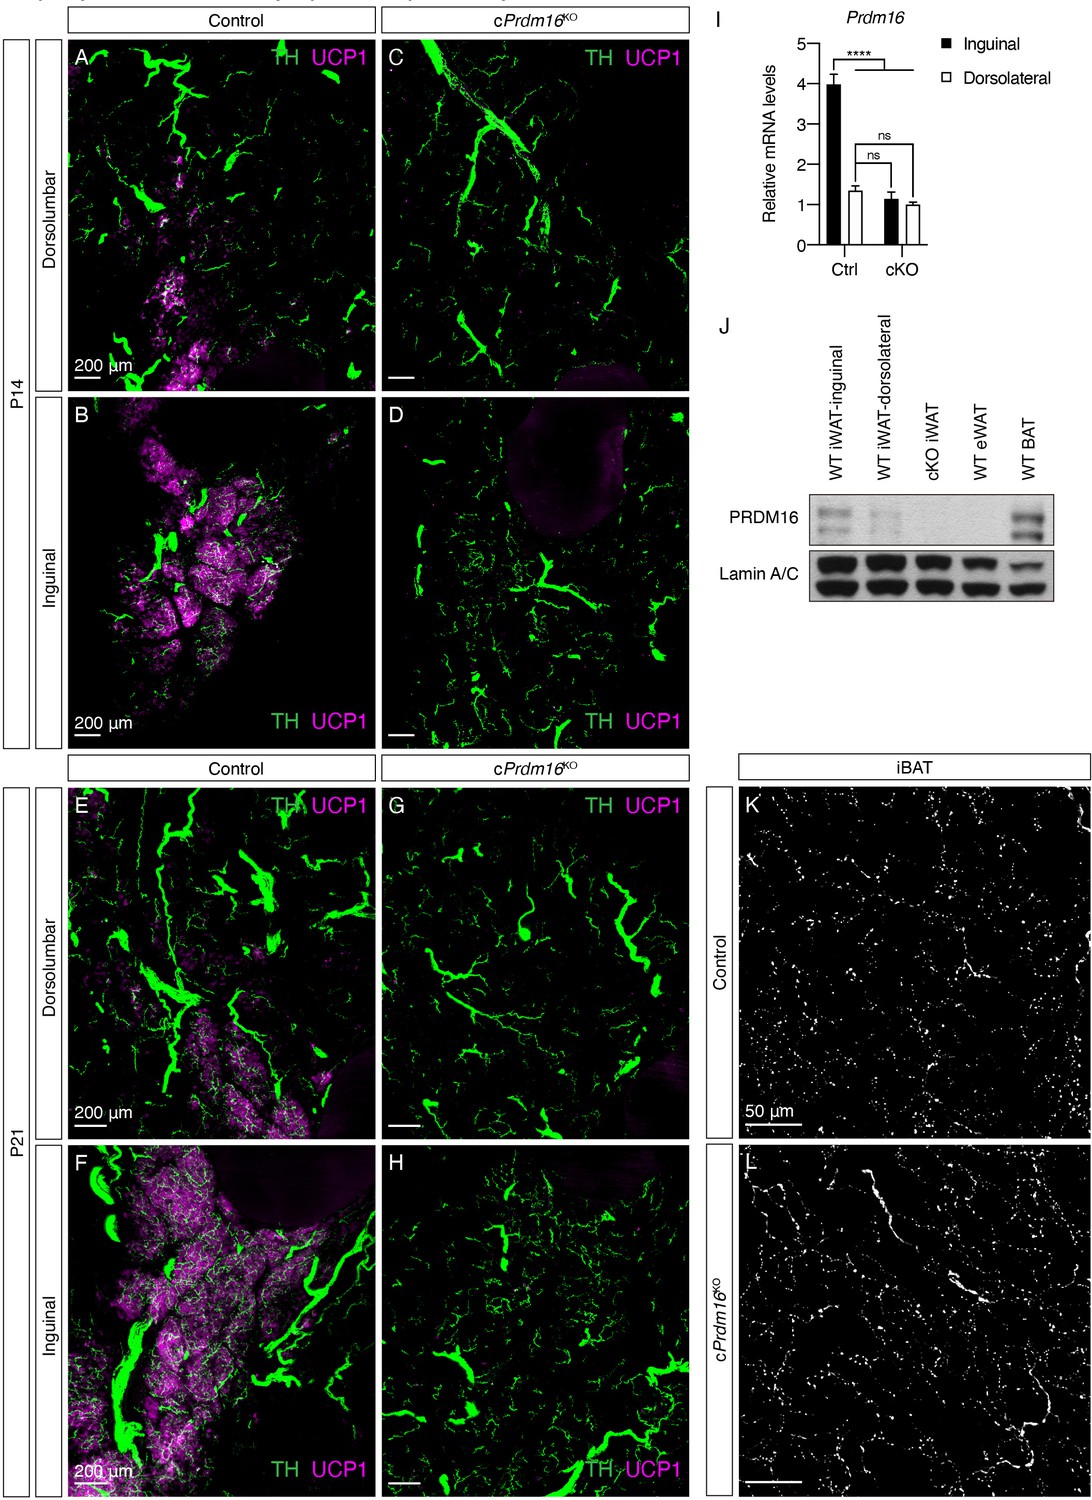
(A–D) Representative images of iWAT from (A–B) control and (C–D) cPrdm16KO mice at P14, immunolabeled with TH. MIPs from 50 μm z-stacks are shown. (E–H) Representative images of iWAT from (E–F) control and (G–H) cPrdm16KO mice at P21, immunolabeled with TH. MIPs from 50 μm z-stacks are shown. (A, C, E and G) Images of the dorsolumbar region. (B, D, F and H) Images of the inguinal region. Scale bars are indicated. Imaging was performed in at least three independent animals per genotype, and representative images are shown. (I) Normalized gene expression of dorsolumbar vs. inguinal regions in iWAT from control and cPrdm16KO mice at P6, P14, and P21, n = 2–3. Representative genes involved in the thermogenic program are shown. Data are presented as mean ± SEM and analyzed by two-way ANOVA followed by Bonferroni’s multiple comparisons test. * denotes p<0.05 dorsolumbar vs. inguinal regions of control samples at each time point. # denotes p<0.05 inguinal regions of control vs. cPrdm16KO samples at each time point. & denotes p<0.05 inguinal region at P14 in comparison to inguinal regions at P21.
Figure 3—figure supplement 1
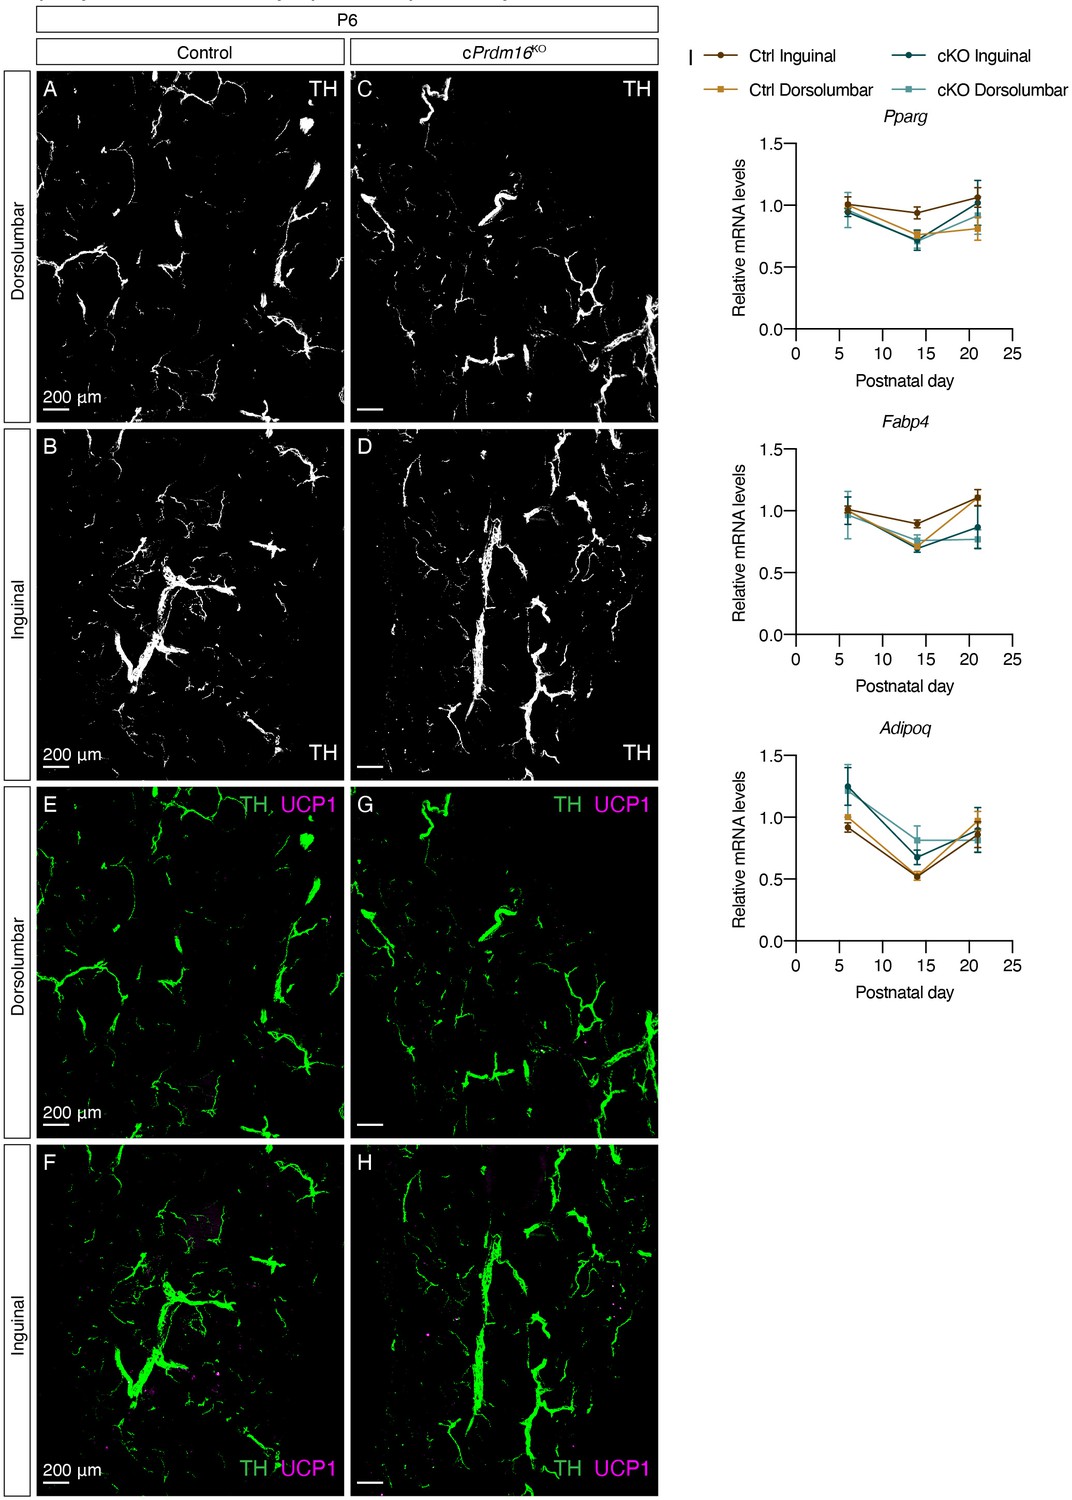
Prdm16 regulates the emergence of early postnatal beige adipocytes and dense sympathetic parenchymal innervation.
(A–D) Representative images of iWAT from (A–B) control and (C–D) cPrdm16KO mice at P6, immunolabeled with TH. MIPs from 50 μm z-stacks are shown. (E–H) Overlay of TH (green) and UCP1 (magenta), corresponding to (A–D). (A, C, E, and G) Images of the dorsolumbar region. (B, D, F, and H) Images of the inguinal region. Scale bars are indicated. Imaging was performed in at least three independent animals per genotype, and representative images are shown. (I) Normalized gene expression of dorsolumbar vs. inguinal regions in iWAT from control and cPrdm16KO mice at P6, P14, and P21, n = 2–3. Representative genes involved in the adipogenic program are shown. Data are presented as mean ± SEM and analyzed by two-way ANOVA followed by Bonferroni’s multiple comparisons test.
Figure 3—figure supplement 2
Prdm16 regulates the emergence of early postnatal beige adipocytes and dense sympathetic parenchymal innervation.
(A–D) Overlay of TH (green) and UCP1 (magenta), corresponding to Figure 3A–D. (E–H) Overlay of TH (green) and UCP1 (magenta), corresponding to Figure 3E–H. (I) qPCR analysis of Prdm16 mRNA levels in inguinal and dorsolateral regions of control and cPrdm16KO mice at P14, n = 4. Data are normalized to cPrdm16KO dorsolateral group, presented as mean + SEM, and analyzed by two-way ANOVA followed by Bonferroni’s multiple comparisons test. **** denotes p<0.0001 control inguinal vs. the rest of the groups. (J) Western blot of PRDM16 and lamin A/C of various fat depots from WT and cPrdm16KO 8-week-old mice. (K–L) Representative images of iBAT sections from (K) control and (L) cPrdm16KO 8-week-old mice, immunolabeled with TH. MIPs of 5 μm z-stacks are shown. Scale bars are indicated.
Figure 4 with 5 supplements
Prdm16 deletion during early development causes decreased sympathetic parenchymal innervation.
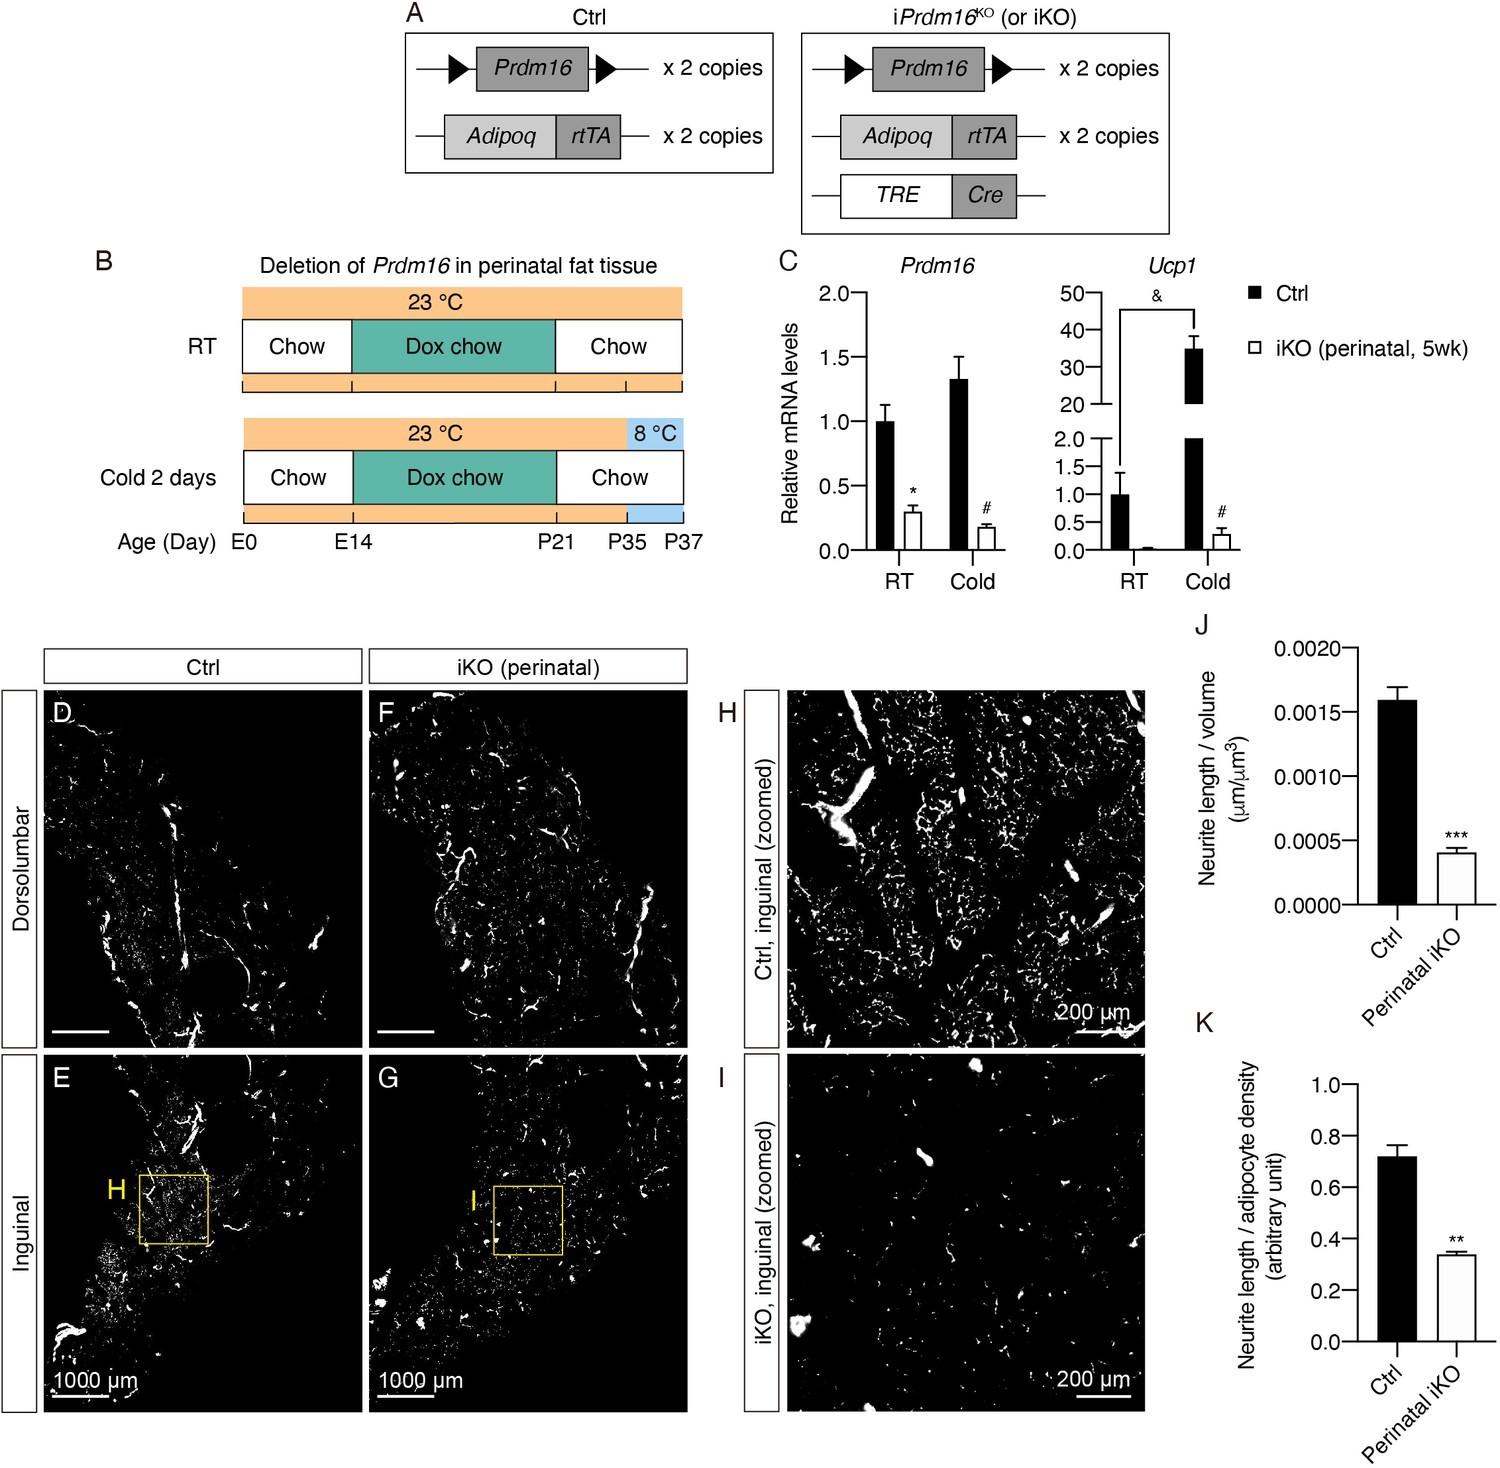
(A) Schematic representation of the genetic components of the control and iPrdm16KO mice. iPrdm16KO mice carry floxed Prdm16 alleles (Prdm16lox/lox), two copies of AdipoqrtTA transgene, and one copy of TRE-Cre transgene. Littermates carrying only Prdm16lox/lox and AdipoqrtTA (i.e. Cre-) were used as the control animals. (B) Control (Cre-) and iPrdm16KO (Cre+) mice housed at RT (23°C) were kept on a doxycycline-containing chow diet from E14 until P21 before being switched to a regular chow diet for another 2 weeks. Control and iPrdm16KO mice were either maintained at RT (23°C) or exposed to cold (8°C) for 2 days at P35. (C) Normalized gene expression of inguinal regions from control and iPrdm16KO (perinatal, 5 weeks) mice exposed to RT or cold, n = 3–5. Data are presented as mean + SEM and analyzed by two-way ANOVA followed by Bonferroni’s multiple comparisons test. * denotes p<0.05 iKO (perinatal, 5 weeks) vs. control samples at RT. # denotes p<0.05 iKO (perinatal, 5 weeks) vs. control samples at cold. & denotes p<0.05 cold- vs. RT-exposed control samples. (D–I) Representative optical sections of iWAT from (D–E) control and (F–G) iPrdm16KO (perinatal, 5 weeks) mice maintained at RT, immunolabeled with TH. (D and F) Images of the dorsolumbar region. (E and G) Images of the inguinal region. (H) High-magnification optical section of the boxed region in (E). (I) High-magnification optical section of the boxed region in (G). Scale bars are indicated. (J and K) Quantification of sympathetic parenchymal innervation in inguinal regions with total neurite length normalized to (J) regional volume or (K) adipocyte density. N = 3 biological replicates per genotype were analyzed. Average neurite density from five to seven randomly selected tissue volumes (technical replicates) contributes to neurite density measurement of one biological sample. Data are presented as mean + SEM and analyzed by Student’s t test. ** and *** denote p<0.01 and p<0.001, respectively.
Figure 4—figure supplement 1
Prdm16 deletion during early development blocks cold-induced thermogenic gene expression and causes decreased sympathetic parenchymal innervation in iWAT.
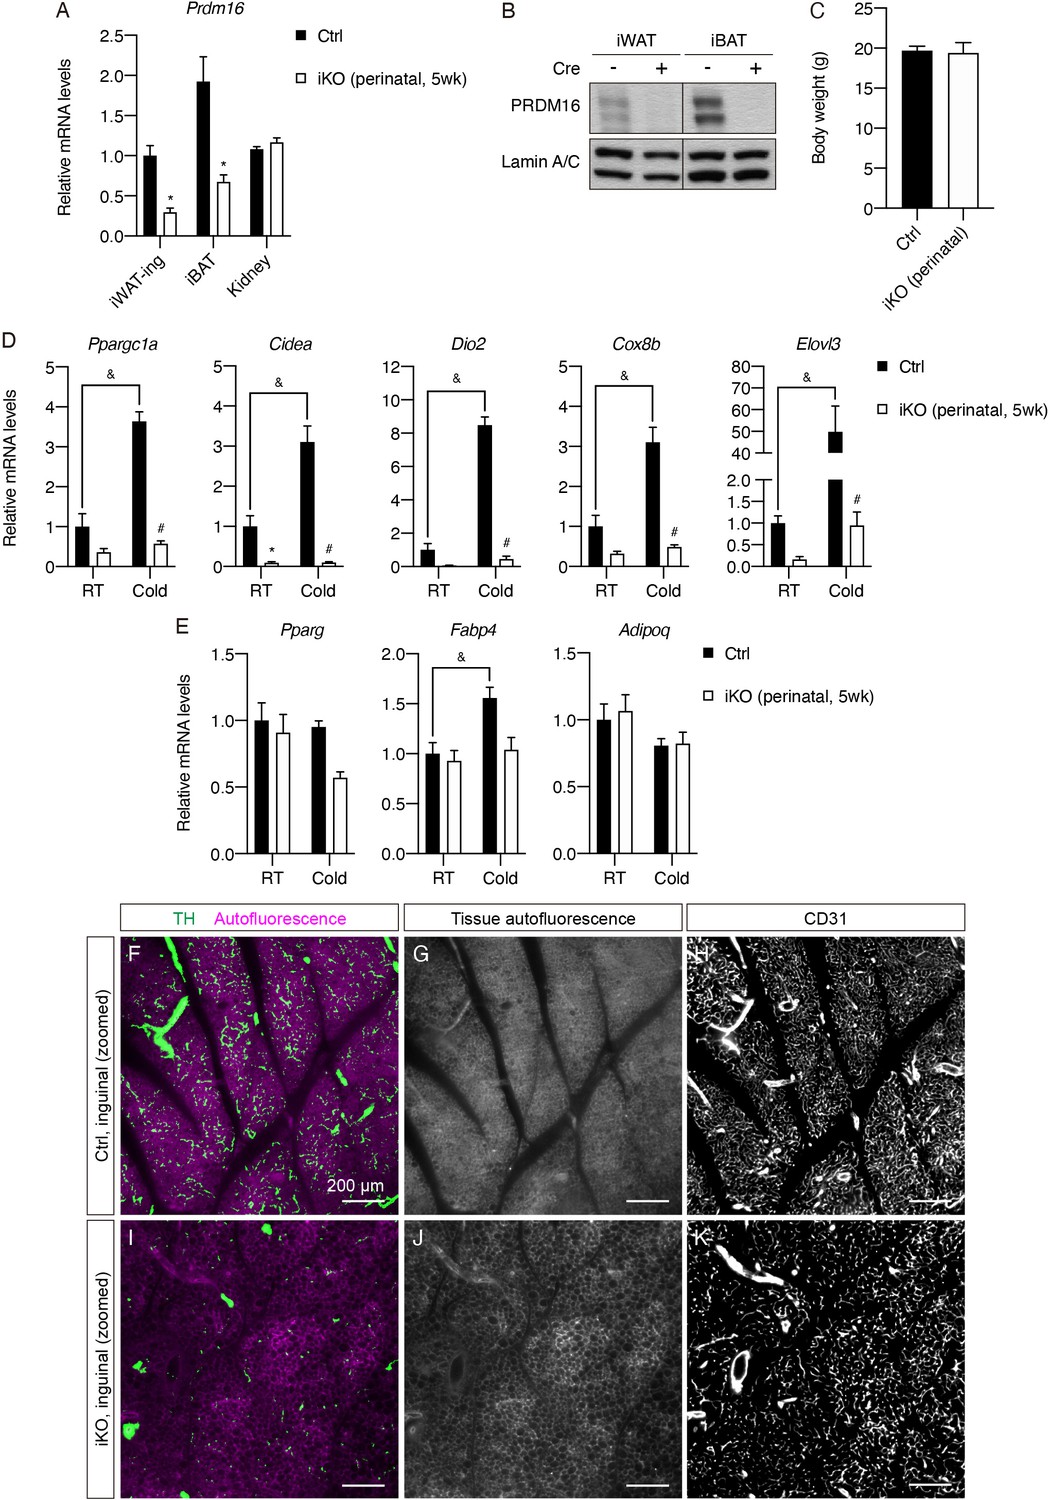
(A) Normalized Prdm16 mRNA expression of the indicated tissue types from control and iPrdm16KO (perinatal, 5 weeks) mice maintained at RT, n = 4–5. Data are presented as mean + SEM and analyzed by Student’s t test. * denotes p<0.05 iKO (perinatal, 5 weeks) vs. control samples for each tissue type. (B) Western blot of PRDM16 and lamin A/C from nuclear extracts of iWAT and iBAT of control (Cre-) and iPrdm16KO (perinatal, 5 weeks) (Cre+) samples. (C) Body weights of control and iPrdm16KO (perinatal, 5 weeks) mice before sacrifice. Data are presented as mean + SEM and analyzed by Student’s t test. (D–E) Normalized gene expression of inguinal regions of iWAT from control and iPrdm16KO (perinatal, 5 weeks) mice exposed to RT or cold for 2 days, n = 3–5. (D) Representative genes involved in the thermogenic program and (E) the adipogenic program. Data are normalized to control RT group, presented as mean + SEM, and analyzed by two-way ANOVA followed by Bonferroni’s multiple comparisons test. * denotes p<0.05 iKO (perinatal, 5 weeks) vs. control samples at RT. # denotes p<0.05 iKO (perinatal, 5 weeks) vs. control samples at cold. & denotes p<0.05 cold- vs. RT-exposed control samples. (F–K) Visualization of additional tissue structures, corresponding to Figure 4H–I. (F and I) Overlay between TH and tissue autofluorescence. (G and J) Tissue autofluorescence. (H and K) CD31. (F–H) Correspond to Figure 4H. (I–K) Correspond to Figure 4I. Scale bars are indicated.
Figure 4—figure supplement 2
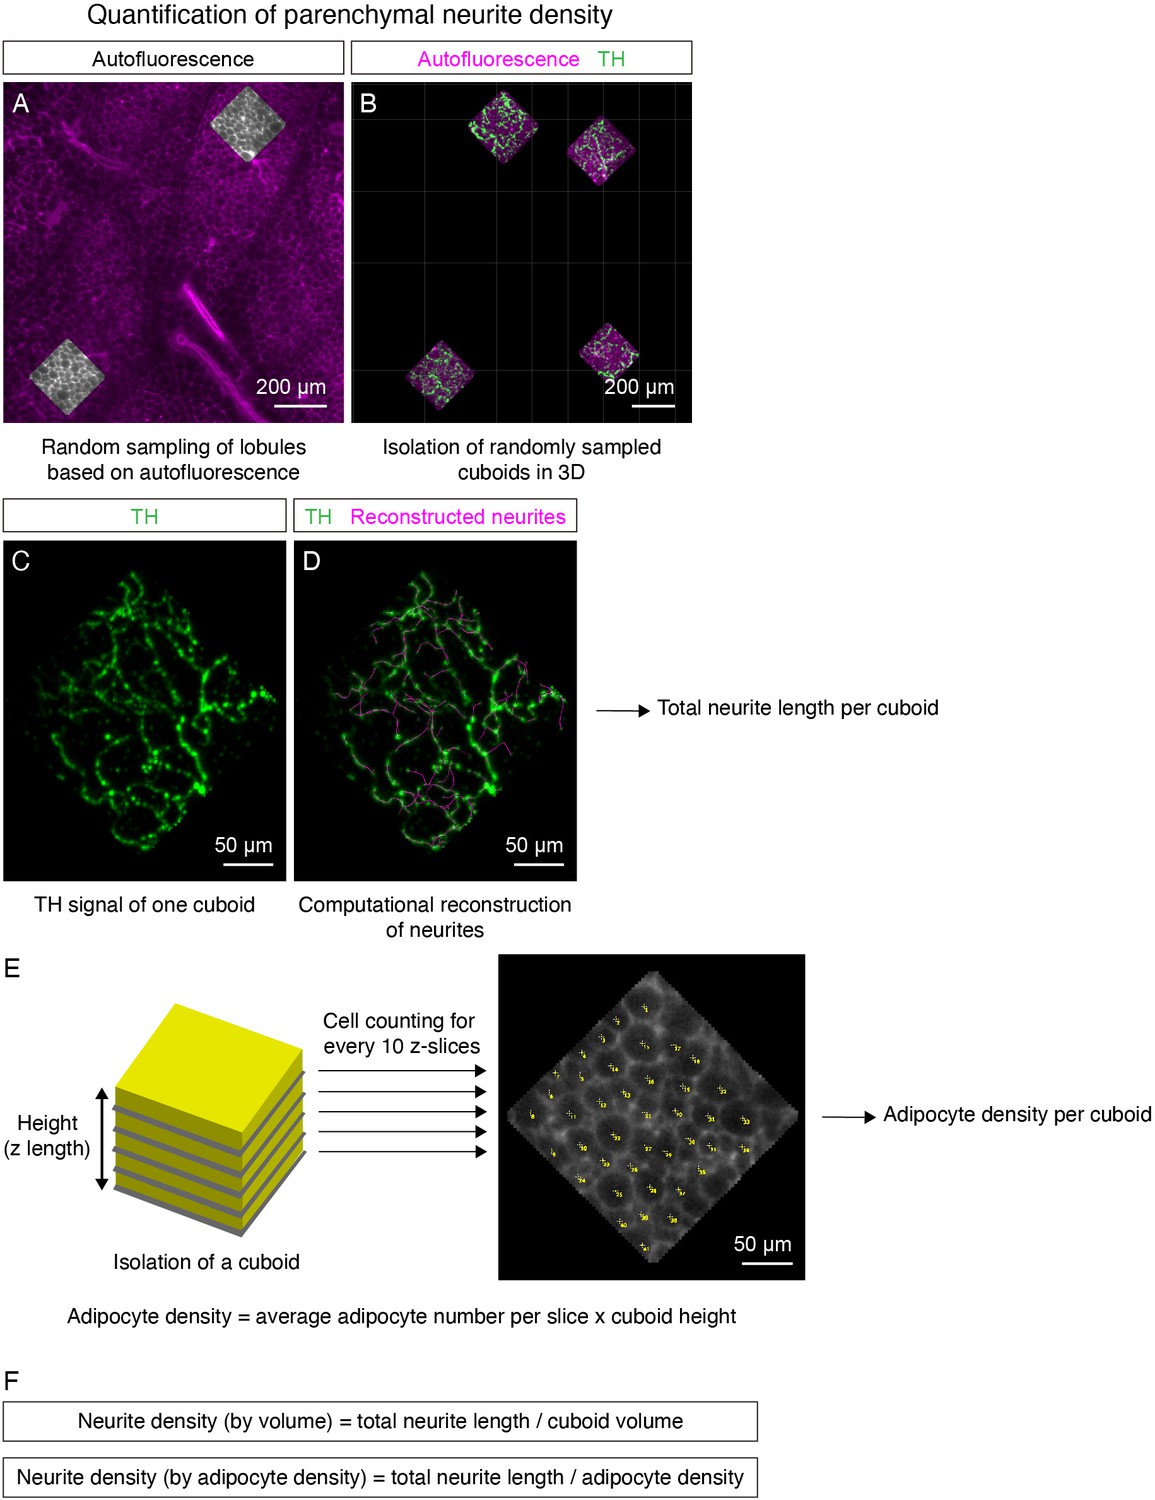
Neurite density quantification in 3D images.
(A–F) Illustration of sympathetic parenchymal neurite density quantification with random sampling and filament tracing. (A) In each inguinal region as shown in Figure 4H–I and Figure 5G–H, small squares contained within lobules are randomly selected based on tissue autofluorescence using Surfaces in Imaris. (B) Randomly selected squares are then reconstructed into cuboids to represent volumes in the specific lobules. Specific channels within cuboids were generated by using Mask option in Imaris. (C–D) Computational reconstruction of TH signal to obtain total neurite length in individual cuboids using Filament in Imaris. (C) TH signal in one representative cuboid. (D) Overlay between reconstructed filaments (magenta) and TH signal (green). The total neurite length of each cuboid can be estimated by measuring the total length of the reconstructed filaments. (E) Adipocyte number is manually counted based on the tissue autofluorescence signal. Average count of every 10 slices (in the xy plane) within a cuboid is taken as average adipocyte number per slice. Adipocyte density is estimated by multiplying average adipocyte number per slice and cuboid height (z-length). (F) Neurite density normalized by volume is presented as the ratio of total neurite length (mm) by cuboid volume (mm3). Neurite density normalized by adipocyte density is presented as the ratio of total neurite length (mm) by adipocyte density (arbitrary unit).
Figure 4—figure supplement 3
Prdm16 deletion during early development does not affect thermogenic gene program or sympathetic innervation in iBAT.
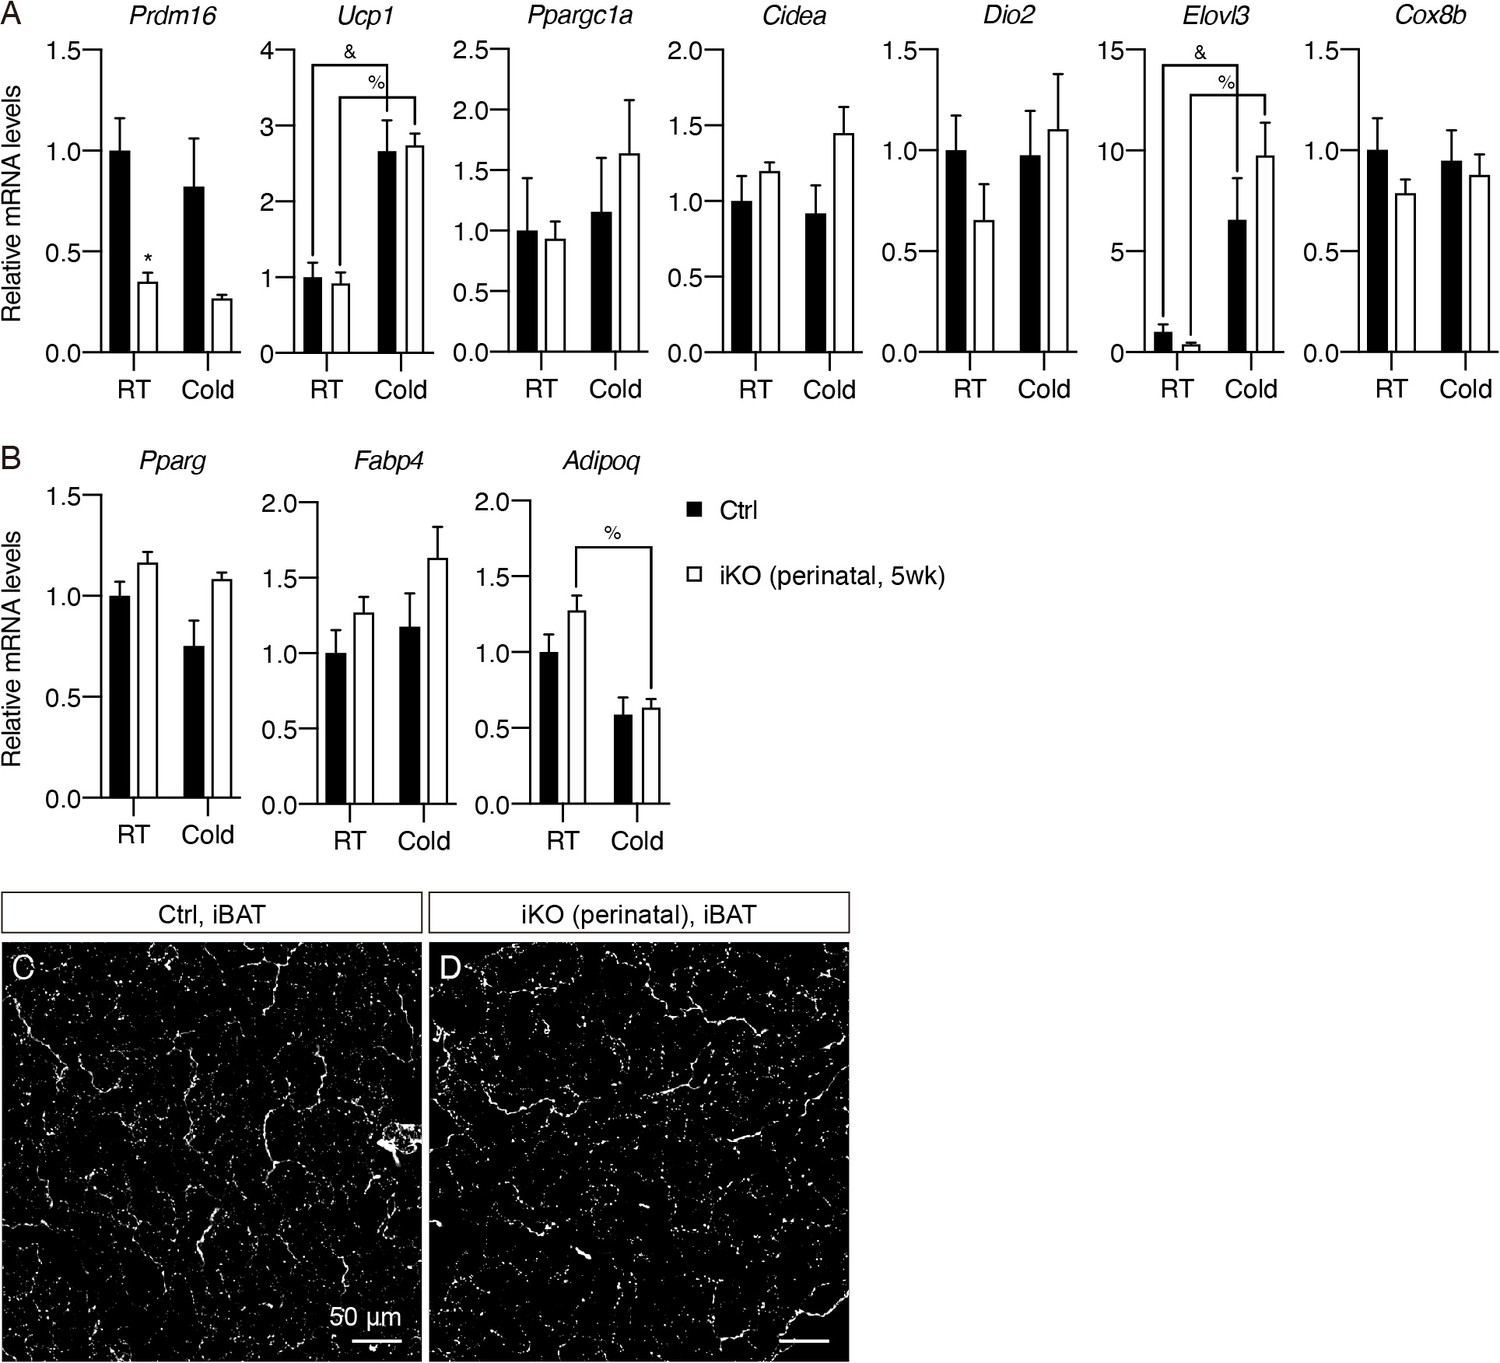
(A–B) Normalized gene expression of iBAT from control and iPrdm16KO (perinatal, 5 weeks) mice exposed to RT or cold, n = 3–5. (A) Representative genes involved in the thermogenic program and (B) the adipogenic program. Data are normalized to control RT group, presented as mean + SEM, and analyzed by two-way ANOVA followed by Bonferroni’s multiple comparisons test. * denotes p<0.05 iKO (perinatal, 5 weeks) vs. control samples at RT. & denotes p<0.05 cold- vs. RT-exposed control samples. % denotes p<0.05 cold- vs. RT-exposed iKO (perinatal, 5 weeks) samples. (C–D) Representative images of iBAT sections from (C) control and (D) iPrdm16KO (perinatal, 5 weeks) mice, immunolabeled with TH. MIPs of 10 μm z-stacks are shown. Scale bars are indicated.
Figure 4—figure supplement 4
Prdm16 deletion during early development causes lasting defects in sympathetic parenchymal innervation.
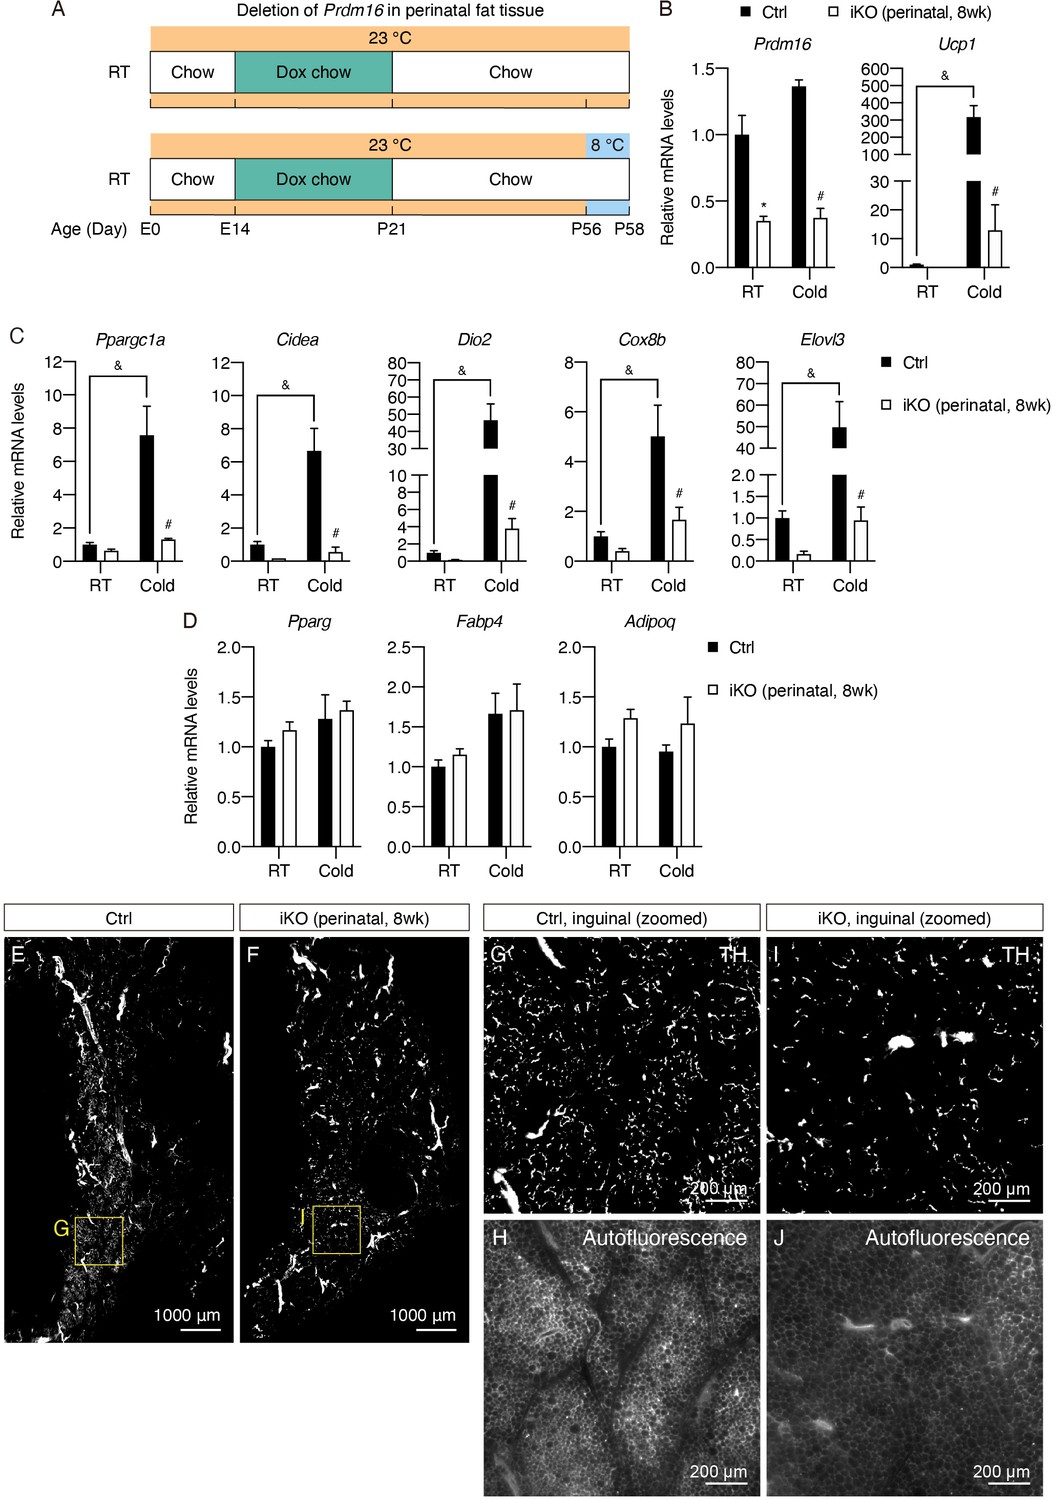
(A) Control (Cre-) and iPrdm16KO (Cre+) mice housed at RT (23°C) were kept on a doxycycline-containing chow diet from E14 until P21 before being switched to a regular chow diet and maintained until 8 weeks old. Control and iPrdm16KO mice were either maintained at RT (23°C) or exposed to cold (8°C) for 2 days at P56. (B–D) Normalized gene expression of inguinal regions of iWAT from control and iPrdm16KO (perinatal, 8 weeks) mice exposed to RT or cold for 2 days, n = 3–5. (B–C) Representative genes involved in the thermogenic program and (D) the adipogenic program. Data are normalized to control RT group, presented as mean + SEM, and analyzed by two-way ANOVA followed by Bonferroni’s multiple comparisons test. * denotes p<0.05 iKO (perinatal, 8 weeks) vs. control samples at RT. # denotes p<0.05 iKO (perinatal, 8 weeks) vs. control samples at cold. & denotes p<0.05 cold- vs. RT-exposed control samples. (E–J) Representative optical sections of iWAT from (E and G) control and (F and I) iPrdm16KO (perinatal, 8 weeks) mice maintained at RT, immunolabeled with TH. (E and F) Images of the whole iWAT. (G) High-magnification optical section of the boxed region in (E). (I) High-magnification optical section of the boxed region in (F). (H and J) Tissue autofluorescence images corresponding to (G) and (I), respectively. Scale bars are indicated.
Figure 4—video 1
Corresponding to Figure 4.
Sympathetic neurite density following perinatal Prdm16 deletion. The video shows fly-throughs of optical sections from in the inguinal regions of representative control and iPrdm16KO (perinatal, 5 weeks) mice immunolabeled with TH.
Figure 5 with 3 supplements

Prdm16 is not required for maintaining sympathetic parenchymal innervation in mature iWAT.
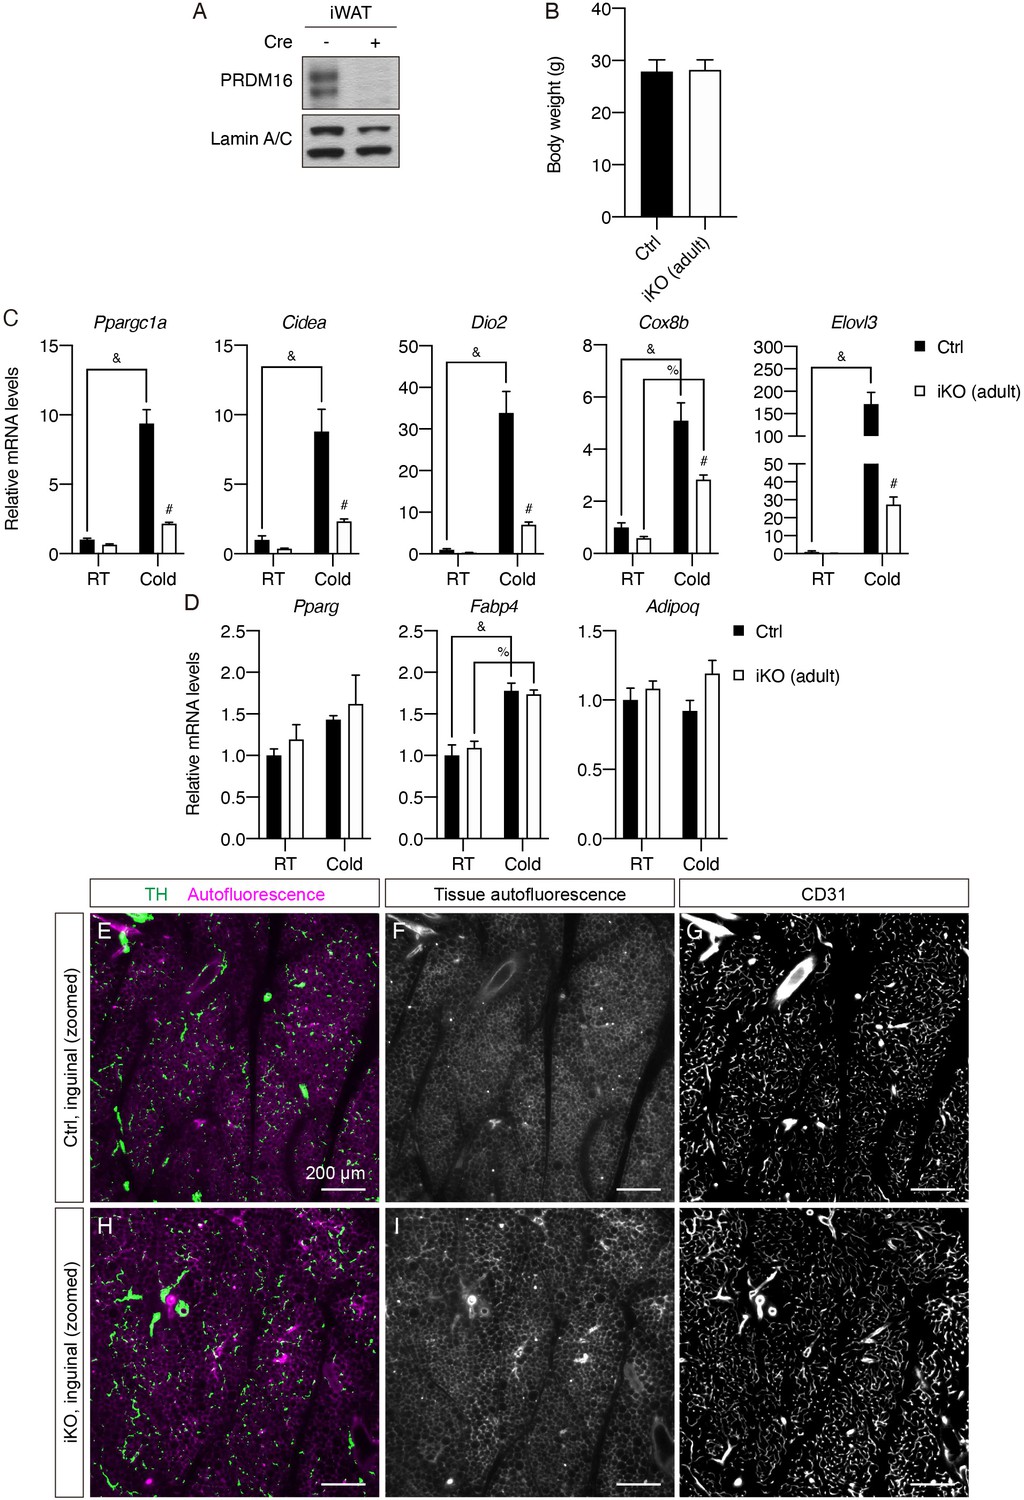
(A) Control (Cre-) and iPrdm16KO (Cre+) mice housed at RT (23°C) were kept on a regular chow diet until 8 weeks of age before being switched to a doxycycline-containing chow diet for 4 weeks. Control and iPrdm16KO mice were either maintained at RT (23°C) or exposed to cold (8°C) for 2 days at the end of doxycycline treatment. (B) Normalized gene expression of inguinal regions from control and iPrdm16KO (adult) mice exposed to RT or cold, n = 3–5. Data are normalized to control RT group, presented as mean + SEM, and analyzed by two-way ANOVA followed by Bonferroni’s multiple comparisons test. * denotes p<0.05 iKO (adult) vs. control samples at RT. # denotes p<0.05 iKO (adult) vs. control samples at cold. & denotes p<0.05 cold- vs. RT-exposed control samples. (C–F) Representative optical sections of iWAT from (C–D) control and (E–F) iPrdm16KO (adult deletion) mice maintained at RT, immunolabeled with TH. (C and E) Images of the dorsolumbar region. (D and F) Images of the inguinal region. (G) High-magnification optical section of the boxed region in (D). (H) High-magnification optical section of the boxed region in (F). Scale bars are indicated. (I–J) Quantification of sympathetic parenchymal innervation in inguinal regions with total neurite length normalized to (I) regional volume or (J) adipocyte density. N = 3 biological replicates per genotype were analyzed. Average neurite density from four to eight randomly selected tissue volumes (technical replicates) contributes to neurite density measurement of one biological sample. * denotes p<0.05 analyzed by Student’s t test.
Figure 5—figure supplement 1
Prdm16 deletion in adulthood attenuates cold-induced thermogenic gene expression but does not affect sympathetic parenchymal innervation in iWAT.
(A) Western blot of PRDM16 and lamin A/C (loading control) from nuclear extracts of iWAT from control (Cre-) and iPrdm16KO (adult) (Cre+) samples. (B) Body weights of control and iPrdm16KO (adult) mice maintained at RT before sacrifice. Data are presented as mean + SEM and analyzed by Student’s t test. (C–D) Normalized gene expression of inguinal regions of iWAT from control and iPrdm16KO (adult) mice exposed to RT or cold, n = 3–5. (C) Representative genes involved in the thermogenic program and (D) the adipogenic program. Data are normalized to control RT group, presented as mean + SEM, and analyzed by two-way ANOVA followed by Bonferroni’s multiple comparisons test. # denotes p<0.05 iKO (adult) vs. control samples at cold. & denotes p<0.05 cold- vs. RT-exposed control samples. % denotes p<0.05 cold- vs. RT-exposed iKO (adult) samples. (E–J) Visualization of additional tissue structures, corresponding to Figure 5G–H. (E and H) Overlay between TH and tissue autofluorescence. (F and I) Tissue autofluorescence. (G and J) CD31. (E–G) Correspond to Figure 5G. (H–J) Correspond to Figure 5H. Scale bars are indicated.
Figure 5—figure supplement 2
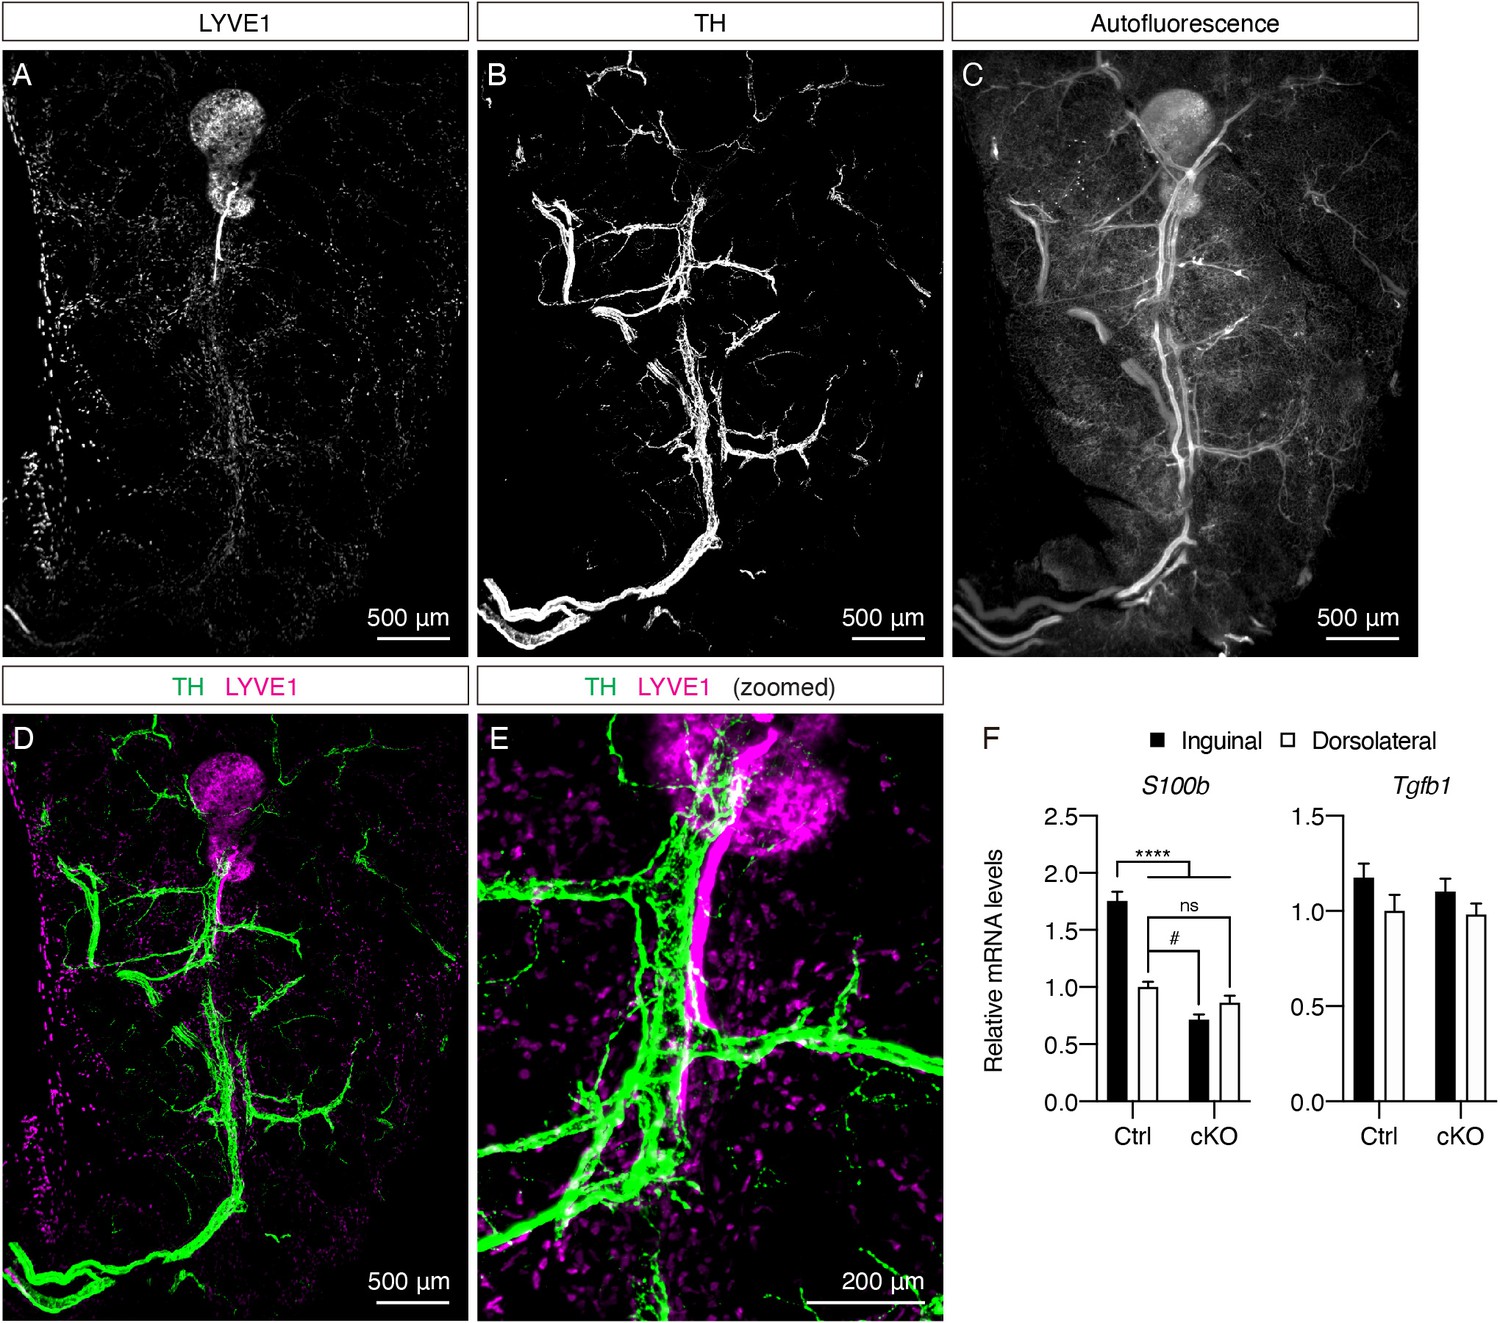
Additional tissue structures in the core of the inguinal region.
(A–E) Representative images of iWAT from a P8 C57BL6/J mouse immunolabeled with LYVE1 (magenta) and TH (green). MIPs of 50 μm z-stacks are shown. (A) LYVE1. (B) TH. (C) Autofluorescence. (D) Overlay of TH (green) and LYVE1 (magenta). (E) Zoomed-in view of the peri-lymph node region in (D). (F) qPCR analysis of S100b and Tgfb1 mRNA levels in inguinal and dorsolateral regions of control and cPrdm16KO mice at P14, n = 4. Data are normalized to control dorsolateral group, presented as mean + SEM, and analyzed by two-way ANOVA followed by Bonferroni’s multiple comparisons test. **** denotes p<0.0001 control inguinal vs. the rest of the groups. # denotes p<0.05 control dorsolateral vs. cKO inguinal.
Figure 5—video 1
Corresponding to Figure 5.
Sympathetic neurite density following adult Prdm16 deletion. The video shows fly-throughs of optical sections from in the inguinal regions of representative control and iPrdm16KO (adult deletion) mice immunolabeled with TH.
Tables
Key resources table
| Reagent type (species) or resource | Designation | Source or reference | Identifiers | Additional information |
|---|---|---|---|---|
| Strain, strain background (Mus musculus) | Adipoq-Cre | Jackson Laboratory | RRID:IMSR_JAX:028020 | |
| Strain, strain background (Mus musculus) | Adipoq-rtTA | PMID:22451920 | RRID:IMSR_JAX:033448 | |
| Strain, strain background (Mus musculus) | TRE-Cre | Jackson Laboratory | RRID:IMSR_JAX:006234 | |
| Strain, strain background (Mus musculus) | Prdm16lox/lox | PMID:24439384 | RRID:IMSR_JAX:024992 | |
| Antibody | Anti-tyrosine hydroxylase (Rabbit polyclonal) | Millipore | Cat# AB152, RRID:AB_390204 | IF(1:200) |
| Antibody | Anti-tyrosine hydroxylase (Sheep polyclonal) | Millipore | Cat# AB1542, RRID:AB_90755 | IF(1:200) |
| Antibody | Anti-CD31/PECAM-1 (Goat polyclonal) | R and D Systems | Cat# AF3628, RRID:AB_2161028 | IF(1:200) |
| Antibody | Anti-UCP1 (Rabbit polyclonal) | Abcam | Cat# ab10983, RRID:AB_2241462 | IF(1:200) |
| Antibody | Anti-LYVE1 (Rabbit polyclonal) | Abcam | Cat# ab14917, RRID:AB_301509 | IF(1:200) |
| Antibody | Anti-PRDM16 (Sheep polyclonal) | R and D Systems | Cat# AF6295, RRID:AB_10717965 | WB(1:500) |
| Antibody | Anti-Lamin A/C (Mouse monoclonal) | Santa Cruz Biotechnology | Cat# sc-376248, RRID:AB_10991536 | WB(1:2000) |
| Antibody | Anti-Rabbit IgG (H+L), Alexa Fluor 568 (Donkey polyclonal) | Thermo Fisher Scientific | Cat# A10042, RRID:AB_2534017 | IF(1:200) |
| Antibody | Anti-Rabbit IgG (H+L), Alexa Fluor 647 (Donkey polyclonal) | Thermo Fisher Scientific | Cat# A32795, RRID:AB_2762835 | IF(1:200) |
| Antibody | Anti-Sheep IgG (H+L), Alexa Fluor 647 (Donkey polyclonal) | Thermo Fisher Scientific | Cat# A-21448, RRID:AB_2535865 | IF(1:200) |
| Antibody | Anti-Goat IgG (H+L), Alexa Fluor 568 (Donkey polyclonal) | Thermo Fisher Scientific | Cat# A-11057, RRID:AB_2534104 | IF(1:200) |
| Software, algorithm | Imaris | Bitplane | http://www.bitplane.com/imaris/imaris; RRID:SCR_007370 | |
| Software, algorithm | FilamentTracer | Bitplane | http://www.bitplane.com/imaris/filamenttracer; RRID:SCR_007366 |
Additional files
-
Supplementary file 1
qPCR primer sequences used in this study.
- https://cdn.elifesciences.org/articles/64693/elife-64693-supp1-v2.docx
-
Transparent reporting form
- https://cdn.elifesciences.org/articles/64693/elife-64693-transrepform-v2.docx
Download links
A two-part list of links to download the article, or parts of the article, in various formats.
Downloads (link to download the article as PDF)
Open citations (links to open the citations from this article in various online reference manager services)
Cite this article (links to download the citations from this article in formats compatible with various reference manager tools)
Early postnatal interactions between beige adipocytes and sympathetic neurites regulate innervation of subcutaneous fat
eLife 10:e64693.
https://doi.org/10.7554/eLife.64693


