A novel, ataxic mouse model of ataxia telangiectasia caused by a clinically relevant nonsense mutation
- The Lundquist Institute for Biomedical Innovation, Harbor-UCLA Medical Center, United States
- Department of Biochemistry and Medical Genetics,Max Rady College of Medicine, University of Manitoba, Canada
- Department of Pathology & Laboratory Medicine, David Geffen School of Medicine, United States
- Department of Medicine, Harbor-UCLA Medical Center, United States
- Department of Pediatrics, Harbor-UCLA Medical Center, United States
- Center for Pediatric Neurological Disease Research, St. Jude Pediatric Translational Neuroscience Initiative, St. Jude Children’s Research Hospital, United States
- Department of Neurology, Harbor-UCLA Medical Center, United States
Figures
Figure 1
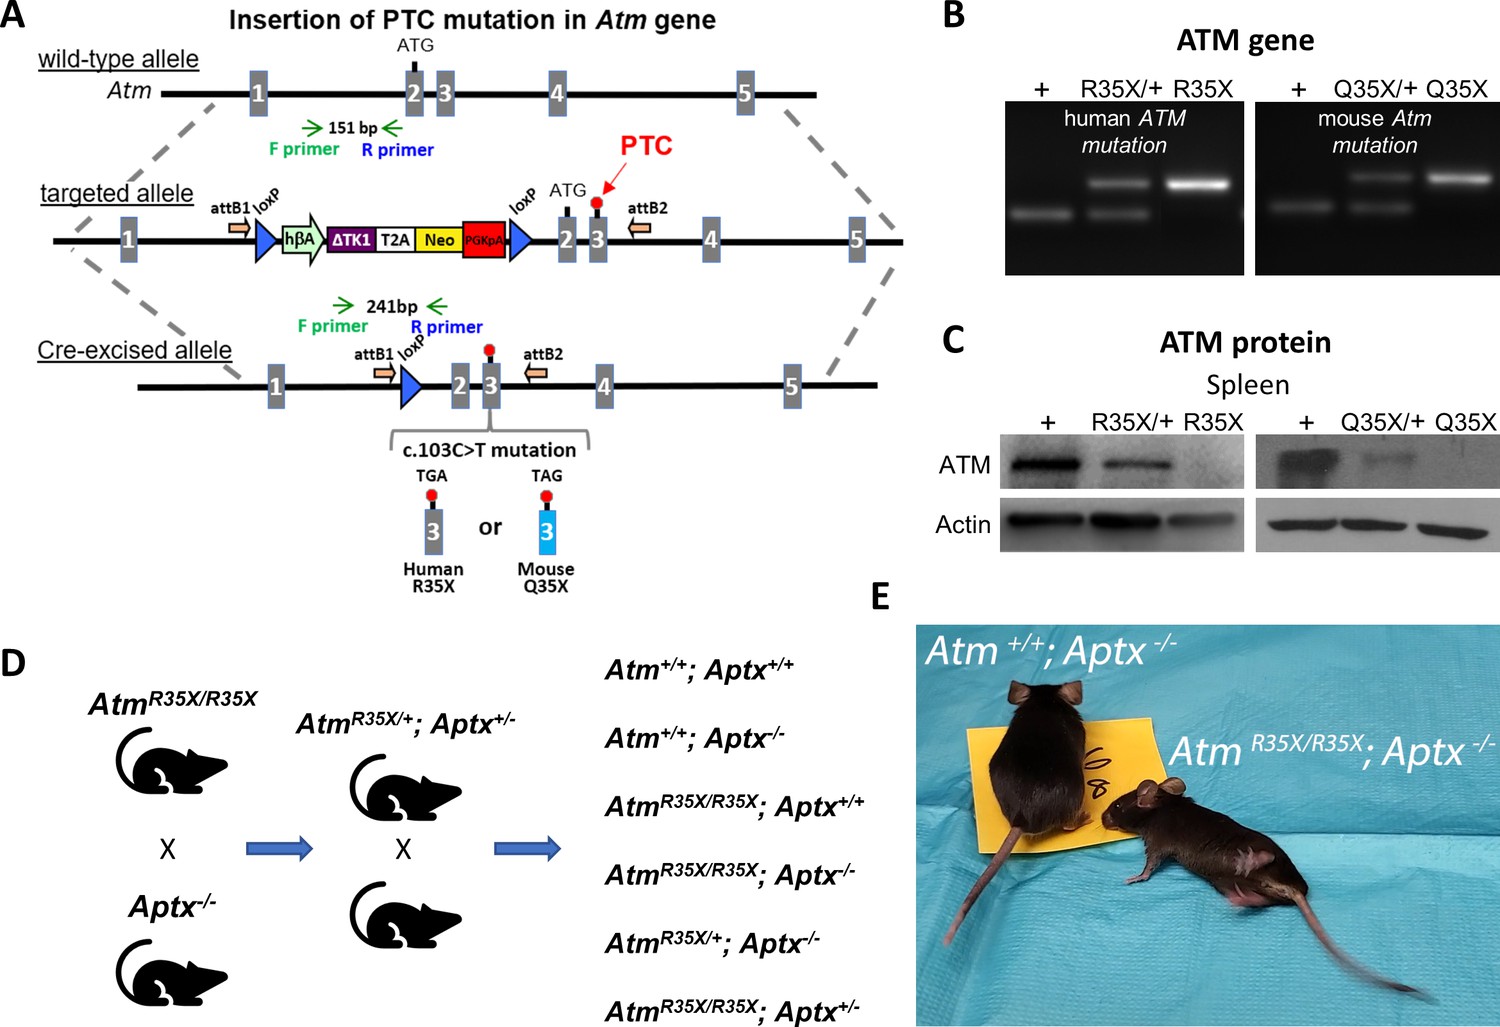
New A-T mouse models expressing clinically related PTCs.
(A) The Atm gene locus was targeted by homologous recombination of a targeting vector containing a modified NorCOMM cassette in intron one and the corresponding A-T PTC mutation in exon 3 to create the targeted AtmR35X and AtmQ35X ES cell lines. Following germline transmission of these alleles in mice, the floxed NorCOMM cassette was removed by Cre-excision in vivo to produce the final AtmR35X and AtmQ35X mouse lines. (B) Genotyping of A-T mouse models. PCR agarose gel of mouse DNA shows 151 bp wild-type (+) allele band and 241 bp Cre-excised targeted allele band. (C) ATM levels were examined using immunoblot analyses of the spleen due to its high expression density in this tissue. Exemplar blots illustrate a gene dose effect of ATM protein expression in samples harvested from wild-type (+), heterozygous (R35X/+, Q35X/+), and homozygous AtmR35X/R35X (R35X) and AtmQ35X/Q35X (Q35X) mice as indicated. (D) Breeding scheme schematic for double mutant and control mice for this study. (E) AtmR35X/R35X; Aptx−/− mice develop an ataxia that at late stages results in a severe loss of motor coordination and ability to ambulate (see Videos 1–4). Abbreviations for panel 1: hβA-human beta Actin promotor; ∆TK1-delta TK1, inactivated Thymidine Kinase 1; (T2A)-self-cleaving peptide sequence; Neo-Neomycin gene; PGKpA-Phosphoglycerate kinase poly A tail; loxP-recombination elements are shown as a blue triangle; orientation of the Gateway attB recombination elements is shown by an orange arrow; orientation of the genotyping (F) and (R) primers is shown by green and blue arrows, respectively; and engineered PTC sites are shown in exon 3 by a red circle. A-T, Ataxia Telangiectasia; ATM, A-T mutated; PTC, premature termination codon.
-
Figure 1—source data 1
Original blots.
- https://cdn.elifesciences.org/articles/64695/elife-64695-fig1-data1-v2.zip
Figure 2 with 1 supplement
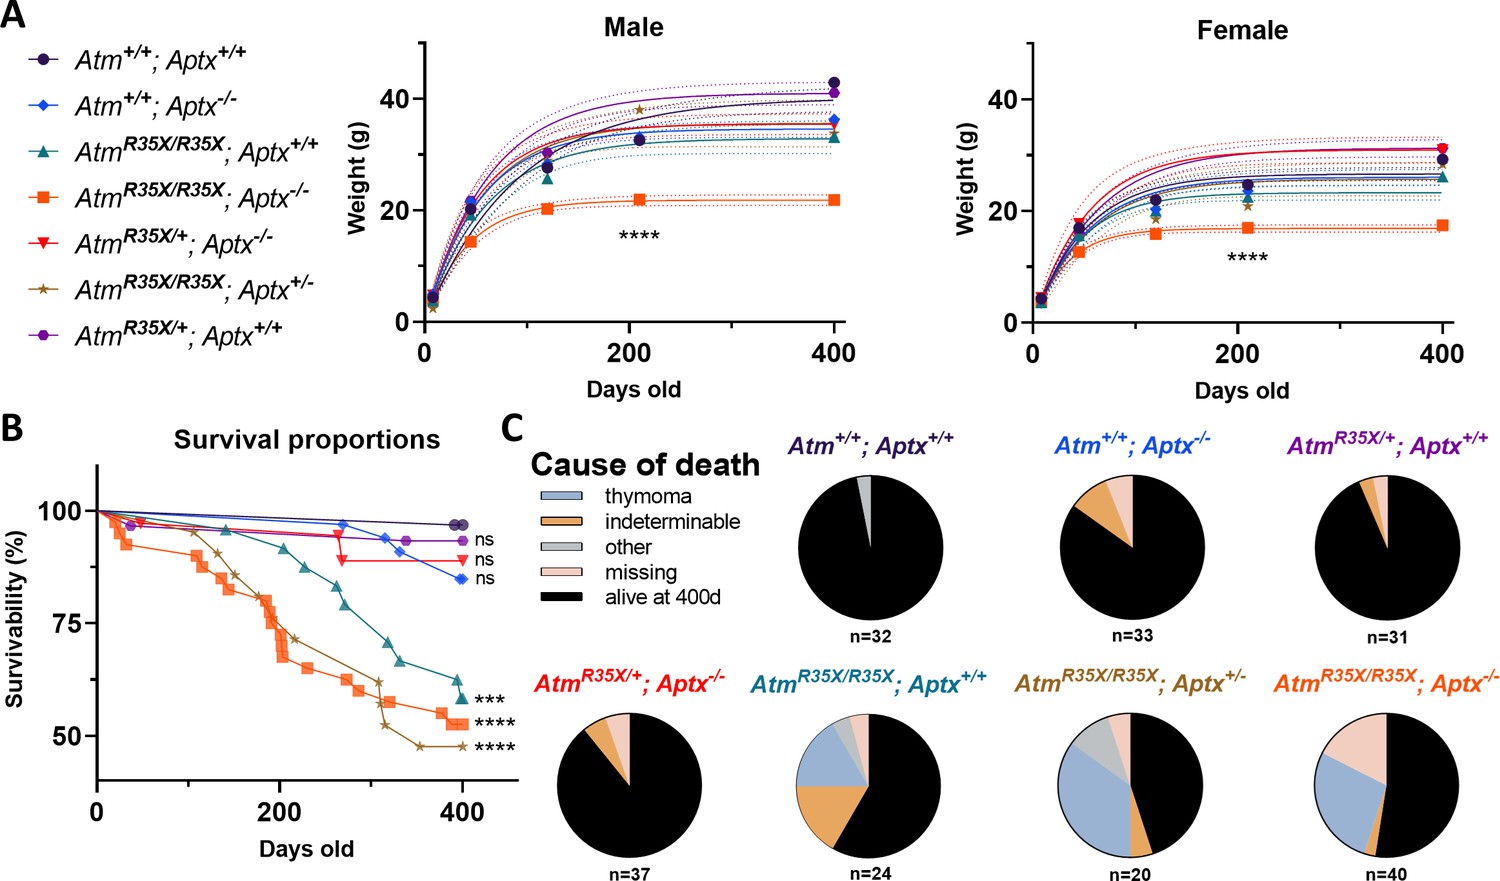
Health and survivability of single and double mutant mice.
(A) Left: The line color and symbol for each genotype are denoted and are consistent across all figures. Right: AtmR35X/R35X; Aptx−/− mice weighed significantly less than all control genotypes as indicated by the growth curves (±95% confidence interval; dotted lines). Growth curve (AtmR35X/R35X; Aptx−/− vs. controls): Male k=0.024 vs 0.011−0.019, Ymax=21.8 vs. 32.9−41.0 g (n=3–18); Female k=0.030 vs. 0.017–0.022, Ymax=16.9 vs 23.3–31.3 (n=2–19). Sum of squares F-test run across all curves: Male F(12, 364)=30.5, p<0.0001, Female F(12, 339)=28.3, p<0.0001. (B) ATM-deficient mice, regardless of APTX expression, displayed significantly lower survivability with ~55% of mice deceased by P400. No statistical differences between ATM-deficient mice were detected. Moreover, a single wild-type copy of the Atm gene was sufficient to prevent premature death (no statistical difference detected between AtmR35X/+; Aptx−/− and Atm+/+; Aptx+/+ mice). Log-rank (Mantel-Cox) tests across all (χ2(6,217)=48.4, p<0.0001), just the ATM-deficient (χ2(2,217)=1.06, p=0.6), and single comparisons to wild-type (see figure) were conducted. Total number of animals indicated in panel (C). (C) Pie charts illustrating that ATM-deficient mice displayed a high prevalence of thymomas based on postmortem necropsies. ‘Other’ probable causes of death included enlarged livers and obstructed kidneys. ‘Missing’ mice were presumed dead and cannibalized by cage mates, cause of death unknown. ATM, Ataxia Telangiectasia mutated.
-
Figure 2—source data 1
Numerical data of weight, age of death, and probable cause of death.
- https://cdn.elifesciences.org/articles/64695/elife-64695-fig2-data1-v2.xlsx
Figure 2—figure supplement 1
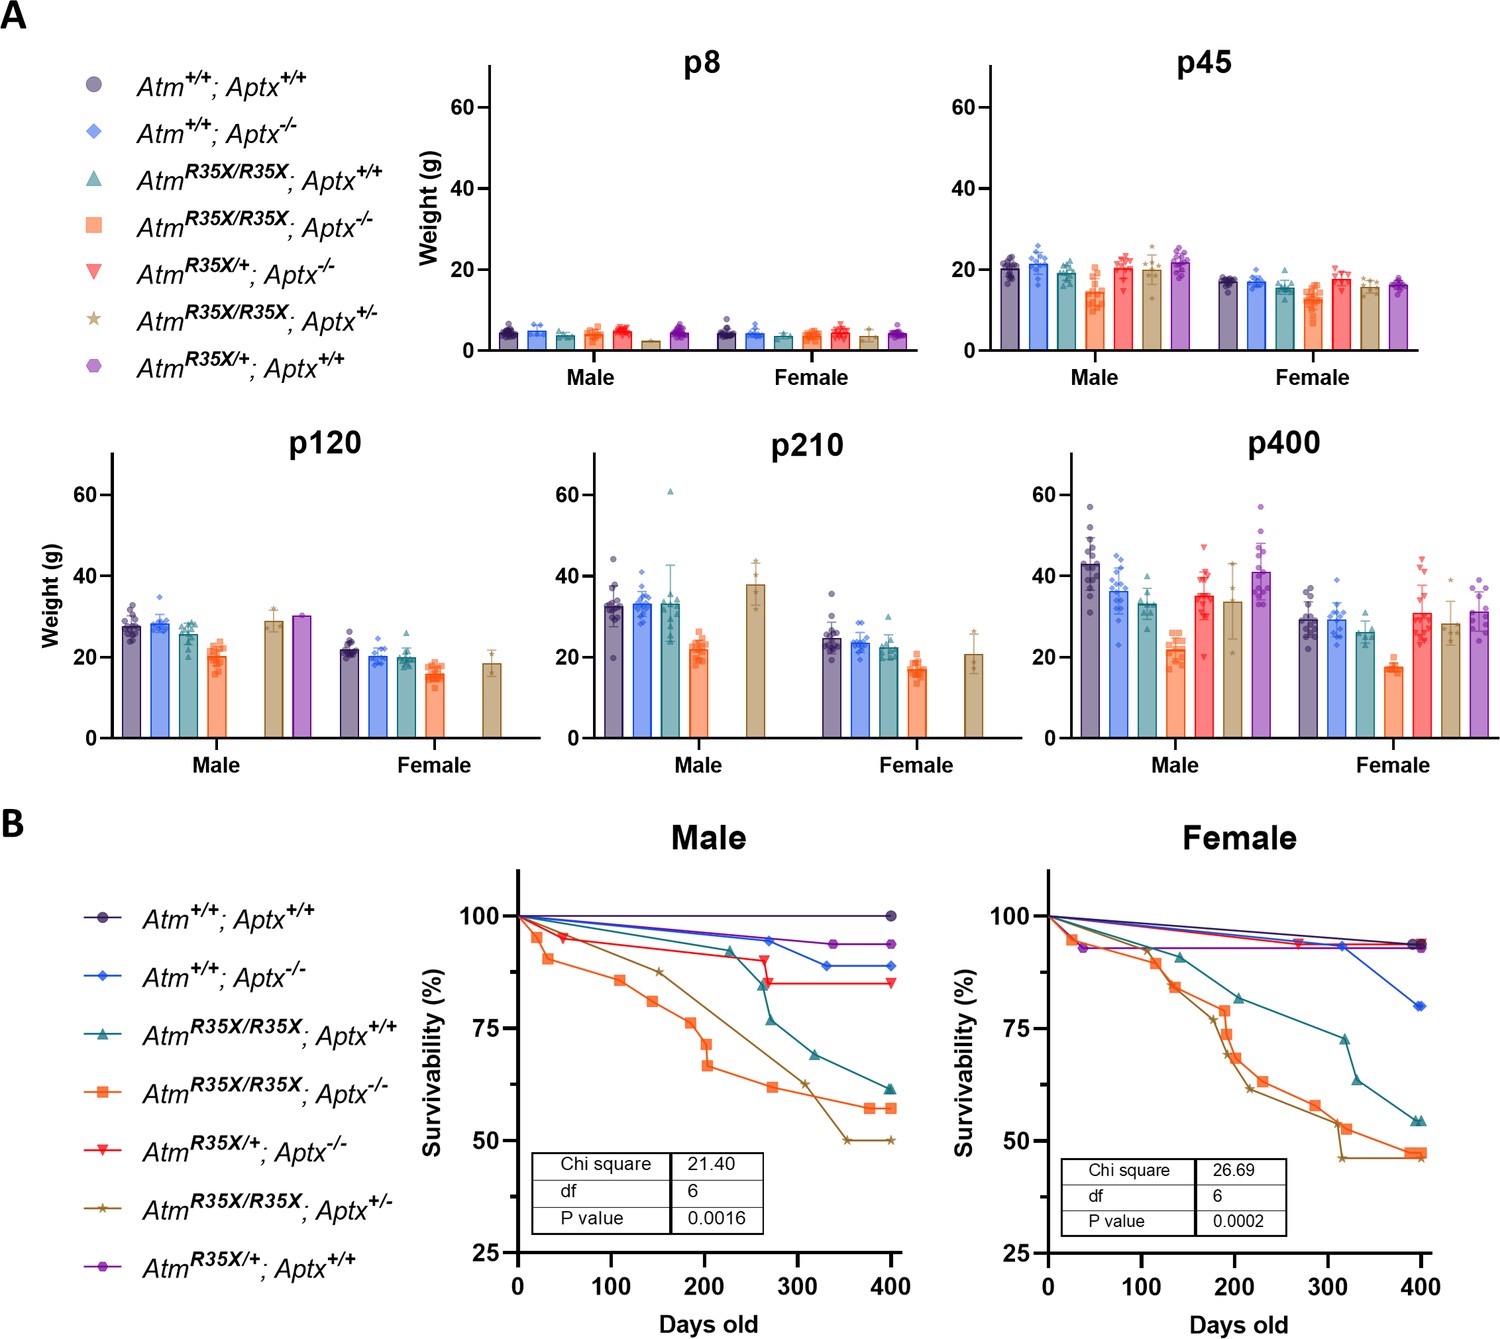
Animal weight for each time point and genotype.
(A) The average weights are plotted for each genotype at each of the indicated time points. Two-way ANOVA with age and genotype as factors excluding the double mutant mice data. Male: F(10, 226)=5.6, p<0.0001; Female: F(10, 197)=7.3, p<0.0001. (B) The survivability of each genotype of mice is plotted for male and female individually.
Figure 3 with 1 supplement
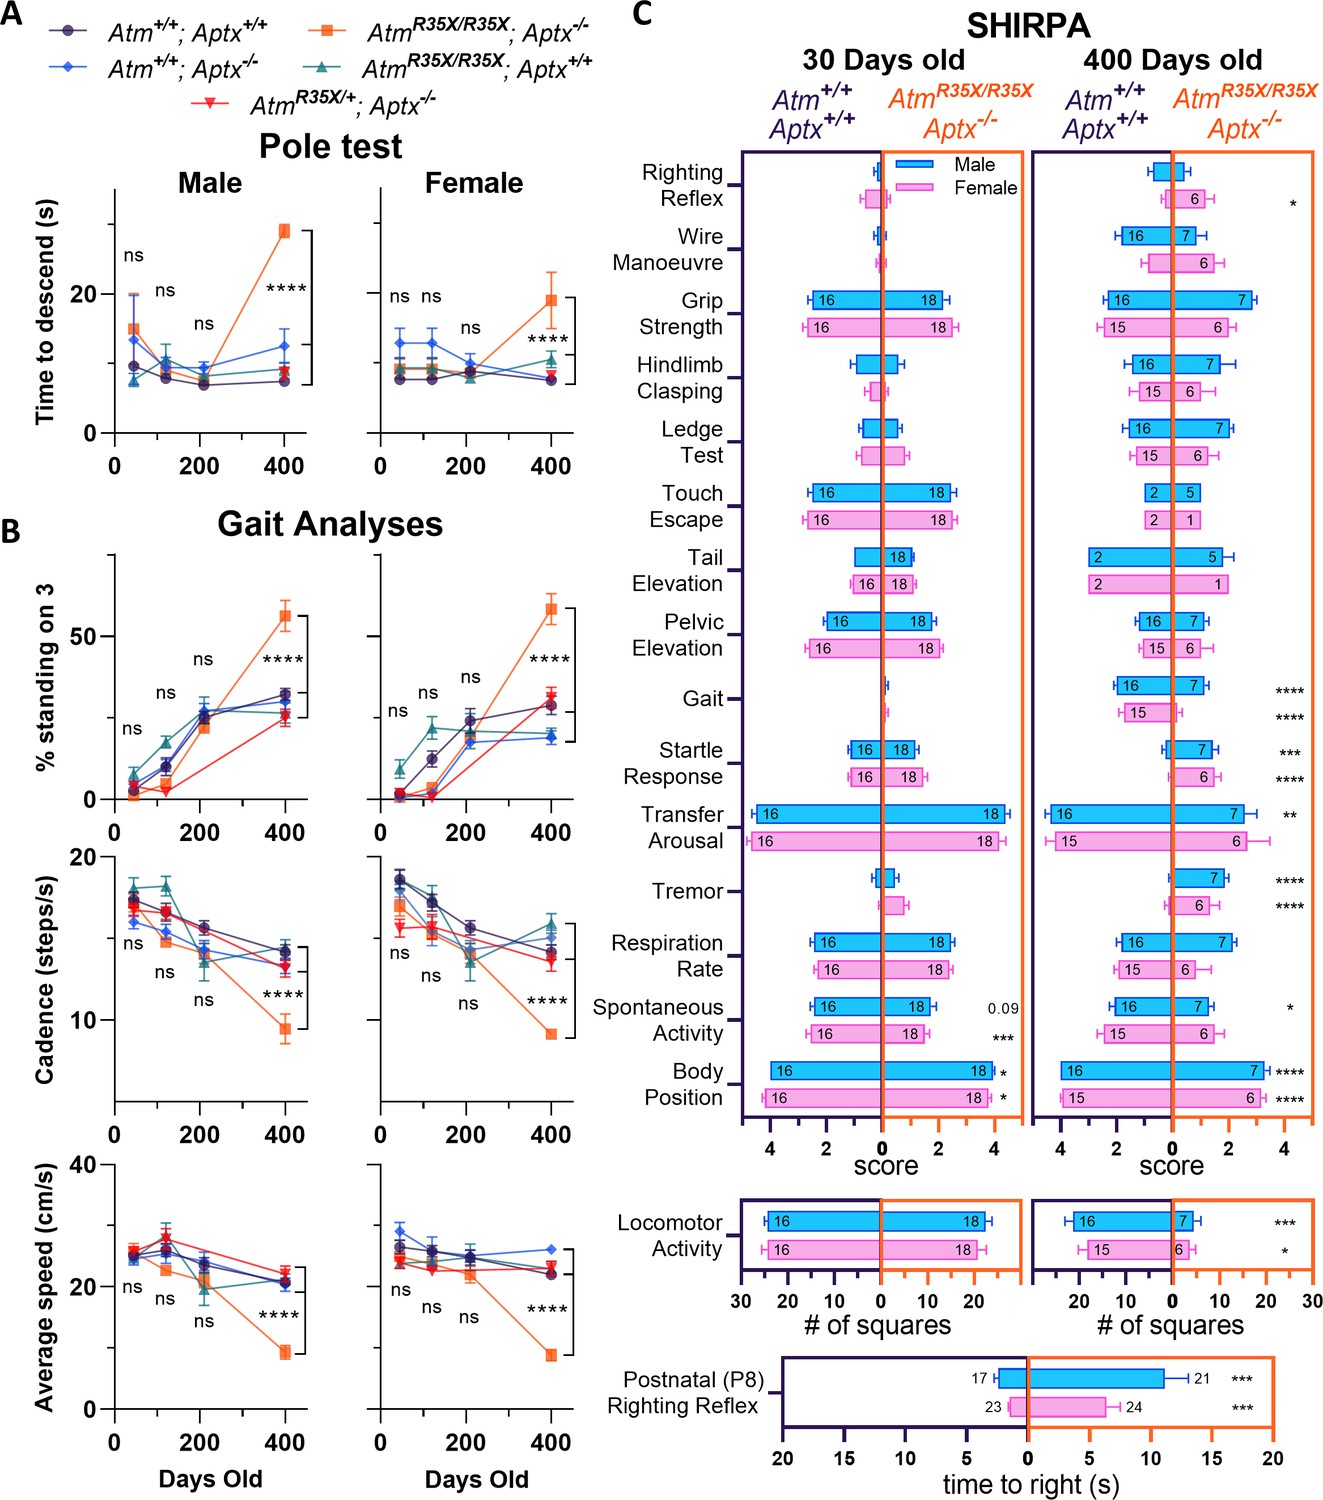
AtmR35X/R35X; Aptx−/− mice develop a progressive loss in motor coordination.
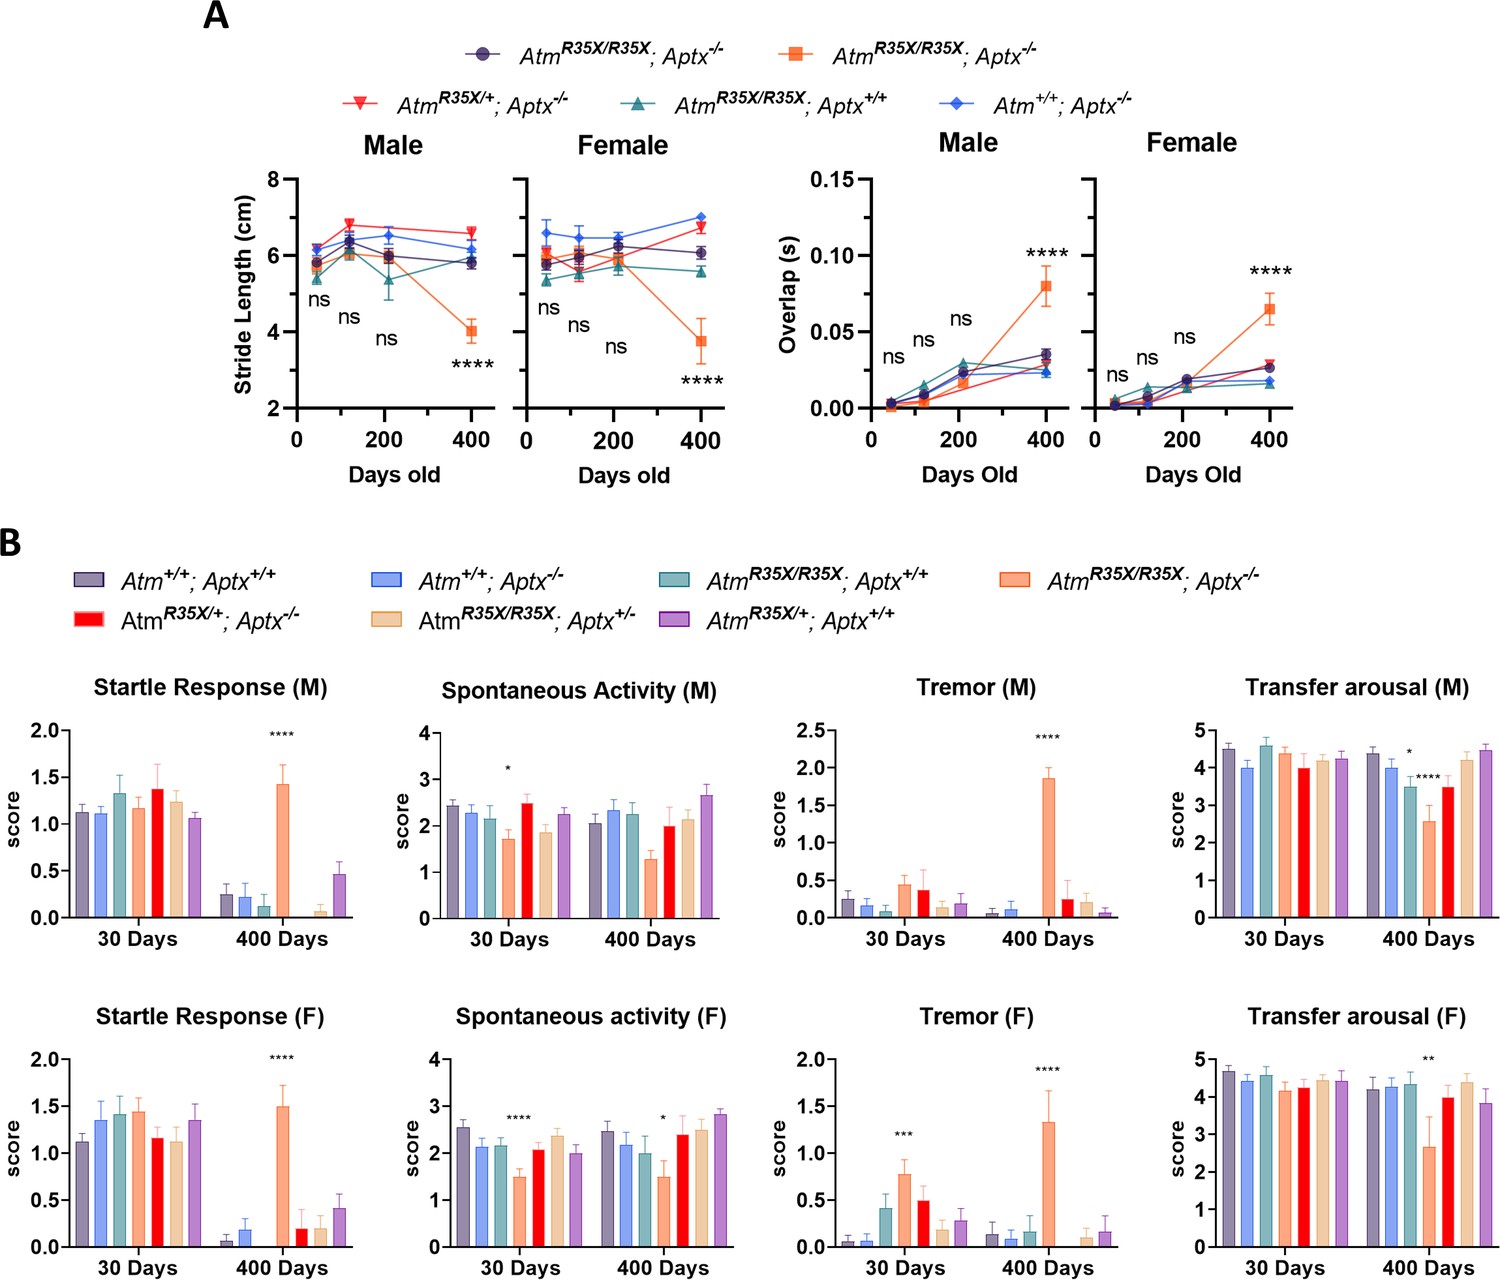
(A) AtmR35X/R35X; Aptx−/− mice take a similar amount of time to descend a vertical pole at P45, P120, and P210, but significantly longer at P400. These overall results were found to be similar for both male (left, n=2–12) and female (right, n=4–12) mice. (B) Consistent with the vertical pole test, the gait of AtmR35X/R35X; Aptx−/− mice measured during ambulation on a Catwalk gait analysis system was significantly different to controls by P400, but not before P210. This includes the percent of time a mouse spends with 3 versus 1, 2, or 4 paws on the ground and the speed and cadence during each run across the platform. The effects of the two null mutations were generally similar between males (left, n=4–21) and females (right, n=3–18). (C) Behavioral data for male (blue) and female (pink) AtmR35X/R35X; Aptx−/− (dark purple, left) and Atm+/+; Aptx+/+ (orange, right) mice are plotted at P30 (left two columns) and P400 (right two columns). Left-right asymmetries of the horizontal bars indicate a difference in performance between genotypes for the behavioral test listed in a column on the far left. A significant difference in the time to right during the righting reflex at P8 was observed in both male and female mice (bottom). (A) and (B) were examined via two-way ANOVA with age and genotype as factors followed by Tukey’s multiple comparison tests between AtmR35X/R35X; Aptx−/− and each of the control genotypes. Behavioral tests in (C) were examined using a non-parametric Kruskal-Wallis followed by Dunn’s multiple comparisons tests. Symbol/color key: Atm+/+; Aptx+/+ (purple circle), Atm+/+; Aptx−/− (blue diamond), AtmR35X/R35X; Aptx+/+ (green triangle), AtmR35X/R35X; Aptx−/− (orange square), AtmR35X/+; Aptx−/− (red inverted triangle).
-
Figure 3—source data 1
Numerical data for animal behavioral assessments.
- https://cdn.elifesciences.org/articles/64695/elife-64695-fig3-data1-v2.xlsx
Figure 3—figure supplement 1
AtmR35X/R35X; Aptx−/− mice develop progressive ataxia.
(A) AtmR35X/R35X; Aptx−/− mice develop an ataxia that at late stages results in a severe loss of coordination and ability to ambulate. (B) Additional gait analyses measuring stride length and time of overlap of the hindlimbs. Examined via two-way ANOVA with age and genotype as factors followed by Tukey’s multiple comparison tests between AtmR35X/R35X; Aptx−/− and each of the control genotypes. (C) Behavioral deficits are seen only in AtmR35X/R35X; Aptx−/− mice across all behavioral tests and sexes. Behavioral tests were examined using a nonparametric Kruskal-Wallis followed by Dunn’s multiple comparisons test.
Figure 4 with 5 supplements
The biophysical properties of PNs are significantly perturbed in AtmR35X/R35X; Aptx−/− mice.
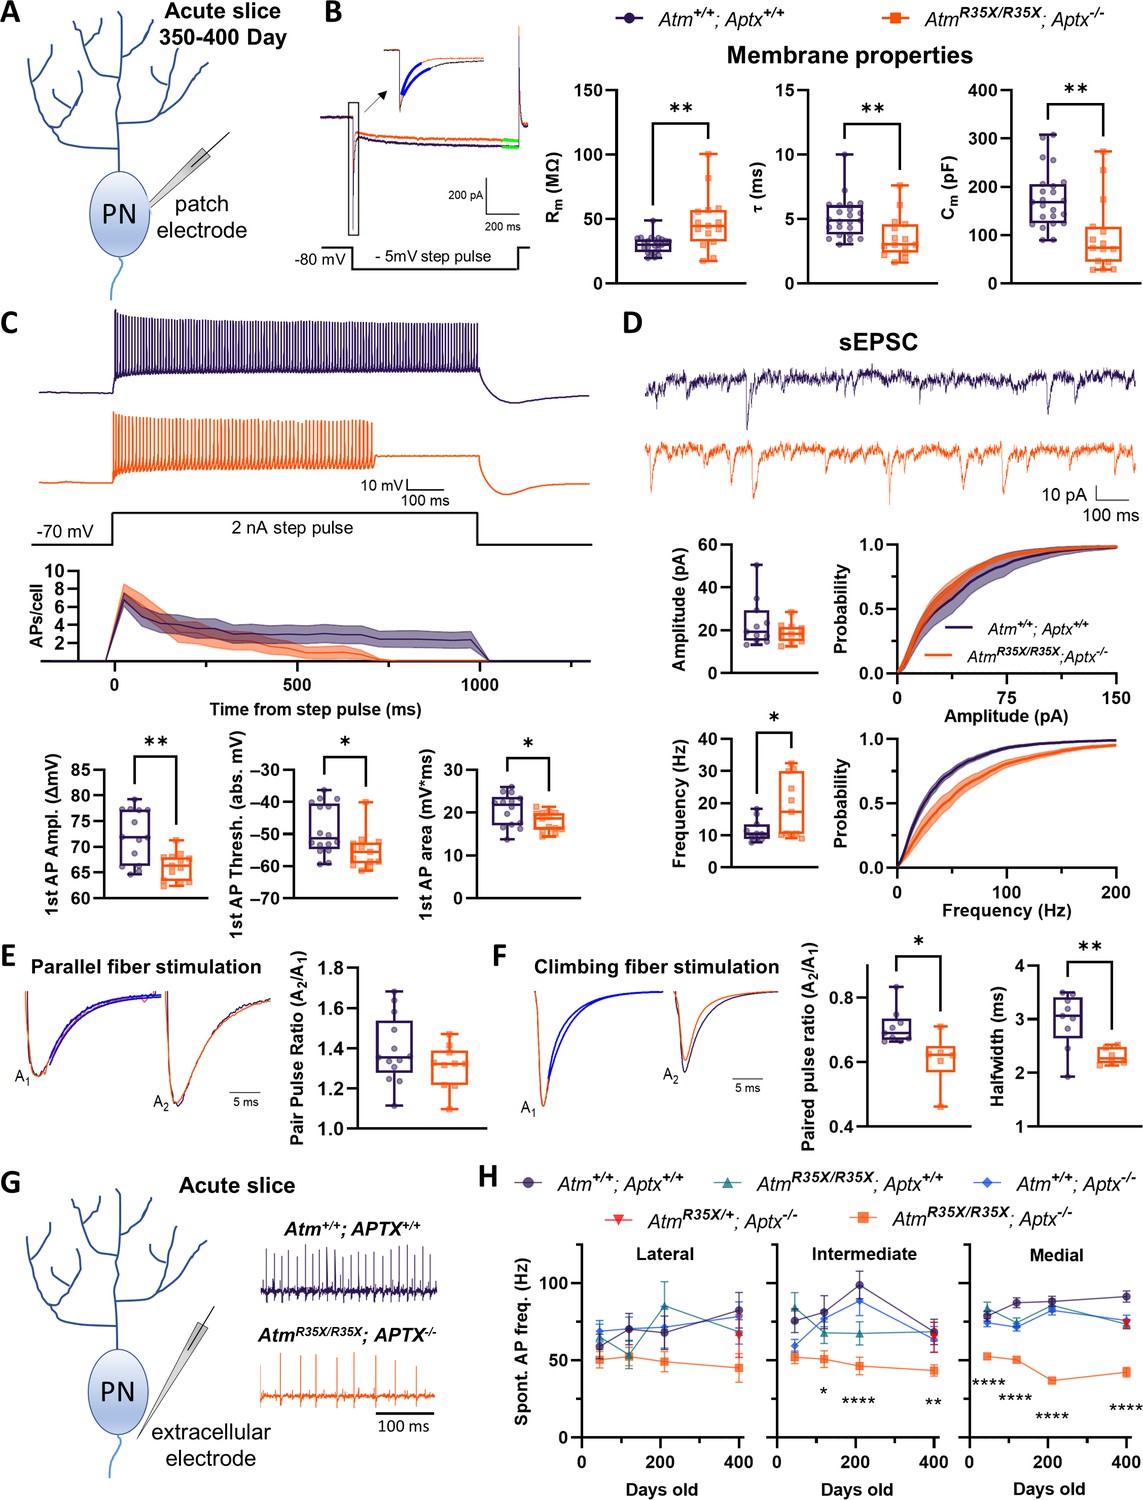
(A) Schematic diagram of intracellular recording from a single Purkinje neuron (PN) in an acute cerebellar tissue slice preparation used to examine their physiological properties. (B) Left: Voltage-clamp measurements of PN membrane properties made from a 1 s, –5 mV step pulse as illustrated. Right: The membrane input resistance (Rm), time constant (τ), and capacitance (Cm) were perturbed in AtmR35X/R35X; Aptx−/− compared to Atm+/+; Aptx+/+ mice. (C) Current-clamp recordings of PN action potentials (APs) after 2 nA step pulses from a –70 mV holding potential. PN APs recorded from AtmR35X/R35X; Aptx−/− fail to maintain constant firing and summary plots show that they have lower 1st AP amplitudes, firing threshold, and area under the curve. (D) Top: Example sEPSC traces taken from a PN under voltage clamp at a –80 mV holding potential. Bottom: Median frequency and amplitude data, along with the overall probability distribution function are plotted for both Atm+/+; Aptx+/+ (n=11) and AtmR35X/R35X; Aptx−/− (n=11) mice. The frequency but not amplitude of PNs recorded in AtmR35X/R35X; Aptx−/− mice was found to be perturbed. (E, F) Left: Example traces of evoked EPSCs recorded from PNs as a result of a two-pulse stimulation (50 ms interval) of either parallel (E) or climbing (F) fiber axons. Traces illustrate the first (A1) and second (A2) amplitude (normalized) and time course of decay (blue fitted line) of each synaptic response. Right: Summary plots of the paired-pulse ratio. While parallel fiber paired-pulse facilitation was normal in AtmR35X/R35X; Aptx−/− mice, climbing fiber paired-pulse depression and halfwidth was significantly perturbed compared to Atm+/+; Aptx+/+ mice. (G) Schematic diagram of extracellular recording from a single PN in an acute cerebellar tissue slice preparation. Example electrophysiological traces for Atm+/+; Aptx+/+ (purple, top) and AtmR35X/R35X; Aptx−/− (orange, bottom) PNs in the medial area (i.e., vermis) of the cerebellum. (H) AtmR35X/R35X; Aptx−/− PN AP firing frequency progressively decreased with age and was significantly slower in comparison to all control genotypes expressing at least one copy of the Atm or Aptx gene [Atm+/+; Aptx+/+ (n=52–59), Atm+/+; Aptx−/− (n=51–64), AtmR35X/R35X; Aptx+/+ (n=39–52), AtmR35X/R35X; Aptx−/− (n=24–71), AtmR35X/+; Aptx−/− (n=69)]. Data in (B) were compared using an ANOVA (Kruskal-Wallis) followed by Dunn’s multiple comparisons test, data in (D–F) were compared via Welch’s t-test, and data in (H) using a two-way ANOVA followed by Holm-Šídák’s multiple comparisons test. Symbol/color key: Atm+/+; Aptx+/+ (purple circle), Atm+/+; Aptx−/− (blue diamond), AtmR35X/R35X; Aptx+/+ (green triangle), AtmR35X/R35X; Aptx−/− (orange square), AtmR35X/+; Aptx−/− (red inverted triangle). sEPSC, spontaneous excitatory postsynaptic current.
-
Figure 4—source data 1
Numerical data of electrophysiological recordings for each panel.
- https://cdn.elifesciences.org/articles/64695/elife-64695-fig4-data1-v2.zip
Figure 4—figure supplement 1
Current versus voltage responses significantly differ between Atm+/+; Aptx+/+ and AtmR35X/R35X; Aptx−/− mice.
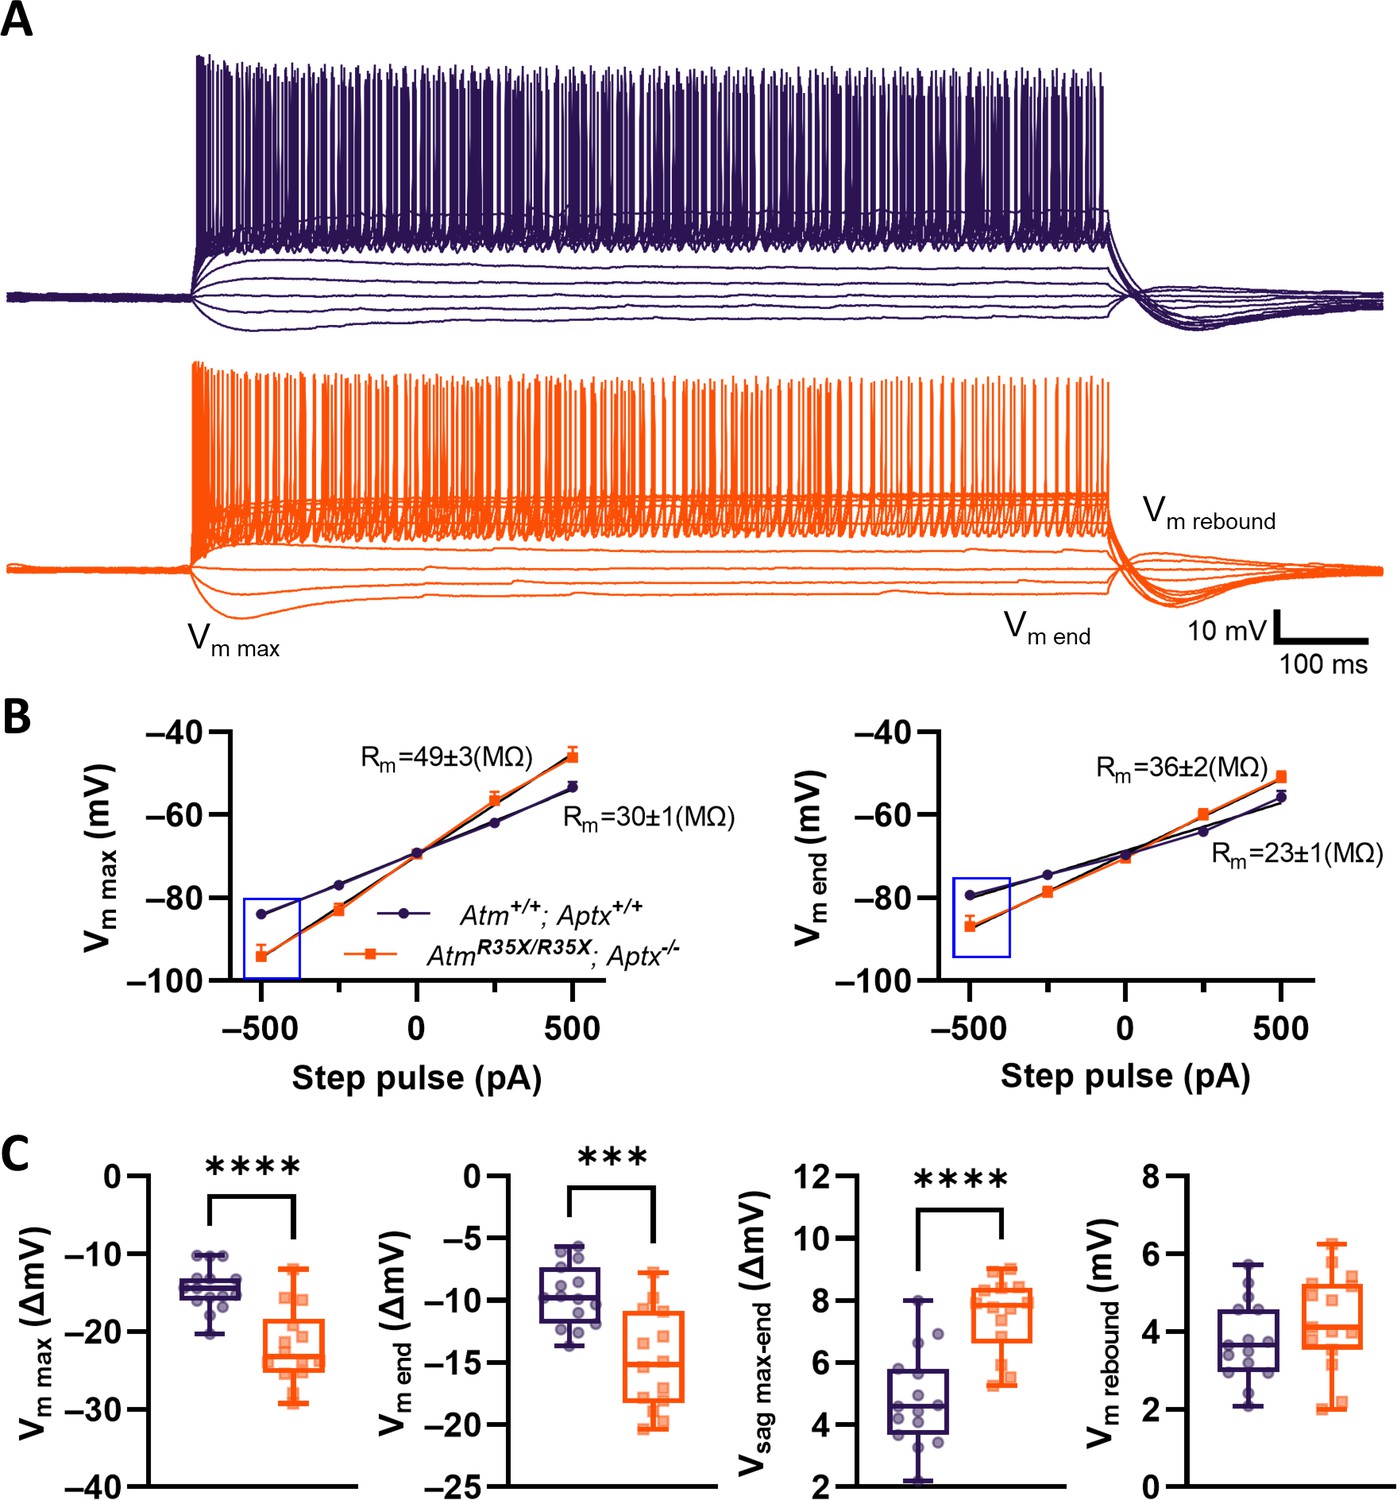
(A) PN voltage responses to various current steps between –500 and 2250 pA (250 pA steps) from a –70 mV holding current in Atm+/+; Aptx+/+ (top, purple) and AtmR35X/R35X; Aptx−/− (bottom, orange) mice. (B) I‒V curves calculated from either max deflection (Vm max) or steady state (Vm end) for Atm+/+; Aptx+/+ (purple) and AtmR35X/R35X; Aptx−/− (orange) mice. (C) Various measurements of the voltage response to –500 pA step pulse (blue box in B) in Atm+/+; Aptx+/+ (purple) and AtmR35X/R35X; Aptx−/− (orange) mice. Significance was tested using a non-parametric Mann-Whitney test. PN, Purkinje neuron.
Figure 4—figure supplement 2
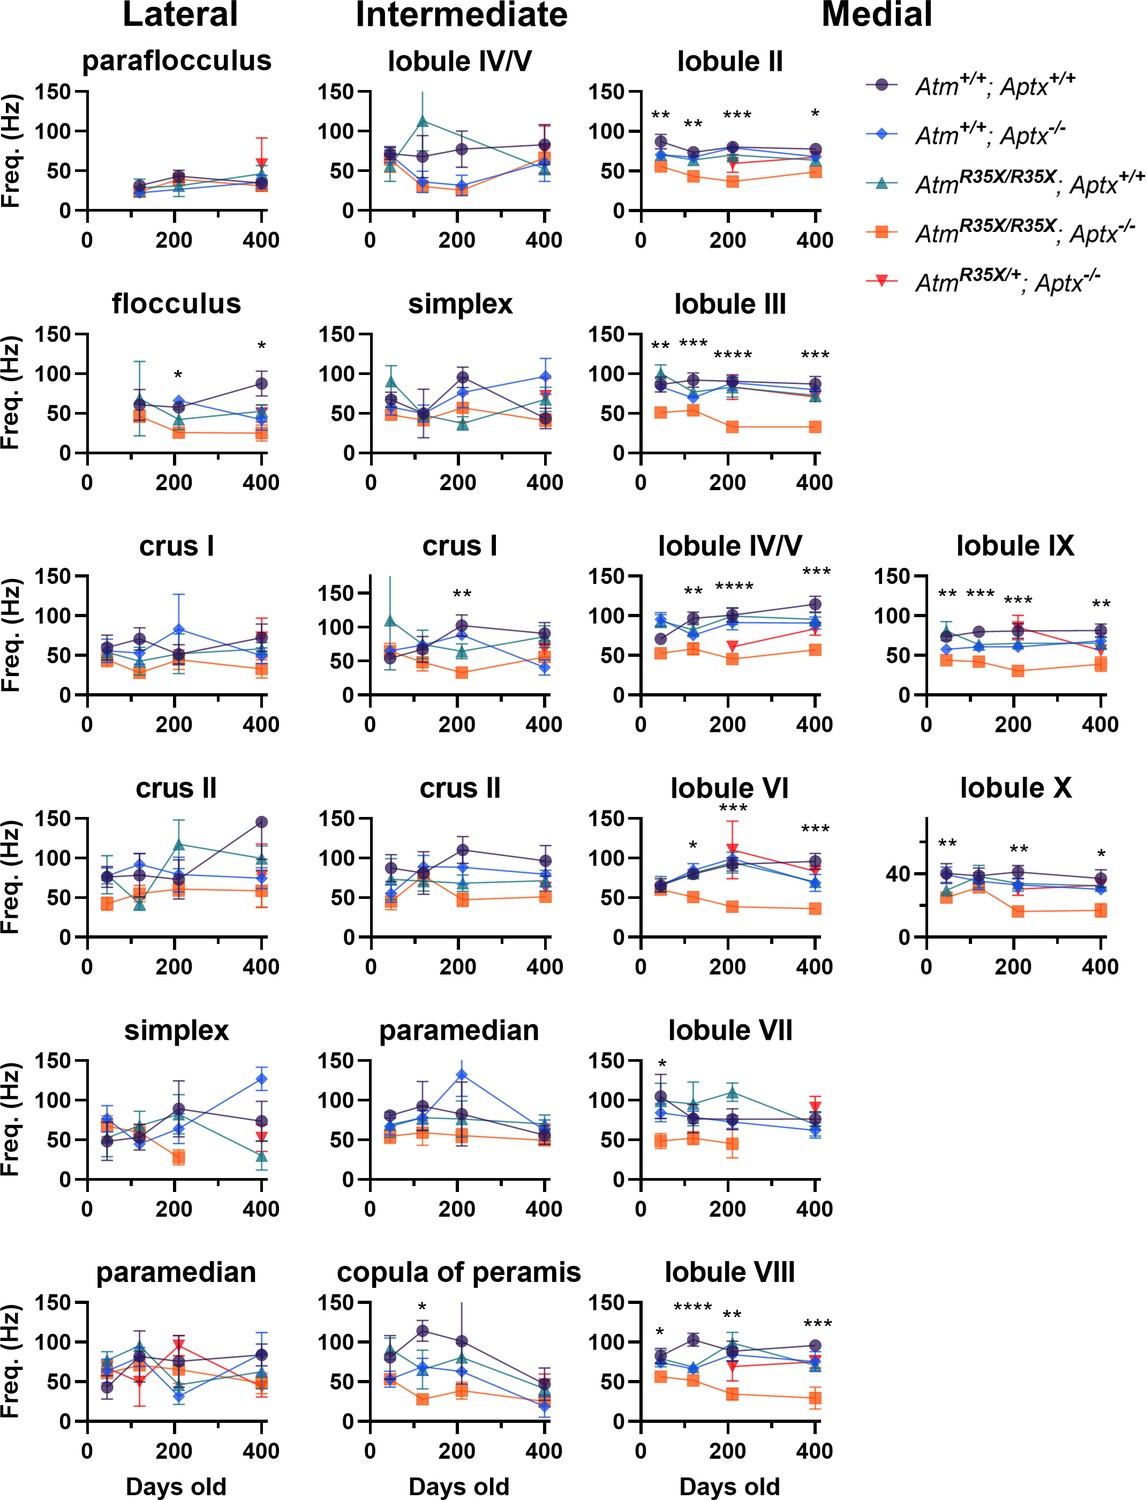
Mean PN firing frequency across the cerebellum.
Average PN firing frequency (Hz) is plotted across the indicated locations at P45, P120, P210, and P400. Significance tested via two-way ANOVA with age and genotype as factors. PN, Purkinje neuron.
Figure 4—figure supplement 3
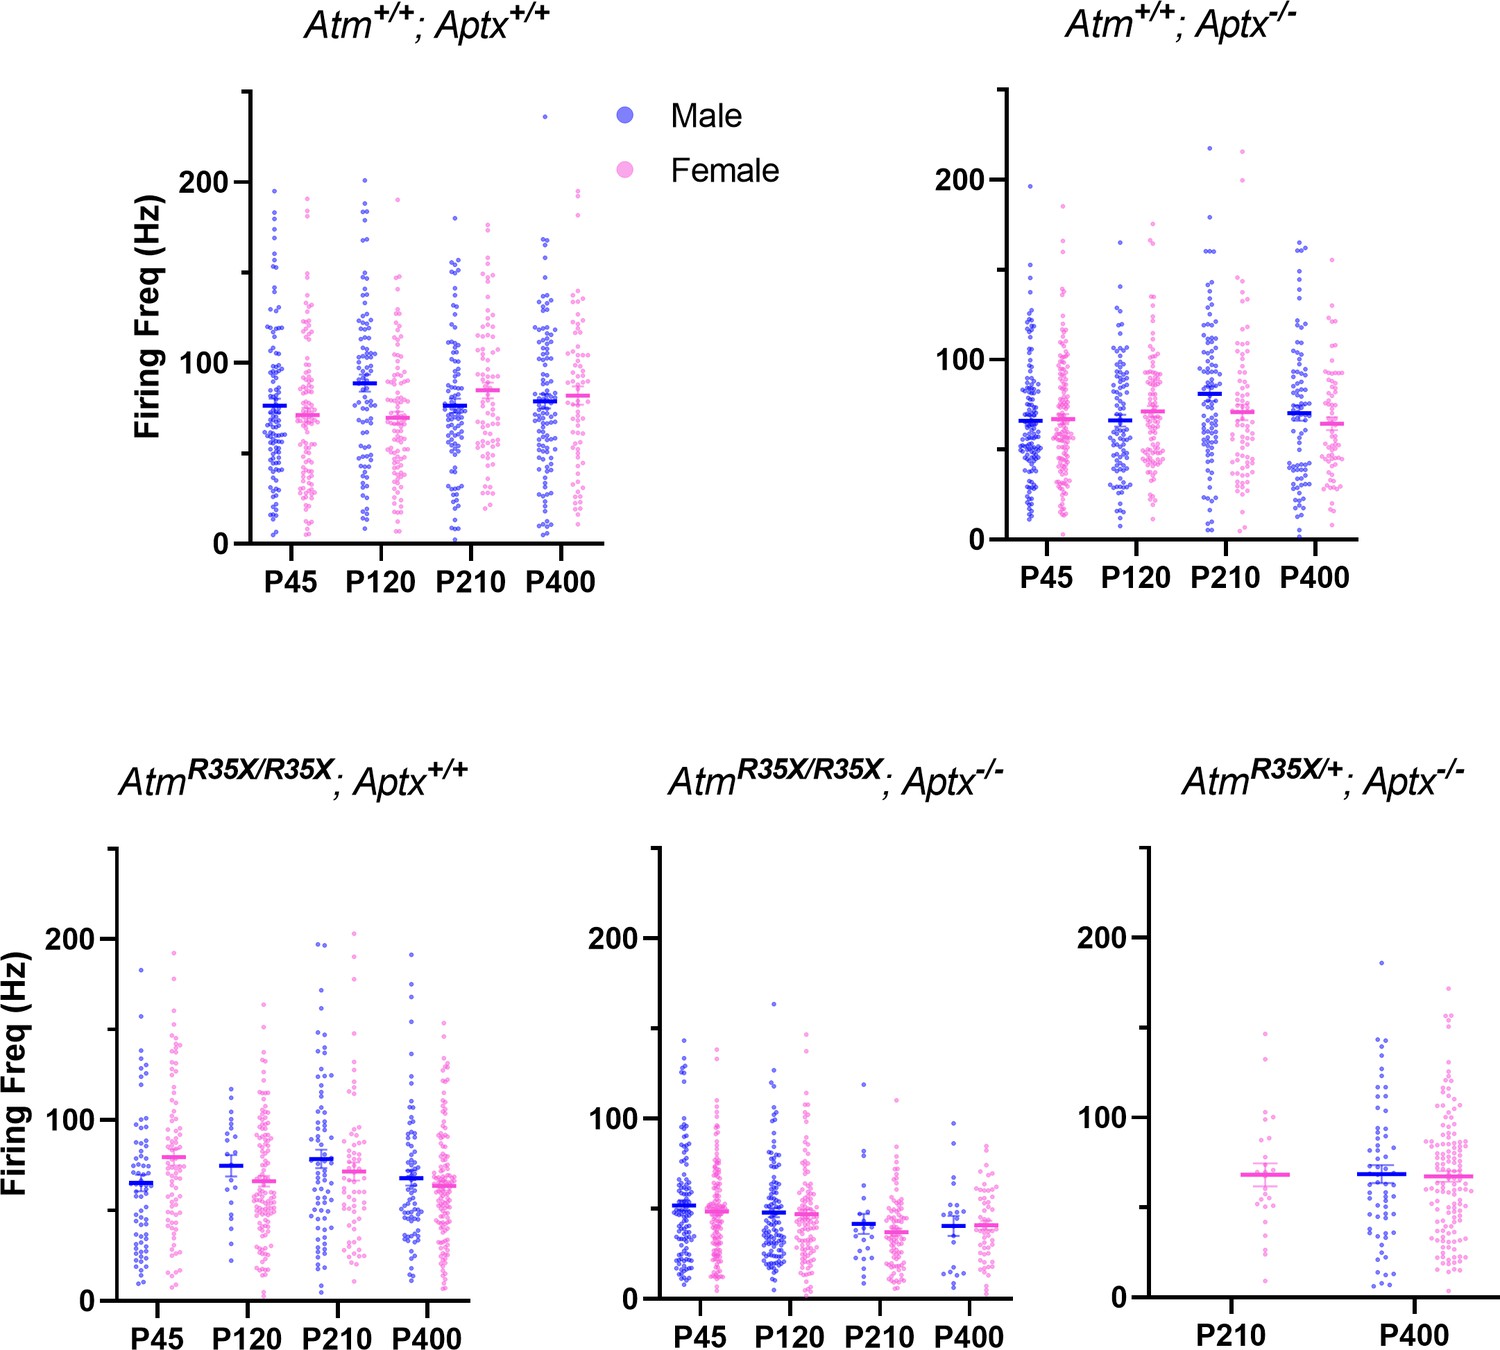
Mean PN firing frequency across genotype and sex.
Average PN firing frequency (Hz) for all cells recorded from male and female mice is plotted for the indicated genotype. No significant differences were observed between sex. Two-way ANOVA with age and sex as factors, Atm+/+; Aptx+/+ (F(1, 751)=1.15, p=0.3), Atm+/+; Aptx−/− (F(1, 797)=1.10, p=0.3), AtmR35X/R35X; Aptx+/+ (F(1, 630)=0.17, p=0.7), AtmR35X/R35X; Aptx−/− (F(1, 666)=1.10, p=0.4), t-test for P400 AtmR35X/+; Aptx−/− (p=0.9). PN, Purkinje neuron.
Figure 4—figure supplement 4
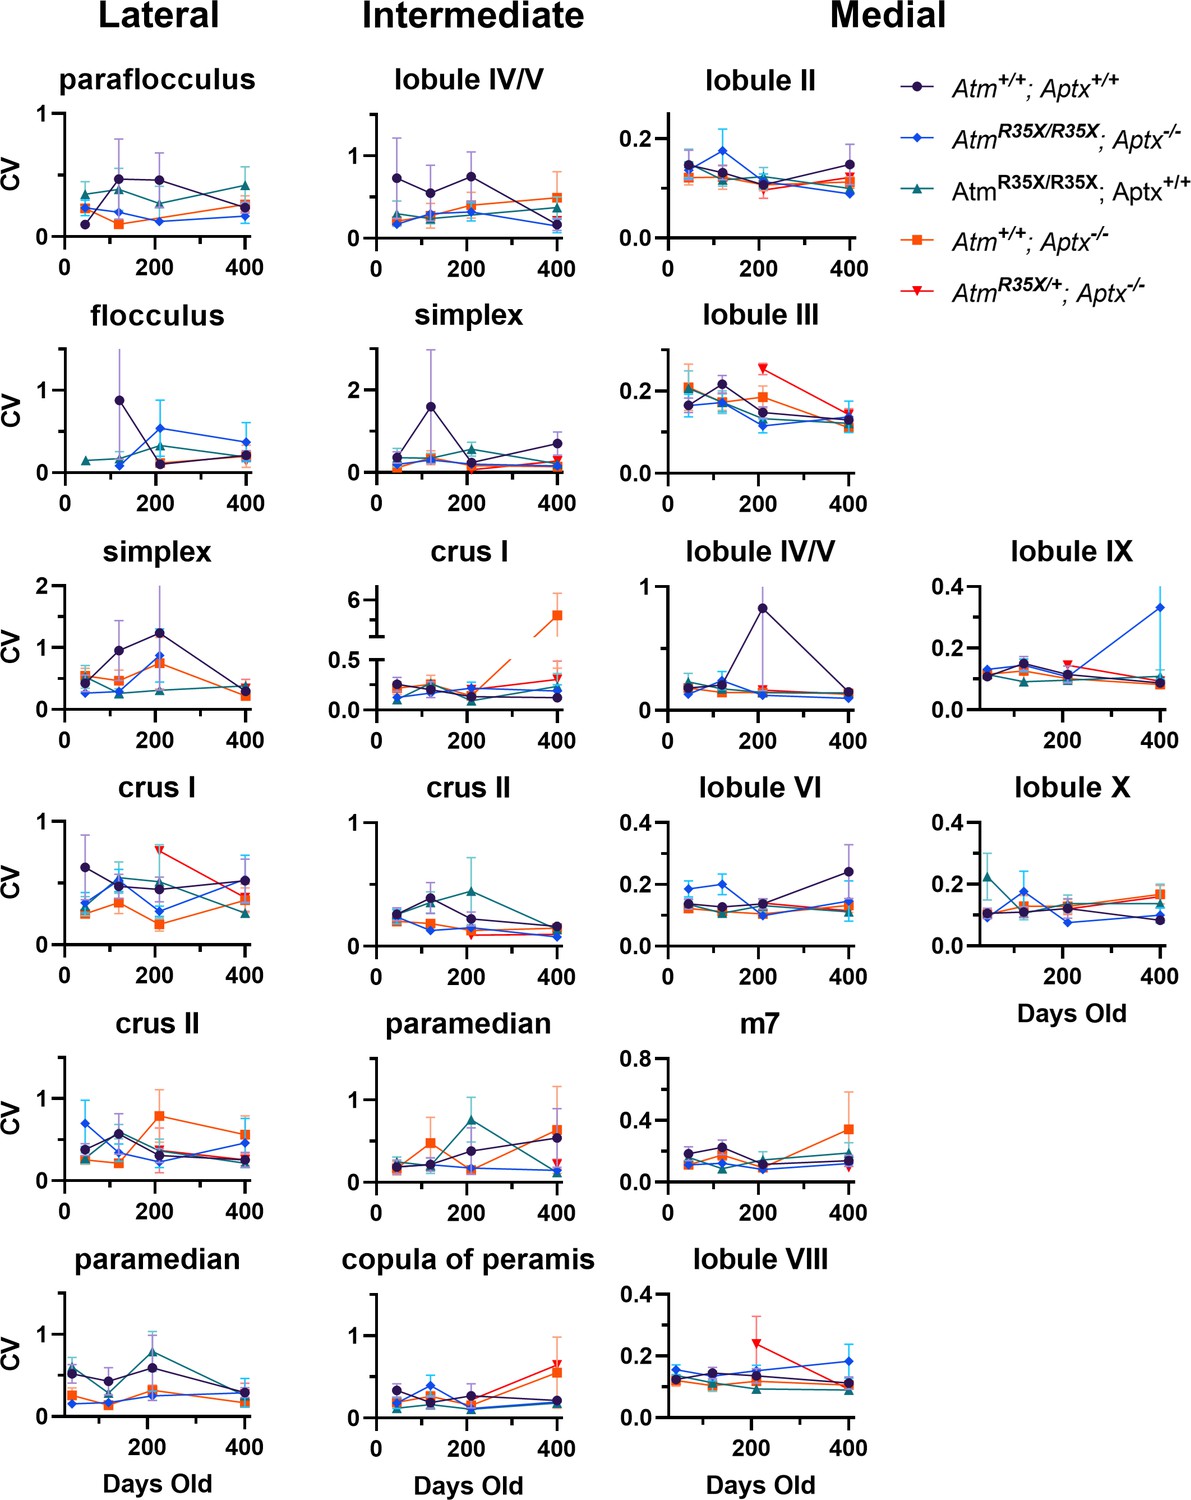
Coefficient of variation (CV) of PN firing frequency across the cerebellum.
Average CV of PN firing frequency is plotted across the indicated locations at P45, P120, P210, and P400. No significant differences (p<0.5) were detected across all areas using two-way ANOVA with age and genotype as factors. PN, Purkinje neuron.
Figure 4—figure supplement 5
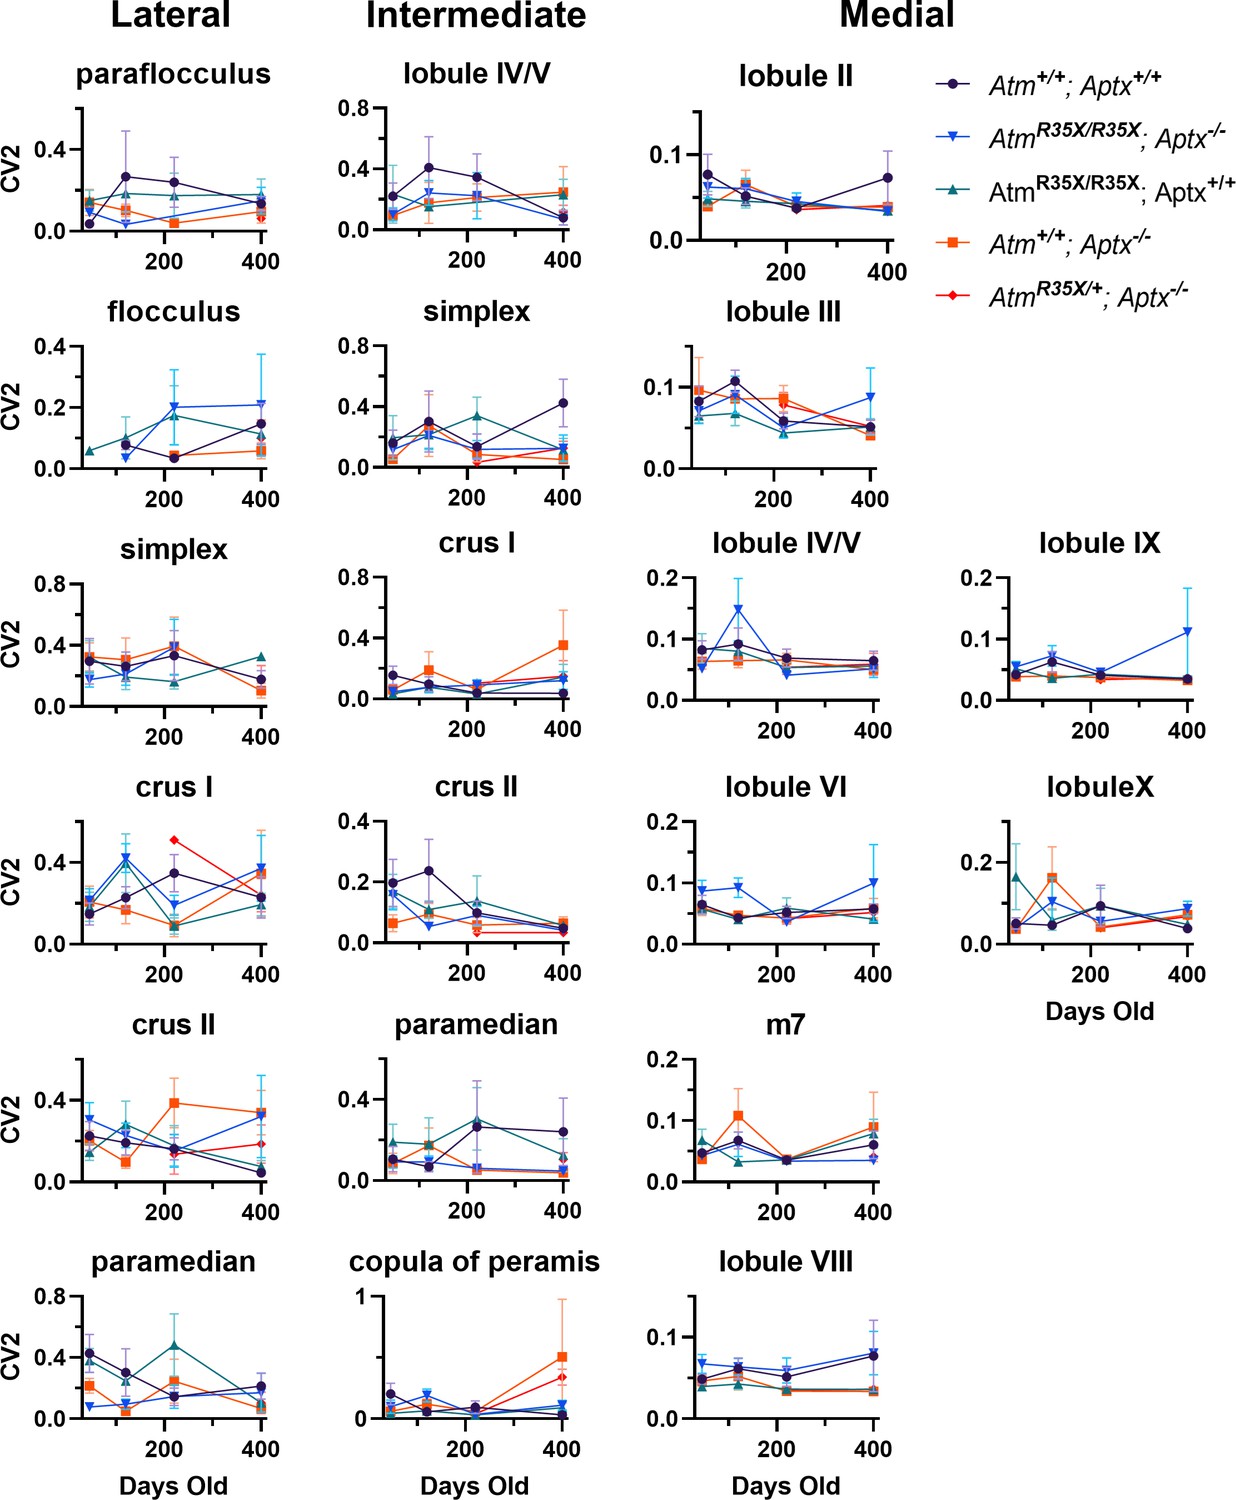
Mean variation between PN firing intervals across the cerebellum.
Average CV2 of PN firing frequency is plotted across the indicated locations at P45, P120, P210, and P400. No significant differences (p<0.5) were detected across all areas using two-way ANOVA with age and genotype as factors. PN, Purkinje neuron.
Figure 5 with 2 supplements
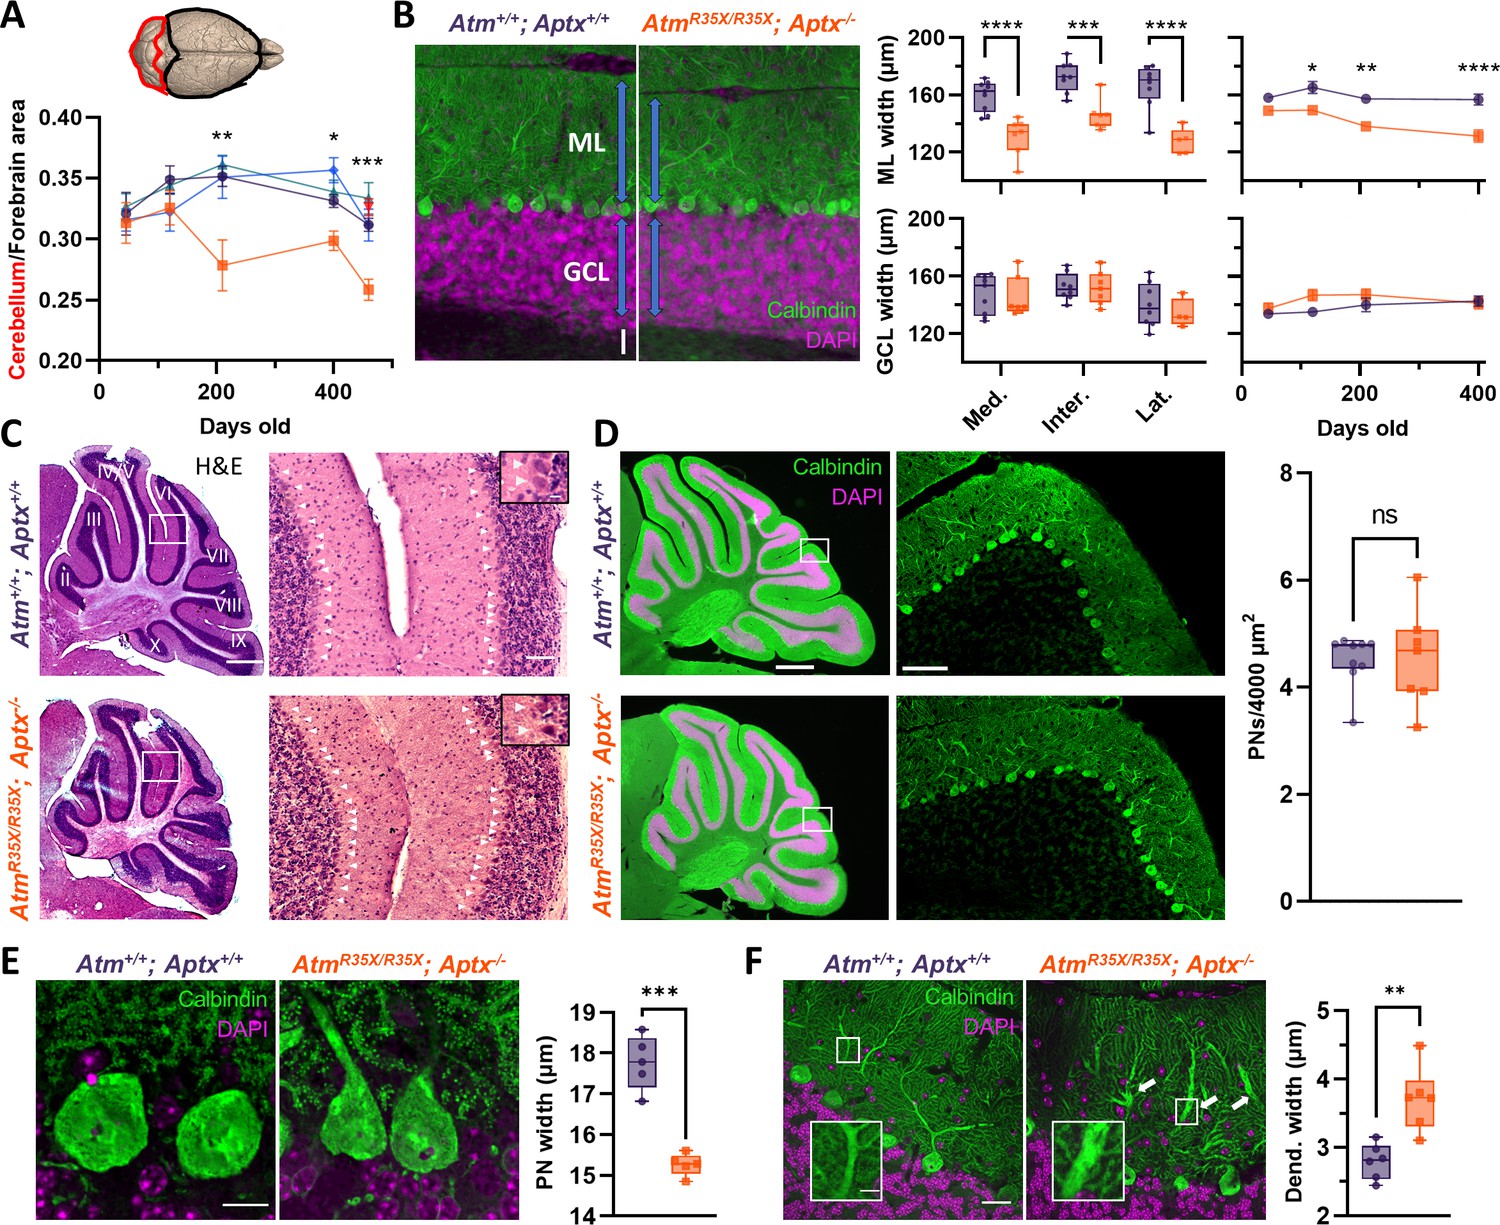
Cerebellar atrophy is associated with a progressive reduction in molecular layer (ML) width and pathological changes in PN morphology but not PN cell death.
(A) Cartoon image of the brain highlighting the dorsal forebrain and cerebellar surface. Area estimates from dorsal images of the brain were used to determine the cerebellum to forebrain ratio allowing us to control for any differences in overall size of the brain. We found the cerebellum decreased in size over age in AtmR35X/R35X; Aptx−/− (n=5–10), but not control mice (Atm+/+; Aptx+/+ [n=4–20], Atm+/+; Aptx−/− [n=4–12], AtmR35X/R35X; Aptx+/+ [n=6–16], AtmR35X/+; Aptx−/− [n=6]). (B) Left: Immunofluorescent images of parasagittal cerebellar sections illustrating the length (blue arrows) of PN dendrites in the ML (green) and width of the granule cell layer (GCL; magenta) in Atm+/+; Aptx+/+ and AtmR35X/R35X; Aptx−/− mice (P400; medial cerebellar lobule VIII). Scale bar=50 μm. Middle: Summary graphs of ML and GCL width measurements averaged across all lobules in sections from the medial, intermediate, and lateral parts of the cerebellum (P400). Right: Average ML and GCL widths at different ages in the medial cerebellum (n=5–7). (C) Left: H&E stained, parasagittal cerebellar sections from P400 Atm+/+; Aptx+/+ (top) and AtmR35X/R35X; Aptx−/− (bottom) mice. Scale bar=500 μm Right: Magnified view (from white box) of PNs (white triangles) in cerebellar lobules 4/5 and 6. Scale bar=50 μm, inset 10 μm Right: The average density of PNs across all lobules in the medial cerebellum of Atm+/+; Aptx+/+ (n=9) and AtmR35X/R35X; Aptx−/− (n=7) P400 mice do not differ. (D) Left: Whole cerebellar, fluorescent images and magnified view of folia VIII (from white box). Scale bar=500 μm left, 75 μm right. Right: Average density of Calbindin positive PNs across the whole cerebellum (n=7–9). (E) Left: Optically sectioned fluorescent images illustrate the smaller size of PNs in AtmR35X/R35X; Aptx−/− mice. Right: Plot of the average width of PN somas randomly sampled from across the cerebellum (n=5). Scale bar=10 μm. (F) Left: Images like in (E). Abnormally large caliber PN dendrites (inset) were observed in AtmR35X/R35X; Aptx−/− mice (P400; medial cerebellar lobule VI). Scale bar=25 μm main, 5 μm inset. Right: Average width of primary and secondary PN dendrites measured at the midline between the PN cell bodies and ML edge in Atm+/+; Aptx+/+ and AtmR35X/R35X; Aptx−/− mice (n=6). Statistical significances were assessed via two-way ANOVA with age and genotype as factors followed by Holm-Šídák (A and B right) or Šídák (B middle) pairwise multiple comparisons test. Welch’s t-test used in (D–F). PN, Purkinje neuron.
-
Figure 5—source data 1
Numerical data for histology.
- https://cdn.elifesciences.org/articles/64695/elife-64695-fig5-data1-v2.zip
Figure 5—figure supplement 1
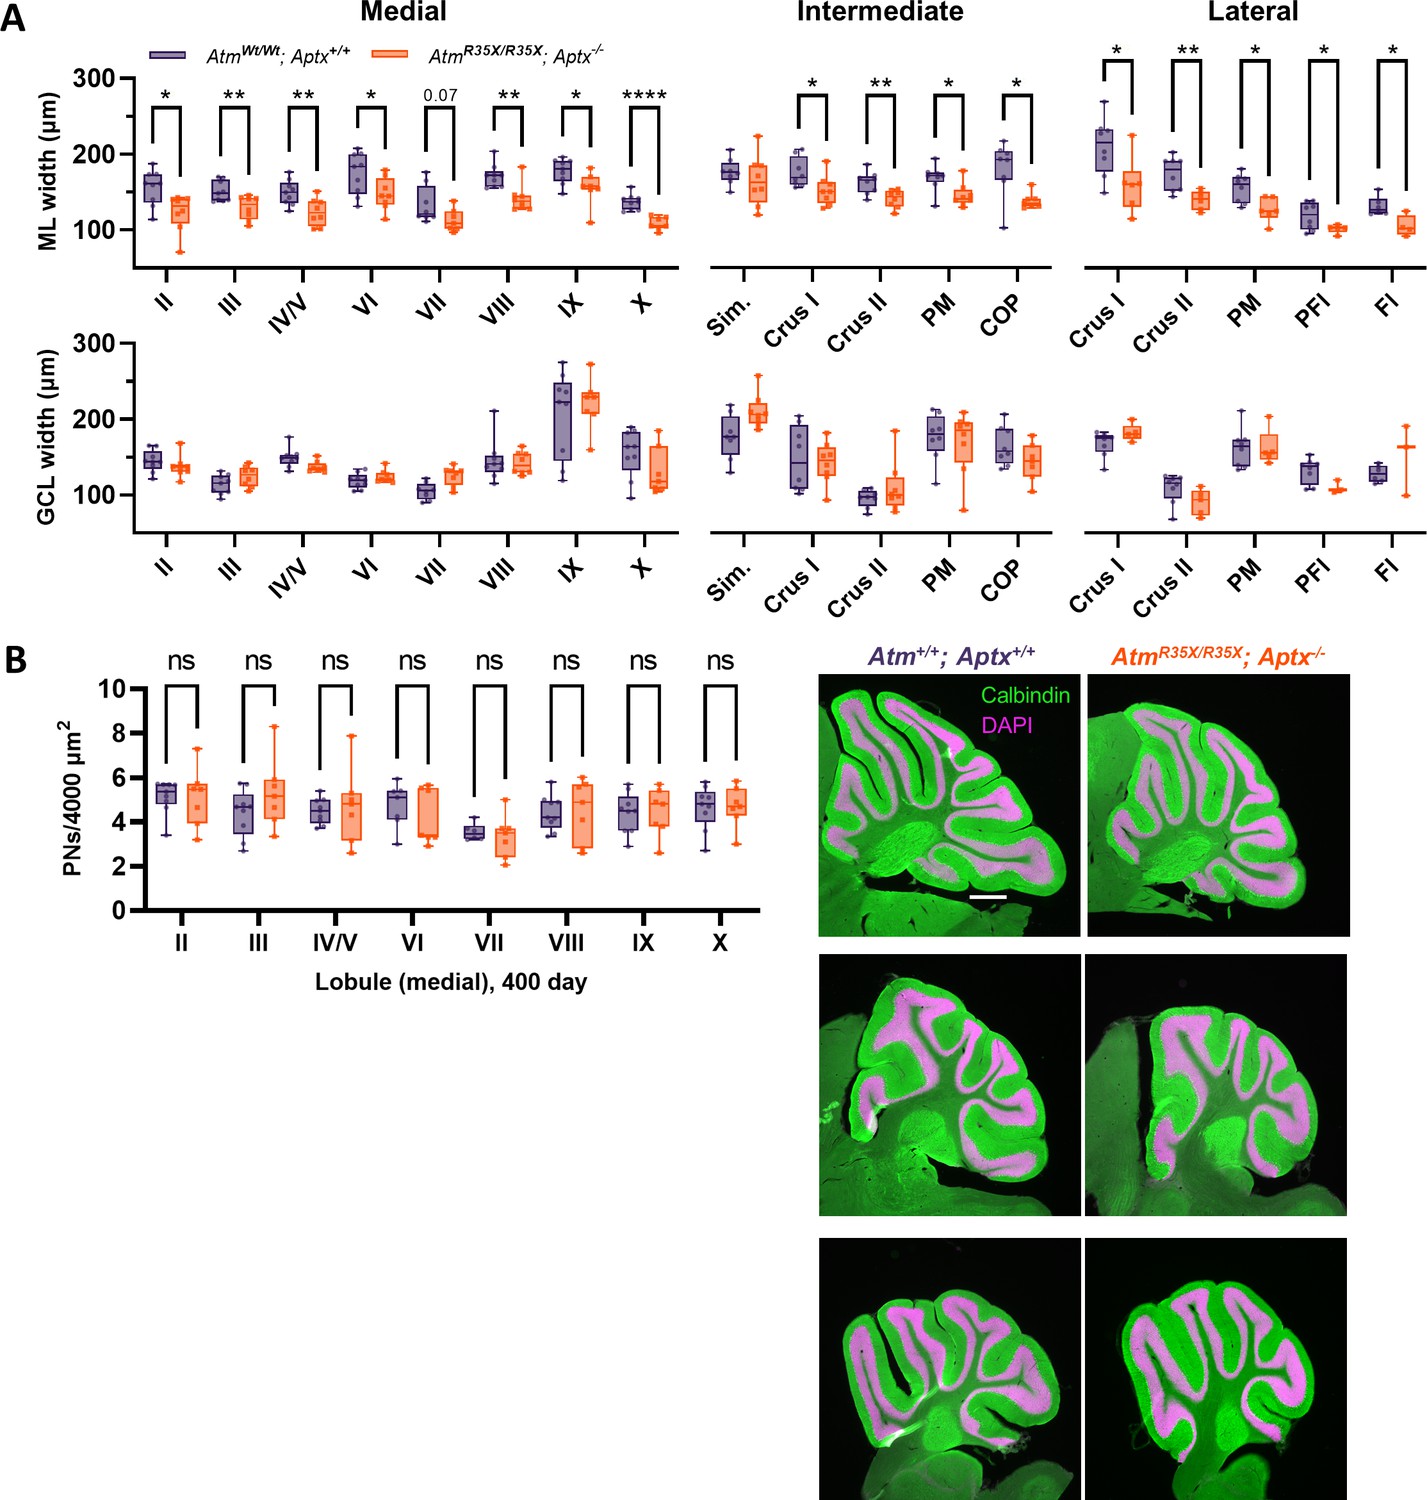
Decreased molecular layer (ML) width but not cell death is a key feature of the A-T model.
(A) Width measurements of the molecular layer and granule cell layer—ML and GCL, respectively—for each lobule across the medial intermediate and lateral areas of the cerebellum. (B) Left: Summary plot indicates no significant differences in PN density were observed across each lobule in Atm+/+; Aptx+/+ (n=9) and AtmR35X/R35X; Aptx−/− (n=7) mice. Right: Images of parasagittal cerebellar sections from medial (top), intermediate (middle), and lateral (bottom) cerebellum. Scale bar=500 μm Statistical significances were assessed via two-way ANOVA with age and genotype as factors followed by Šídák post comparison test. PN, Purkinje neuron.
Figure 5—figure supplement 2

Cerebellar degeneration in the A-T model is not associated with micro glial activation or cell death markers but is associated with significant swelling of PN dendrites.
(A) Fluorescent images of anti-microglial activation (CD68) staining in Atm+/+; Aptx+/+, AtmR35X/R35X; Aptx−/−, and a positive control for cerebellar degeneration (mouse model of MPS III; deficient in N-acetyl-alpha-glucosaminidase (Naglu)) (Li et al., 1999).
Figure 6

T-cell deficits are found in the blood of AtmR35X/R35X; Aptx−/− mice.
(A) Representative flow cytometric profiles of T-cell glycoprotein marker CD3 and summary plots indicate ATM- and/or APTX-deficient mice have decreased proportions of CD3+ T-cells in the blood. (B) Representative flow cytometric profiles of T-cell glycoprotein markers CD4 and CD8 gated on CD3+ cells and summary plots for CD8 and CD4 single positive cell proportions. ATM-deficient mice had reduced CD4+ proportions compared to mice with at least one copy of the Atm gene. Statistical significances were assessed via one-way ANOVA followed by Tukey’s pairwise multiple comparisons test. Number of animals denoted at bottom of bar. Symbol/color key: Atm+/+; Aptx+/+ (purple circle), AtmR35X/R35X; Aptx+/+ (green triangle), AtmR35X/+; Aptx−/− (red inverted triangle), AtmR35X/R35X; Aptx−/− (orange square). ATM, Ataxia Telangiectasia mutated.
-
Figure 6—source data 1
Table of numerical FACs data for blood samples.
- https://cdn.elifesciences.org/articles/64695/elife-64695-fig6-data1-v2.xlsx
Figure 7
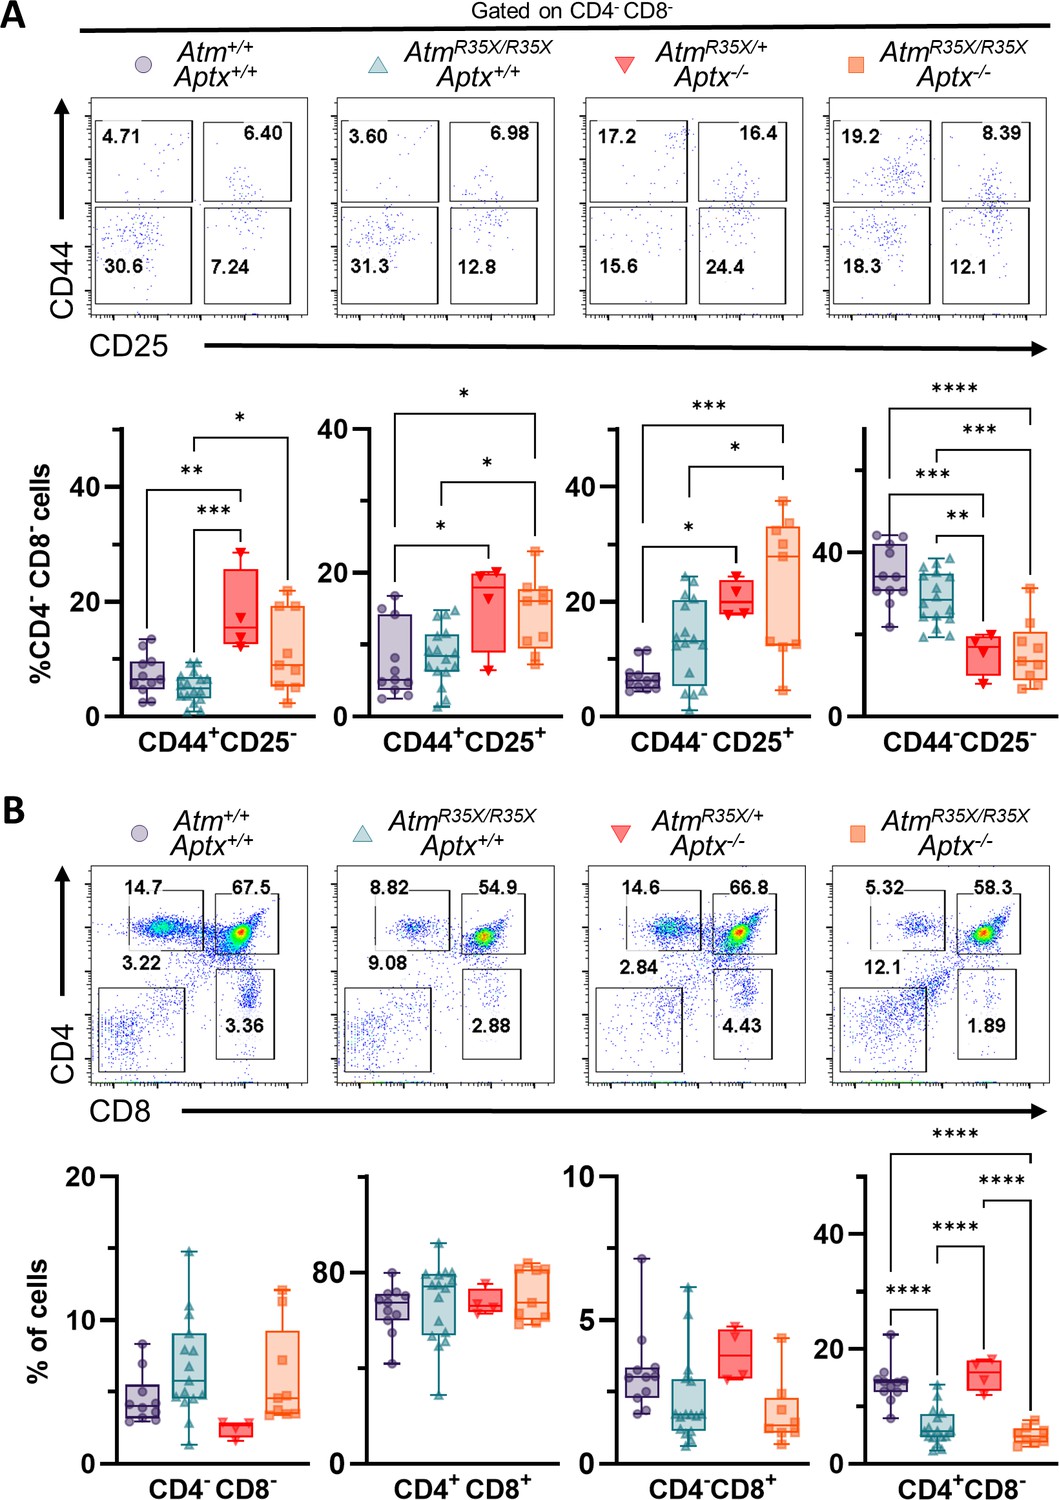
ATM and APTX deficiency confer deficits in T-cell expression, but at different developmental stages.
(A) Representative flow cytometric profiles of T-cell glycoprotein markers CD44 and CD25 gated on CD4−CD8− double negative (DN) cells. Summary plots show proportions of thymocytes at DN stages 1–4 (left to right). APTX deficient mice display increased proportions for DN1–3 and decreased proportion at DN4 consistent with a deficit in ontogeny from DN3 to DN4. (B) Representative flow cytometric profiles of T-cell glycoprotein markers CD4 and CD8 gated. ATM-deficient mice display decreased proportions for CD4 and CD8 single positive cells consistent with a deficit in ontogeny from CD4+CD8+ double positive to CD4+ and CD8+ single positive fates. Statistical significances were assessed via one-way ANOVA followed by Tukey’s pairwise multiple comparisons test. Number of animals denoted at bottom of bars. Symbol/color key: Atm+/+; Aptx+/+ (purple circle), AtmR35X/R35X; Aptx+/+ (green triangle), AtmR35X/+; Aptx−/− (red inverted triangle), AtmR35X/R35X; Aptx−/− (orange square).
-
Figure 7—source data 1
Table of numerical FACs data for thymus samples.
- https://cdn.elifesciences.org/articles/64695/elife-64695-fig7-data1-v2.xlsx
Figure 8
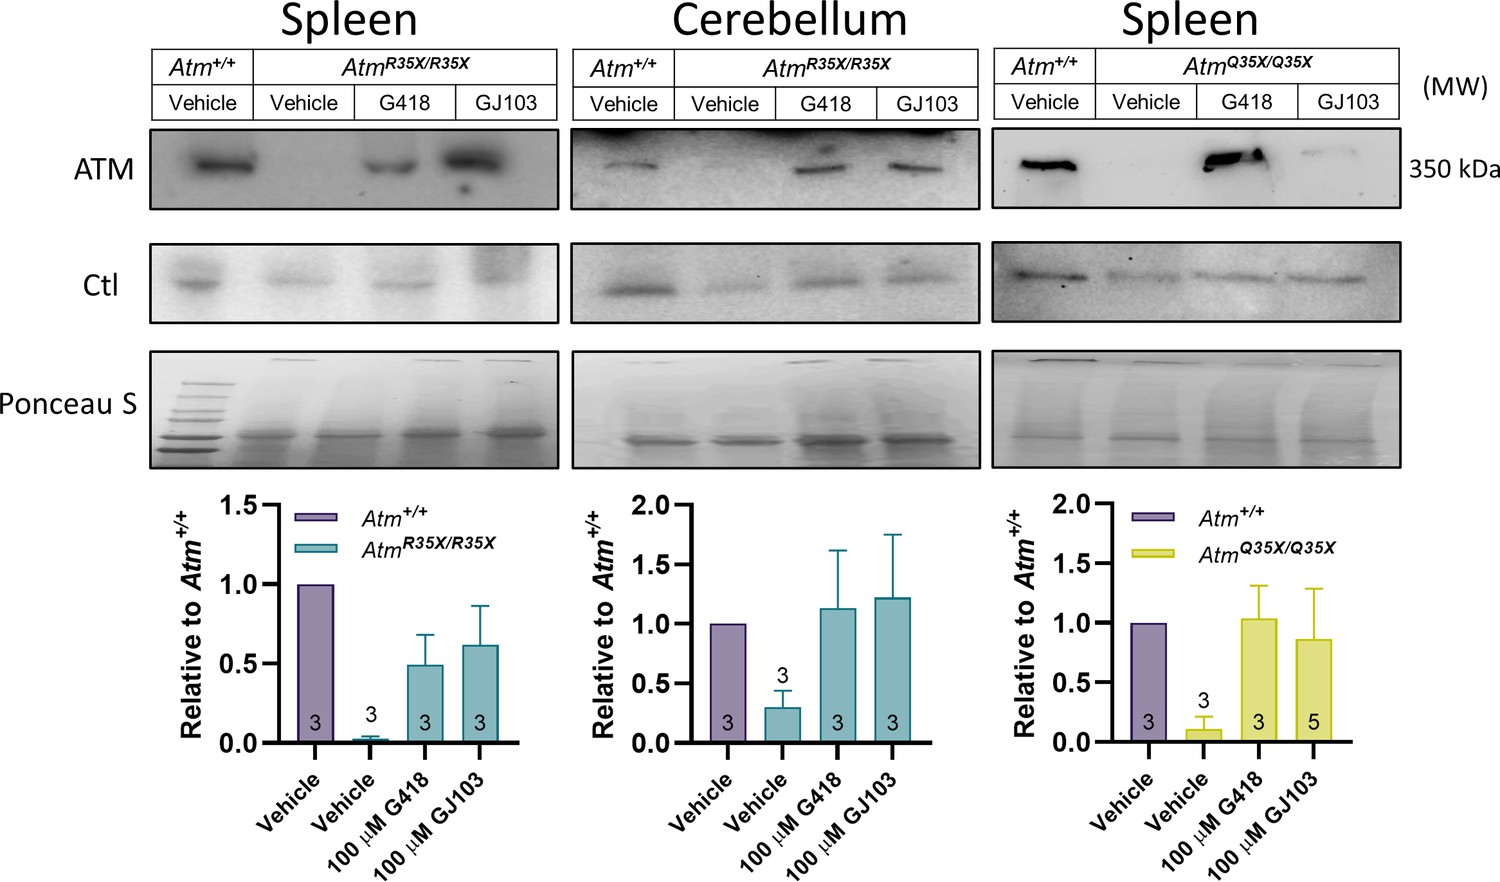
ATM protein expression is restored after read-through compound exposure in explant tissues from AtmR35X/R35X and AtmQ35X/Q35X mice.
Spleen and cerebellar explant tissue from AtmR35X/R35X and AtmQ35X/Q35X mice were treated with vehicle, the read-through compounds G418 (100 µM) or GJ103 (100 µM) for 72 hr. ATM immunoblots show recovery of ATM (MW 350 kDa) production in both the spleen and cerebellum. Equal loading was assessed via housekeeping genes (Actin or GAPDH) and ponceau staining. ATM, Ataxia Telangiectasia mutated.
-
Figure 8—source data 1
Original blots and numerical data.
- https://cdn.elifesciences.org/articles/64695/elife-64695-fig8-data1-v2.zip
Videos
Video 1
Pole test—Atm+/+ versus AtmR35X/R35X; AtmR35X/R35X do not display an ataxic phenotype at P460.
Video 2
Pole test—Aptx+/+ versus Aptx−/−; Aptx−/− mice do not display an ataxic phenotype at P460.
Video 3
Pole test—Atm+/+; Aptx+/+ versus AtmR35X/R35X; Aptx−/−. AtmR35X/R35X; Aptx−/− display considerable motor disability at P460.
Video 4
Open field—Atm+/+; Aptx+/+ versus AtmR35X/R35X; Aptx−/−. AtmR35X/R35X; Aptx−/− display a clear inability to ambulate in the open field at P460.
Tables
Key resources table
| Reagent type (species) or resource | Designation | Source or reference | Identifiers | Additional information |
|---|---|---|---|---|
| Strain, strain background (Mus musculus) | AtmR35X, AtmTm1.1(103CAG)TGAMfgc | This paper | 103C>T mutation, human exon replacement | Generated by Hicks laboratory. Has been backcrossed into C57b/6 9 times. Contact pmathews@lundquist.org |
| Strain, strain background (M. musculus) | AtmQ35X, AtmTm1.1(103C)TMfgc | This paper | 103C>T mutation, targeted premature termination signal in the mouse codon | Generated by Hicks laboratory. Has been backcrossed into C57b/6 9 times. Contact pmathews@lundquist.org |
| Strain, strain background (M. musculus) | Aptx−/− | Ahel et al., 2006 | MGI Cat# 3687171, RRID:MGI:3687171 | Contact peter.mckinnon@stjude.org |
| Gene (M. musculus) | Atm | MGI | MGI:107202; C030026E19Rik; ENSMUSG00000034218 | |
| Gene (Homo Sapien) | ATM | OMIM | OMIM: 607585 MGI: 107202 HomoloGene: 30952; ENSG00000149311 | |
| Sequence-based reagent | Atm gene | Transnetyx | PCR primers | F-5′-CCTTTGAGGCATAAGTTGCAACTTG-3′ |
| Sequence-based reagent | Atm gene | Transnetyx | PCR primers | R-5′-GTACAGTGTATCAGGTTAGGCATGC-3′ |
| Chemical compound/ drugs | GJ103 saltFormula: C16H14N403S | TargetMol | T3448;CAS No.: 1459687-96-7 | 100 μM in media |
| Antibody | Anti-mouse CD68 (Rat monoclonal) | Bio-Rad | Cat# MCA1957, RRID: AB_322219 | IF (1:400) |
| Antibody | ATM (D2E2) (Rabbit- monoclonal) | Cell Signaling Technology | Cell Signaling Technology Cat# 2873, RRID:AB_2062659 | WB (1:500)WB (1:1000) |
| Antibody | GAPDH (14C10)(Rabbit-monoclonal) | Cell Signaling Technology | Cell Signaling Technology Cat# 2118, RRID:AB_561053 | WB (1:4000) |
| Antibody | β-Actin (D6A8)(Rabbit-monoclonal) | Cell Signaling Technology | Cell Signaling Technology Cat# 8457, RRID:AB_10950489 | WB (1:5000) |
| Antibody | Anti-Rabbit IgG, HRP-linked(Goat-monoclonal-polyclonal) | Cell Signaling Technology | Cell Signaling Technology Cat# 7074, RRID:AB_2099233 | WB (1:5000) |
| Antibody | Anti-Calbindin (D-28k)(Rabbit, polyclonal) | Swant Inc. | Swant Cat# CB 38, RRID:AB_10000340 | IF (1:1000) |
| Antibody | Anti-Mouse Alexa Fluor 488 (Goat polyclonal) | Thermo Fisher Scientific; Invitrogen | Cat# A11001, RRID: AB_2534069 | IF (1:500) |
| Antibody | Anti-mouse Cleaved Caspase-3, Asp-175 (rabbit) | Cell Signaling Technology | Cat# 9961, RRID: AB_2341188 | IF (1:200) |
| Antibody | Anti-Rat Alexa Fluor 555 (Goat polyclonal) | Thermo Fisher Scientific; Invitrogen | Cat# A21244, RRID: AB_2535812 | IF (1:1000) |
| Antibody | Anti-Rabbit Alexa Fluor 647 (Goat polyclonal) | Thermo Fisher Scientific; Invitrogen | Cat# A-21434, RRID: AB_141733 | IF (1:500) |
| Antibody | Anti-Calbindin D-28k (mouse-monoclonal) | Swant Inc. | Cat# CB300 | IF (1:500) |
| Antibody | Anti-Rabbit Alexa Fluor 488 (Goat-polyclonal) | Thermo Fisher Scientific;Invitrogen | Thermo Fisher Scientific Cat# A-11034, RRID:AB_2576217 | IF (1:1000) |
| Antibody | CD4(GK1.5)(Rat-monoclonal) | Thermo Fisher Scientific;Invitrogen | Thermo Fisher Scientific Cat# 50-0041-82, RRID:AB_10609337 | FACS(5 µl per test) |
| Antibody | CD8(53-6.7)(Rat-monoclonal) | Thermo Fisher Scientific;Invitrogen | Thermo Fisher Scientific Cat# 53-0081-82, RRID:AB_469897 | FACS(5 µl per test) |
| Antibody | CD3(145-2C11)(Hamster-monoclonal) | Thermo Fisher Scientific;Invitrogen | Thermo Fisher Scientific Cat# 12-0031-83, RRID:AB_465497 | FACS(5 µl per test) |
| Antibody | CD44(IM7)(Rat-monoclonal) | Thermo Fisher Scientific;Invitrogen | Thermo Fisher Scientific Cat# 25-0441-82, RRID:AB_469623 | FACS(5 µl per test) |
| Antibody | CD25(PC61.5)(Rat-monoclonal) | Thermo Fisher Scientific;Invitrogen | Thermo Fisher Scientific Cat# 47-0251-82, RRID:AB_1272179 | FACS(5 µl per test) |
| Other | Eosin Y (Certified Biological Stain) | Thermo Fisher Scientific (Fisher Chemical) | Cat# E511-100 | |
| Other | Hematoxylin Stain Solution, Modified Harris Formulation, Mercury Free Nuclear Stain | RICCA Chemical Company | Cat# 3530-16 | |
| Other | Permount Mounting Medium | Thermo Fisher Scientific (Fisher Chemical) | Cat# SP15-100 | |
| Other | Fluoromount-G with DAPI | Southern Biotech | Cat# 0100-20, RRID: SCR_021261 | |
| Commercial assay or kit | BCA Protein Assay Kit | Thermo Fisher Scientific;Pierce | Cat# 23225 | Protein assay |
| Commercial assay or kit | SuperSignal West Pico Chemiluminescent Substrate | Thermo Fisher Scientific;Pierce | Cat# 34580 | Chemiluminescent substrate |
| Commercial assay or kit | Radiance plus | Azure Biosystems | Cat# AC2103 | Chemiluminescent substrate |
| Software, algorithm | FlowJo | https://www.flowjo.com/solutions/flowjo | RRID:SCR_008520 | |
| Software, algorithm | ImageJ software | ImageJ (http://imagej.nih.gov/ij/) | RRID:SCR_003070 | Version 1.53 |
| Software, algorithm | IgorPro | http://www.wavemetrics.com/products/igorpro/igorpro.htm | RRID:SCR_000325 | Version 7; Tarotools procedures |
| Software, algorithm | Neuroexpress | https://www.researchgate.net/project/NeuroExpress-Analysis-software-for-whole-cell-electrophysiological-data | https://www.researchgate.net/project/NeuroExpress-Analysis-software-for-whole-cell-electrophysiological-data | Version 21.1.13; used for sEPSC analyses |
| Software, algorithm | GraphPad, Prism | GraphPad Prism (https://graphpad.com) | RRID:SCR_015807 | Versions 8 and 9 |
| Software, algorithm | MBF, Stereo investigator | https://www.mbfbioscience.com/stereology | RRID:SCR_017667 | Version 2021 |
| Software, algorithm | Microsoft Excel | https://www.microsoft.com/en-us/microsoft-365/excel | RRID:SCR_016137 | Version 365 |
| Software, algorithm | Catwalk XT | https://www.noldus.com/catwalk-xt | RRID: SCR_021262 |
Additional files
Download links
A two-part list of links to download the article, or parts of the article, in various formats.
Downloads (link to download the article as PDF)
Open citations (links to open the citations from this article in various online reference manager services)
Cite this article (links to download the citations from this article in formats compatible with various reference manager tools)
A novel, ataxic mouse model of ataxia telangiectasia caused by a clinically relevant nonsense mutation
eLife 10:e64695.
https://doi.org/10.7554/eLife.64695


