Global epistasis emerges from a generic model of a complex trait
- NSF-Simons Center for Mathematical and Statistical Analysis of Biology, Harvard University, United States
- Department of Organismic and Evolutionary Biology, Harvard University, United States
- Quantitative Biology Initiative, Harvard University, United States
- Department of Physics, Harvard University, United States
Figures
Figure 1
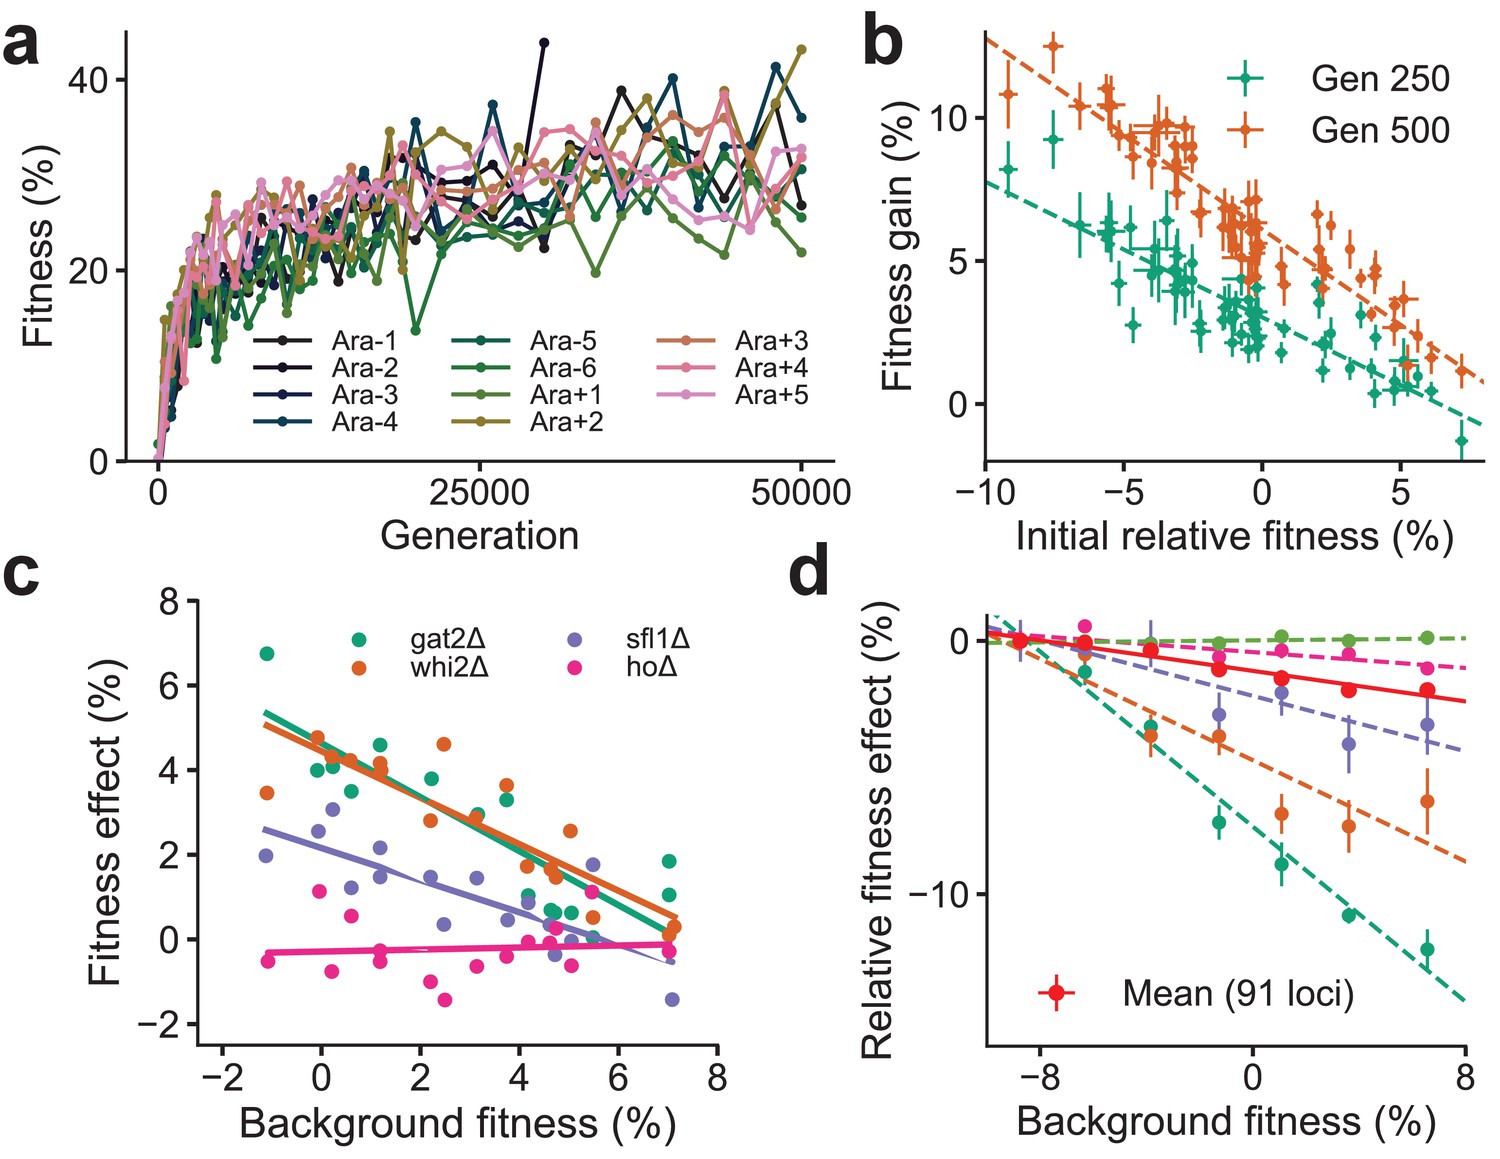
Declining adaptability and global epistasis in microbial evolution experiments.
(a) Convergent phenotypic evolution in the E. coli long-term evolution experiment: the fitness relative to the common ancestor of 11 independently adapting populations over 50,000 generations is shown (data from Wiser et al., 2013). The 12th population, Ara + 6, has limited data and is not shown. (b) Yeast strains with lower initial fitness adapt faster (data from Kryazhimskiy et al., 2014). The fitness gain after 250 (green) and 500 (orange) generations of 640 independently adapting populations with 64 different founders and 10 replicates of each founder. Mean and SE are computed over replicates. (c) Diminishing returns of specific beneficial mutations on fitter backgrounds for three knocked out genes (green, orange, and purple) (data from Kryazhimskiy et al., 2014). Control in pink. (d) Increasing costs of specific deleterious mutations on fitter backgrounds (data from Johnson et al., 2019). The fitness effect relative to the least fit background for the mean over 91 mutations (in red) and 5 of the 91 mutations is shown. Linear fits for the five specific mutations and the mean using dashed and solid lines respectively are shown.
Figure 2
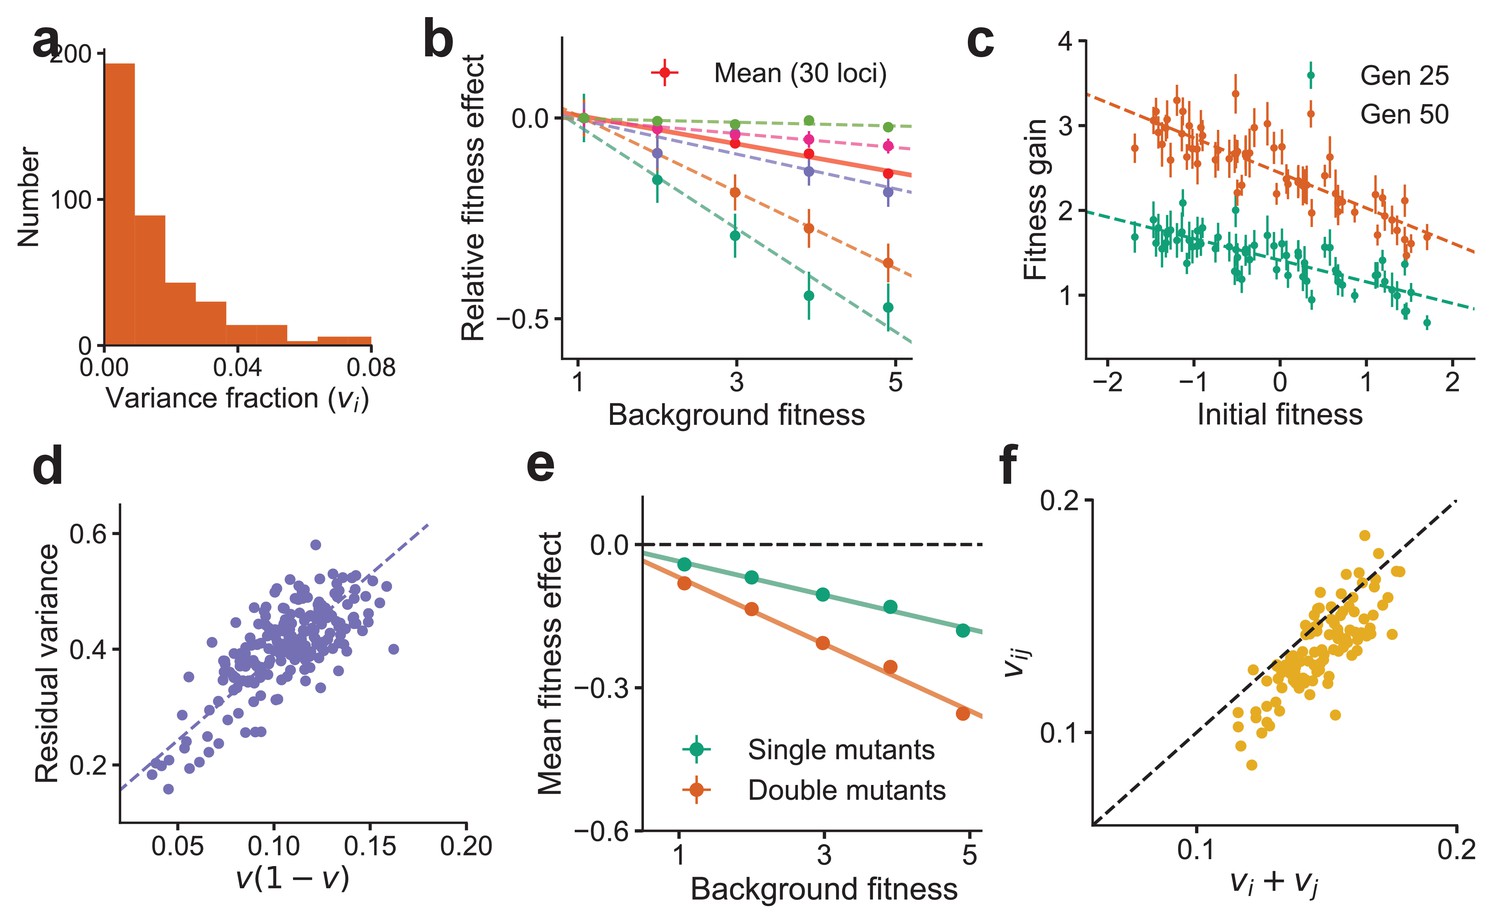
Global epistasis is recapitulated in a generic model of a complex trait and leads to testable predictions.
(a) The distribution of variance fractions over 400 loci for the simulated genotype-phenotype map. (b) The predicted linear relationship between fitness effect (relative to the fitness effect on the least fit background) and background fitness for the mean over 30 randomly chosen loci (red, solid line) and five loci (dashed lines in colors) is recapitulated. The slope of the linear fit for each locus is proportional to its variance fraction, (slope = ). Mean and SE are over backgrounds of approximately equal fitness. See Materials and methods for more details. (c) The mean fitness gain after 25 (green) and 50 (orange) generations of simulated evolution of 768 independently adapting populations with 64 unique founders and 12 replicates each. Means and SEs are computed over the 12 replicates. Error bars are s.e.m. (d) The relationship predicted from theory between the residual variance from the linear fit for each locus and its slope is confirmed in simulations. (e) The mean fitness effect for single mutants at 30 loci and double mutants from all possible pairs of the 30 loci. The slope for the double mutants is predicted to be roughly twice that of single mutants. (f) The estimated variance fraction of a double mutant with mutations at two loci is predicted from theory and confirmed in simulations to be approximately the sum of the variance fractions for single mutations at the two loci. Sub-additivity is due to epistasis between the two loci. See Materials and methods for more details.
Figure 3
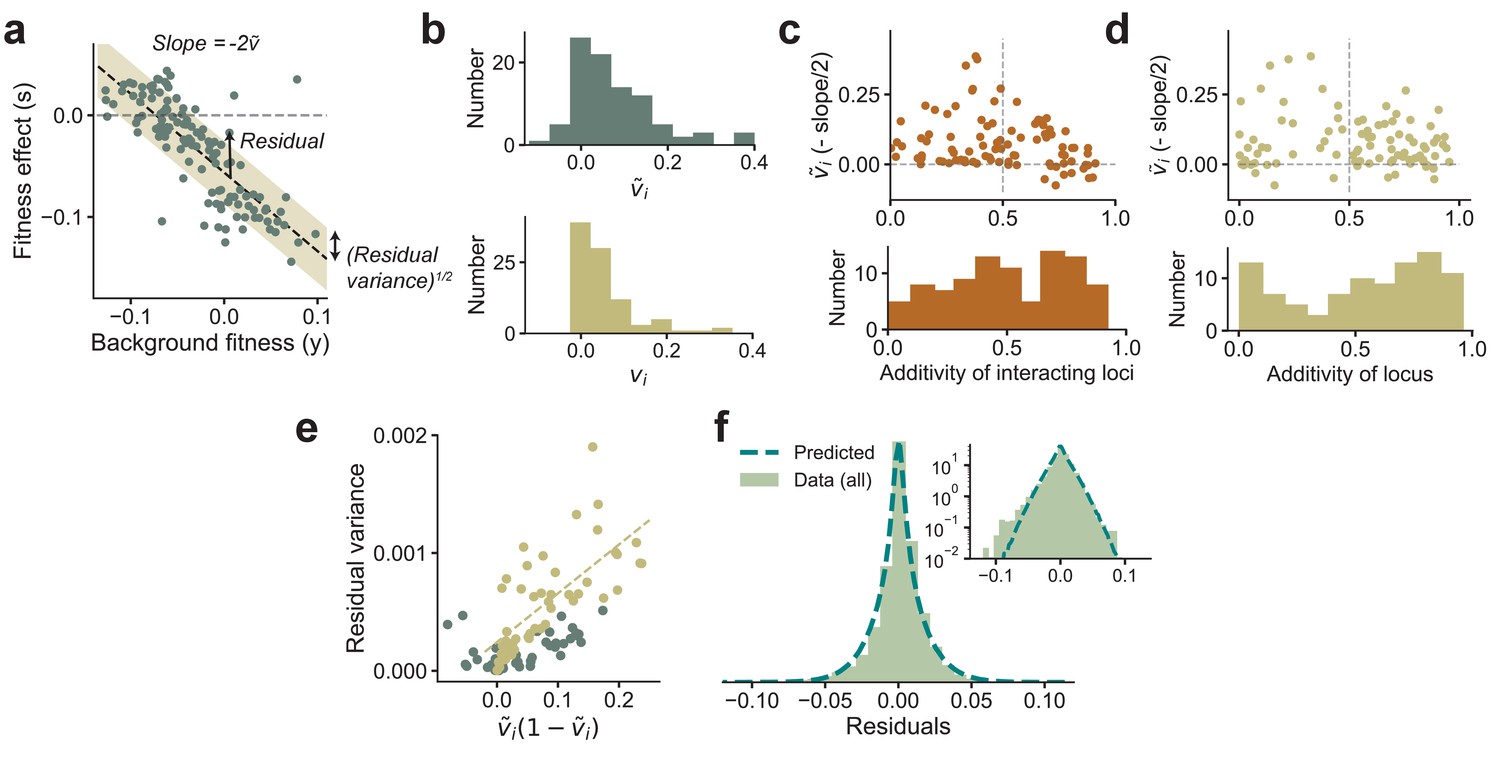
Experimental observations from Johnson et al., 2019 are consistent with theoretical predictions.
(a) The fitness effect of one of the 91 mutations from Johnson et al., 2019 plotted against background fitness. (b) The distribution of the measured (negative one-half of the slope from a) and variance fractions vi for the 91 insertion mutations. (c, d) plotted against the additivity of interacting loci (AoIL) and the additivity of the mutated locus (see main text for definitions). The histograms are shown below the plots. The sign of the trend depends on the AoIL rather than the additivity of the mutated locus. (e) The measured variance of the residuals against the prediction , shown here for the 91 mutations. The yellow circles correspond to the loci with AoIL lt0.5. The best-fit line (yellow dashed line) to these loci has ( for all points). (f) The shape of the distribution of residuals pooled from all 91 mutations aligns well with the prediction from Equation (3). The variances of the two distributions are matched. Inset: same plot in log-linear scale. See Materials and methods for more details.
Figure 4
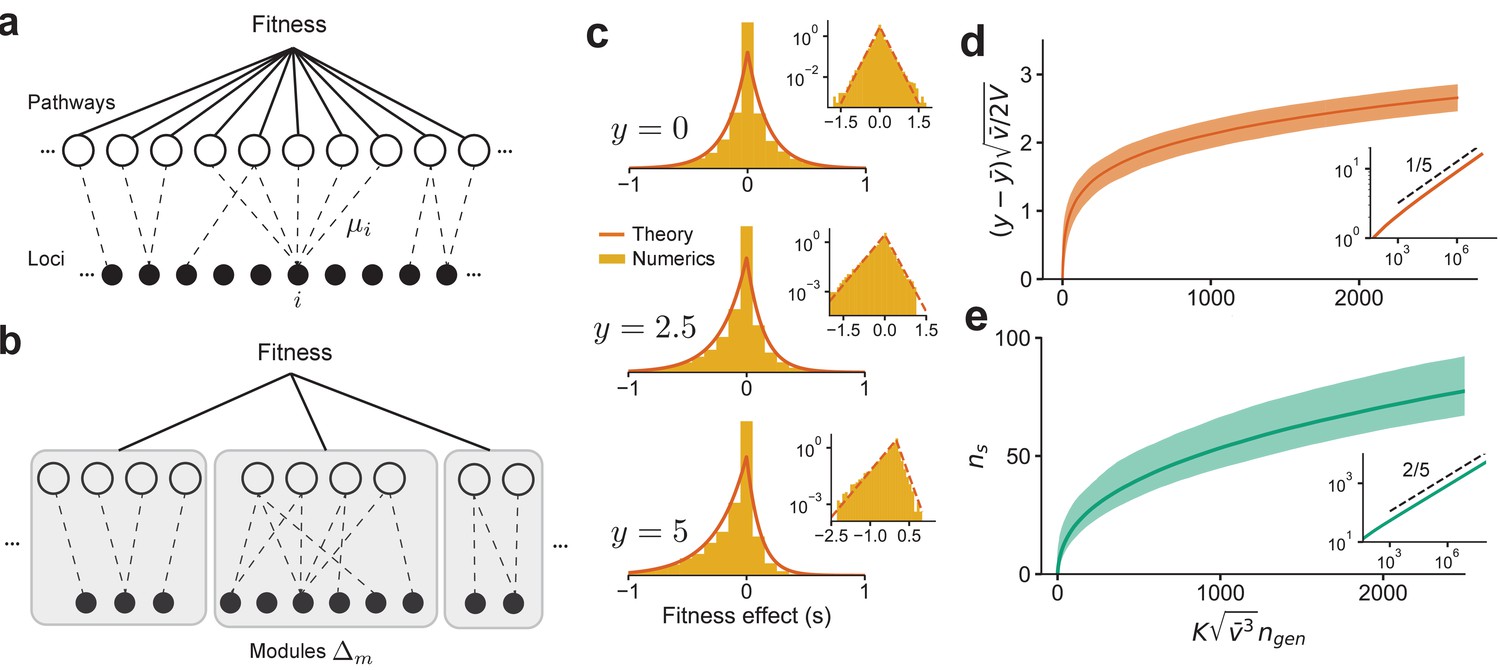
The distribution of fitness effect (DFE) and long-term adaptation dynamics predicted for the connectedness model.
(a) Schematic of the connectedness (CN) model, where each locus is associated with a fraction µ of pathways that contribute to the organism’s fitness. (b) An alternative model with modular organization, where sets of loci interact only within the pathways specific to a single module. (c) The DFE predicted from Equation (14) matches those obtained from simulated evolution of genotypes from the CN model. 128 randomly drawn genotypes (400 loci) with initial fitness close to zero are evolved to and , and the DFE is measured across loci and genotypes. We chose and so that represents adaptedness. Insets: same plots in log-linear scale. Note that the number of beneficial mutations acquired during the simulated evolution (10-20) is much less than the total number of loci (400). (d) For a neutrally adapted organism, the theory predicts quick adaptation to a well-adapted state beyond which the adaptation dynamics are independent of the specific details of the genotype-fitness map. Shown here is the mean adaptation curve predicted under strong-selection-weak-mutation (SSWM) assumptions, which leads to a power-law growth of fitness with exponent 1/5 in the well-adapted regime (inset). (e) The number of fixed beneficial mutations under SSWM, which grows as a power-law with exponent 2/5 in the well-adapted regime (inset). The shaded region is the 95 confidence interval around the mean for (c) and (d). See Materials and methods and SI for more details.
Appendix 1—figure 1

The mean fitness trajectory and the mean number of substitutions predicted by the model in the strong-selection-weak-mutation regime.
(a) The scaled fitness vs. scaled time. Shown below is the fitness in log-scale to highlight the different scalings in the neutrally adapted and well-adapted regimes. The slopes of the dashed lines are shown. (b) The scaled number of substitutions vs. scaled time as in (a).
Additional files
Download links
A two-part list of links to download the article, or parts of the article, in various formats.
Downloads (link to download the article as PDF)
Open citations (links to open the citations from this article in various online reference manager services)
Cite this article (links to download the citations from this article in formats compatible with various reference manager tools)
Global epistasis emerges from a generic model of a complex trait
eLife 10:e64740.
https://doi.org/10.7554/eLife.64740


