Myelinating Schwann cells and Netrin-1 control intra-nervous vascularization of the developing mouse sciatic nerve
- Center for Interdisciplinary Research in Biology (CIRB), College de France, CNRS, INSERM, Université PSL, France
- Institut Mondor de Recherche Biomédicale. UMR U955 INSERM UPEC, France
Figures
Figure 1
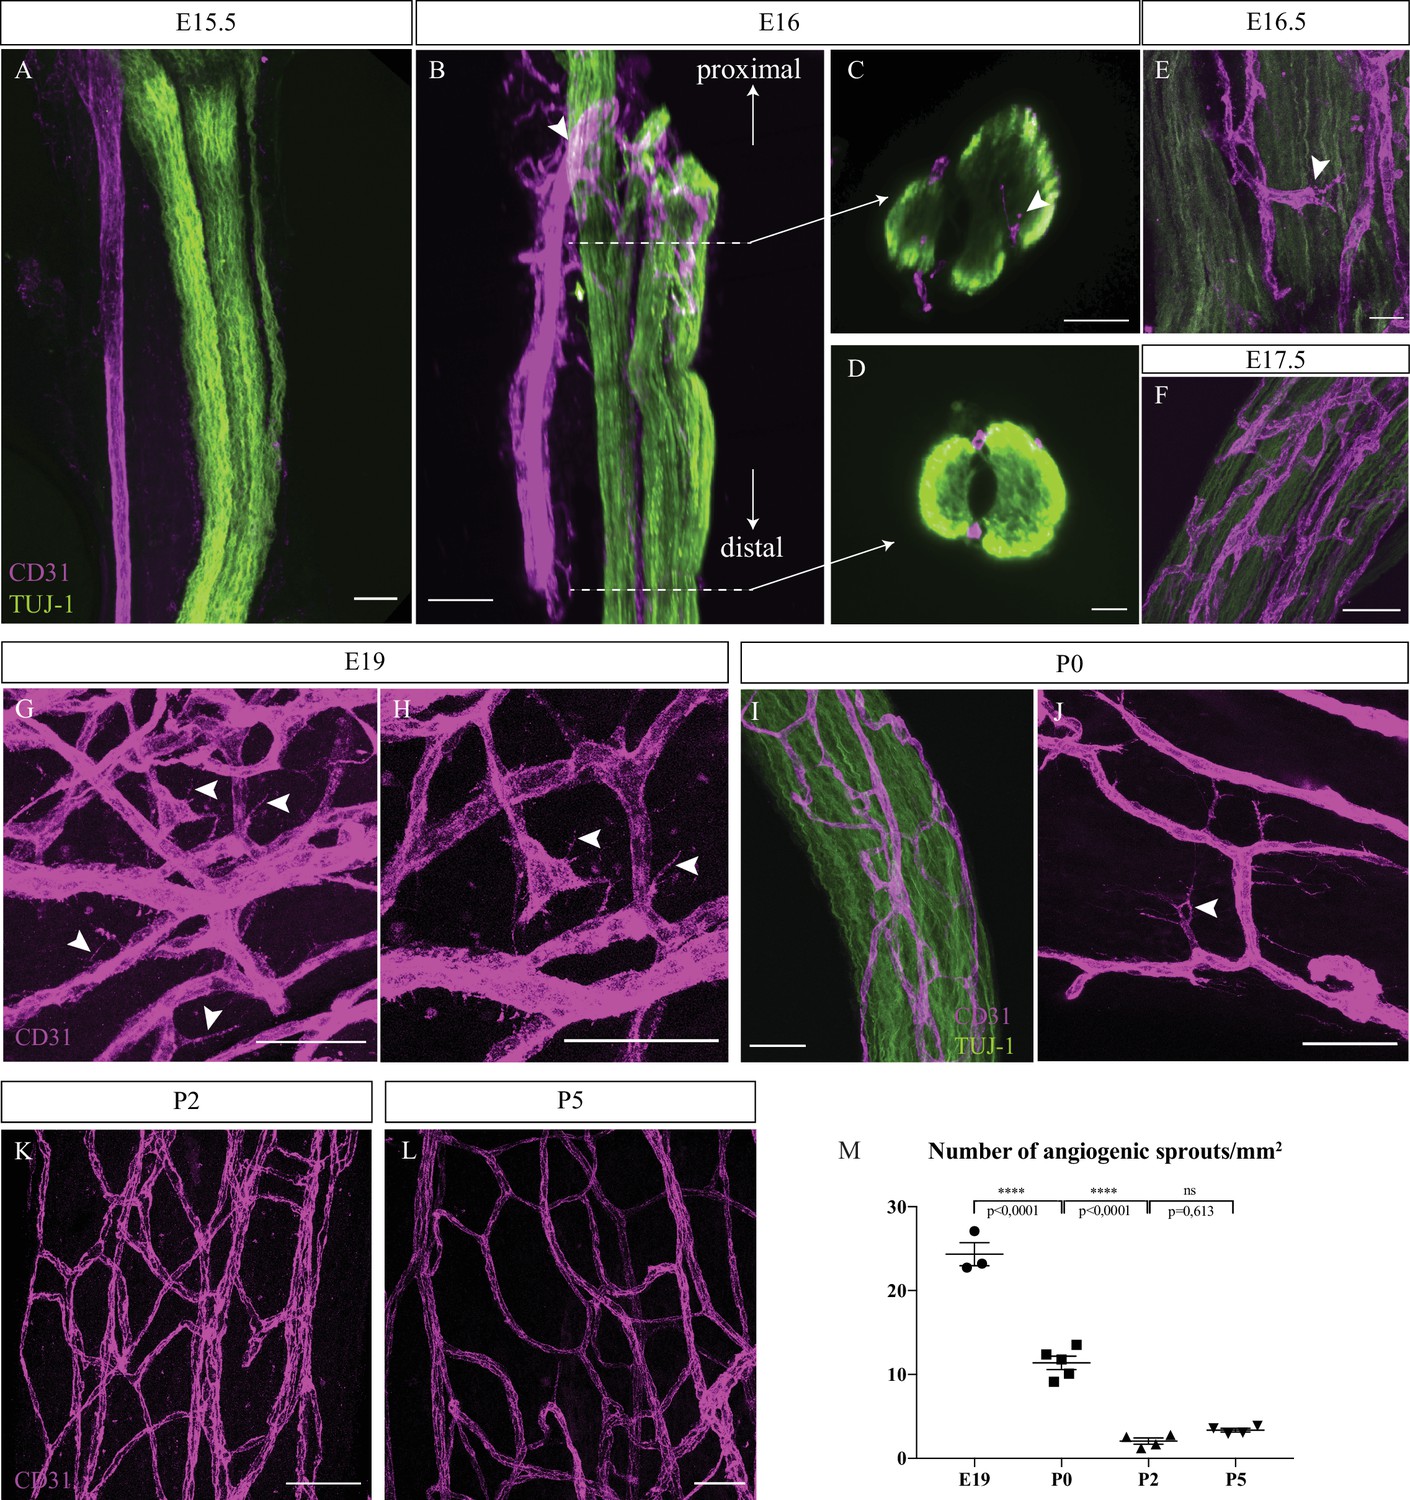
Intra-nervous vascular system (INV) develops rapidly starting from embryonic day E16 and angiogenesis is still ongoing at P0.
(A) Whole-mount immunofluorescence staining of sciatic nerve showing axons (TUJ-1, green) and blood vessels (endothelial cells expressing CD31, magenta) at embryonic day E15.5. (B) Snapshot of a 3D view of primitive sciatic nerve at E16. New blood vessels (CD31, magenta) emerging from the aligned artery (arrowhead) starting to form the peri-nervous vascular system. (C) Orthogonal view of the proximal part of the nerve showing blood vessels starting to form the intra-nervous vasculature (arrowhead) and of the distal part (D) showing no intra-nervous blood vessels. (E) Close-up view of blood vessels inside a sciatic nerve at E16.5, showing several angiogenic sprouts with their filopodias (arrowhead). (F) INV of a sciatic nerve at E17.5. (G) INV of a sciatic nerve at E19, showing active angiogenesis with several angiogenic sprouts with their filopodias (arrowheads). (H) High-resolution image of angiogenic tip cells. (I) INV of a sciatic nerve at P0, with angiogenesis still ongoing (J), as angiogenic sprouts displaying filopodias are visible (arrowhead). (K, L) At P2 and P5, almost no angiogenic sprouts are visible. Around six nerves from six mice were analyzed per developmental stage. (M) Quantification of the number of angiogenic sprouts per 1 mm2 throughout peri-natal development. n = 3–5 animals for each stage, one or two nerve(s) per animal, mean ± SEM, one-way ANOVA and Tukey’s multiple comparisons test, ****p < 0.0001. Scale bars are 50 μm for all images except for (J), the scale bar is 20 μm. Detailed values are presented in Figure 1—source data 1.
-
Figure 1—source data 1
Quantification of the number of angiogenic sprouts.
- https://cdn.elifesciences.org/articles/64773/elife-64773-fig1-data1-v2.xlsx
Figure 2
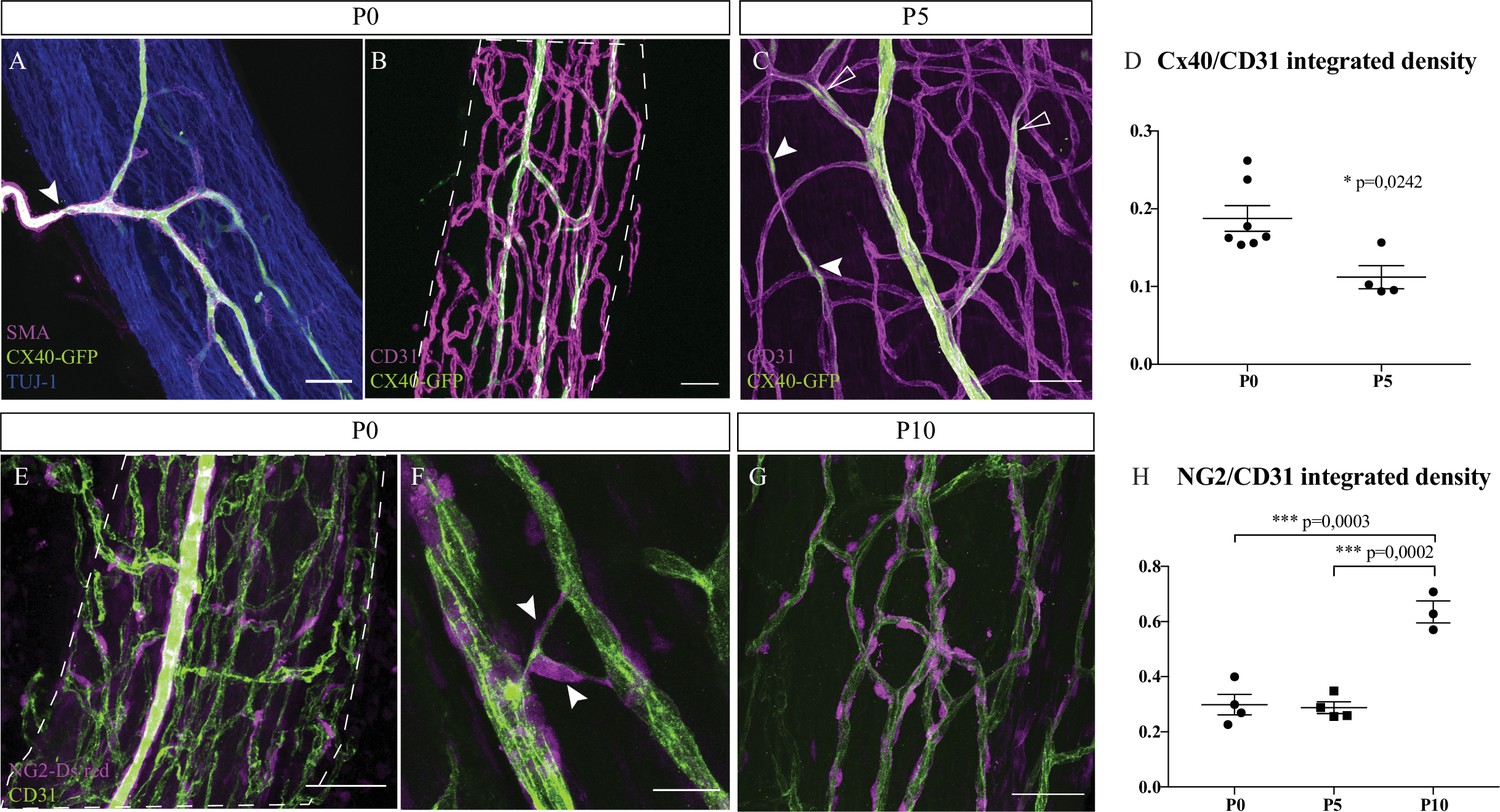
Intra-nervous vascular system (INV) matures during post-natal stages with arterial differentiation and pericytes recruitment.
(A) Whole-mount immunofluorescence staining of a sciatic nerve from a connexin-40 (Cx-40)-GFP reporter mouse at P0 showing an artery composed of endothelial cells expressing the protein Cx-40 (in green) and covered by smooth muscle cells (stained in magenta, smooth muscle actin staining [SMA]). This artery has invaded the sciatic nerve (axons expressing TUJ-1, blue). (B) INV at P0 is marked in magenta and endothelial cells expressing the protein Cx-40 are in green. (C) At P5, some endothelial cells express the protein Cx-40 (white arrowheads) and new arterial branches are differentiating (empty arrowheads). (D) Quantification of the ratio of Cx-40-GFP-positive endothelial cells at P0 and P5. N = 4–7 nerves from four to seven different animals; mean ± SEM, Mann-Whitney test. (E) NG2-Dsred mice were used to observe pericytes (magenta) covering endothelial cells (CD31, green) of a P0 sciatic nerve. (F) Close-up view of P0 sciatic nerve vasculature showing pericytes covering new blood vessel branching (arrowheads). (G) Pericytes coverage of the INV at P10. Scale bars are 50 μm for A, B, C, E, and 20 μm for D. Around six nerves were analyzed per developmental stages. (H) Quantification of NG2-DsRed-positive cells covering blood vessels at P0, P5, and P10. N = 3–4 nerves from three to four different animals; mean ± SEM, one-way ANOVA and Tukey’s multiple comparisons test, ***p < 0.001. Detailed values for C and G are presented in Figure 2—source data 1.
-
Figure 2—source data 1
Quantification of Cx-40-GFP+ and NG2-Dsred+ coverage.
- https://cdn.elifesciences.org/articles/64773/elife-64773-fig2-data1-v2.xlsx
Figure 3
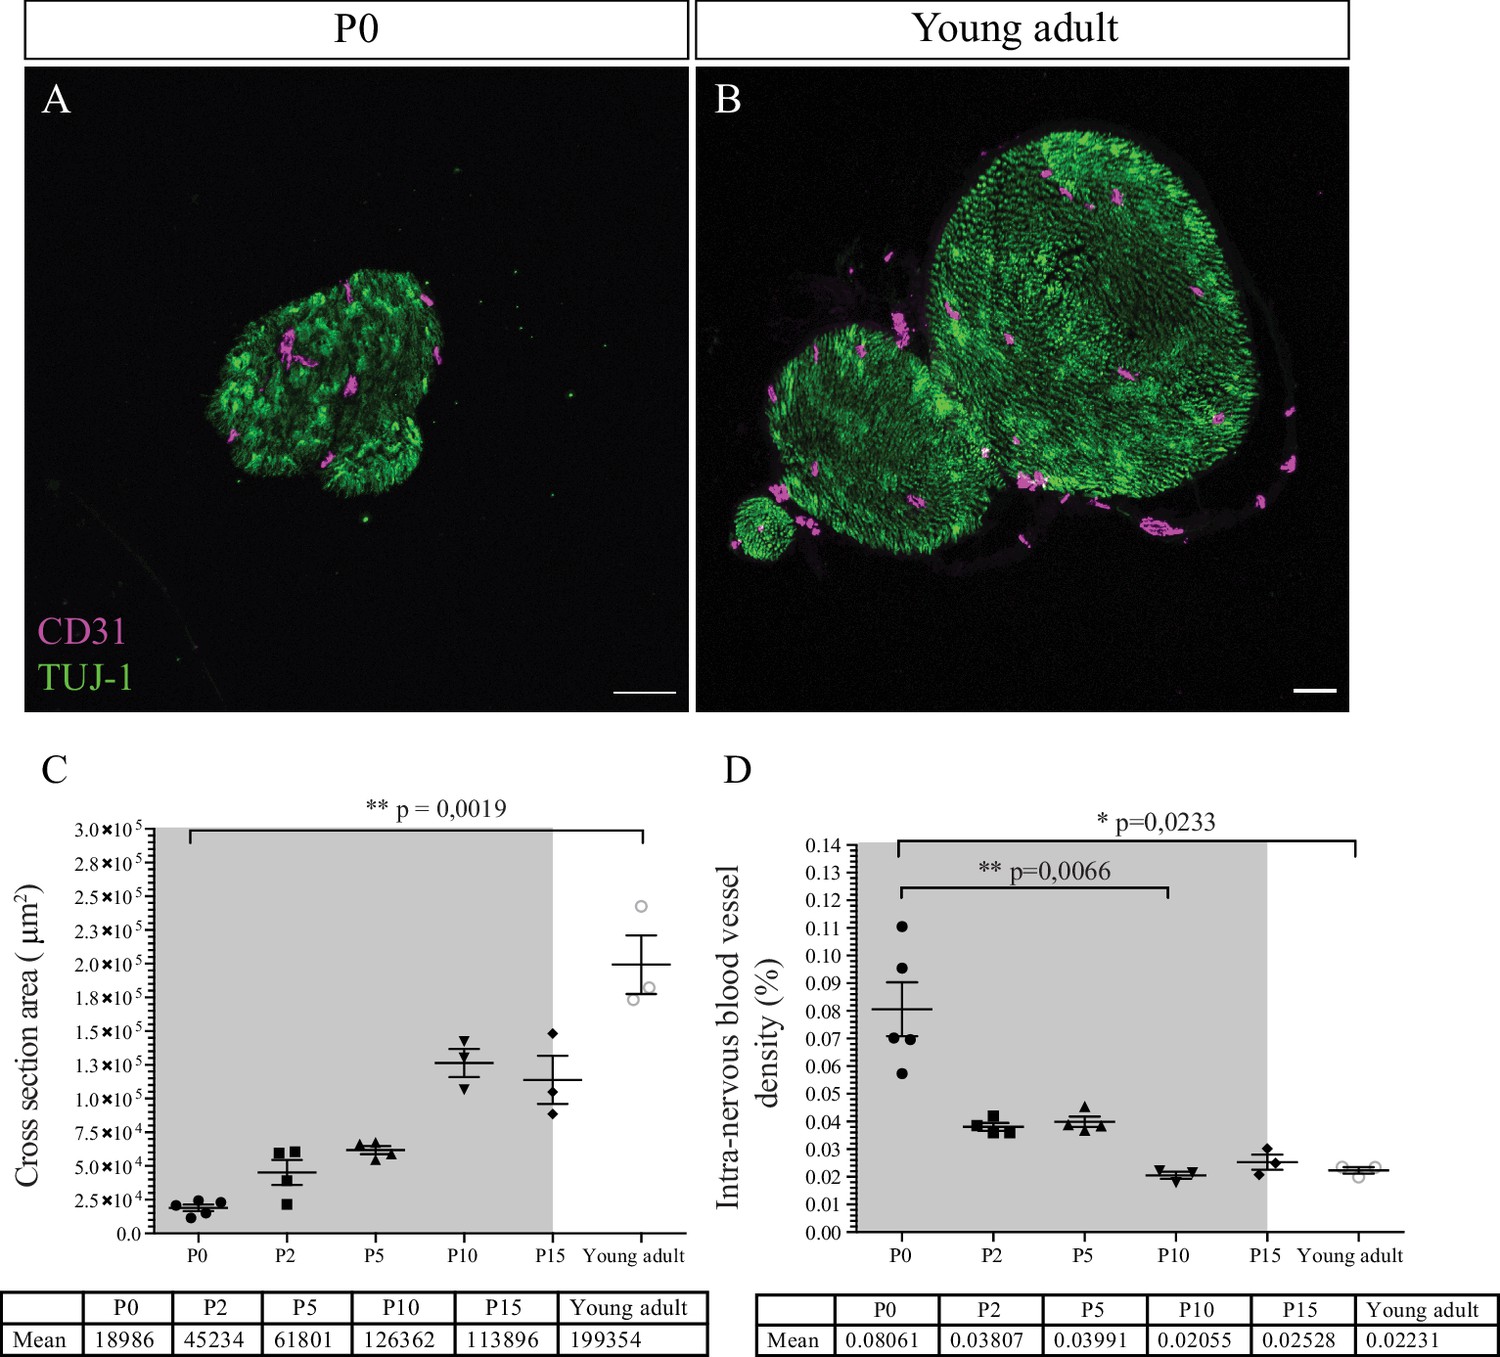
Intra-nervous vascular system (INV) density decreases during post-natal development.
(A) Immunofluorescence staining of sciatic nerve’s transversal sections from a P0 mouse and from a young adult mouse (B) showing blood vessels (CD31, magenta) and axons (TUJ-1, green) inside the nerve. (C) Quantification of the surface area of nerves’ cross section, from P0 to young adult stage (around P54). The gray box represents the myelination period from P0 to P15. (D) Intra-nervous CD31 density expressed as percentage of total nerve cross section area. Only the blood vessels inside the nerve were counted. Blood vessel’s density decreases significantly from P0 to P10 and stabilizes. n = 3–5 animals for each stage, one nerve per animal and >50 cross sections were analyzed per nerve, mean ± SEM, the comparison was made between all stages (two by two using multiple comparison) and only the significant differences were showed: Kruskal-Wallis and Dunn’s multiple comparisons test, *p < 0.05, **p < 0.01, only. Detailed values are presented in Figure 3—source data 1.
-
Figure 3—source data 1
Quantification of intra-nervous vascular system (INV) density.
- https://cdn.elifesciences.org/articles/64773/elife-64773-fig3-data1-v2.xlsx
Figure 4 with 2 supplements
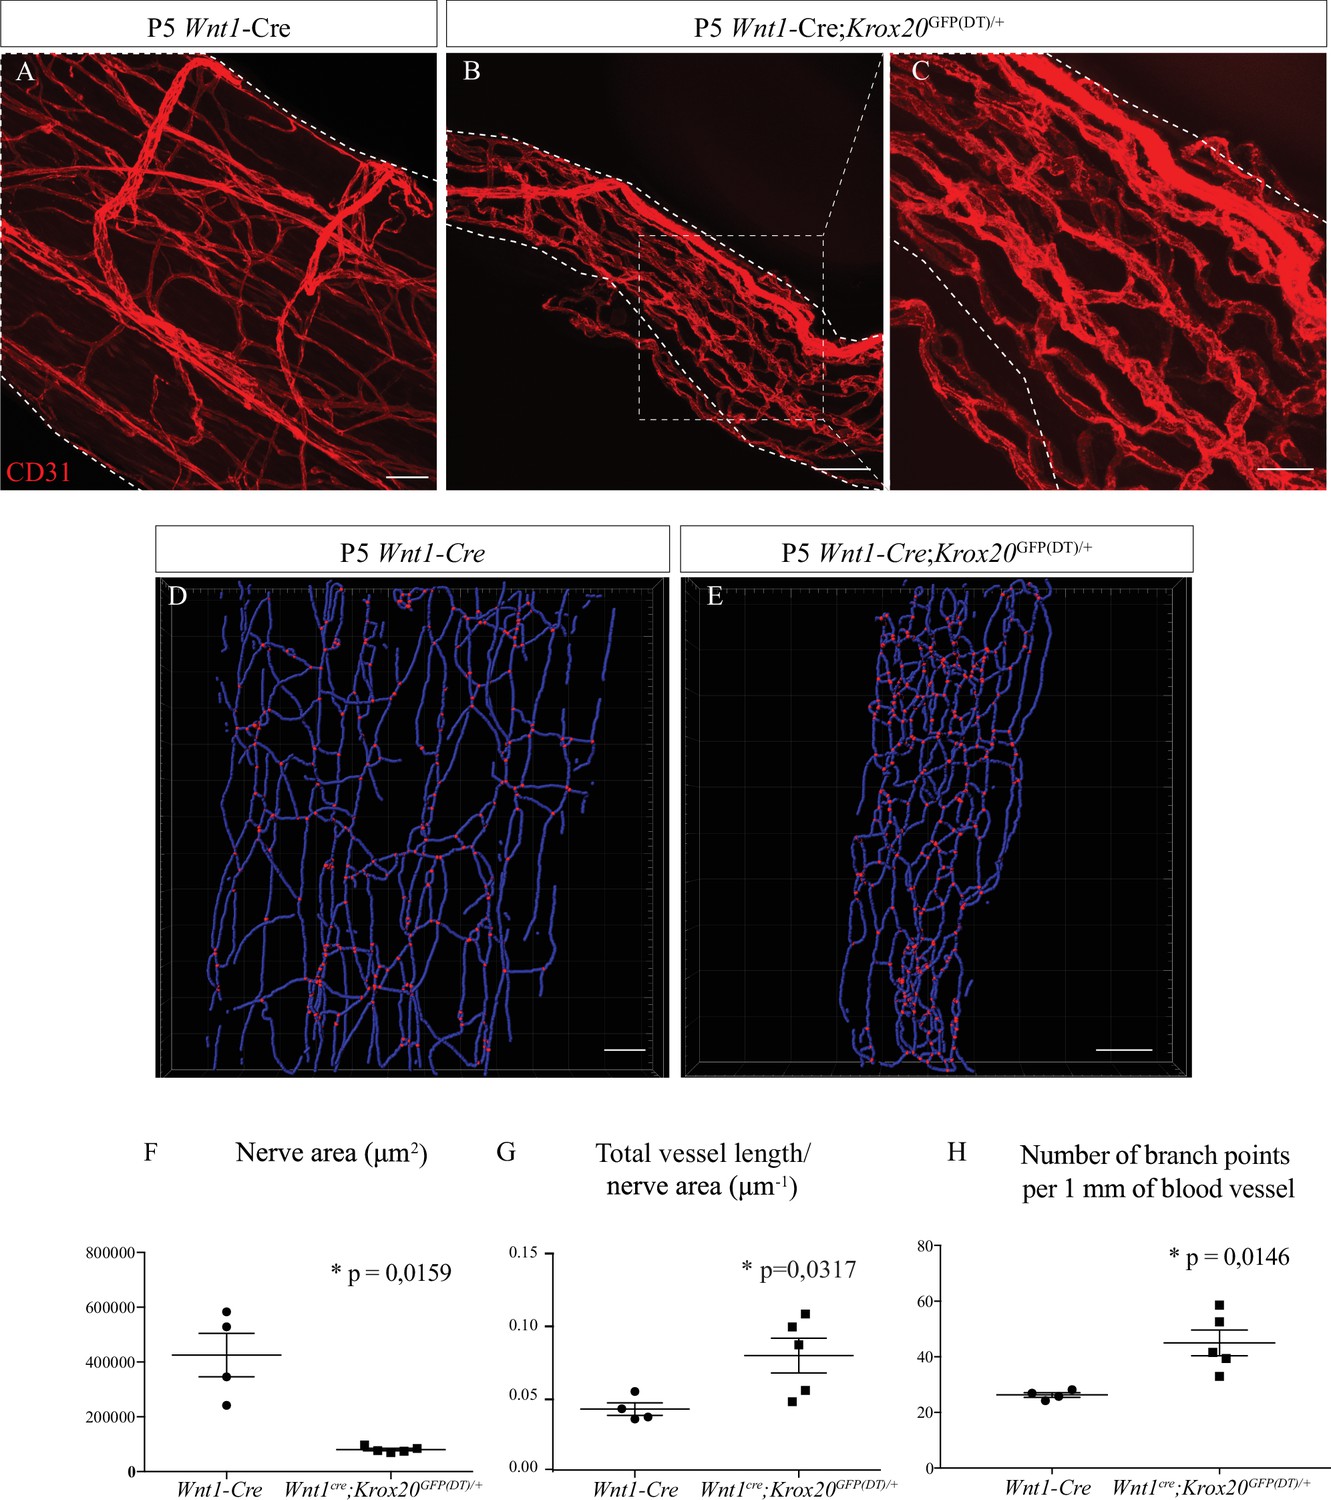
Schwann cells ablation disrupt sciatic nerve vasculature.
(A) Whole-mount immunofluorescence staining of sciatic nerve from control Wnt1-Cre mouse at P5, the blood vessels are stained with CD31 and shown in red. (B) Vasculature of a sciatic nerve from a Wnt1-Cre;Krox20GFP(DT)/+ mouse at P5. (C) Close-up view showing the disruption of the blood vessels’ organization. (D, E). Imaris 3D reconstruction of sciatic nerve vasculature in blue, the branching points are shown in red. (F) Quantification of sciatic nerve area. (G) Quantification of total blood vessel length/nerve area. (H) Number of branching points per 1 mm of blood vessel (n = 4–5 per group, graphs show mean ± SEM, Mann-Whitney test, *p < 0.05). Scale bars are 50 μm for A, B, D, and E and 20 μm for C. Detailed values are presented in Figure 4—source data 1.
-
Figure 4—source data 1
Quantification of nerve area and intra-nervous vascular system (INV) length and branch points in Wnt1-Cre and Wnt1-Cre;Krox20GFP(DT)/+ mice.
- https://cdn.elifesciences.org/articles/64773/elife-64773-fig4-data1-v2.xlsx
Figure 4—figure supplement 1
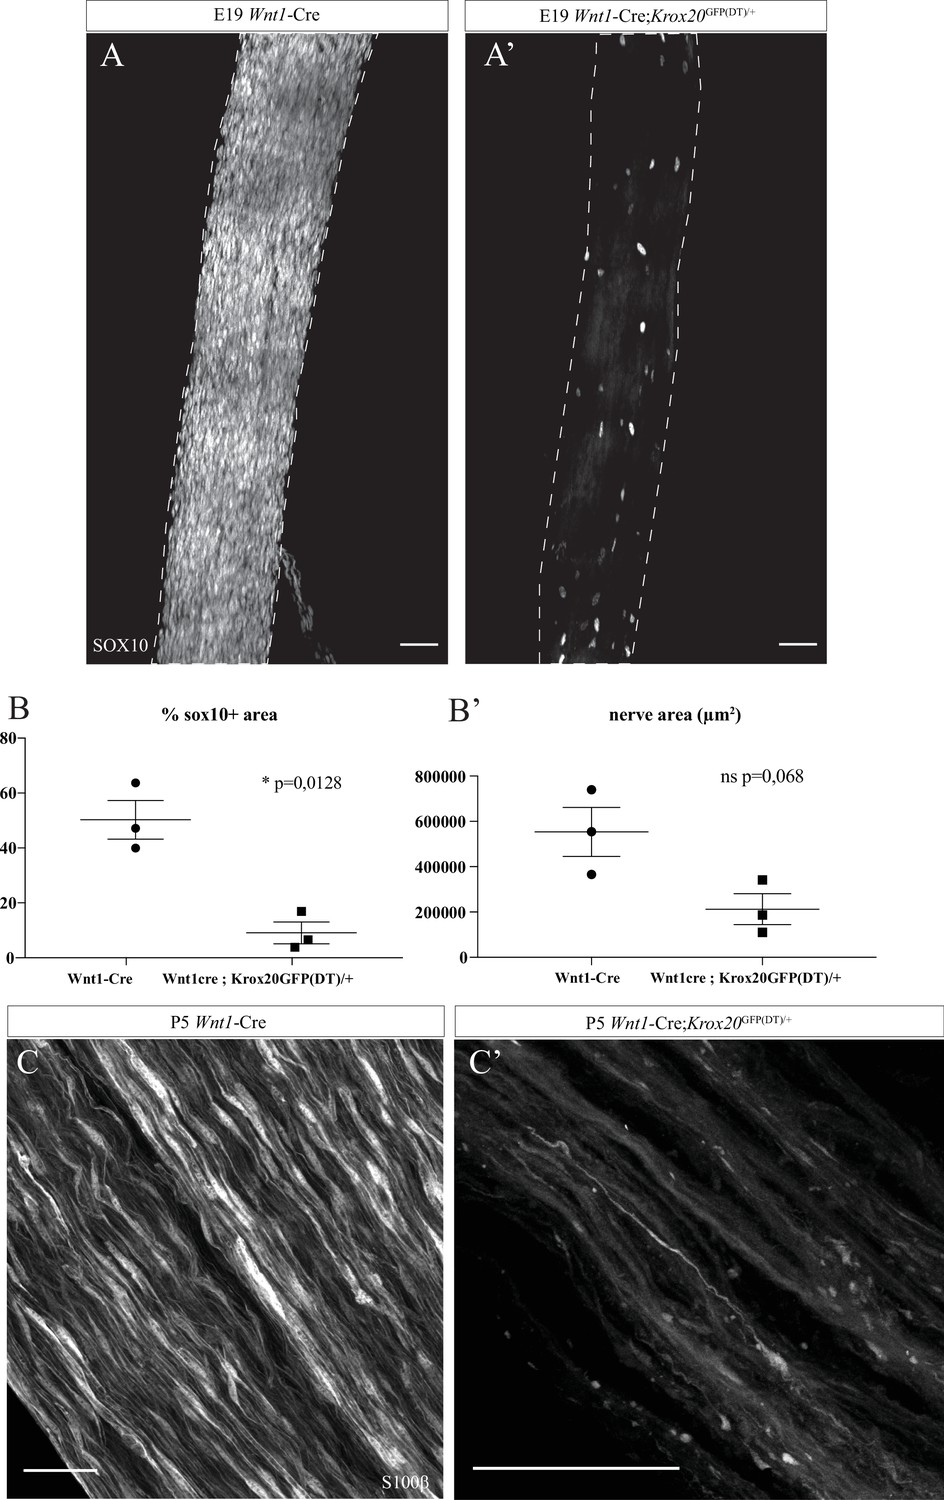
Schwann cells (SC) genetic ablation in Wnt1-Cre;Krox20GFP(DT)/+ mutant mice.
(A, A’) Whole-mount immunofluorescence staining of sciatic nerves from control Wnt1-Cre mouse and Wnt1-Cre;Krox20GFP(DT)/+ mutant at E19, SC expressing SOX10 are visible in white. (B) Quantification of the % Sox10+ area after thresholding of the signal (Fiji). N = 3 nerves from three different embryos for each group; mean ± SEM, unpaired t-test with Welch’s correction, *p < 0.05. (B’) Quantification of the nerve size. N = 3 nerves from three different embryos for each group; mean ± SEM, unpaired t-test with Welch’s correction. (C, C’) Whole-mount immunofluorescent staining of sciatic nerves from control Wnt1-Cre mouse and Wnt1-Cre;Krox20GFP(DT)/+ mutant at P5, myelinating SC expressing S100β are labelled in white. Scale bars are 50 μm for A and A’, 50 μm for C and C’. Detailed values for B and B’ are presented in Figure 4—source data 1.
-
Figure 4—figure supplement 1—source data 1
Quantification of nerve area and sox10+ area in Wnt1-Cre and Wnt1-Cre;Krox20GFP(DT)/+ mice.
- https://cdn.elifesciences.org/articles/64773/elife-64773-fig4-figsupp1-data1-v2.xlsx
Figure 4—figure supplement 2
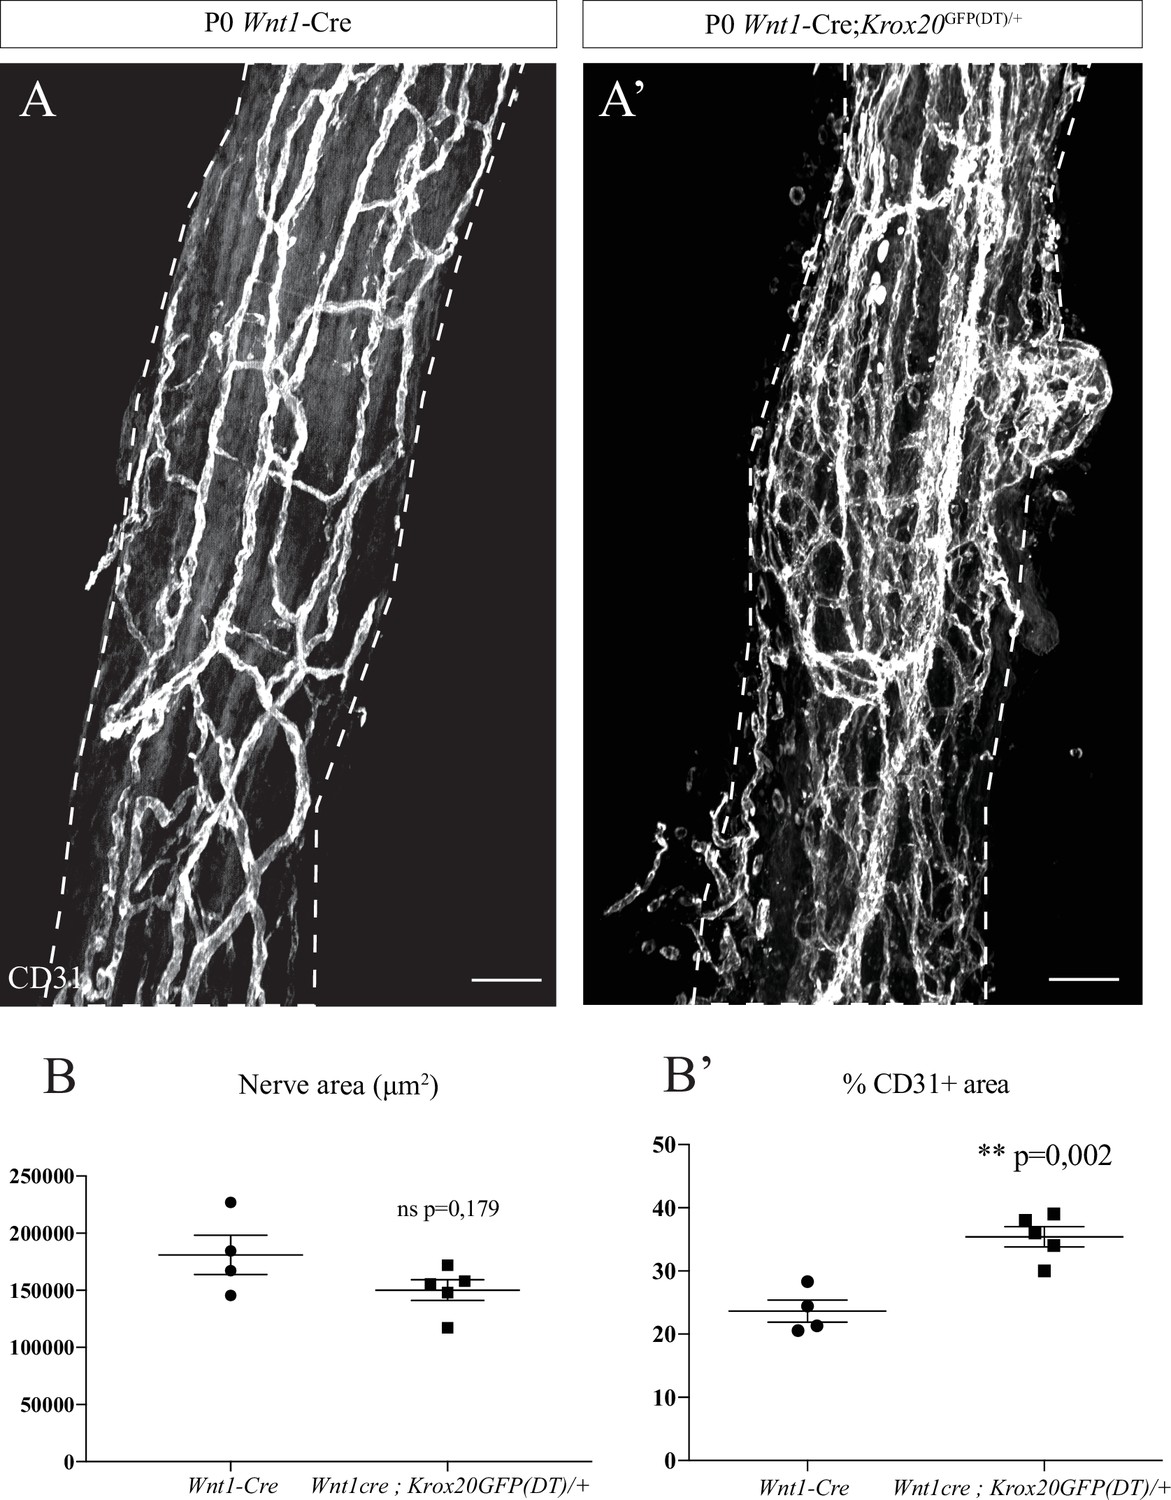
Intra-nervous vascular system (INV) disruption after Schwann cells genetic ablation in Wnt1-Cre;Krox20GFP(DT)/+ mutant mice.
(A, A’) Whole-mount immunofluorescence staining of a sciatic nerves from a control Wnt1-Cre mouse and from a Wnt1-Cre;Krox20GFP(DT)/+ mouse at P0, the blood vessels are stained with CD31 and shown in white. Scale bars are 50 μm. (B) Quantification of the sciatic nerve area (Fiji). N = 4 different nerves from four different animals for each group. Mean ± SEM, unpaired t-test with Welch’s correction. (B’) Quantification of the area occupied by blood vessels (intensity thresholding of the signal from CD31 staining). N = 4 nerves from four different animals for each group; mean ± SEM, unpaired t-test with Welch’s correction, **p < 0.01. Detailed values for B and B’ are presented in Figure 4—figure supplement 2—source data 1.
-
Figure 4—figure supplement 2—source data 1
Quantification of nerve area and CD31+ area in Wnt1-Cre and Wnt1-Cre;Krox20GFP(DT)/+ mice.
- https://cdn.elifesciences.org/articles/64773/elife-64773-fig4-figsupp2-data1-v2.xlsx
Figure 5 with 1 supplement
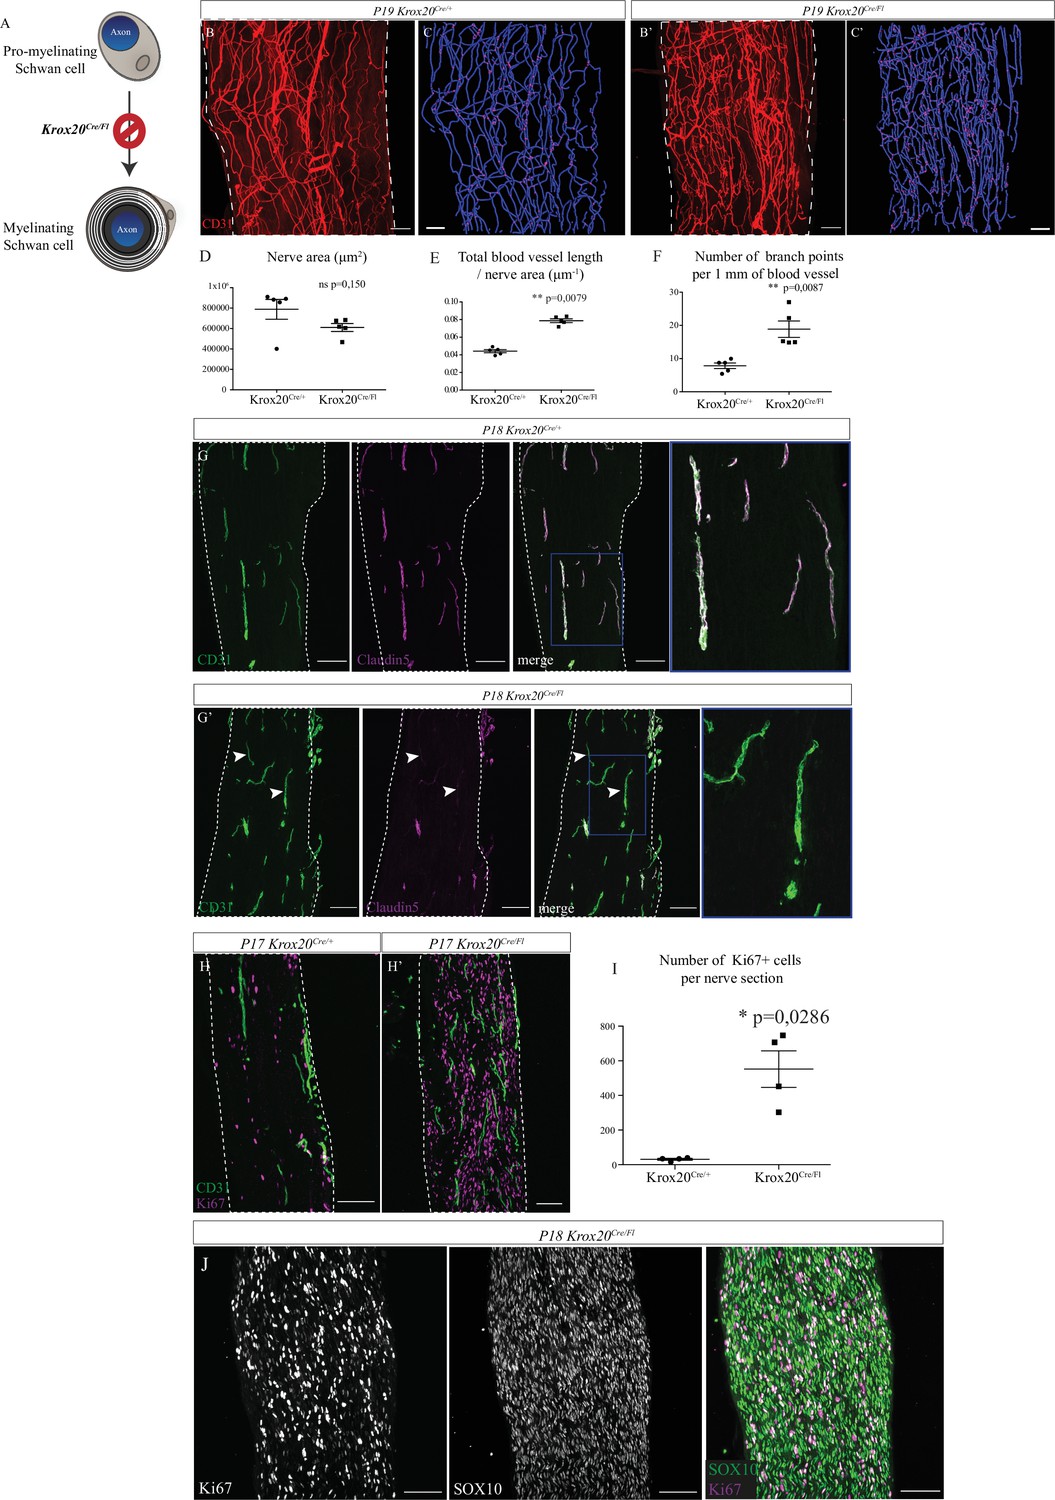
Sciatic nerve is hypervascularized upon myelination inhibition.
(A) Schematic illustrating Krox20 knock-out leading to myelination inhibition. (B, B’) Whole-mount immunofluorescence staining of sciatic nerves from a Krox20Cre/+ control mouse and from a Krox20Cre/Fl mouse at P19, blood vessels are stained in red. (C, C’) Imaris 3D reconstruction of sciatic nerve vasculature in blue, the branching points are in magenta. (D) Quantification of the sciatic nerves area in μm2. (E) Quantification of the length of the entire vasculature in μm. (F) Quantification of the number of branching points per 1 mm of blood vessel (n = 5 different nerves from five different animals, per group; graphs show mean ± SEM, Mann-Whitney test, **p < 0.01). (G, G’) Longitudinal sections of sciatic nerve dissected Krox20Cre/+and Krox20Cre/Fl, at P18. Endothelial cells expressing CD31 are in green and claudin-5 in magenta. Dotted lines represent the borders of the nerve section. Some vessel branches do not express claudin-5 (arrowheads) (H, H’) Longitudinal sections of sciatic nerves dissected from a Krox20cre/+ mouse and Krox20cre/Fl, at P17. Cells in proliferation express the protein Ki67 (magenta) and blood vessels are in green. (I) Quantification of Ki67-positive cells per nerve section. n = 4 animals per group, more than 25 sections were quantified per nerve, graph shows means ± SEM, Mann-Whitney test, *p < 0.05. (J) SOX10 and Ki67 staining on sciatic nerve longitudinal sections. Scale bars are 100 μm. Detailed values are presented in Figure 5—source data 1.
-
Figure 5—source data 1
Quantification of nerve area, intra-nervous vascular system (INV) length, and branch points, Ki67+ area in Krox20Cre/Fl mice.
- https://cdn.elifesciences.org/articles/64773/elife-64773-fig5-data1-v2.xlsx
Figure 5—figure supplement 1

Krox20 protein is detectable after birth in the sciatic nerve.
(A) Krox20 Western blotting analysis in protein extracts prepared from sciatic nerves from wild-type (WT) mice at E18, P1, P2, and P8. The red box shows the band corresponding to Krox20 expression at E18 and P2. Note the absence of band at E18 and a clear band at P2. MW: molecular weight.
Figure 6 with 2 supplements
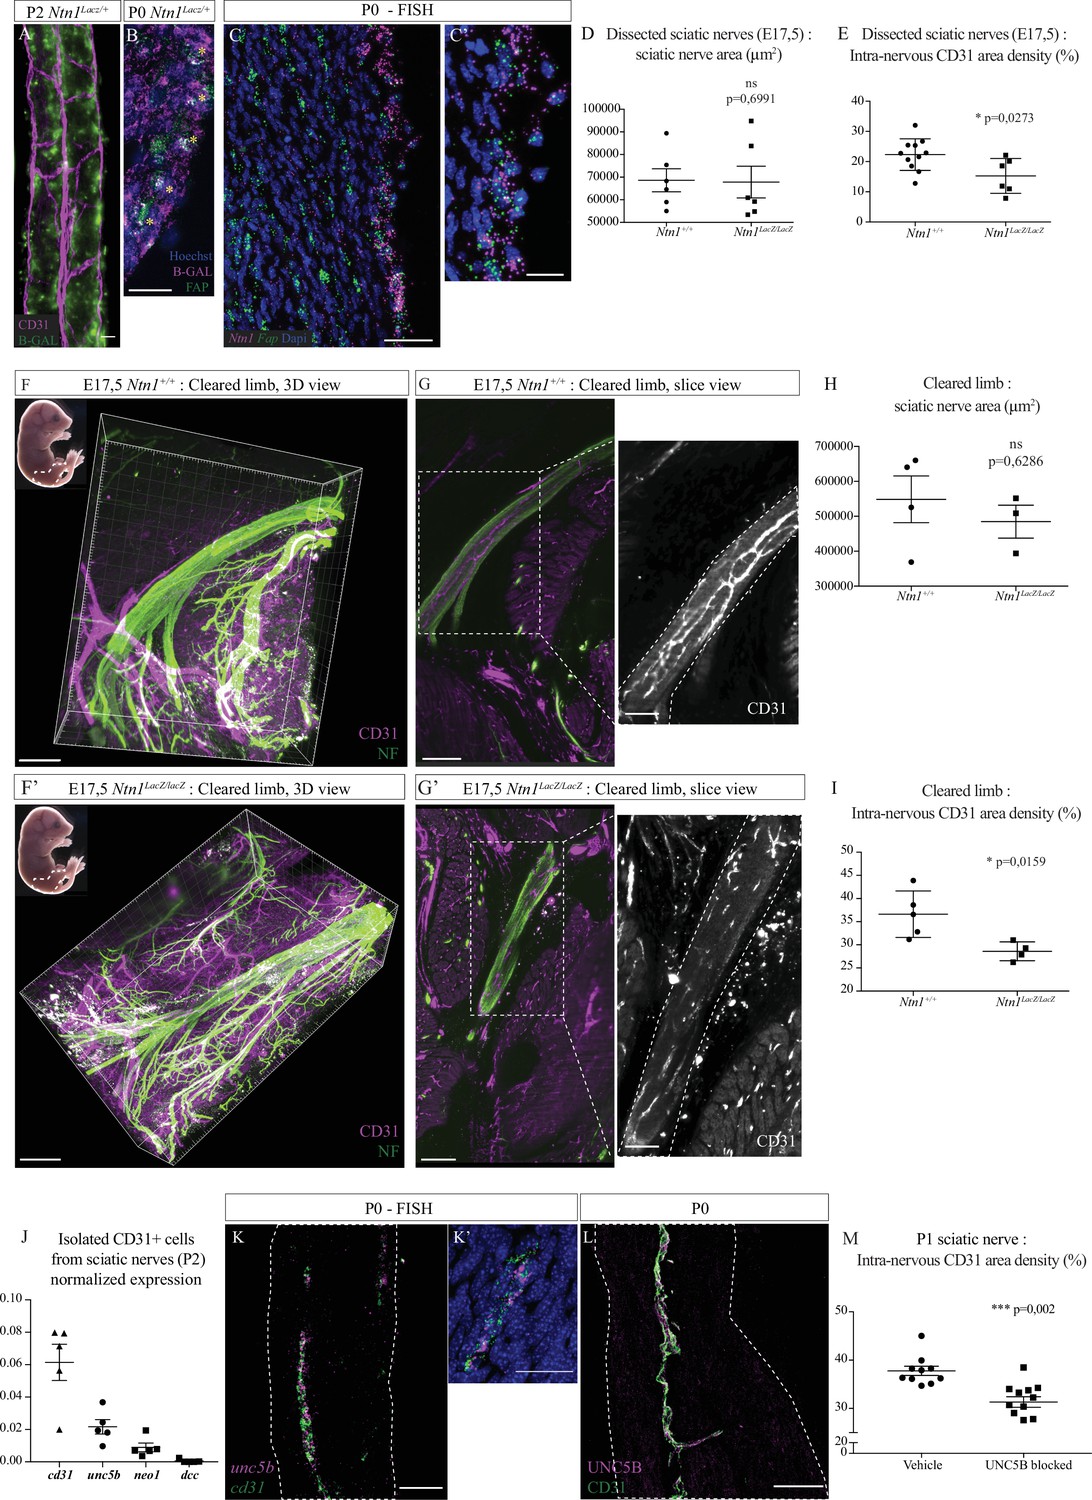
Netrin-1 and UNC5B control intra-nervous vascularization.
(A) Whole-mount X-Gal staining (showed in green) of sciatic nerve from Ntn1Lacz/+ mouse at P2 and vasculature is showed in magenta (CD31). (B) Immunofluorescence staining of β-galactosidase (magenta) and FAP (fibroblast-activating protein, green) on transversal cryo-section of sciatic nerve from Ntn1Lacz/+ mouse at P0. Nuclei are stained with Hoechst. (C, C’) Fluorescent in situ hybridization (FISH) of Ntn1 (magenta) and Fap (green) mRNA on longitudinal section of sciatic nerve from a wild-type (WT) mouse at P0 (C) and nuclei are labelled with Dapi. Close-up view of Ntn1 high expression by epi-perineural cells expressing Fap (C’). (D) Quantification of area (from neurofilament [NF] staining) of sciatic nerves from Ntn1+/+ and Ntn1LacZ/LacZ embryos at E17.5. (E) Quantification of the intra-nervous CD31-positive total area after images thresholding, showing that vascularization is significantly reduced in mutant embryos. (F, F’) Top left corner: E17.5 embryos (the dotted line represents the dissected limb containing the primitive sciatic nerve) and 3D view from Imaris software of the embryo’s limb, after CD31 (magenta) and NF (green) staining and clearing protocol (iDISCO+). Dotted lines delimit the immature sciatic nerve. (G, G’) Slice view of the cleared limb allowing the observation of the blood vessels inside the sciatic nerve. (H) Quantification of nerve area (from NF staining). (I) Quantification of intra-nervous CD31-positive area, using optical slices from cleared E17.5 embryos’ limbs. n = 4–5, mean ± SEM, Mann-Whitney test, *p < 0.05. (J) Normalized expression of mRNA coding cd31 (endothelial marker) and Netrin-1 receptors: unc5b, neo1, and dcc by isolated endothelial cells from sciatic nerves from P2 mice. N = 5 tubes containing around 1.17 × 10⁴ cells purified from 10 pooled sciatic nerves. (K, K’) FISH of unc5b (magenta) and cd31 (green) mRNA on longitudinal section of sciatic nerve from WT mouse at P0 (K). Close-up view of blood vessel expressing unc5b and cd31 mRNA (K’). (L) Immunofluorescence staining of UNC5B (magenta) and CD31 (green) on longitudinal section of sciatic nerve from WT mouse at P0. (M) Quantification of the intra-nervous CD31-positive total area from mice 1 day after they were injected with anti-UNC5B antibodies at P0 (dose = 4 μg/g of body weight). N = 10 and 11 pups were analyzed. Scale bar is 20 μm for A, B, and C’, 50 μm for C, K, K’, and L, 200 μm for F and F’. Detailed values are presented in Figure 6—source data 1.
-
Figure 6—source data 1
Quantification of nerve area and CD31+ area in Ntn1+/+ and Ntn1LacZ/LacZ embryos; quantification of level of expression of unc5b, neo1, and dcc by isolated endothelial cells from sciatic nerves from P2 mice; quantification of CD31+ area in sciatic nerves from pups injected with anti-UNC5B antibodies at P0.
- https://cdn.elifesciences.org/articles/64773/elife-64773-fig6-data1-v2.xlsx
Figure 6—figure supplement 1

Netrin-1 expression and sciatic nerve size from Ntn1LacZ/LacZ mice.
(A) Slice view of a cleared limb from an Ntn1LacZ/+ embryo at E16. The sciatic nerve is labelled in green (Tuj-1) and the β-galactosidase in red. (B, B’) Slice view of a cleared limb from an Ntn1LacZ/+ embryo at E17. The sciatic nerve is labelled in green (Tuj-1) and the β-galactosidase in red. (C) Quantification of B-Gal+/FAP+ ratio on sciatic nerve cross sections from P0 Ntn1Lacz/+ mice. N = 3 nerves from three mice. Graph shows mean ± SEM. (D) Quantification of Ntn1 FISH on longitudinal sections of sciatic nerves from P0 wild-type (WT) mice. The number of Ntn1+ dots per mm2 in epi-perinerve and endonerve was compared. N = 5 nerves from five mice. Graph shows mean ± SEM, Mann-Whitney test. (E, E’) Maximum intensity projection of selected Z planes (containing sciatic nerve) from images of cleared paws from Ntn1LacZ/LacZ hypomorphs and Ntn1+/+ control embryos at E16. Axons are labelled in green (Tuj-1) and the dotted lines represent the section analyzed. (F) Quantification of the average diameter of sciatic nerve from Ntn1LacZ/LacZ hypomorphs and Ntn1+/+ control embryos (Fiji). N = 5 different nerves from five different embryos for each group. Mean ± SEM, unpaired t-test with Welch’s correction. (G, G’) Whole-mount immunofluorescence staining of CD31 showing blood vessels in white of sciatic nerves from a control Ntn1+/+ and from an Ntn1LacZ/LacZ embryo at E17.5. (H) Quantification of unc5b FISH on longitudinal sections of sciatic nerves from P0 WT mice. The number of Unc5b+ dots per mm2 within blood vessels (cd31+ area) and within the nervous tissue (area without blood vessels) was compared. N = 4 nerves from four mice. Graph shows mean ± SEM, unpaired t-test with Welch’s correction. (I) Quantification of % UNC5B+ from blood vessels on longitudinal sections of sciatic nerve from P0 WT mice. N = 3 nerves from three mice. (J, J’) Whole-mount immunofluorescence staining of CD31 showing blood vessels in white of sciatic nerves dissected 1 day after injection with anti-UNC5B antibodies at P0 (dose = 4 μg/g of body weight) and sciatic nerves from control pups injected with vehicle solution. Scale bars are 100 μm for A, B, E, and E’ and B’, 200 μm for G and G’ and 50 μm for J and J’. Detailed values are presented in Figure 6—figure supplement 1—source data 1.
-
Figure 6—figure supplement 1—source data 1
Quantification of the average diameter of sciatic nerve from Ntn1LacZ/LacZ and Ntn1+/+ embryos.
- https://cdn.elifesciences.org/articles/64773/elife-64773-fig6-figsupp1-data1-v2.xlsx
Figure 6—figure supplement 2

Sural, phrenic, intercostal, and cutaneous nerves are devoid of intra-nervous vascular system (INV).
(A) Schematic representation of the sciatic nerve organization with its origin and different branches. In red are represented the axonal projections forming the sciatic nerve and more distally the common peroneal and tibial nerve and in yellow the axonal projection forming the sural nerve. (B and B’) Slice view of cleared limb from Ntn1+/+ and Ntn1LacZ/LacZ embryos at E17.5. Axons are stained in green (neurofilament [NF]) and blood vessels in magenta (CD31). Red dotted lines delineate the sciatic nerve and the dotted lines in yellow the sural branch. The orthogonal views show no blood vessels inside the sural nerve. (C, C’, and C’’) Whole-mount immunofluorescent staining of a diaphragm of a mouse at P2 showing axons composing the phrenic nerve in green (NF) and blood vessels in magenta (CD31). The orthogonal views in A” show no blood vessels inside the nerve. (D, D’, and D”) Immunofluorescent staining of an intercostal nerve of an embryo at E17.5 with axons in green (NF) and blood vessels in magenta (CD31). (E, E’, and E”) Immunofluorescent staining of a cutaneous nerve located in the back skin of an embryo at E17.5 with axons in green (NF) and blood vessels in magenta (CD31). Scale bars are 100 μm for C, C’, C”, B, and B’, 50 μm for C, C’, C”, D, D’, and D”.
Figure 7

Methodology used to quantify nerve area.
(A) Whole-mount immunofluorescent staining of a sciatic nerve showing axons in white (neurofilament [NF]) at P0. Red dotted lines represent nerve area. (B) Snapshot of a 3D visualization of a cleared limb at E17.5, axons are marked in green (NF) and blood vessels in magenta (CD31). (C) Maximum intensity Z projection of sciatic nerve portion from cleared limb images, axons are in white (NF). Red dotted lines represent nerve area and blue dotted lines represent diameter measurements. Scale bars are 100 μm.
Tables
Key resources table
| Reagent type (species) or resource | Designation | Source or reference | Identifiers | Additional information |
|---|---|---|---|---|
| Strain, strain background (Mus musculus; male/female) | Krox20cre | Jackson laboratory | Egr2tm2(cre)Pch/J | B6D2 background |
| Strain, strain background (Mus musculus; male/female) | Krox20fl/+ | Decker et al., 2006;DOI: 10.1523/JNEUROSCI.0716–06.2006 | B6D2 background | |
| Strain, strain background (Mus musculus; male/female) | Krox20GFP(DT) | Vermeren et al., 2003 DOI: 10.1016/S0896-6273(02)01188–1 | B6D2 background | |
| Strain, strain background (Mus musculus; male/female) | Wnt1-Cre | Jackson laboratory | B6.Cg-E2f1tg(Wnt1-cre)2Sor/JRRID:IMSR_JAX:022501 | B6D2 background |
| Strain, strain background (Mus musculus; male/female) | Cx-40-GFP | Miquerol et al., 2004;DOI:10.1016/j.cardiores.2004.03.007 | CD1 background | |
| Strain, strain background (Mus musculus; male/female) | Ng2-DsRed | Jackson laboratory | (TgCspg4-DsRed.T1)1Akik/J | C57/Bl6 background |
| Strain, strain background (Mus musculus; male/female) | Ntn1LacZ/+ | Serafini et al., 1996;DOI: 10.1016/S0092-8674(00)81,795X | CD1 background | |
| Antibody | CD31(rat monoclonal) | BD Pharmigen | Cat# 553370, RRID:AB_394816 | (1:400) |
| Antibody | CD31(goat polyclonal) | R&D | Cat# AF3628, RRID:AB_2161028 | (1:400) |
| Antibody | Tuj-1(mouse monoclonal IgG2a) | R&D | Cat# BAM1195, RRID:AB_356859 | (1:500) |
| Antibody | Tuj-1(mouse monoclonal IgG2a) | Biolegend | Cat# 801213, RRID:AB_2728521 | (1:400) |
| Antibody | SMA-cy3(mouse monoclonal) | Sigma | Cat# C6198, RRID:AB_476856 | (1:500) |
| Antibody | Neurofilament Heavy chain (chicken polyclonal) | Abcam | Cat# ab4680, RRID:AB_304560 | (1:1000) |
| Antibody | Ki67(rabbit polyclonal) | Abcam | Cat# ab15580, RRID:AB_443209 | (1:500) |
| Antibody | Sox10(Mouse monoclonal IgG2a) | Proteintech | Cat# 66786–1-Ig, RRID:AB_2882131 | (1:200) |
| Antibody | S100β(rabbit polyclonal) | Proteintech | Cat# 15146–1-AP, RRID:AB_2254244 | (1:400) |
| Antibody | β-Galactosidase (chicken polyclonal) | Abcam | Cat# ab9361, RRID:AB_307210 | (1:500) |
| Antibody | Goat anti-Rat IgG (H + L) Alexa Fluor 555(goat polyclonal) | Thermo Fisher | Cat# A-21434, RRID:AB_2535855 | (1:400) |
| Antibody | Goat anti-Chicken IgG (H + L) Alexa Fluor 647(goat polyclonal) | Thermo Fisher | Cat# A32933, RRID:AB_2762845 | (1:400) |
| Antibody | Donkey anti-Rabbit IgG (H + L) Alexa Fluor 488(donkey polyclonal) | Thermo Fisher | Cat# A-21206, RRID:AB_2535792 | (1:400) |
| Antibody | Donkey anti-Goat IgG (H + L) Alexa Fluor 555(donkey polyclonal) | Thermo Fisher | Cat# A-21432, RRID:AB_2535853 | (1:400) |
| Antibody | Rat UNC5H2/UNC5B Antibody | Bio-Techne | AF1006 | (dose = 4 μg/g of body weight)IF (1:200) |
| Commercial assay or kit | RNAscope Multiplex Fluorescent V2 Assay | ACD | 323100 | |
| Sequence-based reagent | RNAscope Probe - Mm-Ntn1 | ACD | 407621 | |
| Sequence-based reagent | RNAscope Probe - Mm-Fap-C3 | ACD | 423881-C3 | |
| Sequence-based reagent | RNAscope Probe - Mm-Pecam1-C3 | ACD | 316721-C3 | |
| Sequence-based reagent | RNAscope Probe - Mm-Unc5b-No-XHs | ACD | 482481 | |
| Sequence-based reagent | PrimePCR Template for SYBR Green Assay: Pecam1, Mouse | Bio-Rad | qMmuCID0005317 | |
| Sequence-based reagent | PrimePCR Template for SYBR Green Assay: Dcc, Mouse | Bio-Rad | qMmuCED0051027 | |
| Sequence-based reagent | PrimePCR Template for SYBR Green Assay: neo1, Mouse | Bio-Rad | qMmuCID0011752 | |
| Sequence-based reagent | PrimePCR Template for SYBR Green Assay: unc5b, Mouse | Bio-Rad | qMmuCID0016421 | |
| Commercial assay or kit | NucleoSpin RNA Plus XS, Micro kit for RNA purification | Macherey-Nagel | REF 740990.50 |
Additional files
Download links
A two-part list of links to download the article, or parts of the article, in various formats.
Downloads (link to download the article as PDF)
Open citations (links to open the citations from this article in various online reference manager services)
Cite this article (links to download the citations from this article in formats compatible with various reference manager tools)
Myelinating Schwann cells and Netrin-1 control intra-nervous vascularization of the developing mouse sciatic nerve
eLife 11:e64773.
https://doi.org/10.7554/eLife.64773


