Highly parallelized droplet cultivation and prioritization of antibiotic producers from natural microbial communities
- Bio Pilot Plant, Leibniz Institute for Natural Product Research and Infection Biology - Hans Knöll Institute, Germany
- Faculty of Biological Sciences, Friedrich Schiller University, Germany
- Biomolecular Chemistry, Leibniz Institute for Natural Product Research and Infection Biology - Hans Knöll Institute, Germany
Figures
Figure 1 with 2 supplements
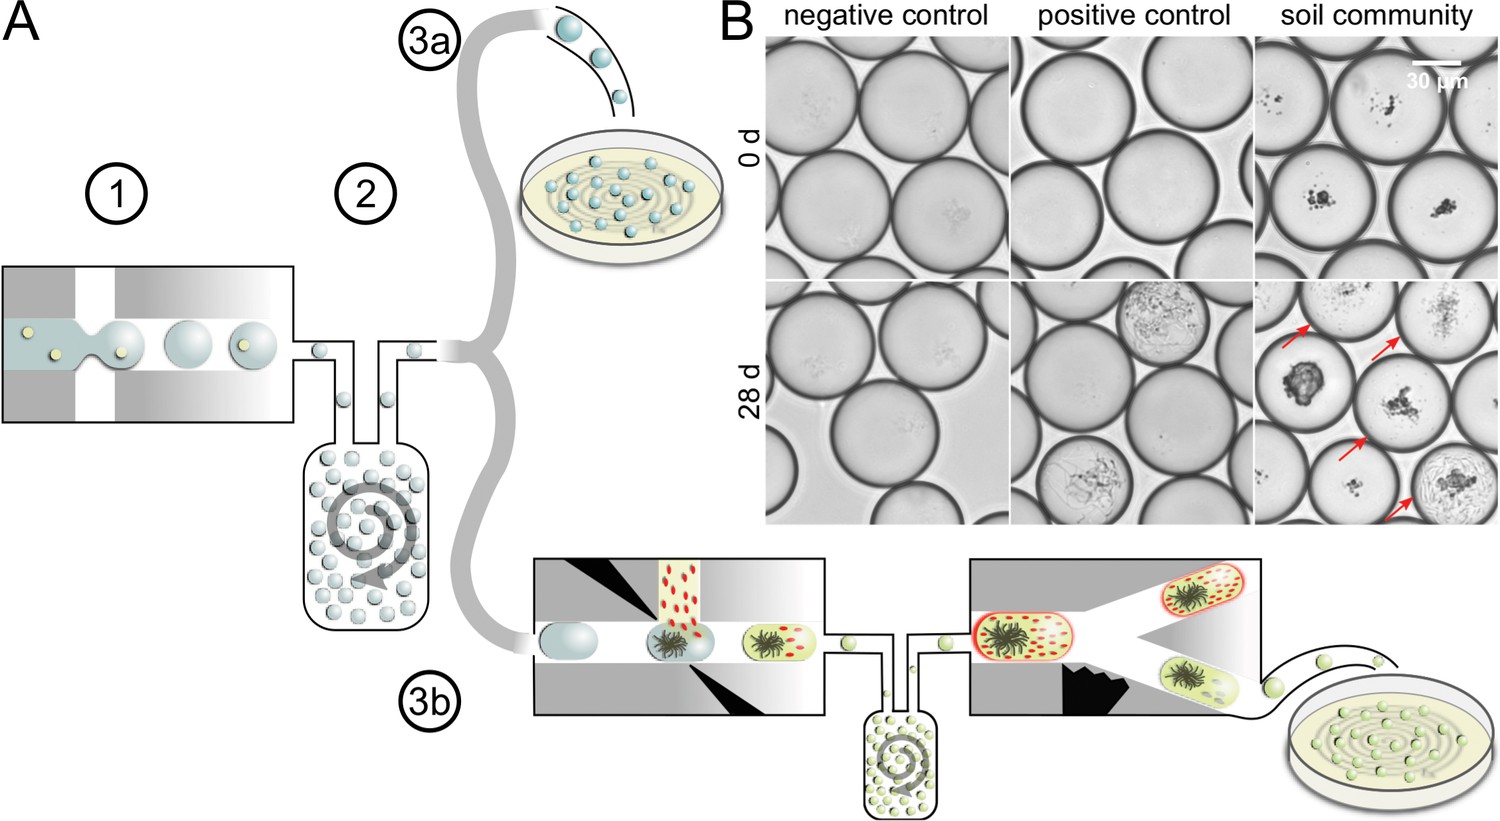
Concept of microbial droplet cultivation and activity screening.
(A) General workflow of in-droplet cultivation with two options for strain isolation. (1) Single cells of the soil community are encapsulated in droplets. (2) Droplets are incubated under oxic conditions in bulk. (3a) Droplets are deposited on agar plates for strain isolation without previous selection. (3b) Droplets are screened for antibiotic producers and only screening hits are deposited for strain isolation. (B) Brightfield microscopy images of droplet samples after droplet generation and 28 days of incubation. Bacterial colonies were not visible right after droplet generation (top). Negative control droplets remained empty throughout the entire incubation period (bottom left). A mixture of five Streptomyces strains (Table 1) was used as a positive control (middle). Co-encapsulated soil particles are visible as dark particles in the images of droplets with soil community (right). A variety of different morphologies were observed in droplets with soil community, ranging from different sizes and densities of cocci- and rod-shaped cells to filamentous growth (bottom right). Droplets with cell colonies are marked with arrows.
Figure 1—figure supplement 1
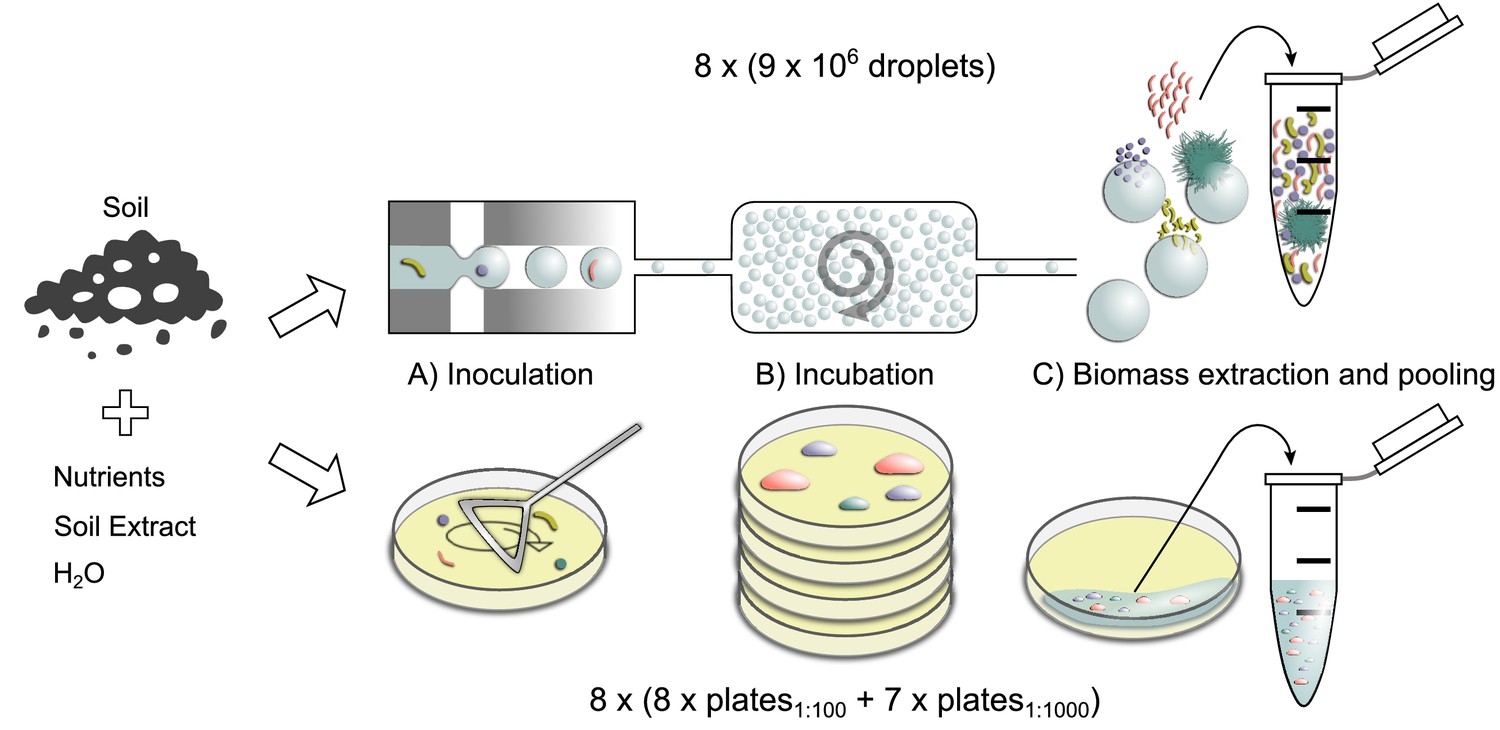
Workflow for the comparison of cultivation outcome obtained with in-droplet and agar plate cultivation.
Figure 1—figure supplement 2
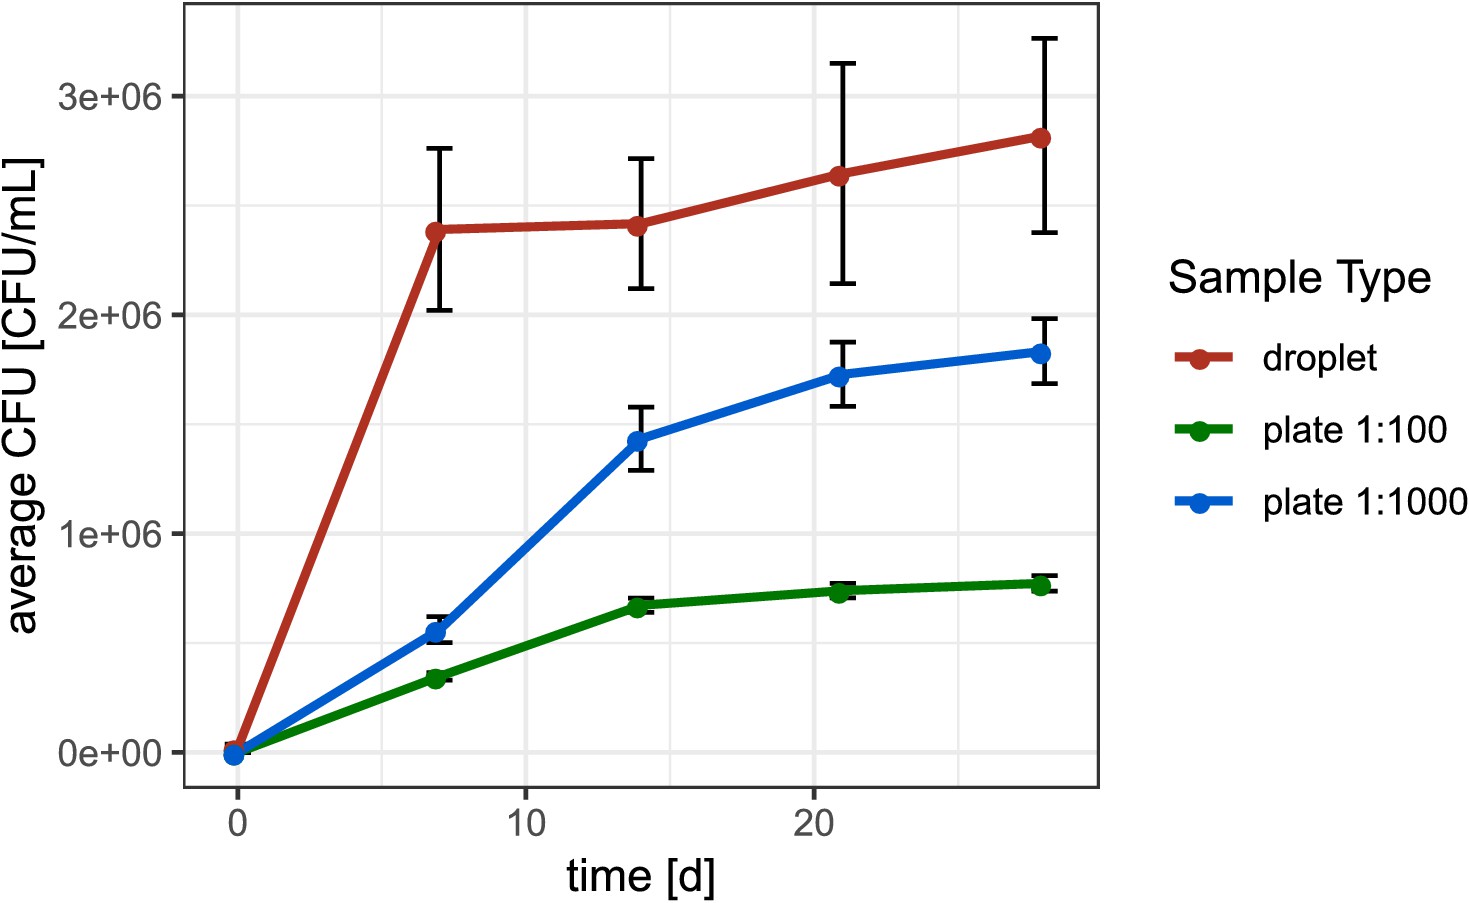
Average colony-forming unit (CFU) concentration over time with different cultivation methods.
Displayed is the average CFU concentration over time obtained for the extracted soil community by cultivating the soil community in droplets or on plates using the same media composition and equal incubation time. CFUs for in-droplet cultivation were determined by counting the relative abundance of droplets occupied with bacterial biomass via microscopic image analysis at given time points. We transferred abundance of occupied droplets to CFU under the assumption that one cell was initially encapsulated per occupied droplet. For example, among 1000 droplets in total 224 were occupied by colonies, meaning that in 200 nL droplet liquid (1000*200 pL) at least 224 CFU were contained. Considering the dilution of the soil community in medium to obtain droplet liquid, this amounts to 3 x 10⁶ CFU/mL of soil community in droplets. Error bars show the standard error of the mean.
Figure 2 with 1 supplement
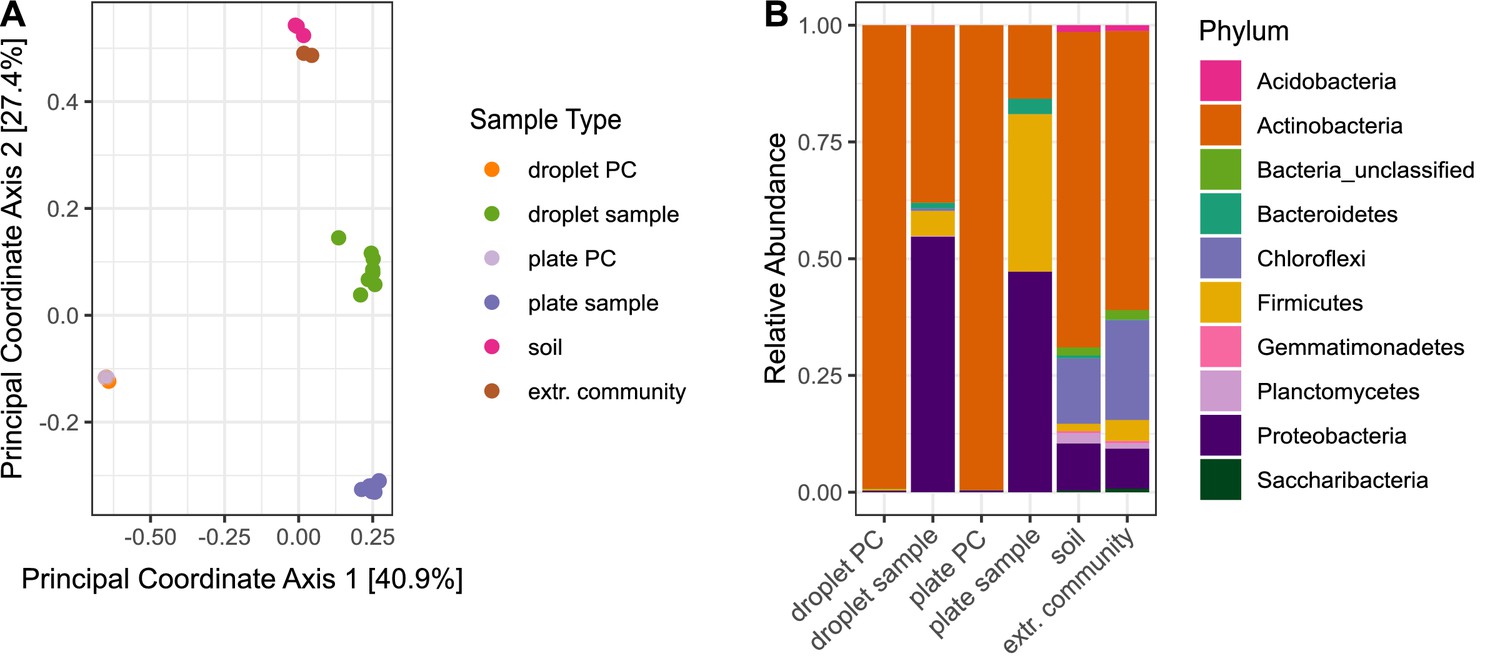
Differences in bacterial diversity due to cultivation technique.
Sample-type abbreviations represent the following: droplet PC – droplet-positive control of five selected Streptomyces strains (Table 1); droplet sample – droplet population inoculated with soil community; plate PC – plate-positive control of five selected Streptomyces strains; plate sample – agar plates inoculated with soil community; soil – original soil sample; extr. community – extracted soil community. (A) Principal coordinate analysis based on Bray–Curtis distance matrix visualized similarities between microbial communities. (B) Community structure based on Illumina amplicon sequencing of the 16S rRNA gene. The phylogenetic affiliation at the phylum level is displayed for each sample type. All samples for one sample type were merged. The bars depict the relative abundance of the 10 most abundant phyla.
-
Figure 2—source code 1
Source code for generation of both panels in Figure 2.
- https://cdn.elifesciences.org/articles/64774/elife-64774-fig2-code1-v2.zip
-
Figure 2—source data 1
Source data for both panels in Figure 2.
- https://cdn.elifesciences.org/articles/64774/elife-64774-fig2-data1-v2.rdata
Figure 2—figure supplement 1
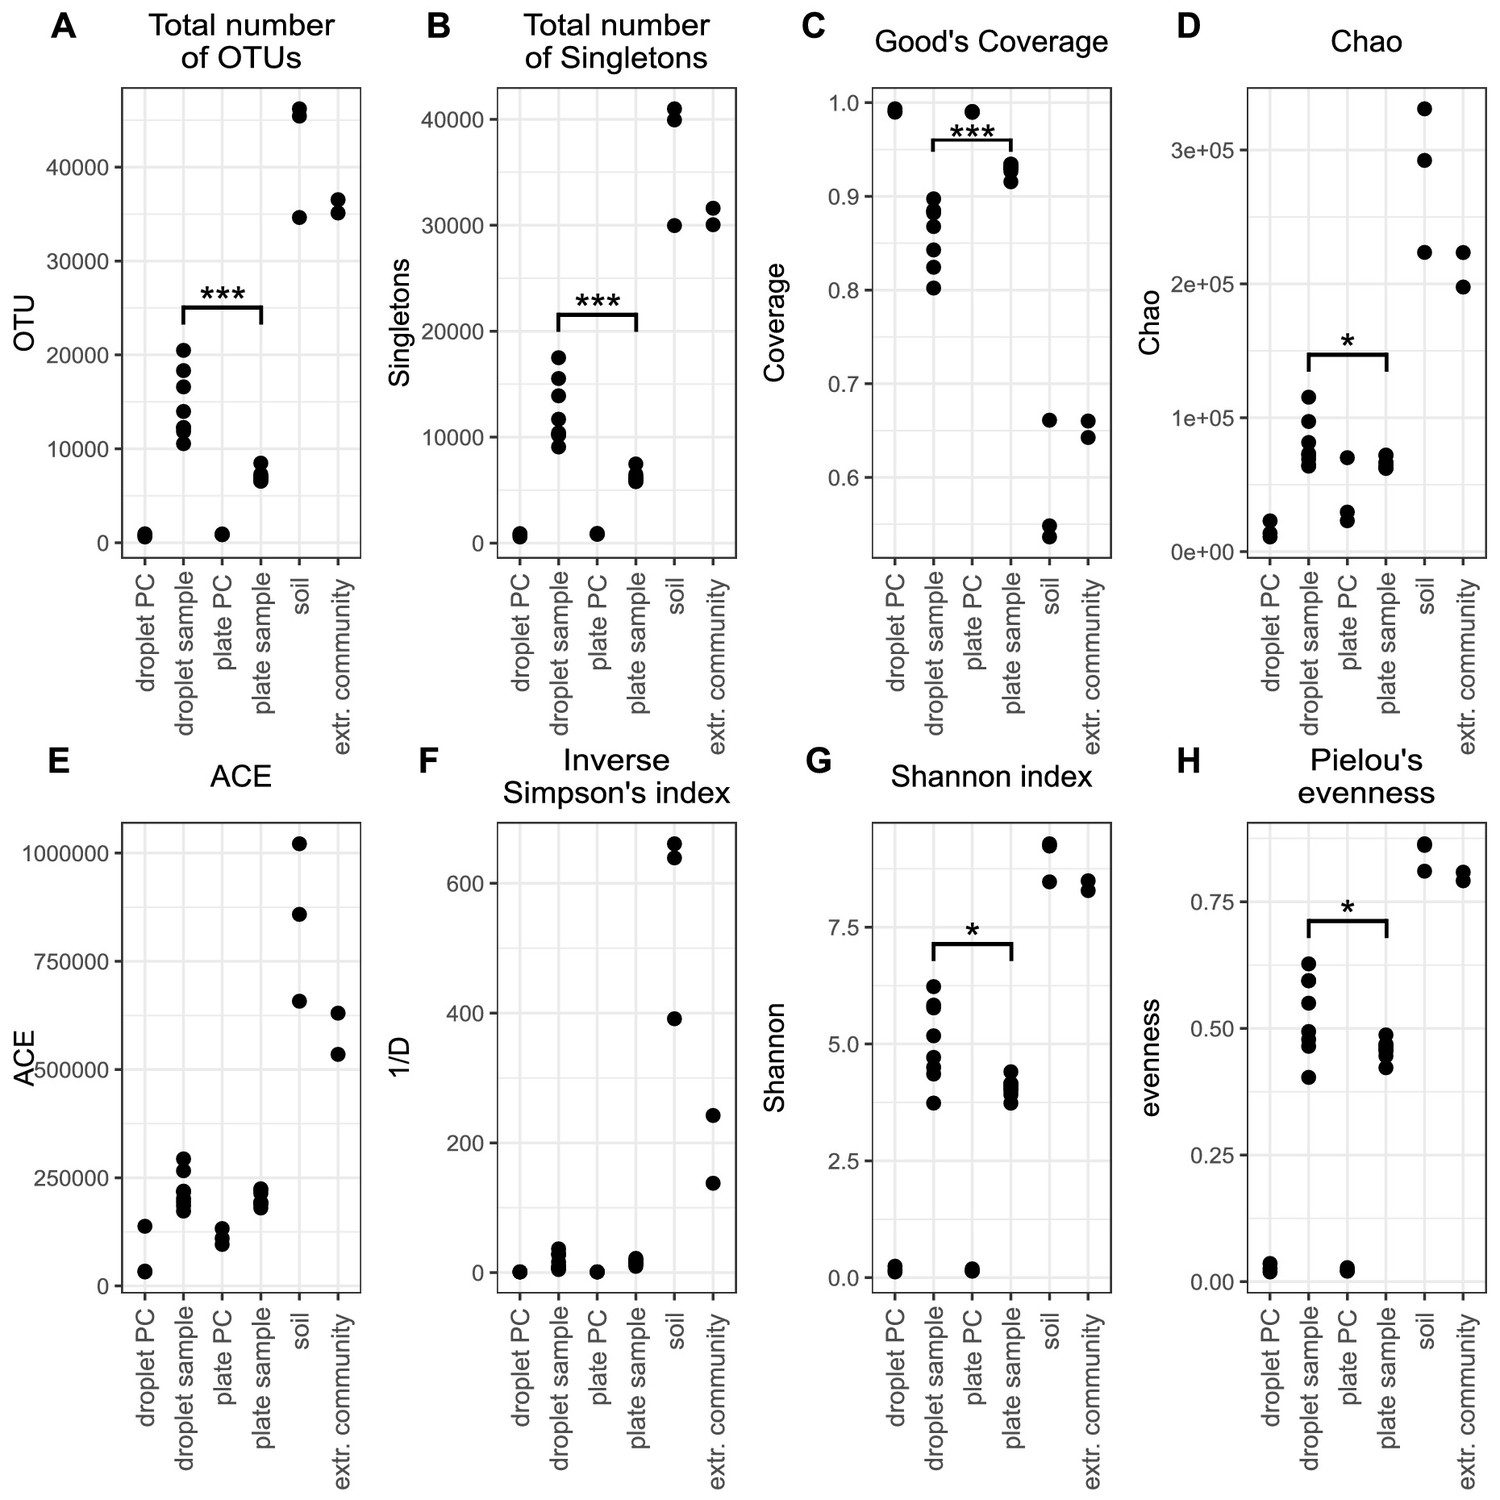
Alpha diversity indices for the subsampled 16S rDNA datasets with (A) total number of operational taxonimic units; (B) Total number of Singletons; (C) Good's Coverage; (D) Chao value; (E) Abundance-based Coverage Estimator (ACE); (F) Inverse Simpson's index; (G) Shannon index; and (H) Pielou's evenness.
Means between droplet sample and plate sample were tested by Wilcoxon rank-sum test. Cutoff for significance was p<0.05. *** Significant with p<0.001, * significant with p<0.05.
Figure 3 with 6 supplements
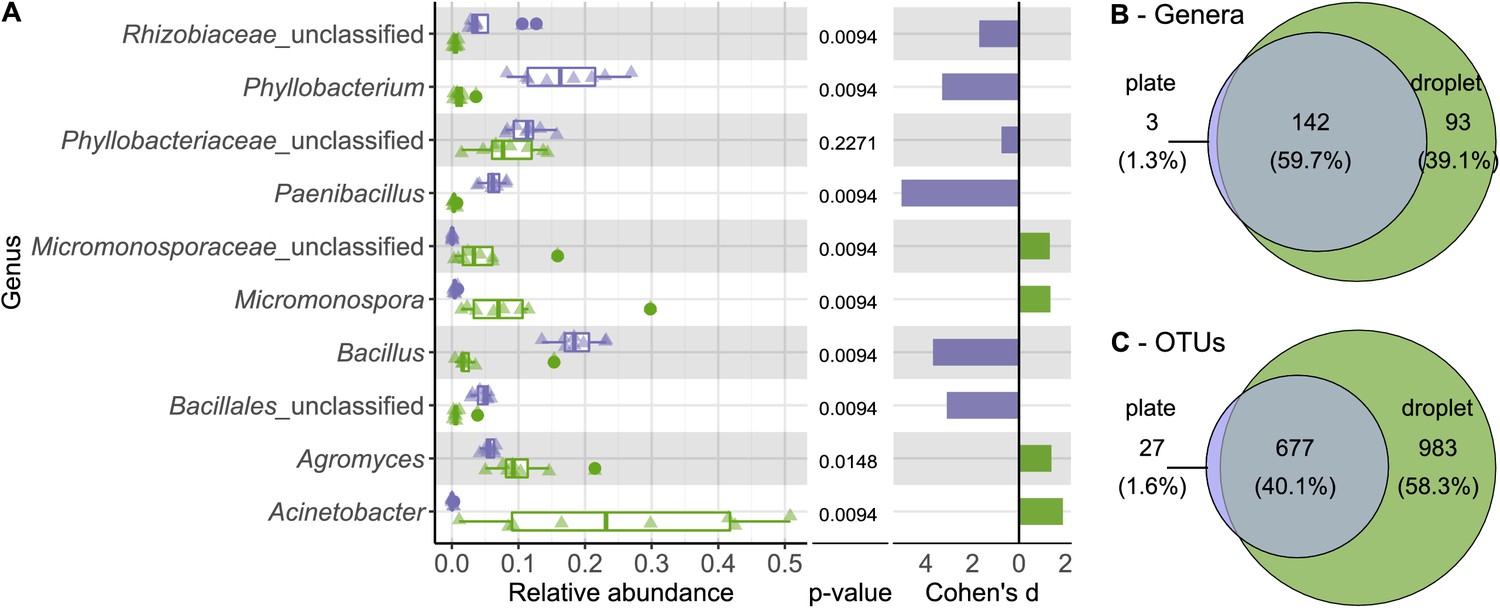
Comparing taxonomic classification on genus rank for replicating cells in agar plate and in-droplet cultivation.
(A) Triangles depict the relative abundances for genera in eight biological replicates per droplet and plate cultivation method. Underlying boxplots show the distribution of data points. Relative abundances of operational taxonomic units (OTU) (evolutionary distance of 0.03) were agglomerated on the genus level (evolutionary distance of 0.1). Displayed are the 10 most abundant genera of in total 238 assigned genera covering 66.8% of all sequences. The 30 most abundant genera covering a total of almost 90% are shown in Figure 3—figure supplement 5. Means of relative abundances were compared by Wilcoxon rank-sum test for each genus (α = 0.05), applying Holm–Bonferroni correction for multiple comparisons. Adjusted p-values are displayed. As effect size, Cohen’s d was computed and plotted as bars to indicate which differences are practically relevant. The direction and the color of the bars depend on the sample type in which the larger mean was found (blue – larger mean in plate samples, green – larger mean in droplet samples). (B) Venn diagram for the taxa on genus level. Of 238 assigned genera, 142 were found in both cultivation methods while 93 were unique to droplet cultivation and three were only observed in plate cultivation. The area of the Venn elements corresponds to the total number of genera found for the cultivation techniques. (C) Venn diagram for the OTU level. Of 1687 OTUs, 677 were found in both cultivation methods, 983 were unique to droplets, and 27 were unique to plates. The area of the Venn elements corresponds to the total number of OTUs found for the cultivation techniques.
-
Figure 3—source code 1
Source code for generation of (A) in Figure 3.
- https://cdn.elifesciences.org/articles/64774/elife-64774-fig3-code1-v2.zip
-
Figure 3—source code 2
Source code generating Figure 3—source data 2 and 3.
Taxa lists are used to generate Venn diagram in Figure 3B.
- https://cdn.elifesciences.org/articles/64774/elife-64774-fig3-code2-v2.zip
-
Figure 3—source code 3
Source code generating Figure 3—source data 4 and 5.
Taxa lists are used to generate Venn diagram in Figure 3C.
- https://cdn.elifesciences.org/articles/64774/elife-64774-fig3-code3-v2.zip
-
Figure 3—source data 1
Source data for all panels in Figure 3.
- https://cdn.elifesciences.org/articles/64774/elife-64774-fig3-data1-v2.rdata
-
Figure 3—source data 2
Source data generated from Figure 3—source data 1 containing all droplets genera for Figure 3B.
- https://cdn.elifesciences.org/articles/64774/elife-64774-fig3-data2-v2.txt
-
Figure 3—source data 3
Source data generated from Figure 3—source data 1 containing all plate genera for Figure 3B.
- https://cdn.elifesciences.org/articles/64774/elife-64774-fig3-data3-v2.txt
-
Figure 3—source data 4
Source data generated from Figure 3—source data 1 containing all droplet operational taxonomic units for Figure 3C.
- https://cdn.elifesciences.org/articles/64774/elife-64774-fig3-data4-v2.txt
-
Figure 3—source data 5
Source data generated from Figure 3—source data 1 containing all plate operational taxonomic units for Figure 3C.
- https://cdn.elifesciences.org/articles/64774/elife-64774-fig3-data5-v2.txt
Figure 3—figure supplement 1
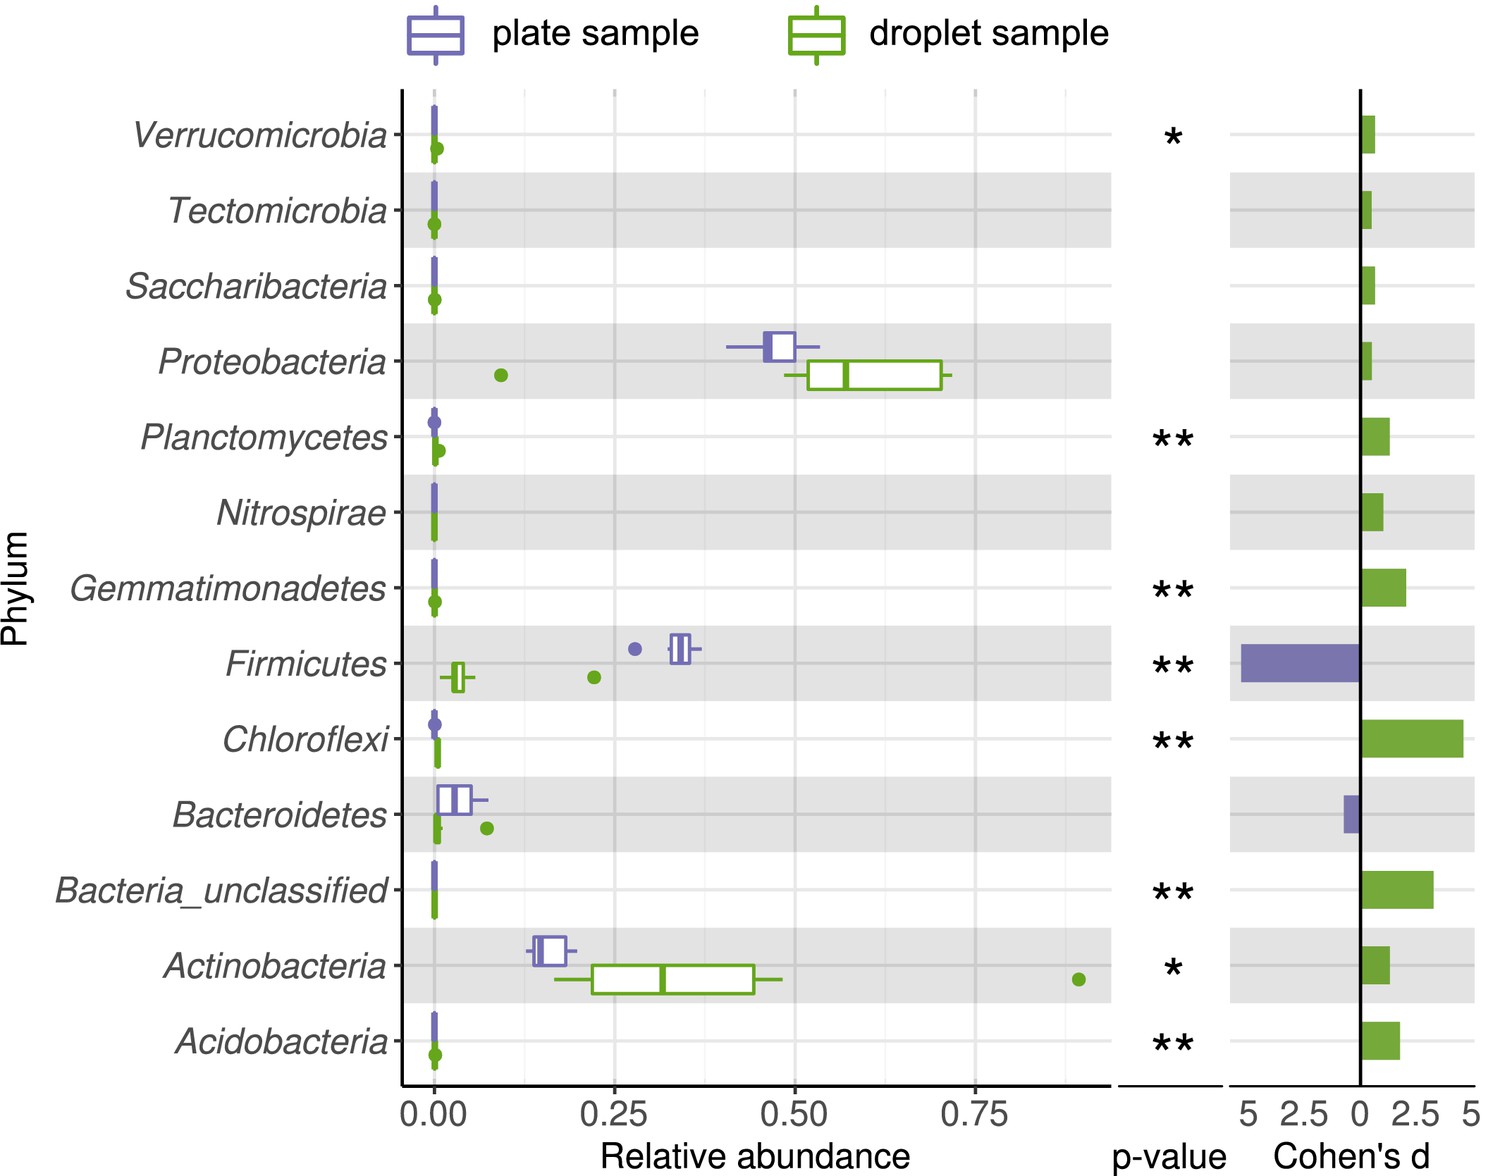
Comparing taxonomic classification on phylum rank for replicating cells in agar plate and in-droplet cultivation.
Boxplots depict the distribution of relative abundances for phyla in droplet and plate cultivation samples. Relative abundances of operational taxonomic units were agglomerated on the phylum level. Displayed are 13 assigned phyla covering 100% of all sequences. Means of relative abundances were compared by Wilcoxon rank-sum test for each phylum (α = 0.05), applying Holm–Bonferroni correction for multiple comparisons. ** Significant with p<0.01, * significant with p<0.05. As effect size, Cohen's d was computed and plotted as bars to indicate which differences are practically relevant. The direction and the color of the bars depend on the sample type in which the larger mean was found (blue – larger mean in plate samples, green – larger mean in droplet samples).
Figure 3—figure supplement 2
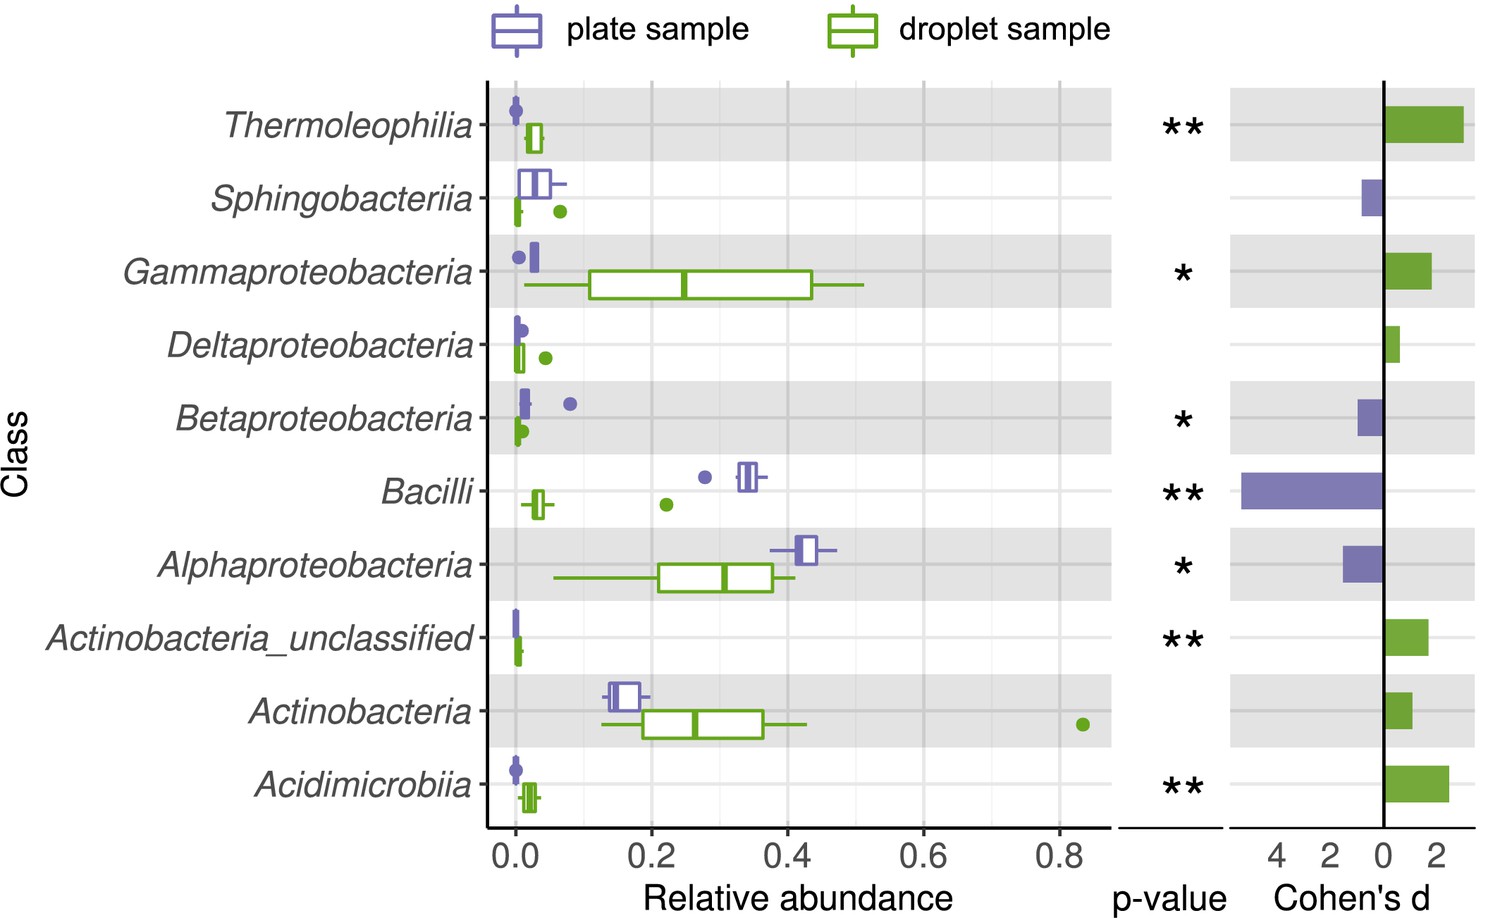
Comparing taxonomic classification on class rank for replicating cells in agar plate and in-droplet cultivation.
Boxplots depict the distribution of relative abundances for phyla in droplet and plate cultivation samples. Relative abundances of operational taxonomic units were agglomerated on the class level. Displayed are the 10 most abundant classes of in total 41 assigned classes covering 99.42% of all sequences. Means of relative abundances were compared by Wilcoxon rank-sum test for each class (α = 0.05), applying Holm–Bonferroni correction for multiple comparisons. ** Significant with p<0.01, * significant with p<0.05. As effect size, Cohen's d was computed and plotted as bars to indicate which differences are practically relevant. The direction and the color of the bars depend on the sample type in which the larger mean was found (blue – larger mean in plate samples, green – larger mean in droplet samples).
Figure 3—figure supplement 3
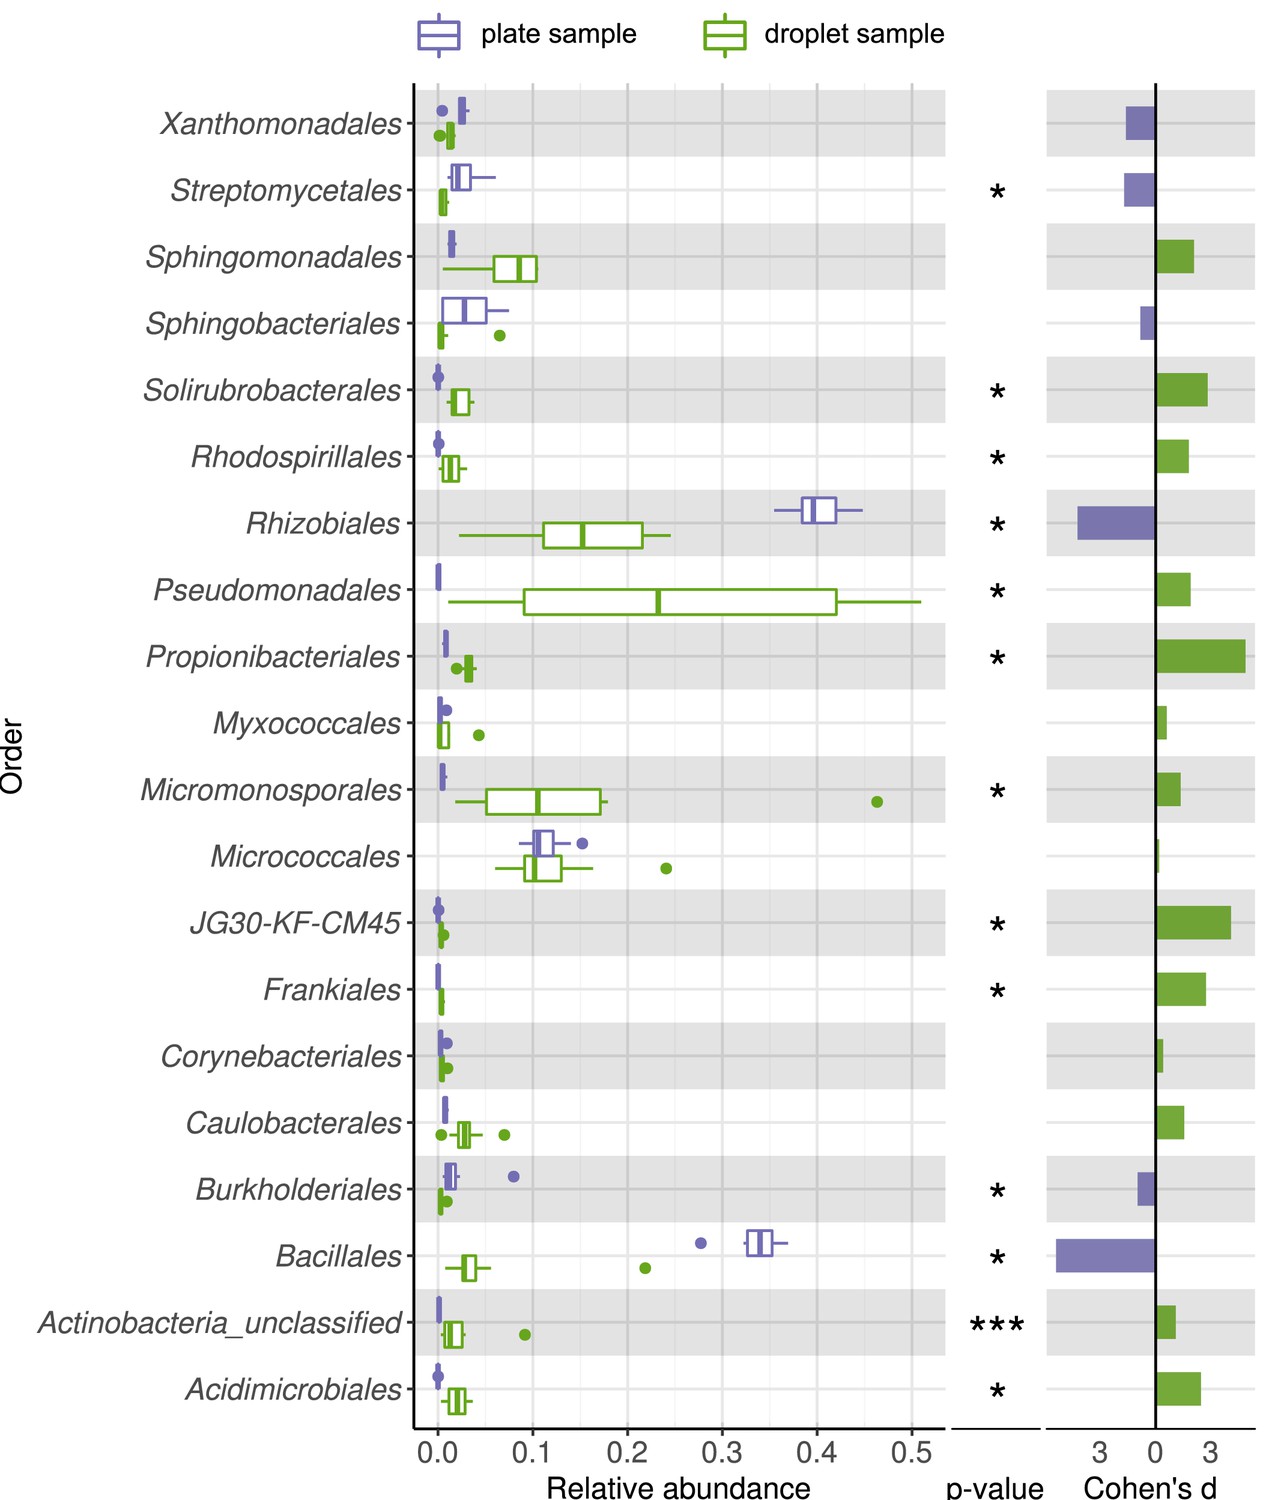
Comparing taxonomic classification on order rank for replicating cells in agar plate and in-droplet cultivation.
Boxplots depict the distribution of relative abundances for phyla in droplet and plate cultivation samples. Relative abundances of operational taxonomic units were agglomerated on the order level. Displayed are the 20 most abundant orders of in total 72 assigned orders covering 99.03% of all sequences. Means of relative abundances were compared by Wilcoxon rank-sum test for each order (α = 0.05), applying Holm–Bonferroni correction for multiple comparisons. ** Significant with p<0.01, * significant with p<0.05. As effect size, Cohen's d was computed and plotted as bars to indicate which differences are practically relevant. The direction and the color of the bars depend on the sample type in which the larger mean was found (blue – larger mean in plate samples, green – larger mean in droplet samples).
Figure 3—figure supplement 4
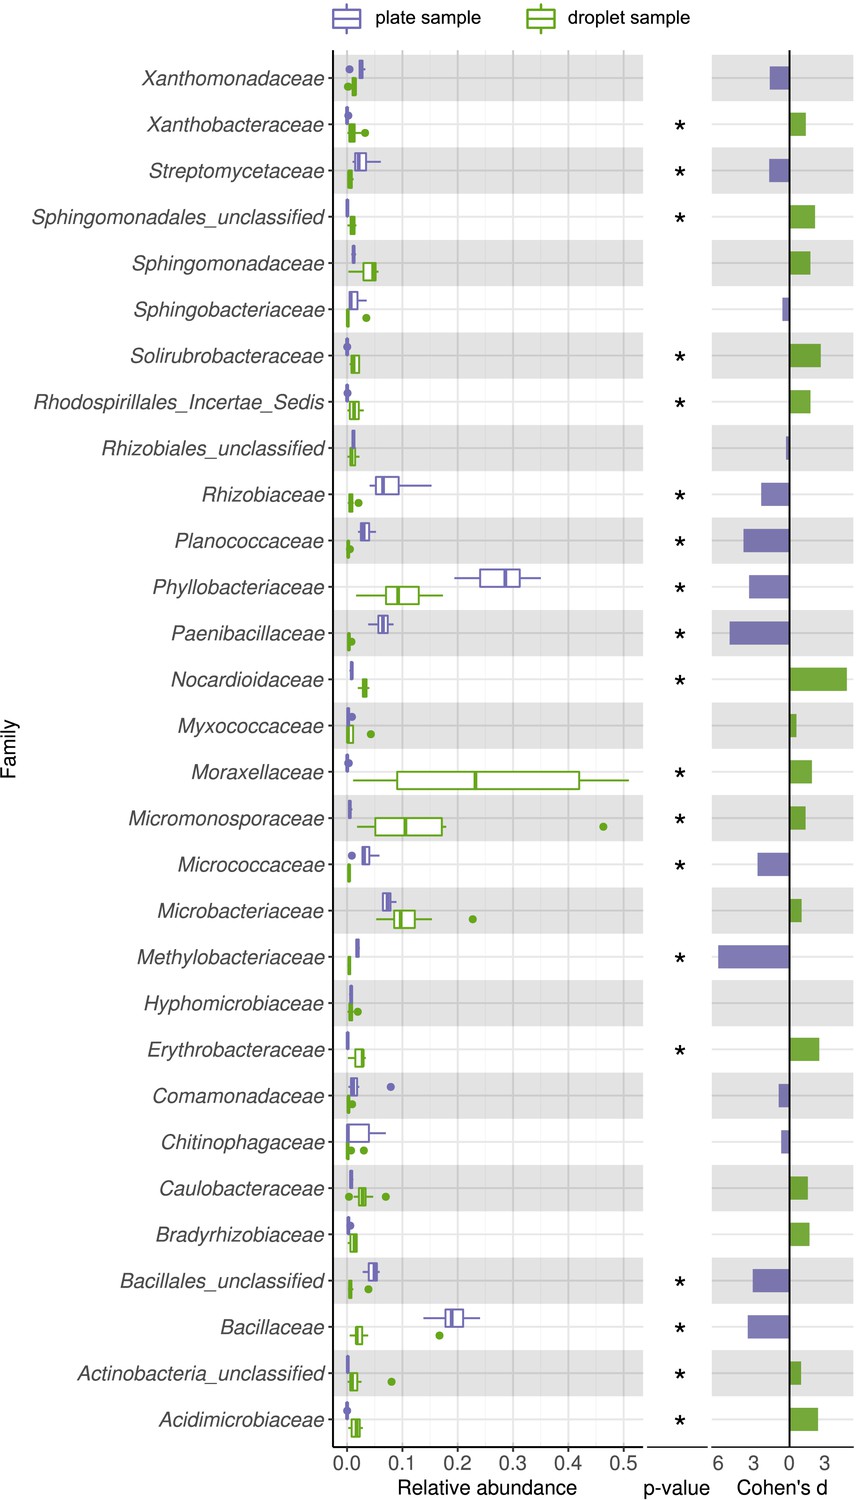
Comparing taxonomic classification on family rank for replicating cells in agar plate and in-droplet cultivation.
Boxplots depict the distribution of relative abundances for phyla in droplet and plate cultivation samples. Relative abundances of operational taxonomic units were agglomerated on the family level. Displayed are the 30 most abundant classes of in total 144 assigned families covering 96.37% of all sequences. Means of relative abundances were compared by Wilcoxon rank-sum test for each family (α = 0.05), applying Holm–Bonferroni correction for multiple comparisons. ** Significant with p<0.01, * significant with p<0.05. As effect size, Cohen's d was computed and plotted as bars to indicate which differences are practically relevant. The direction and the color of the bars depend on the sample type in which the larger mean was found (blue – larger mean in plate samples, green – larger mean in droplet samples).
Figure 3—figure supplement 5
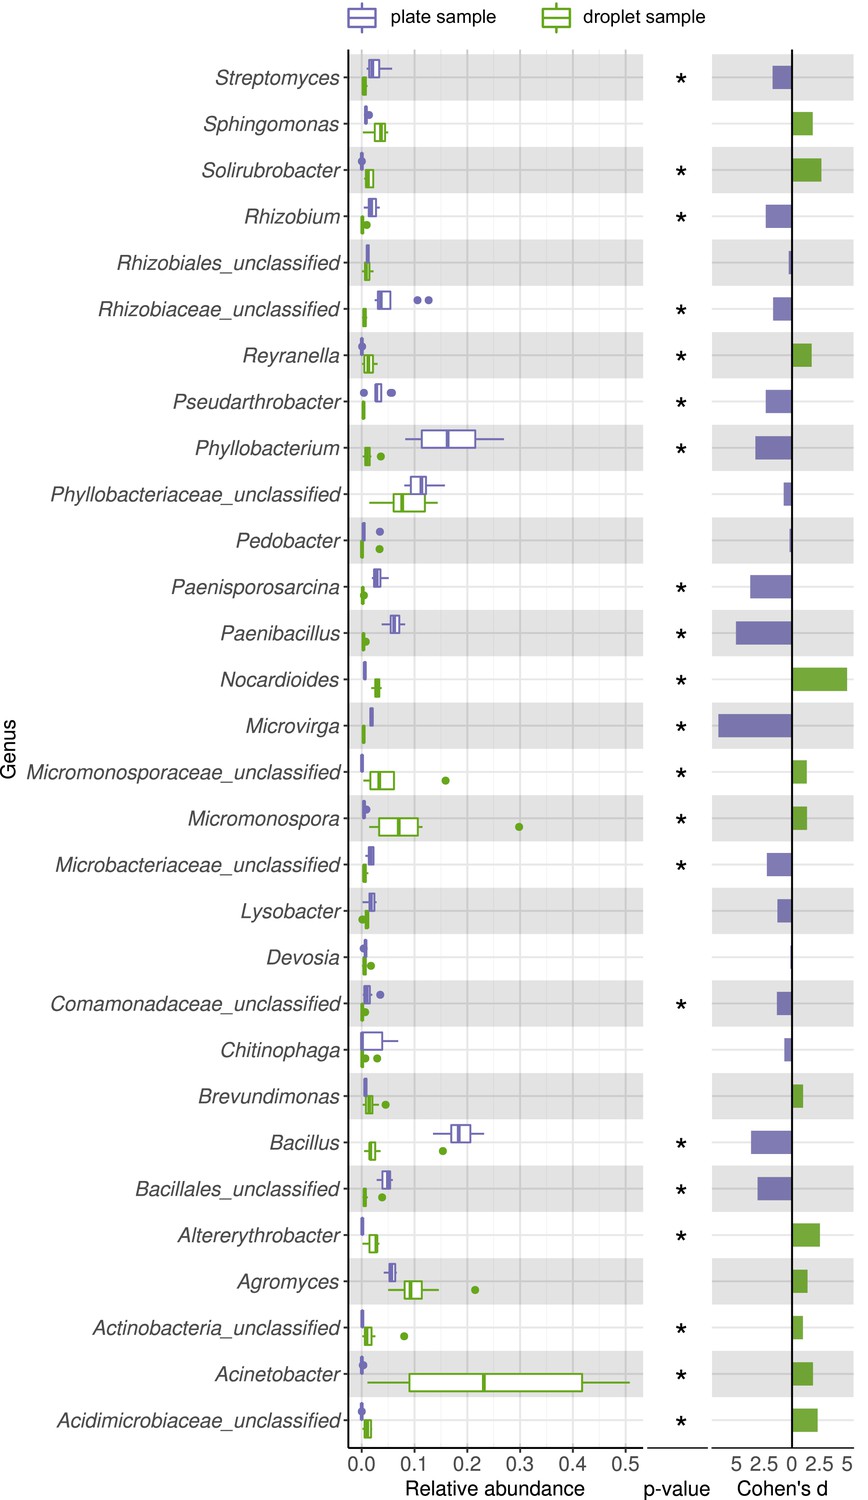
Comparing taxonomic classification on genus rank for replicating cells in agar plate and in-droplet cultivation.
Boxplots depict the distribution of relative abundances for phyla in droplet and plate cultivation samples. Relative abundances of operational taxonomic units were agglomerated on the genus level. Displayed are the 30 most abundant genera of in total 240 assigned genera covering 89.54% of all sequences. Means of relative abundances were compared by Wilcoxon rank-sum test for each genus (α = 0.05), applying Holm–Bonferroni correction for multiple comparisons. ** Significant with p<0.01, * significant with p<0.05. As effect size, Cohen's d was computed and plotted as bars to indicate which differences are practically relevant. The direction and the color of the bars depend on the sample type in which the larger mean was found (blue – larger mean in plate samples, green – larger mean in droplet samples).
Figure 3—figure supplement 6
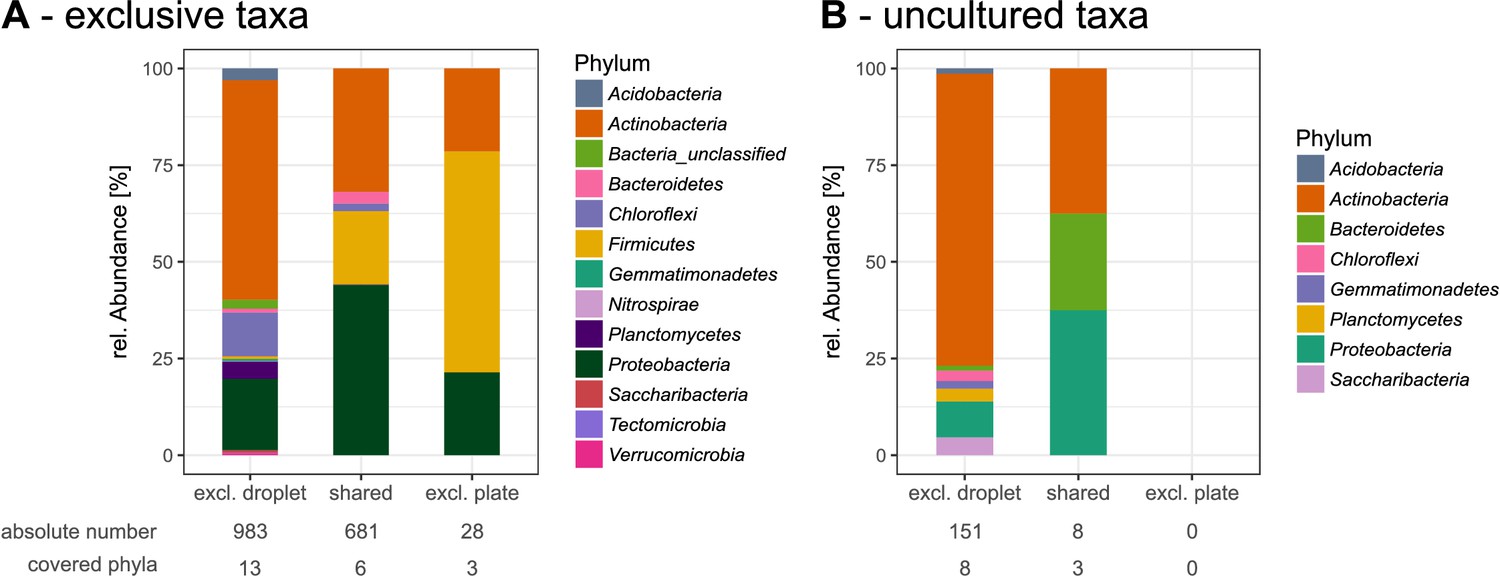
Detailed view into exclusive and uncultured taxa found in droplets or on plates.
(A) Overview of taxa that were exclusively found in droplet samples and/or plate samples with taxonomic classification on the phylum level. (B) Overview of the exclusive taxa that were classified as uncultured found in droplet and/or plate samples. Taxa that were unclassified on the genus level and likely belong to the uncultured category were not considered for this comparison.
Figure 4
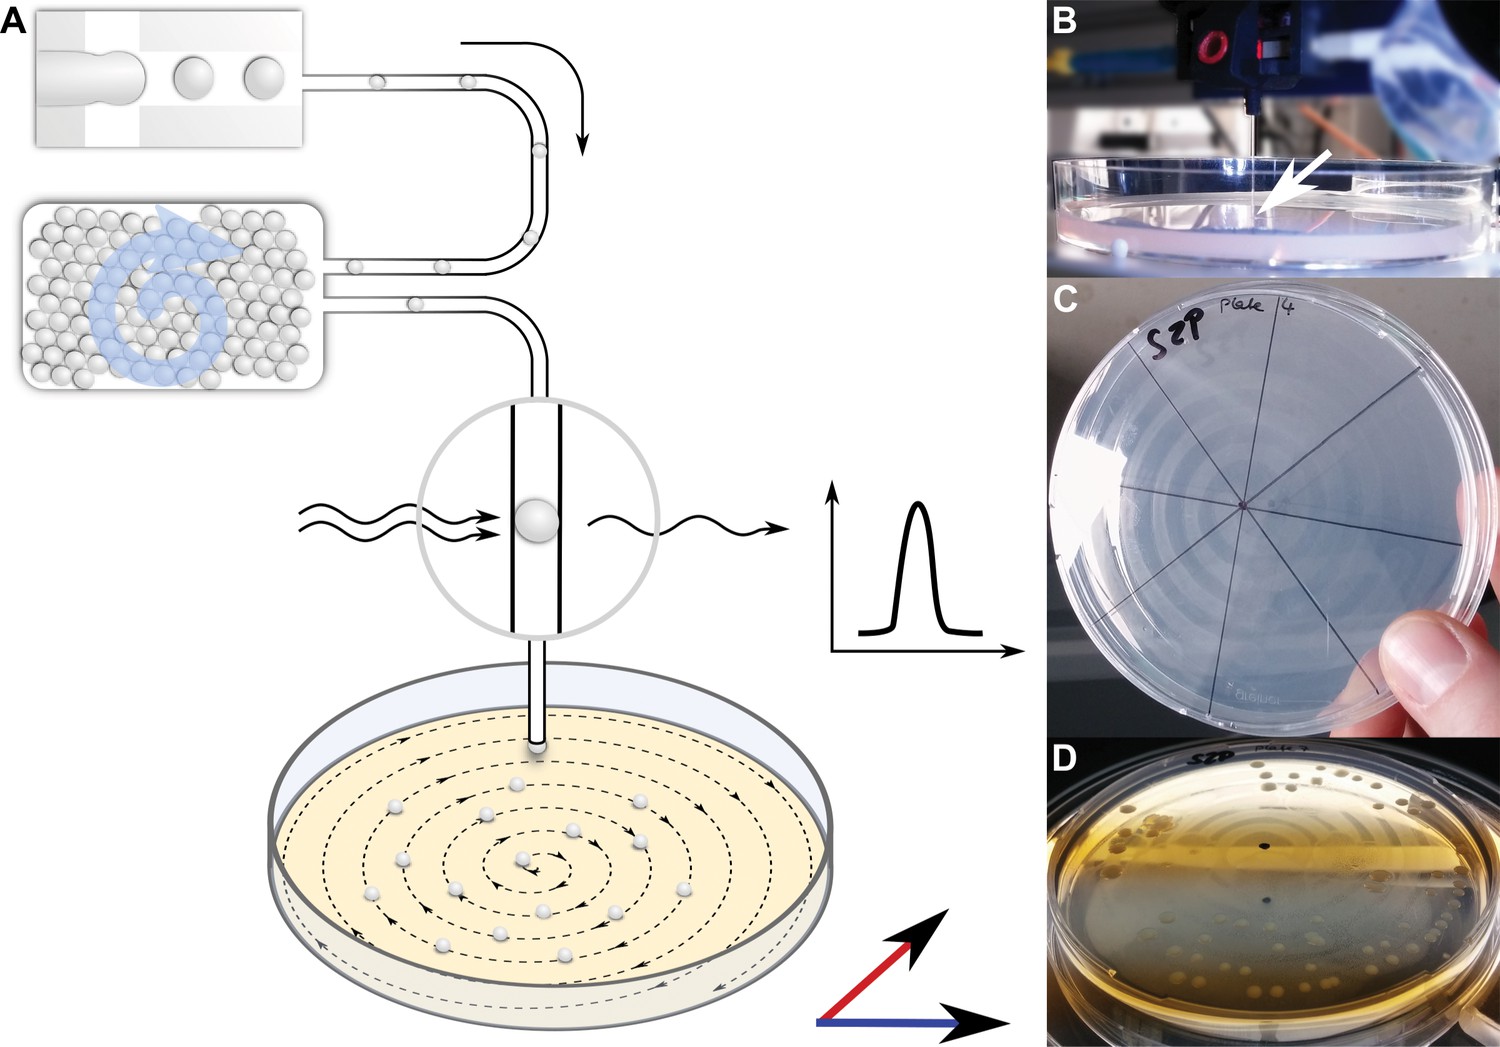
Continuous droplet deposition of preincubated droplets on an agar plate.
(A) Sketch of continuous droplet deposition workflow. Droplets inoculated with cells of the soil community were incubated for 1 month before they were injected into a capillary (100 µm ID) positioned above an agar plate. The agar plate moved in x–y direction at a speed of 1 mm/s, while the droplets were injected at 10–50 droplets/s. The droplet frequency was monitored by a custom-developed sensor. (B) Image of the capillary taken while droplets are deposited on an agar plate. The tip of the capillary is highlighted by a white arrow. The capillary tip is close to the agar surface in order to establish a continuous fluid film. (C) An agar plate immediately after droplet deposition with the dried oil film in the spiral pattern of continuous deposition. (D) An agar plate with deposited droplets after incubation for 2 weeks. The dried oil film is still visible, on which the bacterial colonies are now aligned.
Figure 5
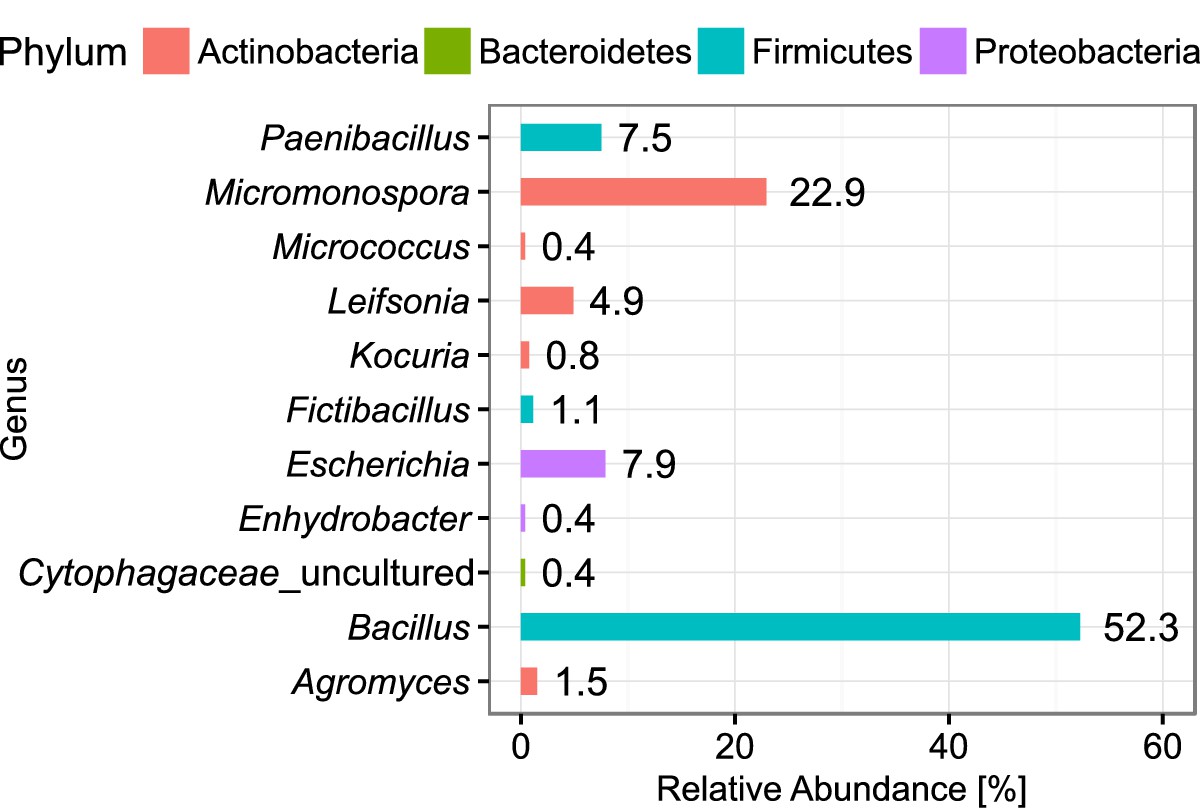
Abundance of classified bacterial isolates obtained from droplet cultivation.
The distribution of abundance on the genus rank is displayed. Colors of the bars indicate the affiliation to phyla. Each bar is labeled with its exact relative abundance.
-
Figure 5—source code 1
Source code for generation of Figure 5.
- https://cdn.elifesciences.org/articles/64774/elife-64774-fig5-code1-v2.zip
-
Figure 5—source data 1
Source data for Figure 5.
- https://cdn.elifesciences.org/articles/64774/elife-64774-fig5-data1-v2.csv
Figure 6 with 1 supplement

Taxonomic diversity of isolates obtained in the screening for antibiotic producers.
The classification is depicted on the level of order and based on the Sanger sequences of the nearly complete 16S rRNA gene. The bars depict the relative abundance of all detected orders for the isolates of all four screening rounds combined and for each screening round separately.
-
Figure 6—source code 1
Source code for generation of Figure 6.
- https://cdn.elifesciences.org/articles/64774/elife-64774-fig6-code1-v2.zip
-
Figure 6—source data 1
Source data for Figure 6.
- https://cdn.elifesciences.org/articles/64774/elife-64774-fig6-data1-v2.csv
Figure 6—figure supplement 1

Maximum Iikelihood tree based on nearly full-length 16S rRNA gene sequence.
The tree shows the phylogenetic placement of isolates among type strains belonging to the Cytophagaceae. Bootstrap values (100 resamplings) are indicated at nodes. Isolate names starting with D were obtained in the antimicrobials-targeted isolation, while S-11-23-2/1/1 was isolated in the untargeted approach.
Figure 7 with 5 supplements

Detected natural product arsenal of Bacillus sp. strain D121-0906-b3-2-1.
(A) Metabolic profiles of Bacillus sp. extracts under different growth and extraction conditions detected by liquid chromatography coupled to high resolution mass spectrometry (LC-HRMS) (displayed as extracted ion chromatograms in negative mode). (B) Bacillaene A (1) and B (2) and (C) surfactin-like compounds (3–5) detected in extracts of Bacillus sp. isolate D121-0906-b3-2-1. Tandem mass spectromety (MS/MS) spectra for 1–5 are provided in Figure 7—figure supplements 4 and 5.
Figure 7—figure supplement 1
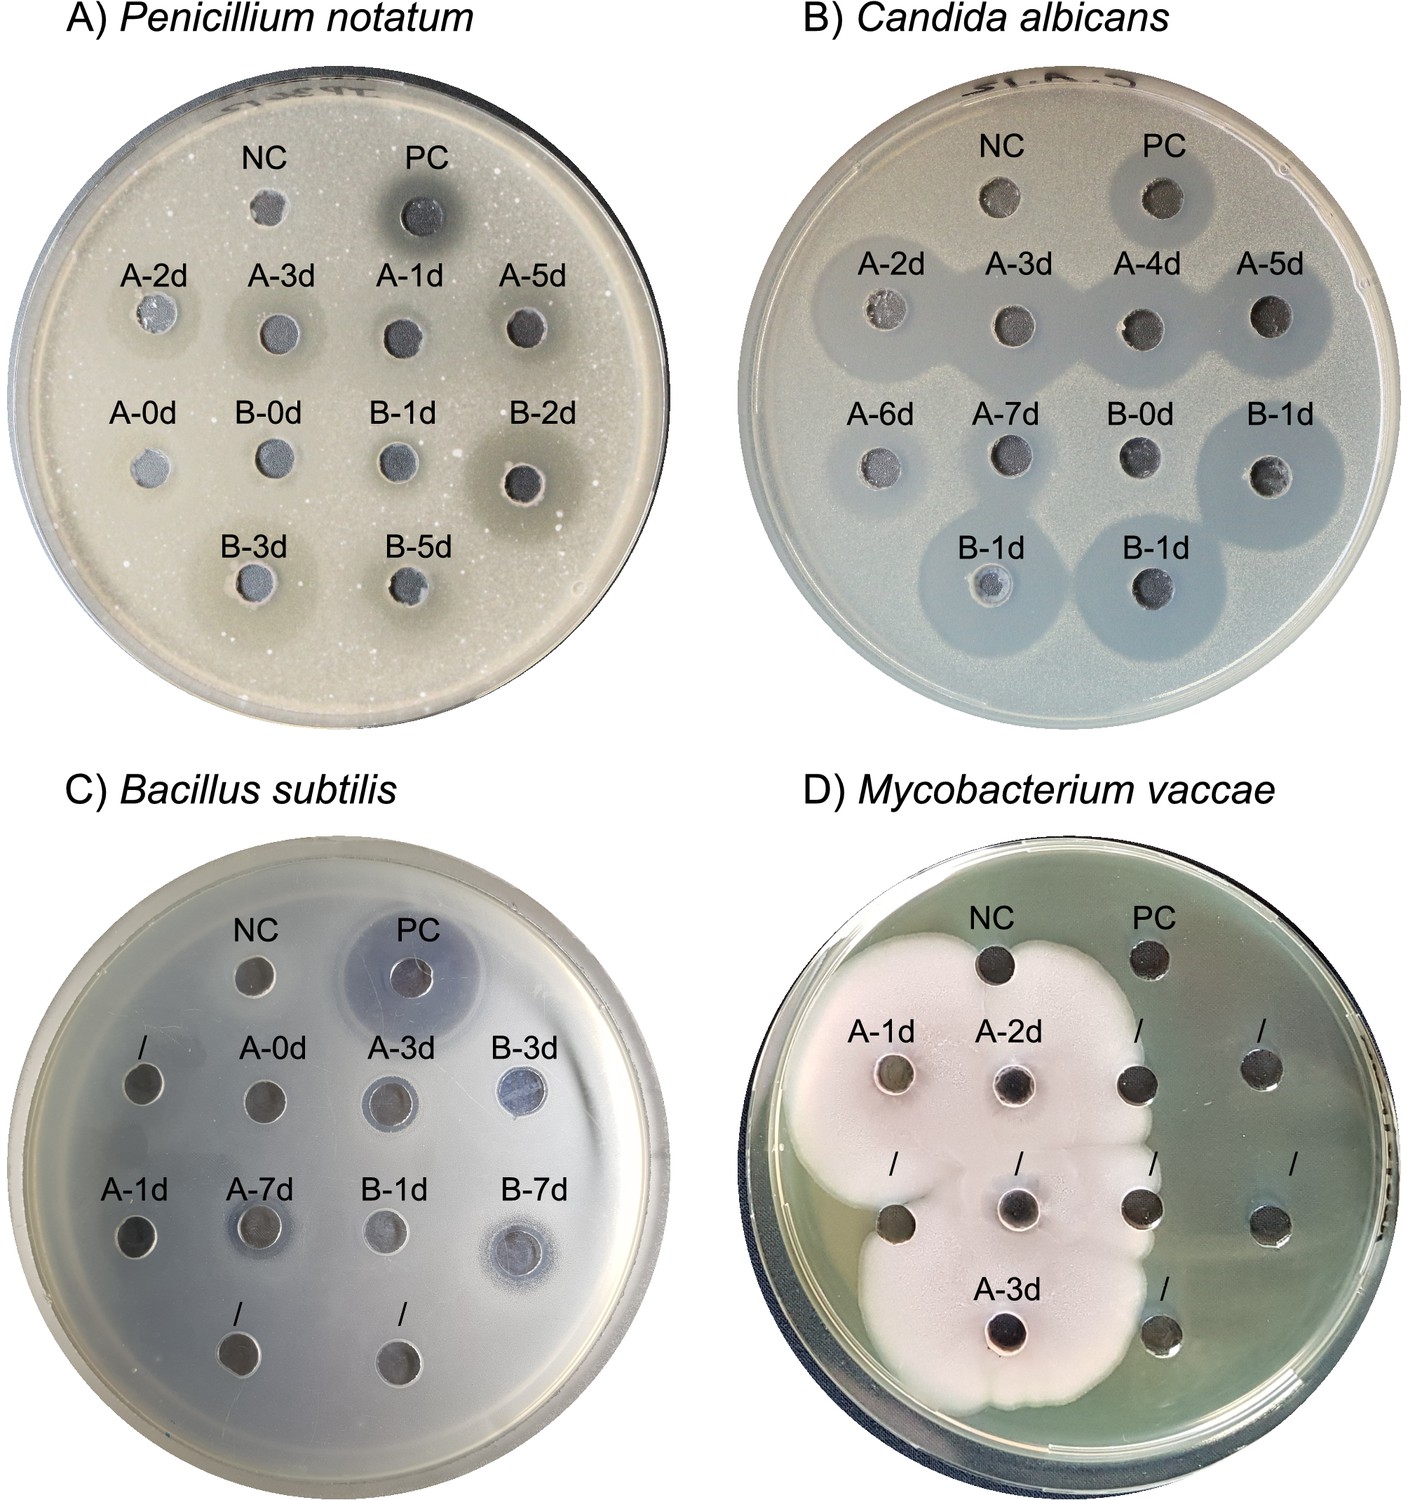
Primary screening validation bioactivity assays with D121-0906-b3-2-1 crude culture supernatant and selected test strains.
Test strains suspended in the agar are indicated in panel captions. Label denotes the medium, in which D121-0906-b3-2-1 was cultivated and the duration of incubation at sampling time point. (A, B) Medium A – MGY; medium B – MGY + Gluc; NC, negative control – MGY only; PC, positive control – amphotericin B antibiotic. (C) Medium A – MGY; medium B – 0.5 SM + Gluc; NC – 0.5S M; PC – chlortetracycline. (D) Medium A – 0.5 SM; NC, negative control – 0.5 SM; PC, positive control – ciprofloxacin antibiotic. The plate was incubated for 18 hr at imaging and is displayed as an example for the rapid growth of the Bacillus isolate when in contact with M. vaccae. For determining the antimicrobial activity of the isolate against M. vaccae further bioactivity plates were prepared with filtered (0.2 µm pore size) culture supernatant.
Figure 7—figure supplement 2
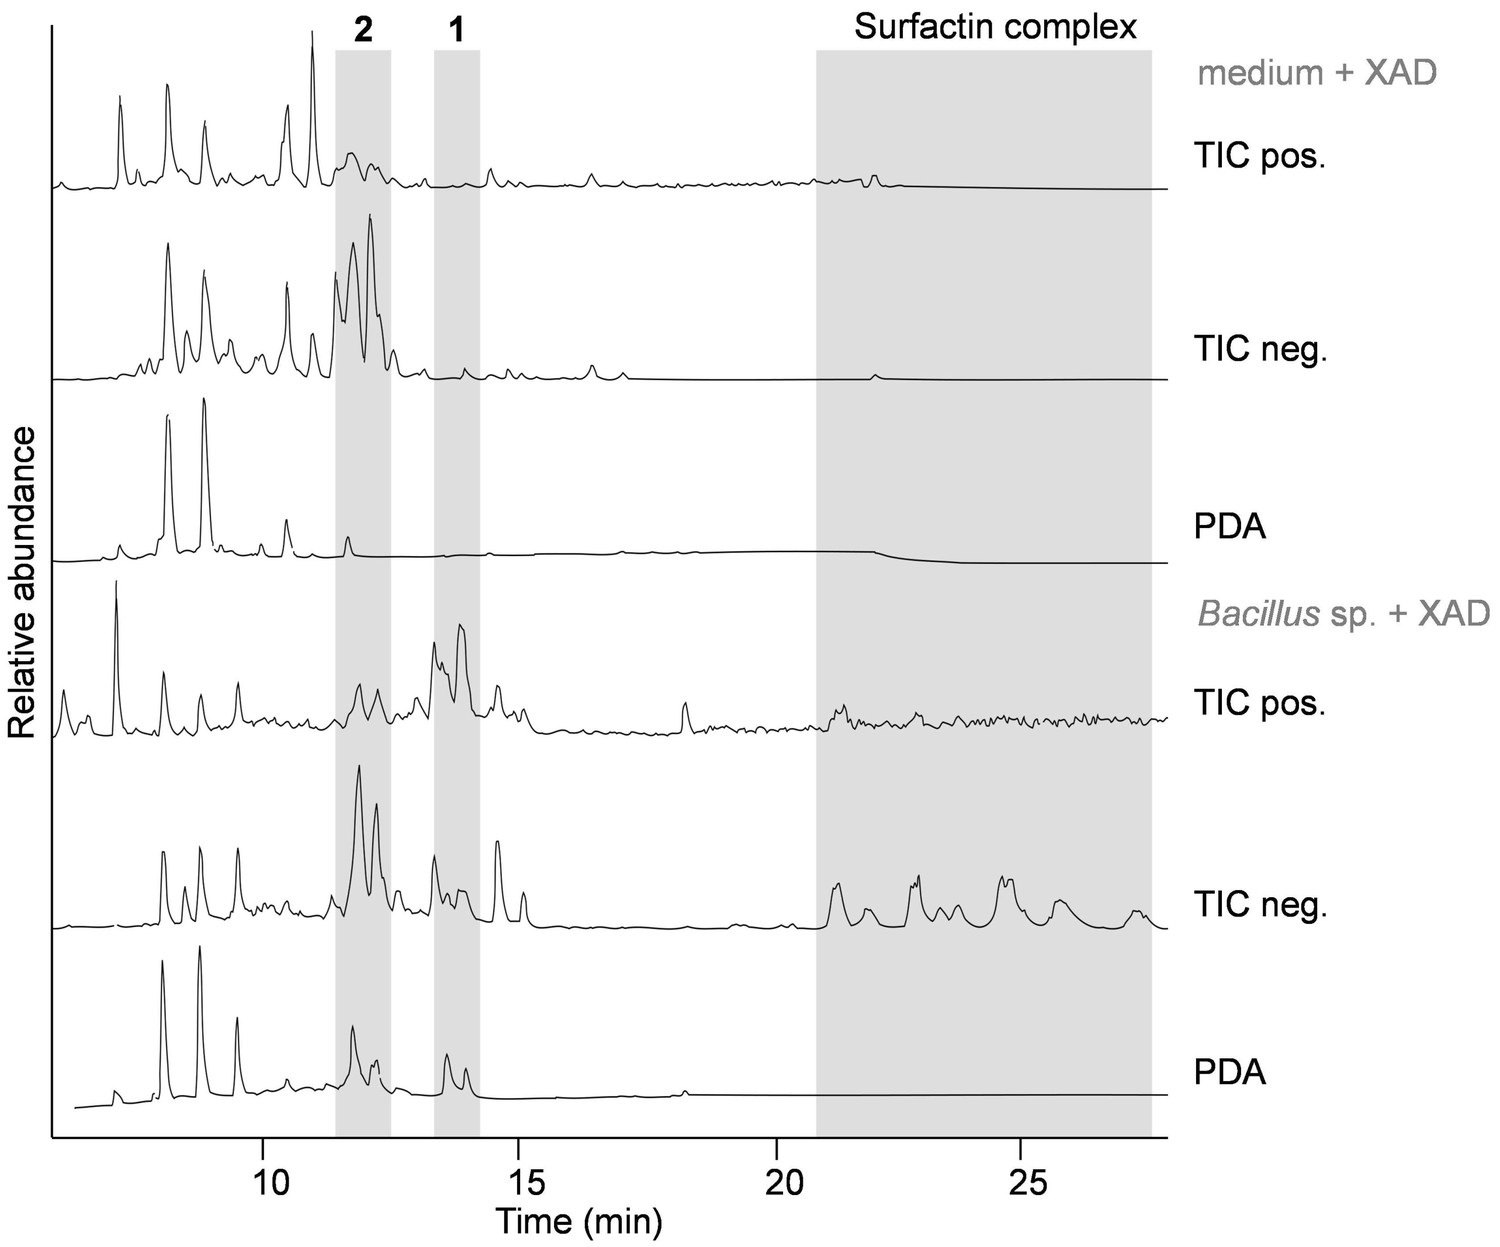
Metabolic profile of Bacillus sp. D121-0906-b3-2-1 (lower panels, soy mannitol medium + cold-extracted soil extract [CESE], 5 days cultivation, XAD adsorber extraction) in comparison to medium control (soy mannitol medium + CESE, XAD extraction).
Relative intensity according to highest peak in spectrum. Photodiode array signal (PDA) 210–600 nm. Surfactin complex including compounds 3–5. TIC: total ion chromatogram.
Figure 7—figure supplement 3
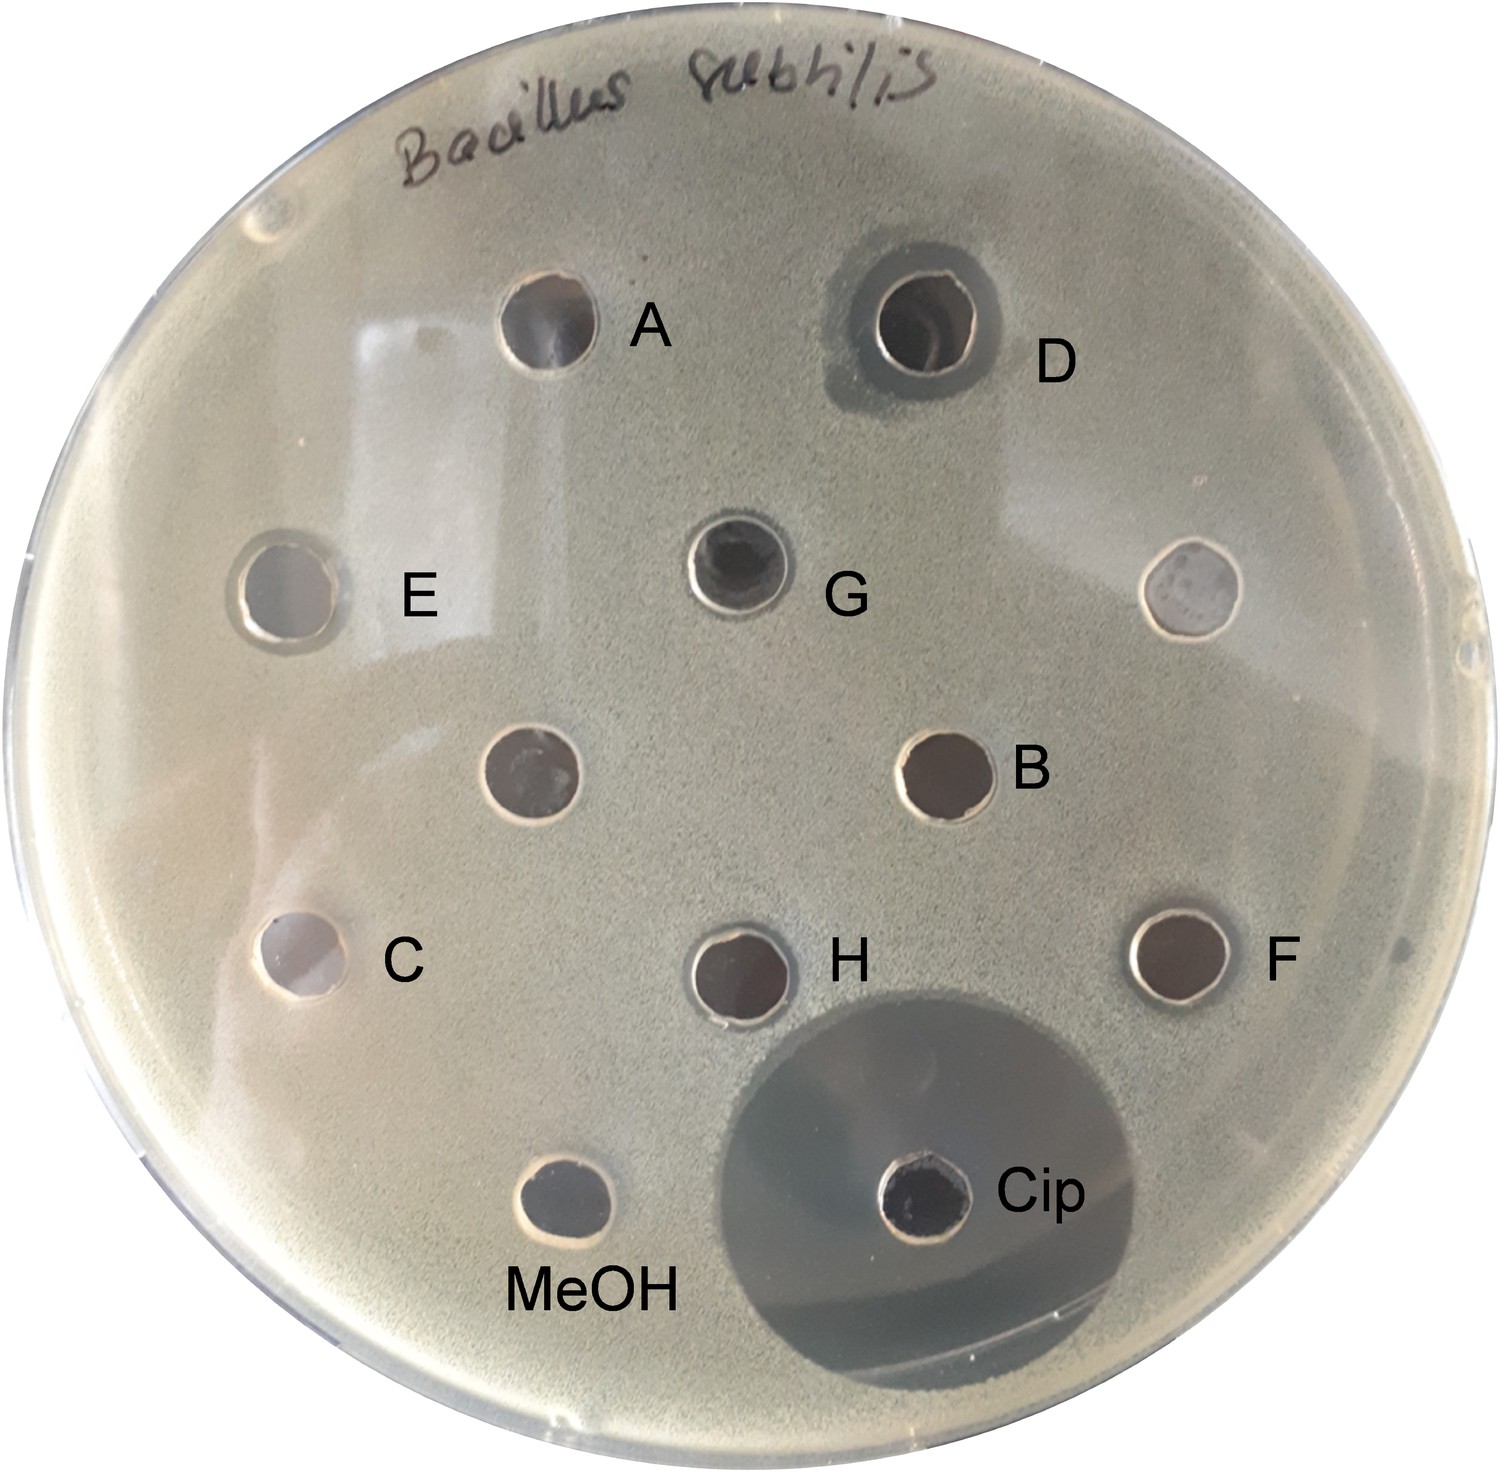
Bioactivity assay with diluted fractions of Bacillus sp. extract against B. subtilis.
Fraction D contains bacillaenes, fractions G–H contain surfactins. Cip: ciprofloxacin; MeOH: methanol; A–H: fractions collected from a crude extract from Bacillus sp.
Figure 7—figure supplement 4

Characterization for bacillaene-like compounds (1 and 2) in extracts of Bacillus sp. isolate D121-0906-b3-2-1.
Physicochemical properties of bacillaene A (1) and B (2): (1) electrospray ionization ESI(–) m/z 579 [M–H]–, high resolution electrospray ionization HRESI(–)-MS m/z 579.3454 (calcd. for C34H47 N2O6 579.3434); (2) ESI(–) m/z 741 [M–H]–, HRESI(–)-MS m/z 741.3990 (calcd. for C40H57 N2O11 741.3962). (A) Extracted ion chromatograms in negative mode of 1 and 2. (B) UV absorption spectrum of 1. (C) Tandem mass spectrometry (MS/MS) fragmentation pattern of m/z 579.3454 [M–H]– (1) in negative mode. (D) MS/MS fragmentation pattern of m/z 741.3987 [M–H]– (2) in negative mode. (E) MS/MS fragmentation pattern of m/z 581.3575 [M+H]+ (1) in positive mode. (F) MS/MS fragmentation pattern of m/z 743.4119 [M+H]+ (2) in positive mode.
Figure 7—figure supplement 5
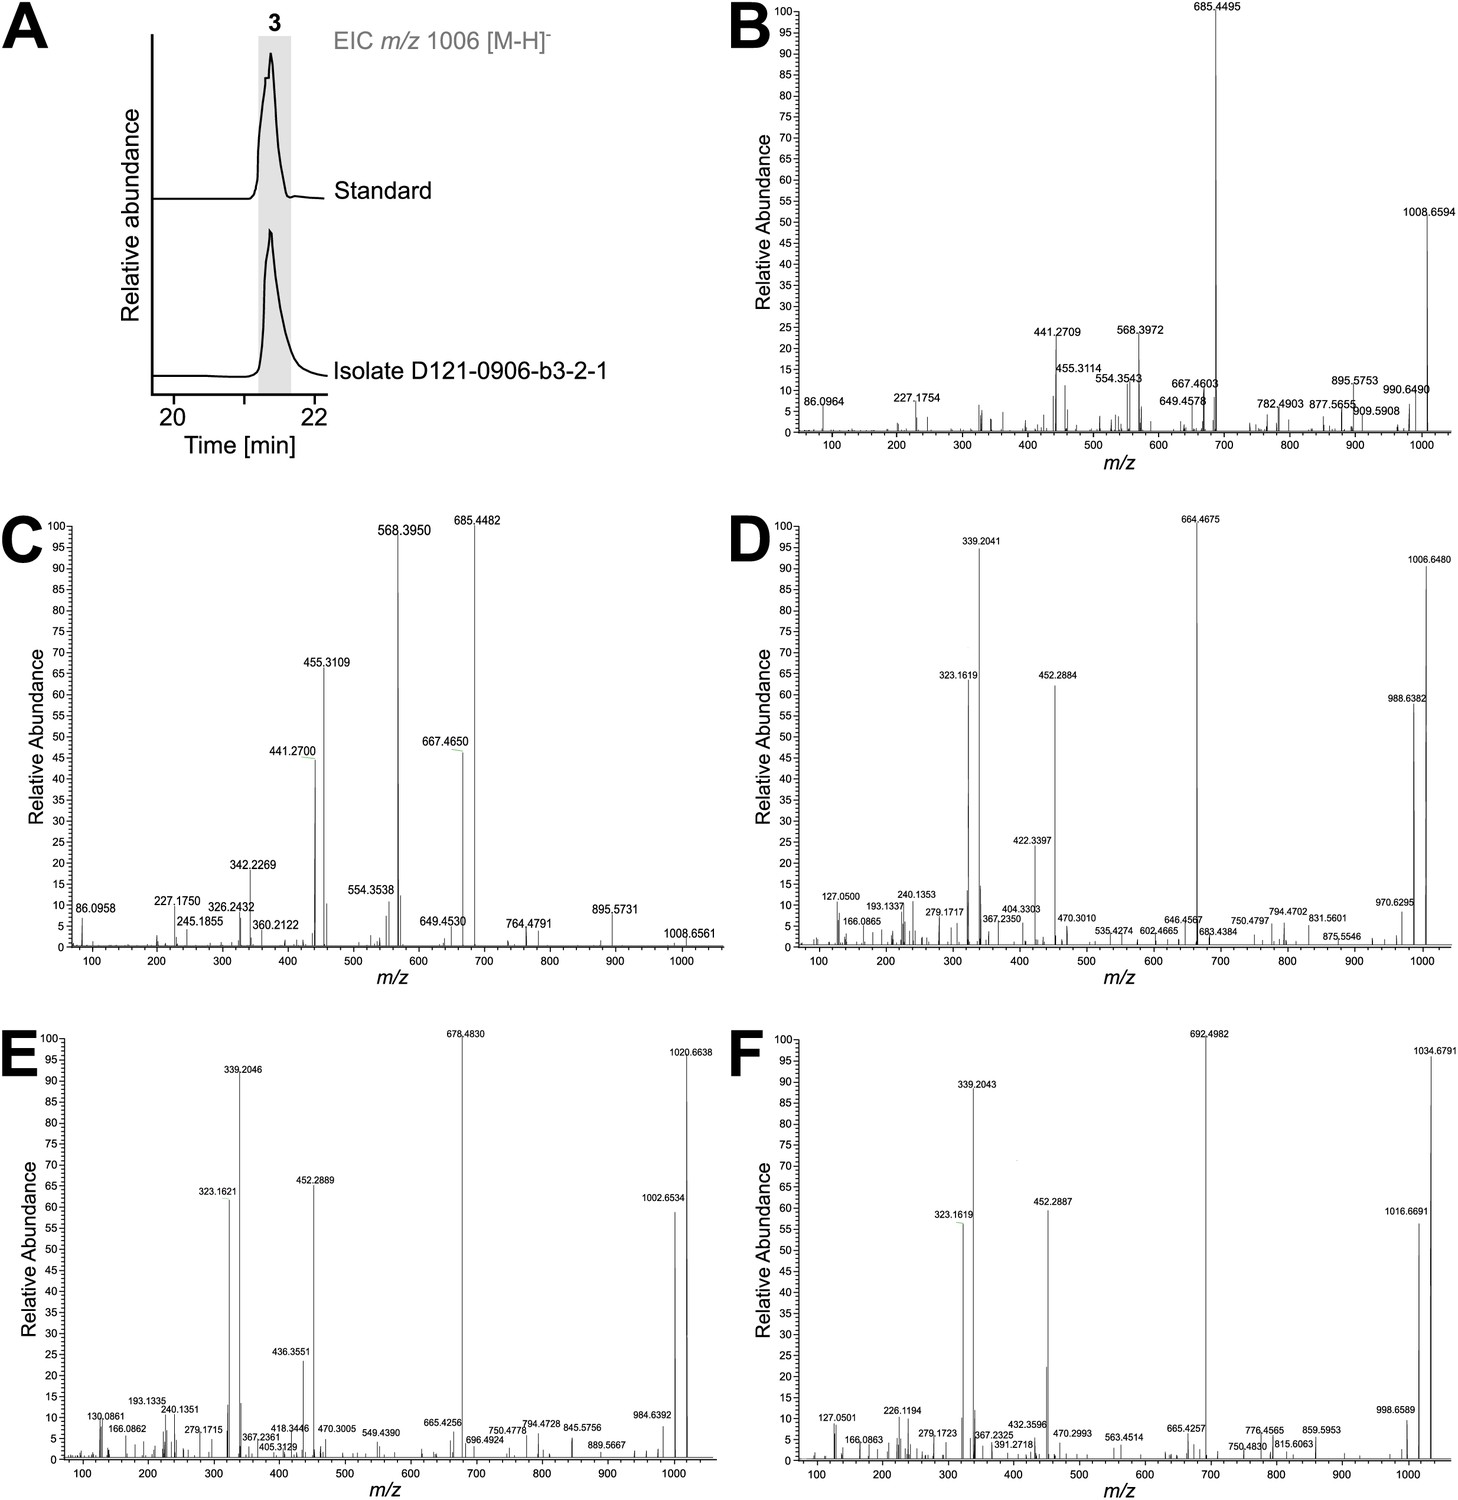
Characterization for surfactin-like compounds (3–5) in extracts of Bacillus sp. isolate D121-0906-b3-2-1.
Physicochemical properties of surfactins (3 , 4) and (5): (3) ESI(+) m/z 1008 [M+H]+, HRESI(+)-MS m/z 1008.6594 (calcd. for C51H90 N7O13 1008.6597), ESI(–) m/z 1006 [M–H]–, HRESI(–)-MS m/z 1006.6480 (calcd. for C51H88 N7O13 1006.6446); base-hydrolyzed (3) ESI(+) m/z 1026 [M+H]+, HRESI(+)-MS m/z 1026.6676 (calcd. for C51H92N7O14 1026.6697); (4) ESI(–) m/z 1020 [M–H]–, HRESI(–)-MS m/z 1020.6633 (calcd. for C52H90 N7O13 1020.6602); (5) ESI(–) m/z 1034 [M–H]–, HRESI(–)-MS m/z 1034.6791 (calcd. for C53H92 N7O13 1034.6759). (A) Comparison of surfactin standard (Merck) and compound 3 as extracted ion chromatograms. (B) MS/MS fragmentation pattern of m/z 1008.6594 [M+H]+ (3) in positive mode. (C) MS/MS fragmentation pattern of m/z 1026.6683 [M+H]+ (base-hydrolyzed 3) in positive mode. (D) MS/MS fragmentation pattern of m/z 1006.6480 [M–H]– (3) in negative mode. (E) MS/MS fragmentation pattern of m/z 1020.6638 [M–H]– (4) in negative mode. (F) MS/MS fragmentation pattern of m/z 1034.6791 [M–H]– (5) in negative mode.
Videos
Video 1
Picoinjection of reporter cells to droplets inoculated and incubated with the soil community.
Images were taken with 800 frames/s at 5x magnification in bright-field illumination. Images are played with 7 frames/s. In the field of view is the channel that is guiding the reinjected droplets through the electrical field applied between the black electrodes (only tips are visible). The surfactant-stabilized water oil interphase is destabilized by the electrical field resulting in fusion of the aqueous phase coming from the top channel and containing reporter cells and the aqueous droplet. When droplets leave the electrical field, the interphase is stable again.
Video 2
Sorting of droplets based on their fluorescence intensity in the red channel.
Images were taken with 1577 frames/s at 5x magnification. Every third image is played with 10 frames/s, resulting in a 52-fold reduction in playback speed. In the field of view is the droplet sorting structure. Droplets with high red fluorescence intensity are pulled with an electrical field into the upper channel. Droplets with low red fluorescence intensity leave the chip through the lower outlet.
Tables
Table 1
Bacterial species contained in the spore mixture constituting the positive control for the droplet–plate comparison.
| Species | ID |
|---|---|
| Streptomyces griseus | ST036300 |
| Streptomyces hygroscopicus | HKI0016 |
| Streptomyces noursei | JA03890 |
| Streptomyces netropsis | IMET43883 |
| Streptomyces collinus | IMET43780 |
Additional files
-
Supplementary file 1
Supplementary tables.
- https://cdn.elifesciences.org/articles/64774/elife-64774-supp1-v2.docx
-
Supplementary file 2
CAD design file of droplet incubator.
- https://cdn.elifesciences.org/articles/64774/elife-64774-supp2-v2.zip
-
Supplementary file 3
CAD design file of droplet incubator ferrule.
- https://cdn.elifesciences.org/articles/64774/elife-64774-supp3-v2.zip
-
Transparent reporting form
- https://cdn.elifesciences.org/articles/64774/elife-64774-transrepform-v2.docx
Download links
A two-part list of links to download the article, or parts of the article, in various formats.
Downloads (link to download the article as PDF)
Open citations (links to open the citations from this article in various online reference manager services)
Cite this article (links to download the citations from this article in formats compatible with various reference manager tools)
Highly parallelized droplet cultivation and prioritization of antibiotic producers from natural microbial communities
eLife 10:e64774.
https://doi.org/10.7554/eLife.64774


