ATP and large signaling metabolites flux through caspase-activated Pannexin 1 channels
- Department of Pharmacology, University of Virginia, United States
- Department of Molecular Physiology and Biological Physics, University of Virginia, United States
- Department of Pharmacology, Physiology, and Neuroscience, Rutgers New Jersey Medical School, United States
- Department of Microbiology, Immunology, and Cancer Biology, University of Virginia, United States
Figures
Figure 1 with 3 supplements
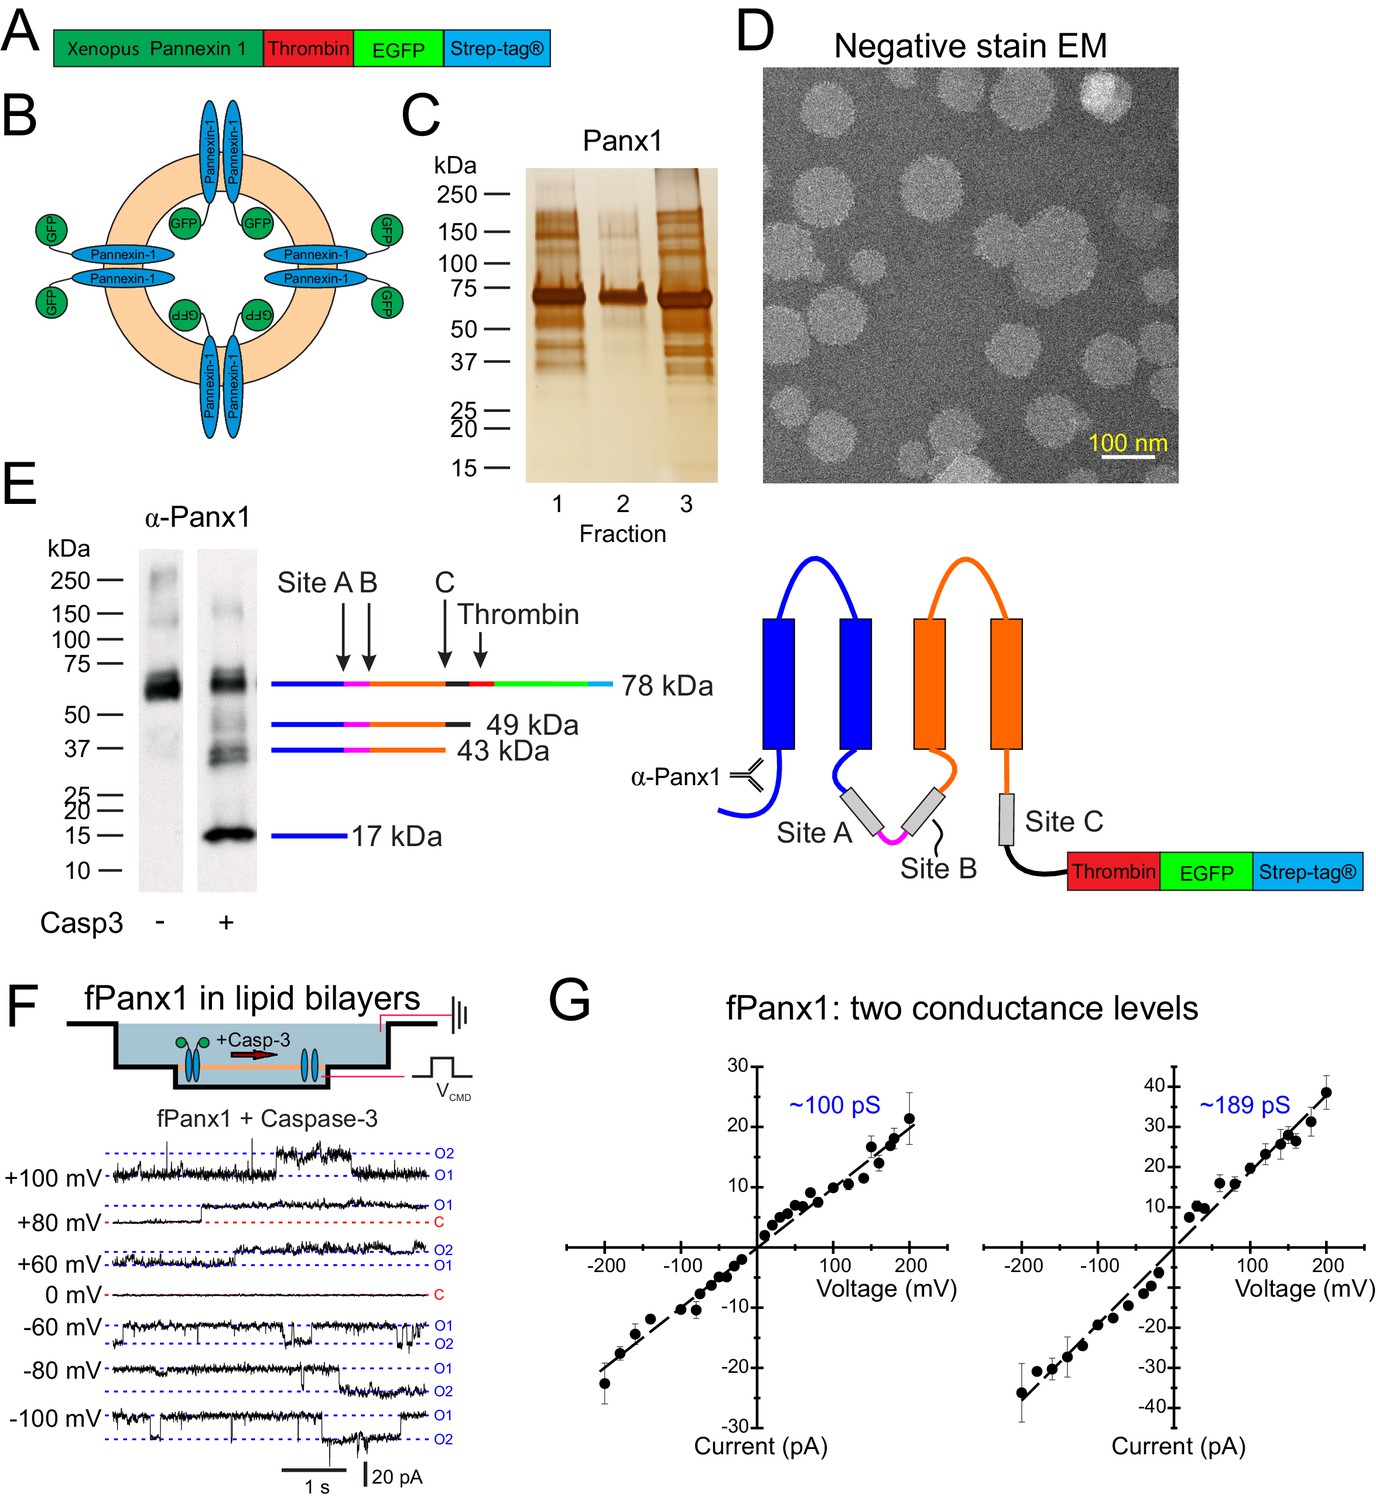
Liposome reconstitution and caspase cleavage-activation of purified Xenopus Pannexin 1 (fPanx1).
(A) Schematic of recombinant fPanx1 construct incorporating a thrombin cleavage site, (eGFP), and a Strep-Tag. (B) Schematic of proteoliposomes containing fPanx1-eGFP fusion proteins, in either orientation. (C) fPanx1-containing fractions from Nycodenz co-floatation assay (fractions 1–3, 20 μL each) were run on a polyacrylamide gel and analyzed by silver stain. (D) Negative stain electron microscopy image of fPanx1-eGFP proteoliposomes extruded at 100 nm shown at 29,000× magnification. (E) Western blot of fPanx1-eGFP from proteoliposomes after overnight incubation in the absence and presence of recombinant Caspase-3 (Casp3). The schematics illustrate the location of: caspase cleavage sites, N-terminally directed α-Panx1 antibody, and corresponding cleavage products. Note that residual thrombin from activating recombinant caspase cleaves at its cognate C-terminal site. (F) Upper: Schematic of fPanx1-eGFP embedded in bilayer in recording chambers in NanIon Orbit mini; only channels in the orientation shown are activated by recombinant Casp3 added to the chamber. Positions of recording and ground electrodes are depicted. Lower: Recordings of purified fPanx1 channels in planar lipid bilayers at the indicated voltages following activation by recombinant Casp3; current levels are indicated that correspond to closed (C) state and apparent openings of one or two channels (O1, O2). (G) Unitary current voltage relationships for caspase-activated fPanx1 show two different conductance states (N = 3 bilayers with each conductance level). Numerical data for conductance measurements from lipid bilayer recordings are presented in Figure 1—source data 1.
-
Figure 1—source data 1
Conductance measurements of Xenopus Pannexin 1 (fPanx1) in lipid bilayers.
- https://cdn.elifesciences.org/articles/64787/elife-64787-fig1-data1-v2.xlsx
Figure 1—figure supplement 1
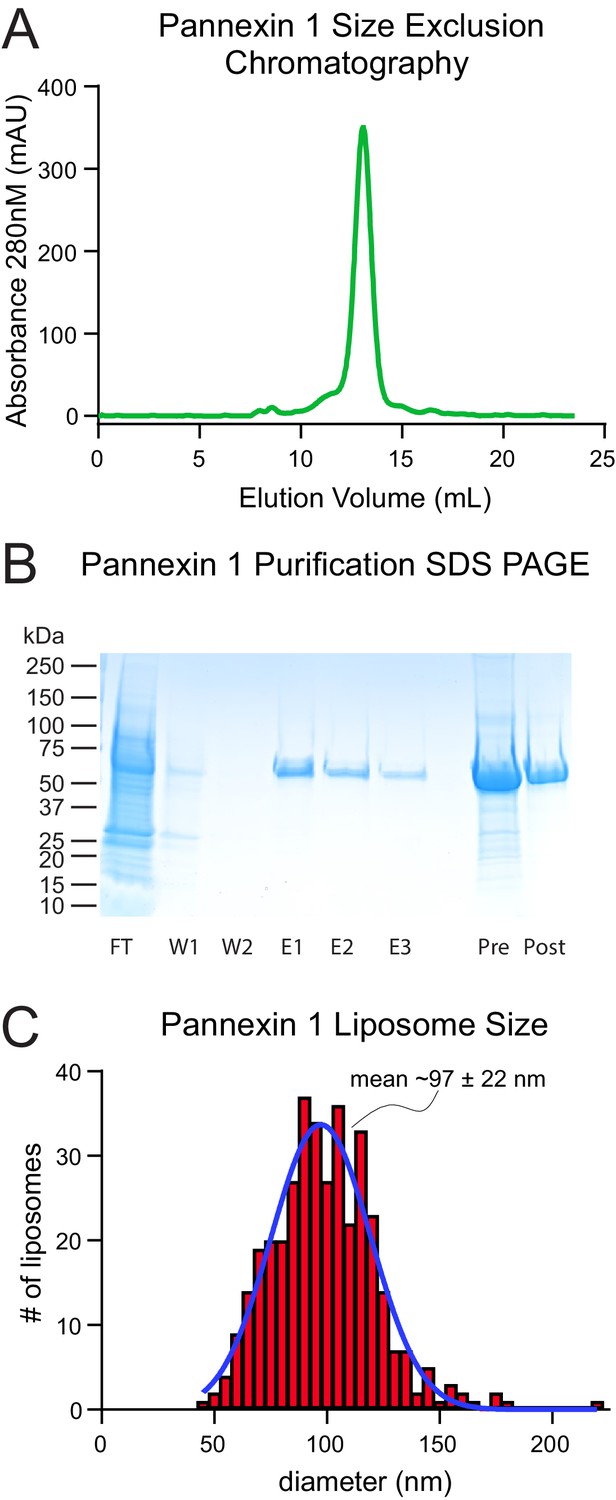
Purification of Xenopus Pannexin 1 (fPanx1).
(A) Size-exclusion chromatogram showing the purification of fPanx1- (eGFP). (B) Simply blue-stained SDS-PAGE gel showing samples taken during the purification process: flow through after gravity flow chromatography (FT), low salt wash (W1), high salt wash (W2), desthiobiotin elution fractions (e1, e2, e3), blank, concentrated sample before size-exclusion chromatography (SEC; Pre), and concentrated sample after SEC (Post). (C) Distribution of liposome diameters measured from negative stain EM images (97.3 ± 22 nm, 374 liposomes from 12 images). Diameters of liposomes are presented in Figure 1—figure supplement 1—source data 1.
-
Figure 1—figure supplement 1—source data 1
Diameters of Xenopus Pannexin 1 (fPanx1) proteoliposomes.
- https://cdn.elifesciences.org/articles/64787/elife-64787-fig1-figsupp1-data1-v2.xlsx
Figure 1—figure supplement 2
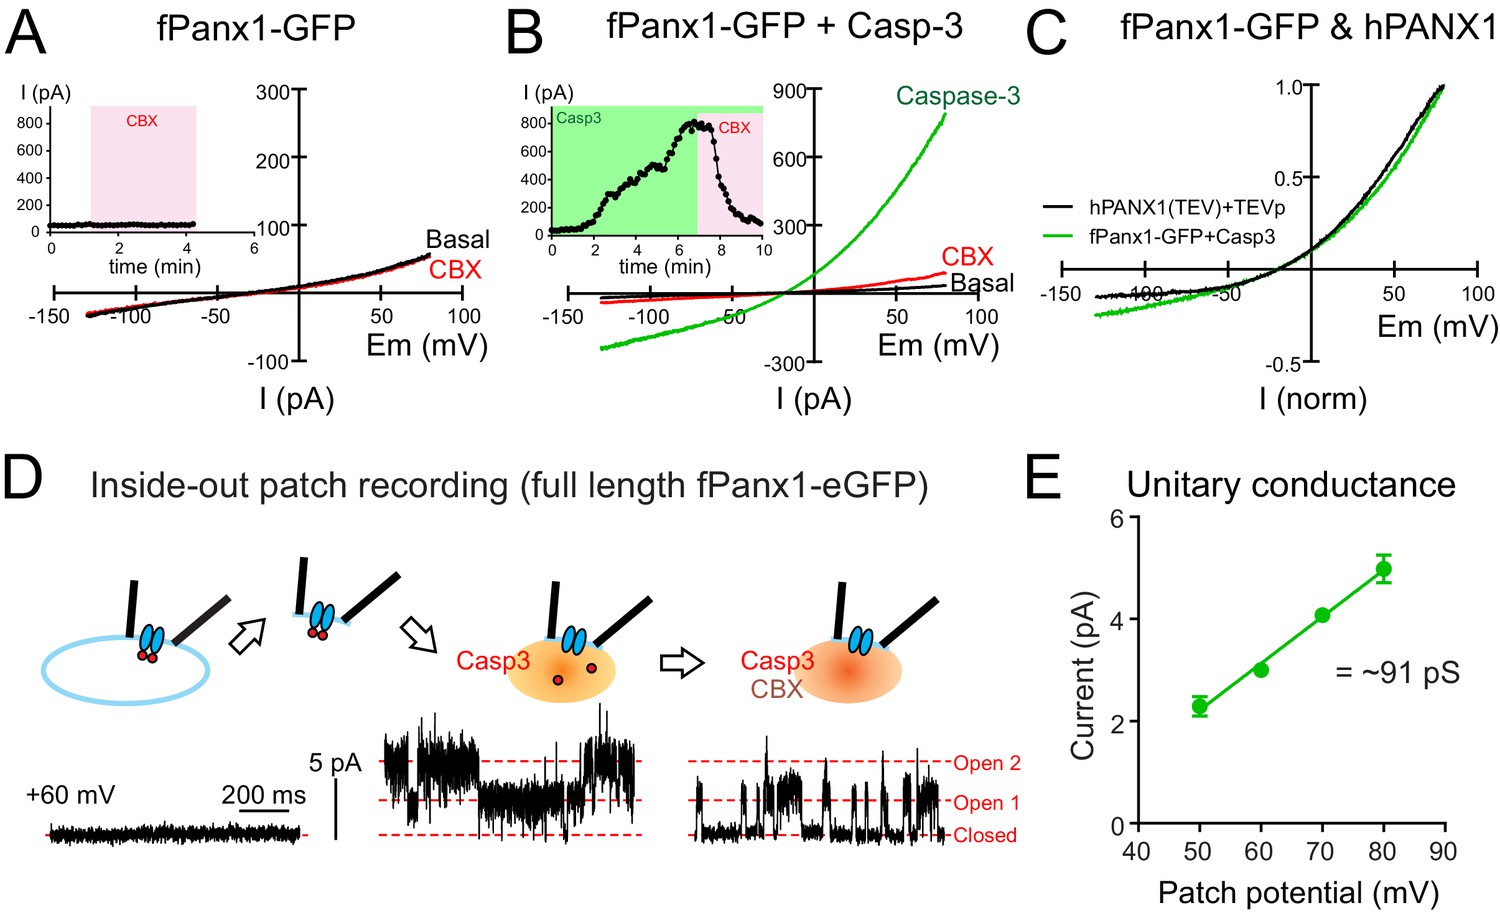
In vitro electrophysiology of Xenopus Pannexin 1 (fPanx1) in mammalian cells.
(A) Current–voltage traces for fPanx1-eGFP expressed in HEK 293T with normal internal solution (A) and with recombinant Caspase-3 (Casp3) in the internal solution (B; 2 µg/mL). The current activated by Casp3 was inhibited by bath application of 50 μM CBX. (C) Normalized current–voltage curves from whole-cell patch-clamp electrophysiology comparing hPANX1 and fPanx1-eGFP. (D) Schematic showing protocol for inside-out patch-clamp recordings of fPanx1-eGFP (upper) and channel activity evoked by Casp3 and inhibited by CBX. (E) Unitary current–voltage relationship with estimated slope conductance from inside-out patches of fPanx1 (N = 3). Numerical data for current–voltage traces of fPanx1-eGFP treated with or without Caspase-3 and comparison with hPANX1 are presented in Figure 1—figure supplement 2—source data 1. Numerical data for fPanx1 unitary conductance are presented in Figure 1—figure supplement 2—source data 2.
-
Figure 1—figure supplement 2—source data 1
In vitro electrophysiology of Xenopus Pannexin 1 (fPanx1).
- https://cdn.elifesciences.org/articles/64787/elife-64787-fig1-figsupp2-data1-v2.xlsx
-
Figure 1—figure supplement 2—source data 2
Xenopus Pannexin 1 (fPanx1) unitary conductance.
- https://cdn.elifesciences.org/articles/64787/elife-64787-fig1-figsupp2-data2-v2.xlsx
Figure 1—figure supplement 3
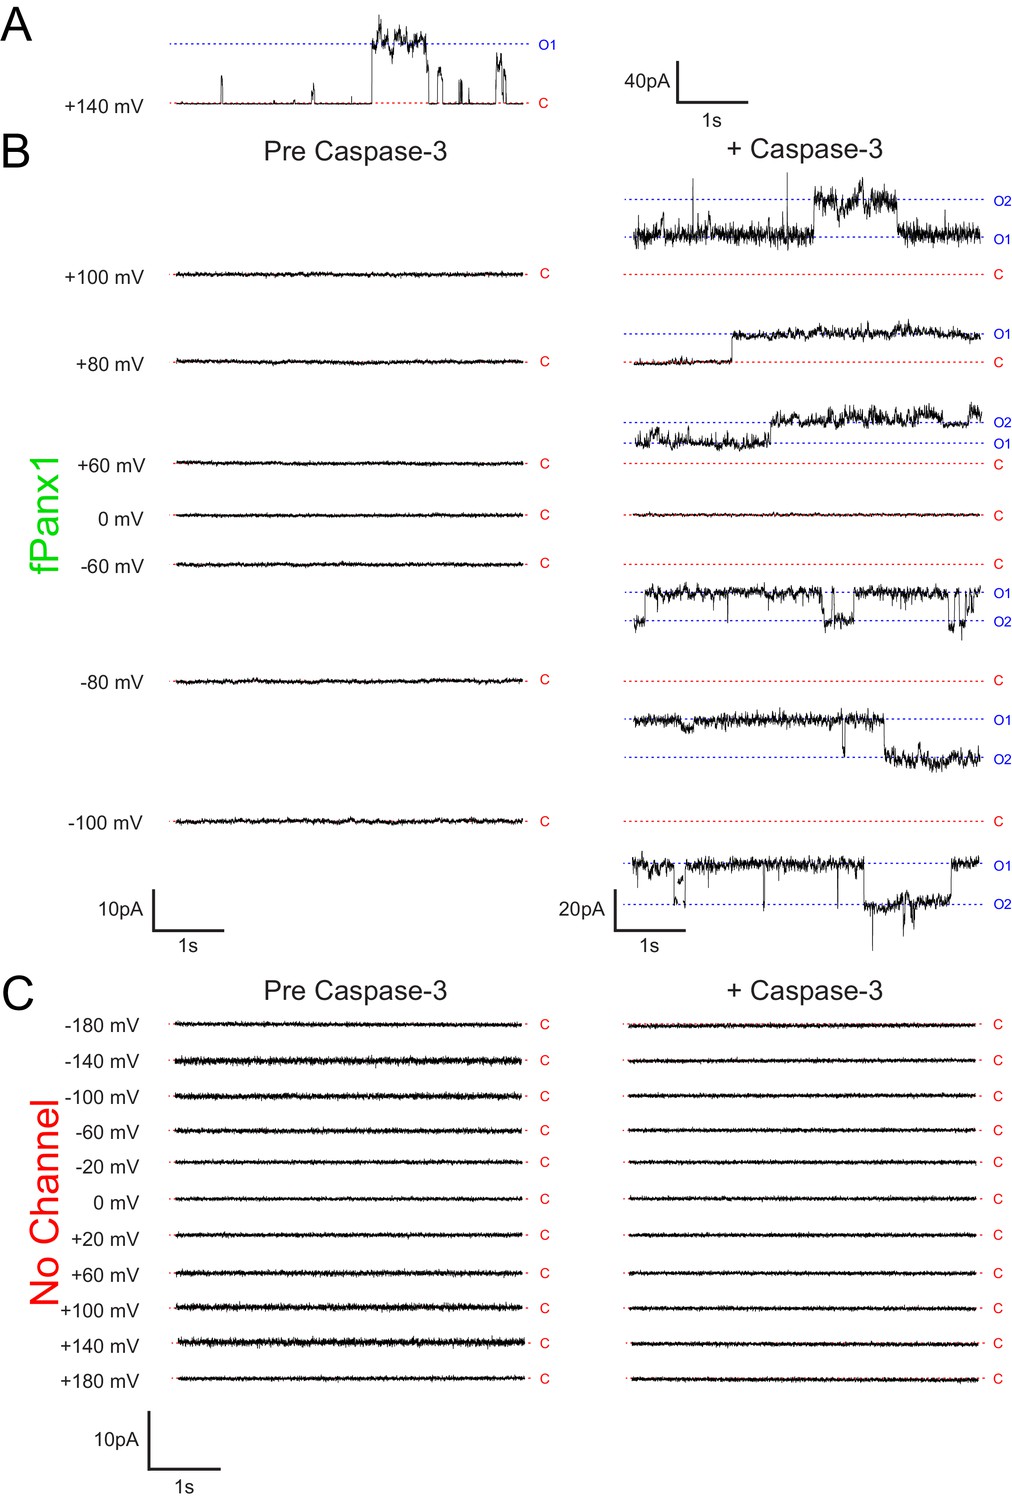
Caspase has no effect on lipid bilayers that do not contain Xenopus Pannexin 1 (fPanx1).
(A) ‘Flickery’ currents observed after addition of fPanx1 to lipid bilayers at +140 mV before addition of caspase. (B) Current recordings from DPhPC lipid bilayers with fPanx1, before (left) and after addition of Caspase-3 (Casp3; right) (N = 3). (C) Current recordings from DPhPC lipid bilayers without incorporation of fPanx1, before (left) and after addition of Casp3 (right) (N = 3).
Figure 2 with 2 supplements
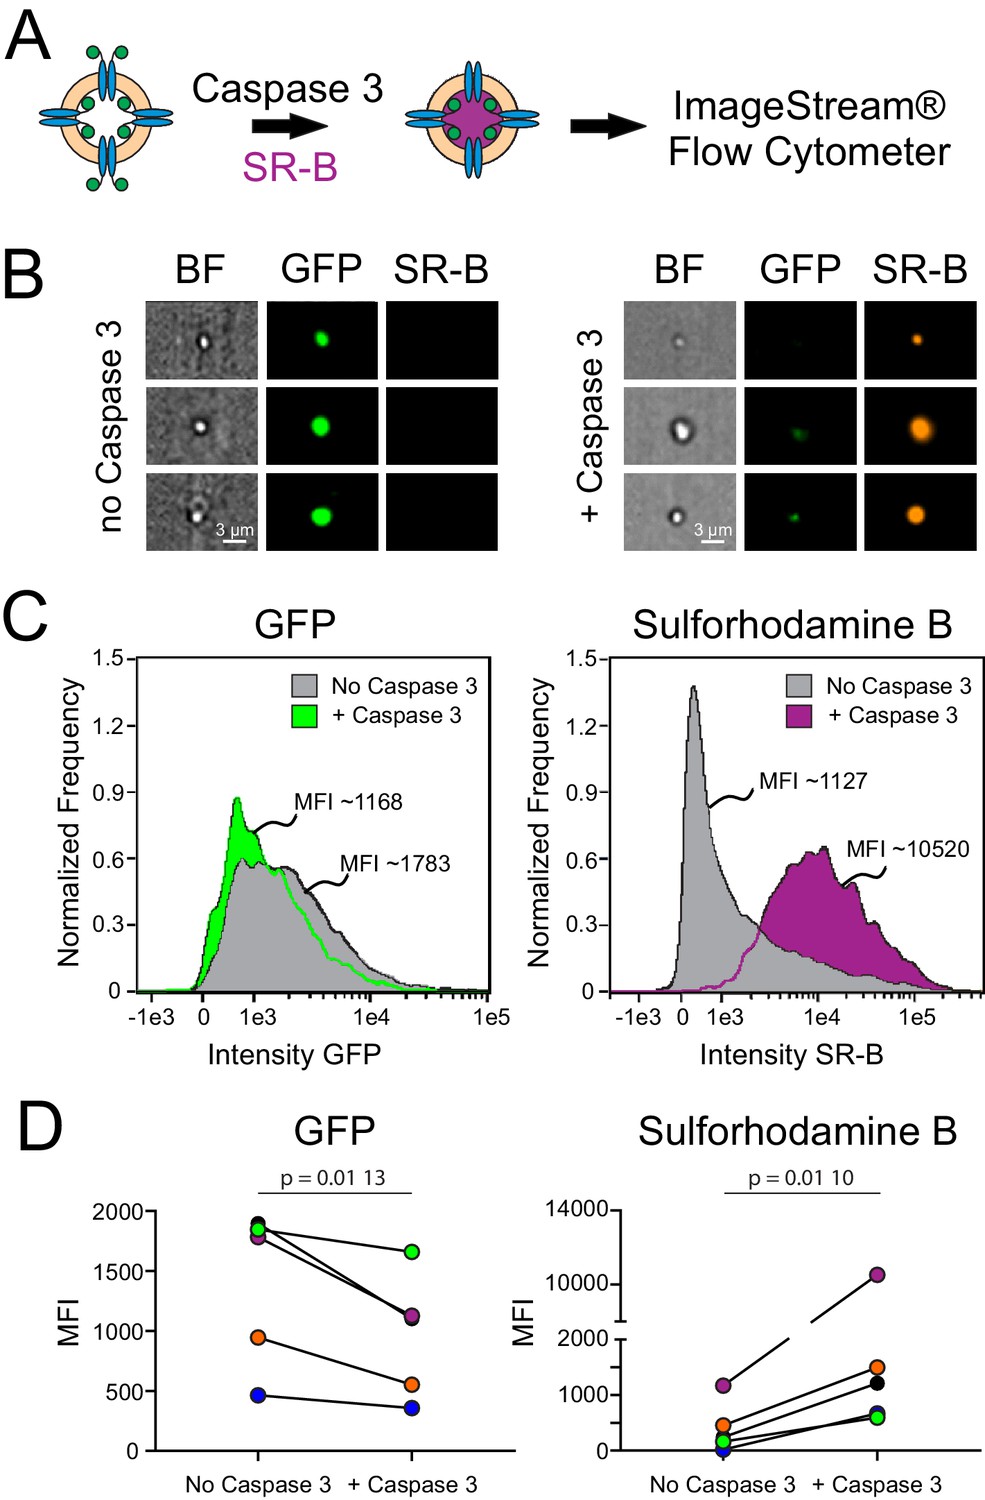
Dye uptake in caspase-treated Xenopus Pannexin 1 (fPanx1)-containing proteoliposomes.
(A) Proteoliposomes containing fPanx1were incubated overnight with recombinant Caspase-3 (Casp3) and for 3 hr with sulforhodamine B (SR-B) dye prior to analysis by ImageStream flow cytometry. (B) Representative images of liposomes treated with vehicle (left) or Casp3 (right) viewed by brightfield, or on channels for (GFP) and SR-B fluorescence. (C) Frequency distributions of fluorescence intensity show that proteoliposomes treated with recombinant Casp3 show a reduction in mean GFP intensity (left) and an increase in SR-B intensity (right), relative to vehicle treated proteoliposomes. (D) Mean fluorescence intensity (MFI) of GFP fluorescence (left) (p=0.0096) and SR-B fluorescence (right) (p=0.0104) before and after caspase treatment are shown with individual experiments depicted according to the color shown (N = 5). A paired t-test was performed. Numerical data for changes in GFP and SR-B MFI are presented in Figure 2—source data 1.
-
Figure 2—source data 1
Mean fluorescence intensity (MFI) of Xenopus Pannexin 1 (fPanx1) proteoliposomes before and after Caspase-3 treatment.
- https://cdn.elifesciences.org/articles/64787/elife-64787-fig2-data1-v2.xlsx
Figure 2—figure supplement 1
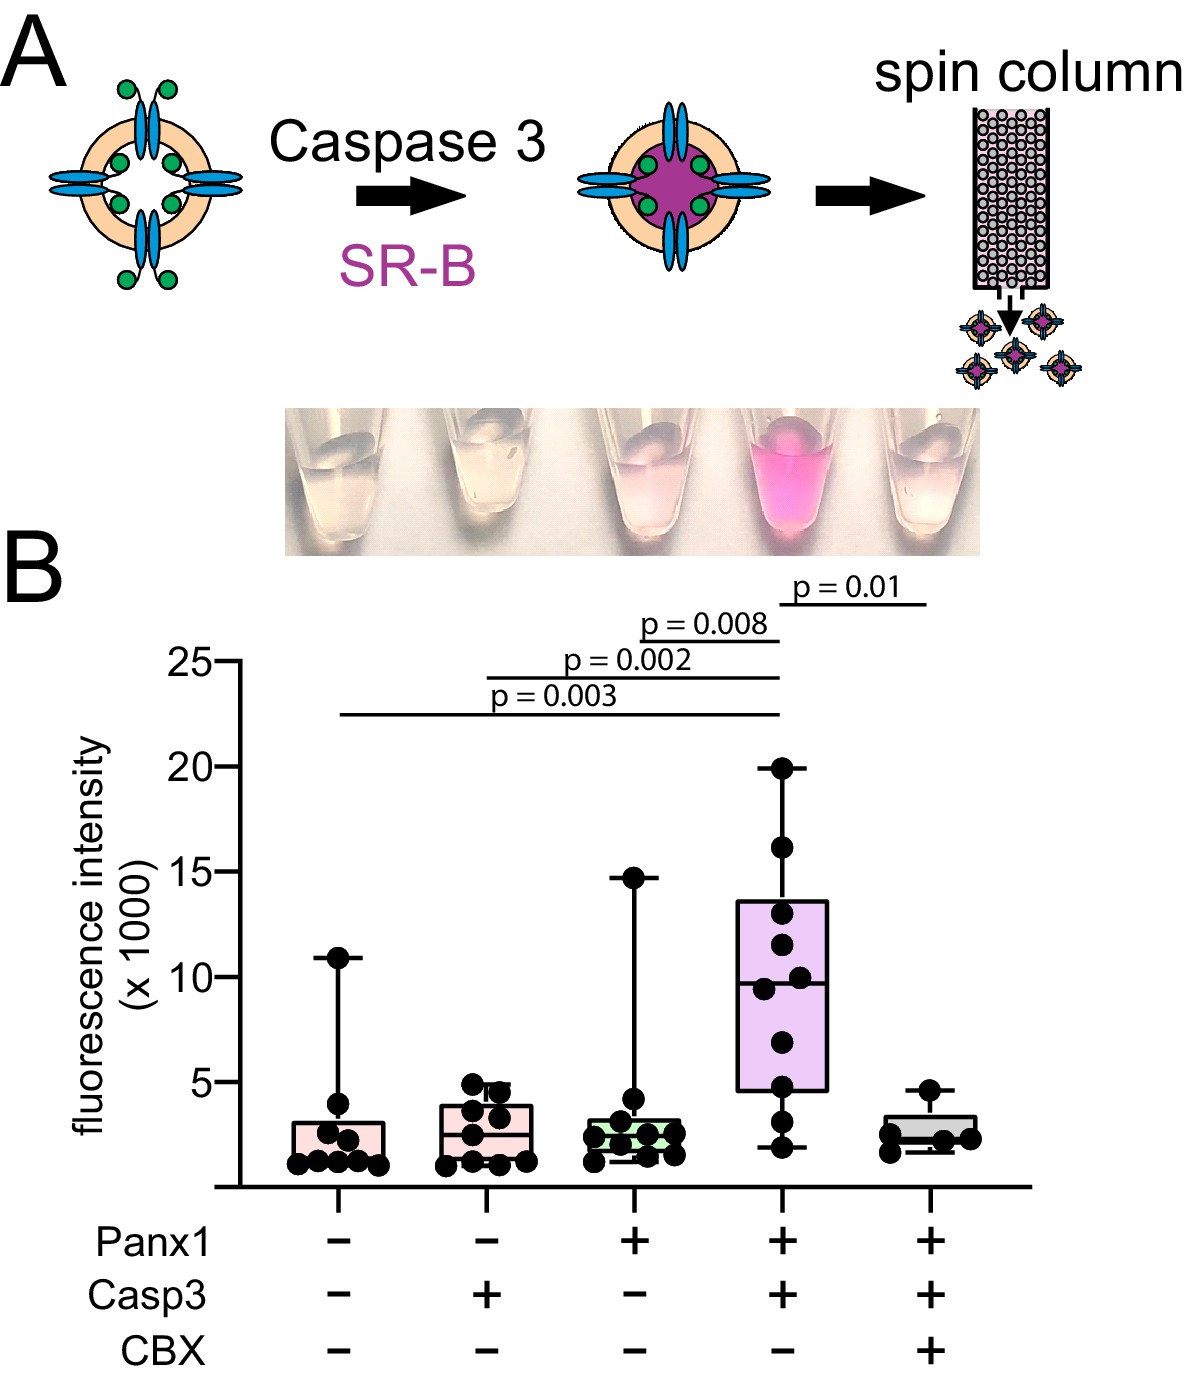
Bulk dye uptake in caspase-treated Xenopus Pannexin 1 (fPanx1)-containing proteoliposomes.
(A) Schematic depicting experimental design for treating fPanx1-containing proteoliposomes with recombinant Caspase-3 (Casp3) overnight at 4°C before incubation with SR-B (B, 1 mM) for 3 hr and loading on a G-25 spin column. (B) SR-B fluorescence (mean ± SEM) in eluted proteoliposomes under the indicated conditions (nine assays: >3 proteoliposome preparations). ANOVA (F4,34 = 5.95, p=0.001) and Tukey’s multiple comparisons test (p-values from comparisons are shown). Numerical data for bulk dye uptake are presented in Figure 2—figure supplement 1—source data 1.
-
Figure 2—figure supplement 1—source data 1
Bulk dye uptake in caspase-treated Xenopus Pannexin 1 (fPanx1)-containing proteoliposomes.
- https://cdn.elifesciences.org/articles/64787/elife-64787-fig2-figsupp1-data1-v2.xlsx
Figure 2—figure supplement 2
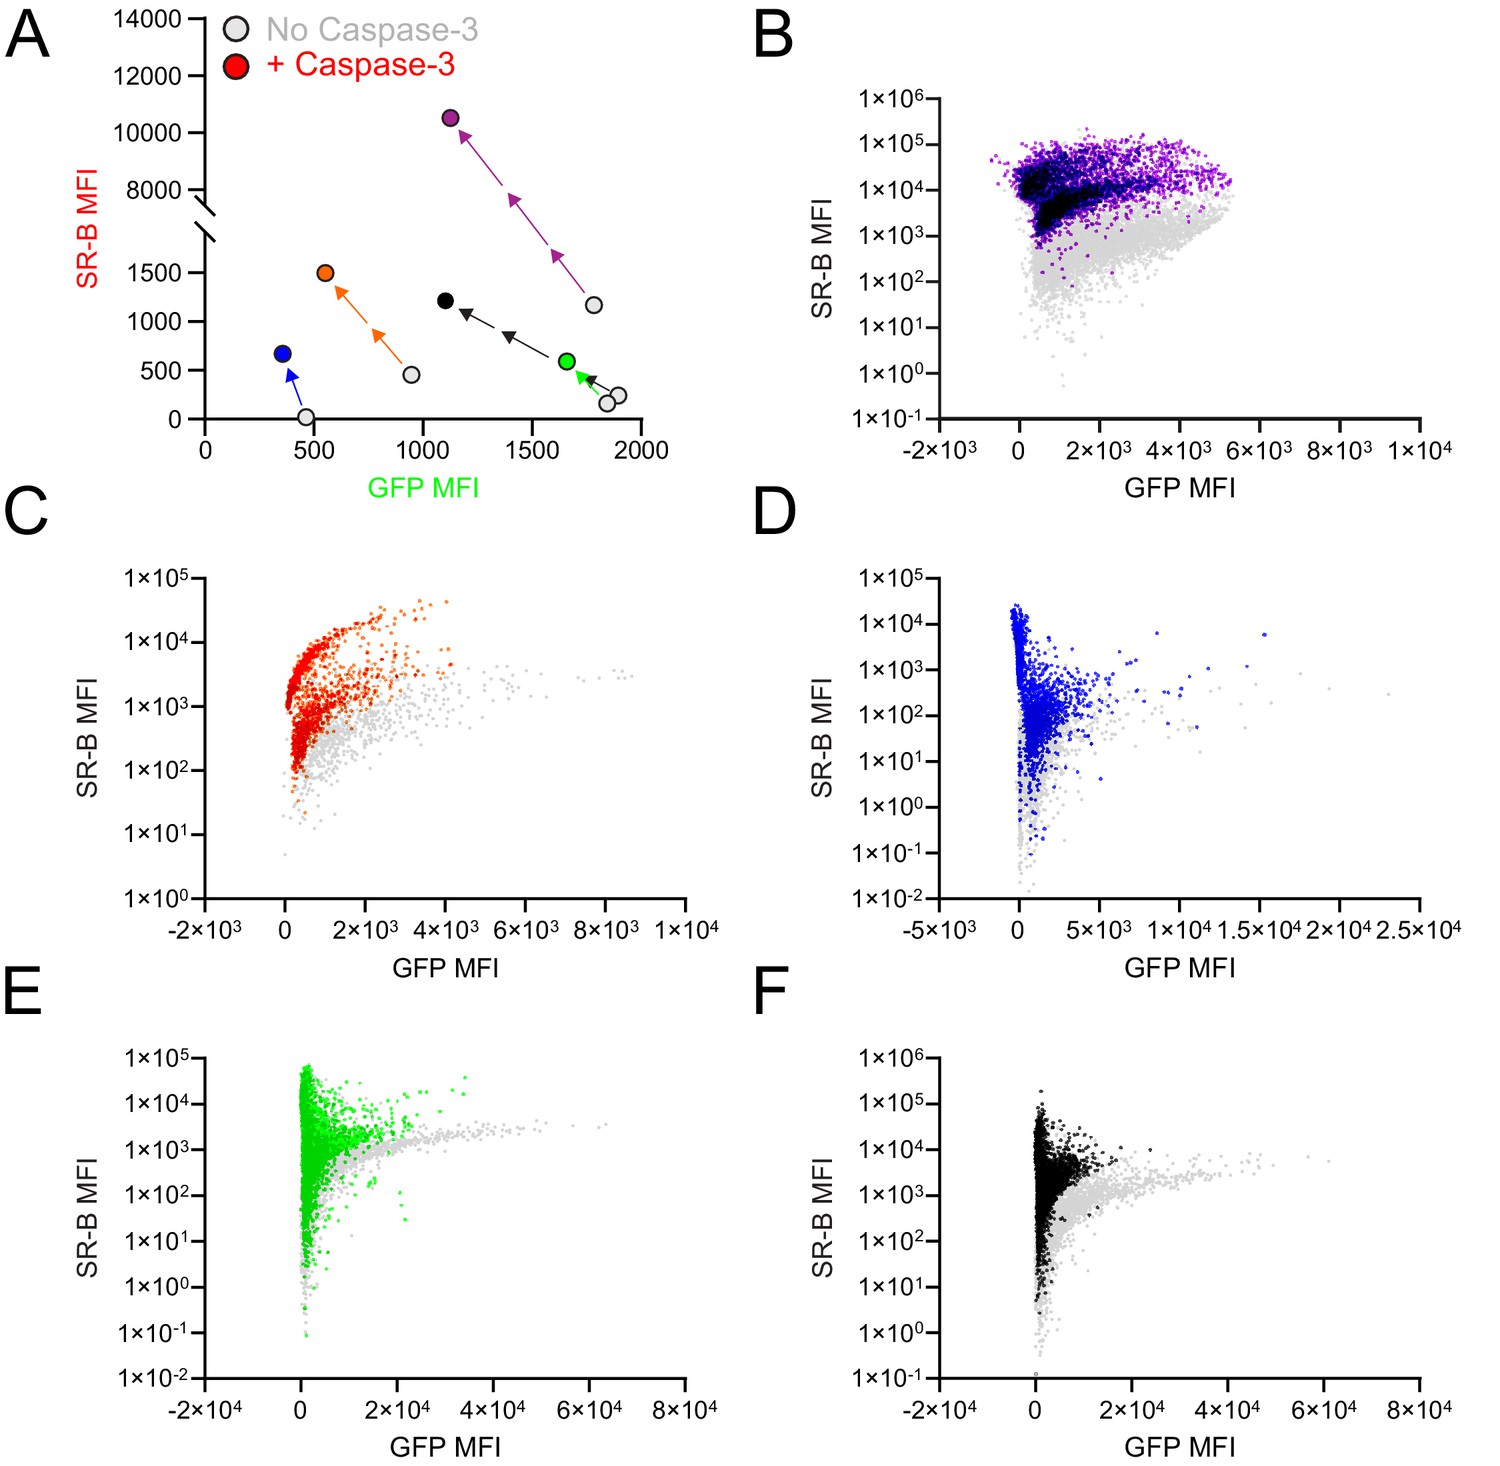
(GFP) and sulforhodamine-B mean fluorescence intensity (MFI) in caspase-treated Xenopus Pannexin 1 (fPanx1)-containing proteoliposomes.
(A) Changes in GFP and SR-B fluorescence in individual experiments are shown (N = 5). (B–F) Flow cytometry plots are shown for individual experiments from (A) (color-coded accordingly). Gray dots indicate proteoliposomes not treated with Caspase-3 (Casp3) and colored dots indicate proteoliposomes after treatment with Casp3. Only positive SR-B values are plotted on the logarithmic y-axis. Numerical data for change in GFP and SR-B MFI are presented in Figure 2—figure supplement 2—source data 1. Numerical data for flow cytometry dot-plots for individual experiments are presented in Figure 2—figure supplement 2—source data 2.
-
Figure 2—figure supplement 2—source data 1
(GFP) and sulforhodamine-B mean fluorescence intensity (MFI) in caspase-treated Xenopus Pannexin 1 (fPanx1)-containing proteoliposomes.
- https://cdn.elifesciences.org/articles/64787/elife-64787-fig2-figsupp2-data1-v2.xlsx
-
Figure 2—figure supplement 2—source data 2
Flow cytometry dot plots of ImageStream experiments.
- https://cdn.elifesciences.org/articles/64787/elife-64787-fig2-figsupp2-data2-v2.xlsx
Figure 3 with 1 supplement
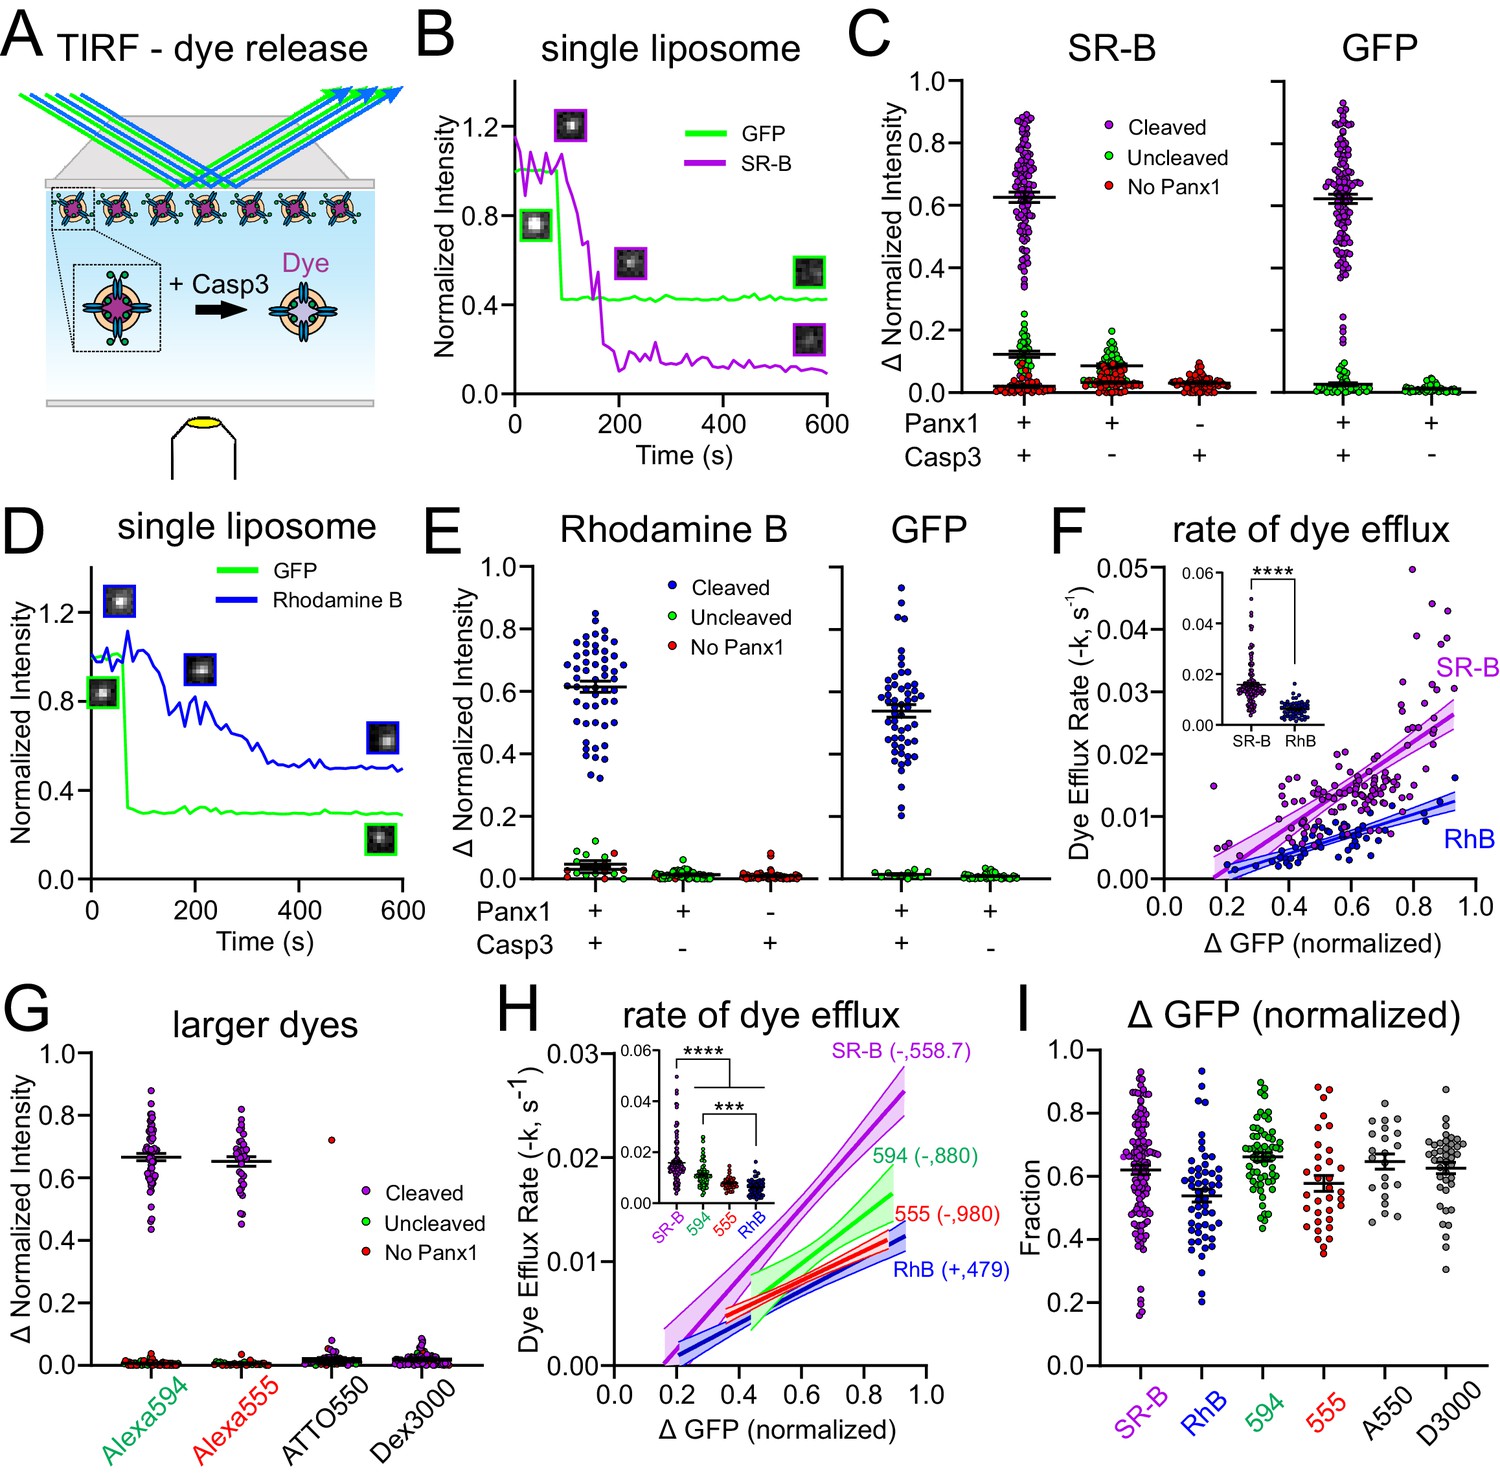
Xenopus Pannexin 1 (fPanx1) favors permeation of anionic dyes.
(A) Schematic of experimental design to assay dye release kinetics from caspase-treated fPanx1-containing proteoliposomes by total internal reflection fluorescence (TIRF) microscopy. (B) Example fluorescence intensity traces for sulforhodamine B (SR-B, anionic dye, 559 Da) and (GFP) (caspase cleavage) over time in proteoliposomes after caspase treatment. Sample images of the proteoliposome fluorescence at the different time points are also provided. (C) Steady-state change in normalized fluorescence intensity for SR-B (left) and GFP (right) from fPanx1-GFP-containing proteoliposomes treated with either Caspase-3 (Casp3) or vehicle, or from empty liposomes (no fPanx1-GFP) treated with Casp3. Data from fPanx1-containing proteoliposomes were grouped according to whether they showed a reduction in GFP fluorescence (cleaved) or no change in GFP fluorescence (<10%, uncleaved) (N = 5 (+)Panx 1 (+)Casp3, N = 5 (+)Panx1 (−)Casp3, N = 4 (−)Panx1 (+)Casp3). (D, E) Fluorescence intensity traces (D) and steady-state change in normalized fluorescence intensity (E) for Rhodamine B (RhB, cationic dye, 479 Da) and GFP, as described for (B, C) (N = 5 (+)Panx1 (+)Casp3, N = 3 (+)Panx1 (−)Casp3, N = 4 (−)Panx1 (+)Casp3). (F) Efflux rates for SR-B and RhB were determined from fits of mono-exponential to the fluorescence intensity decay curves for individual caspase-treated proteoliposomes and plotted relative to the change in GFP fluorescence (i.e., fPanx1 cleavage); overlaid regression lines are depicted (with 95% confidence interval; slopes were significantly different, p=0.0014). Inset shows dye efflux rates for individual liposomes. Individual liposome dye efflux rates were analyzed by a Mann–Whitney test (p<0.0001) (G) Steady-state change in normalized fluorescence intensity for Alexa594 (anionic, 880 Da), Alexa555 (anionic, 980 Da), ATTO550 (cationic, 1363 Da), and Dextran 3000 (anionic, 3000 Da) from fPanx-GFP-containing proteoliposomes treated with Casp3 (Alexa 594 N = 6, Alexa 555 N = 5, ATTO 550 N = 3, Dextran 3000 N = 5). (H) Efflux rates for the indicated dyes represented by associated regression lines (with 95% confidence interval), with pairwise comparison of slopes: SR-B vs. RhB (p=0.0014), SR-B vs. 594 (p=0.16), SR-B vs. 555 (p=0.0074), 594 vs. 555 (p=0.15), 594 vs. RhB (p=0.16), 555 vs. RhB (p=0.53). Inset shows dye efflux rates for individual liposomes (ANOVA: F3,267 = 36.18, p<0.0001; with Tukey’s multiple comparisons test: ****p<0.0001; ***p=0.0002). (I) Relative change (upper) and rate (lower) of GFP fluorescence in cleaved fPanx1-containing proteoliposomes filled with the indicated dyes. Numerical data for all dye release data and GFP cleavage are provided in Figure 3—source data 1.
-
Figure 3—source data 1
Total internal reflection fluorescence (TIRF) imaging of dye release from proteoliposomes.
- https://cdn.elifesciences.org/articles/64787/elife-64787-fig3-data1-v2.xlsx
Figure 3—figure supplement 1
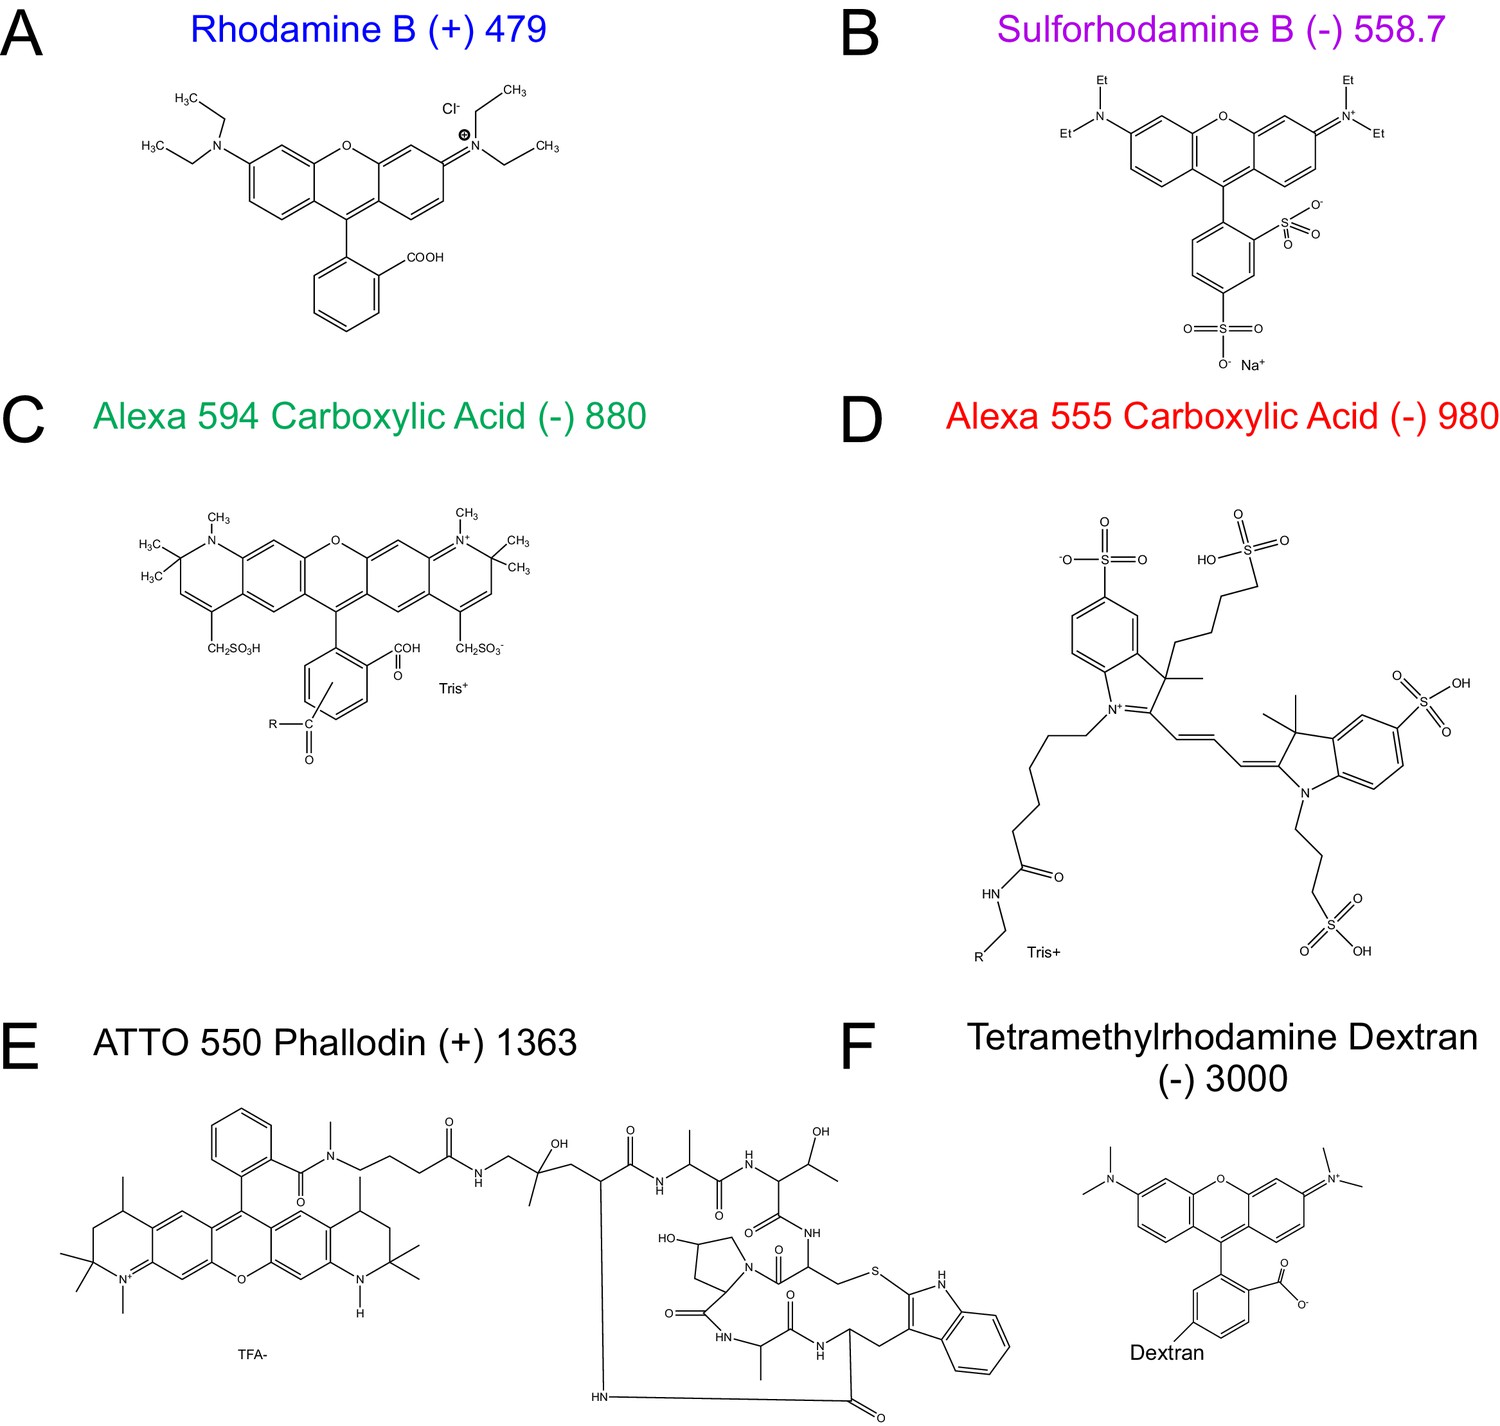
Chemical structures of fluorescent dyes.
Chemical structures, net charge, and molecular weight are shown for (A) Rhodamine B, (B) Sulforhodamine-B, (C) Alexa 594 Carboxylic Acid, (D) Alexa 555 Carboxylic Acid, (E) ATTO 550 Phallodin, and (F) Tetramethylrhodamine Dextran 3000. Note that the precise site of the conjugate for proprietary dyes was not provided and so the figures depict approximate structures, and the size of the dextran is approximate. The chemical structure of ATTO 550 Phallodin was provided by ATTO-TEC.
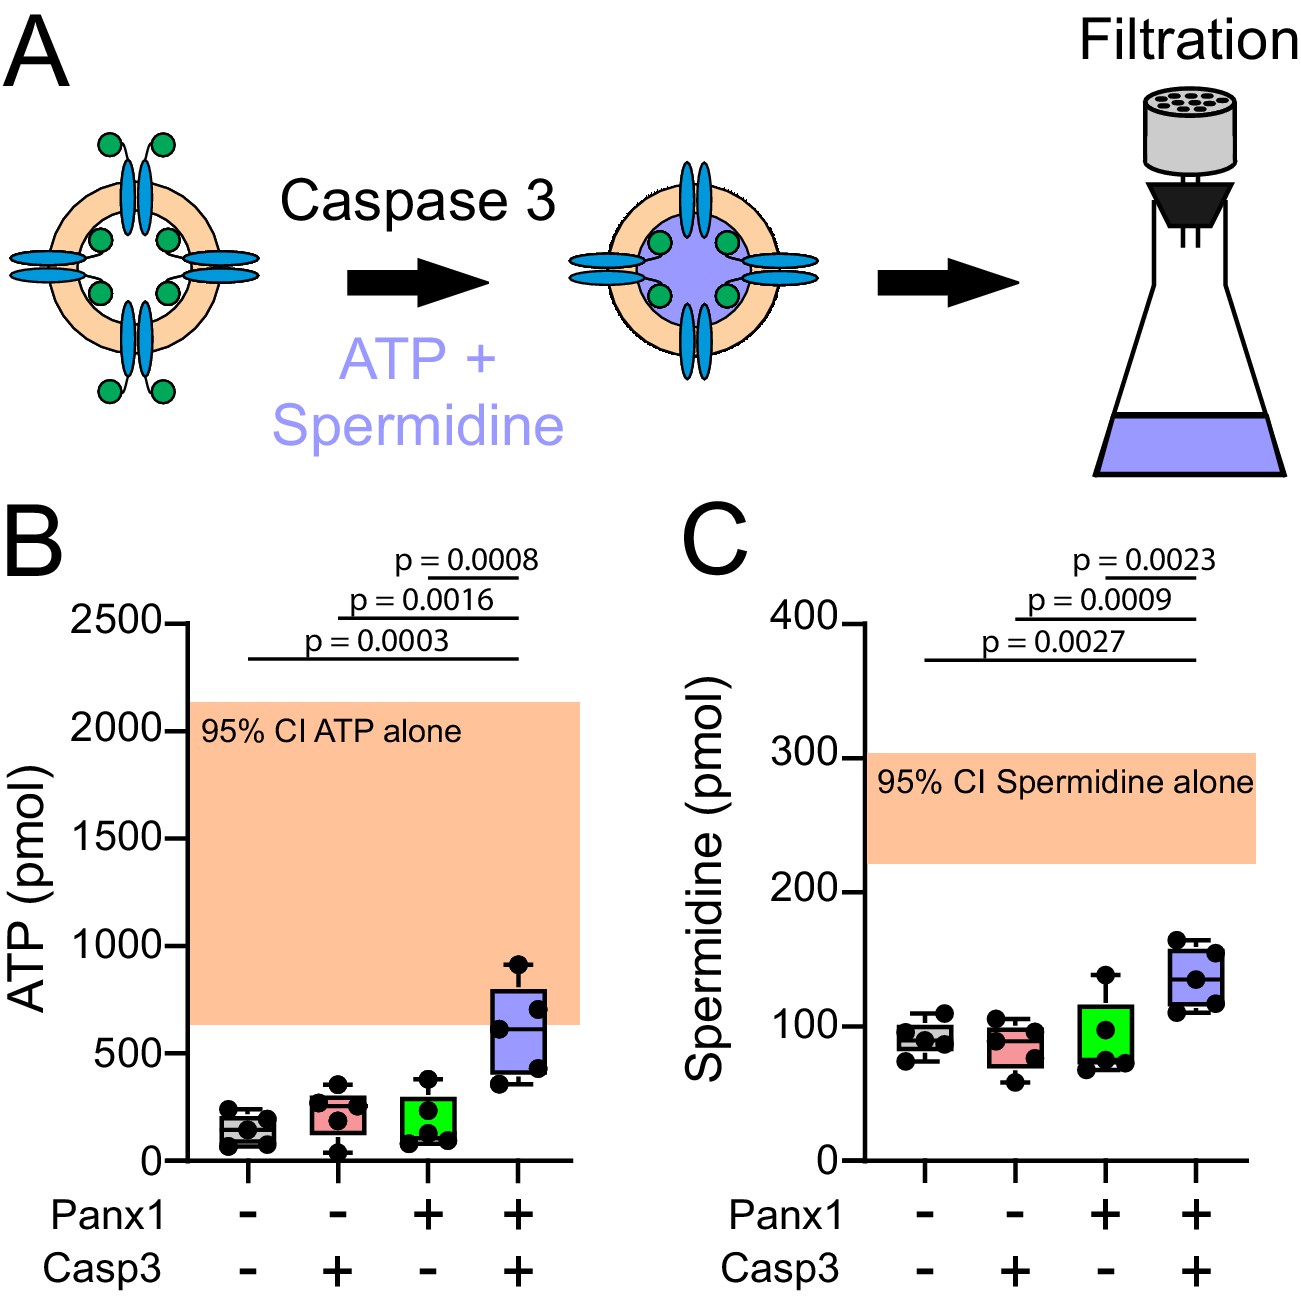
Figure 4 with 2 supplements

Caspase-cleaved Xenopus Pannexin 1 (fPanx1) is a conduit for metabolite release.
(A) Schematic depicting experimental design for treating fPanx1-containing proteoliposomes with recombinant Caspase-3 (Casp3) overnight at 4°C before incubation with 4 μCi each of α[32P]-ATP (B, 1 mM;~1:150000, hot:cold), [3H]-Glutamate (C, 0.8 mM;~1:2000), and [3H]-Spermidine (D, 8 µM;~1:24) for 3 hr and filtration using a Whatman GF/B filter. (B–D) Metabolites taken up by proteoliposomes under the indicated conditions for α[32P]-ATP (N = 8), [3H]-Glutamate (N = 6), and [3H]-Spermidine (N = 5); molar quantities should not be compared between compounds due to different assay conditions. A box plot with the box depicting the quartiles/median, and lines drawn to points outside 25th/75th percentiles are shown. By repeated-measures one-way ANOVA (ATP: F3,28 = 14.18, p<0.0001; Glutamate: F3,20 = 18.29, p<0.0001; Spermidine: F3,16 = 40.50, p<0.0001), with p-values provided from Tukey’s multiple comparisons tests. Numerical data for individual metabolite flux are shown in Figure 4—source data 1.
-
Figure 4—source data 1
Metabolite flux in proteoliposomes.
- https://cdn.elifesciences.org/articles/64787/elife-64787-fig4-data1-v2.xlsx
Figure 4—figure supplement 1
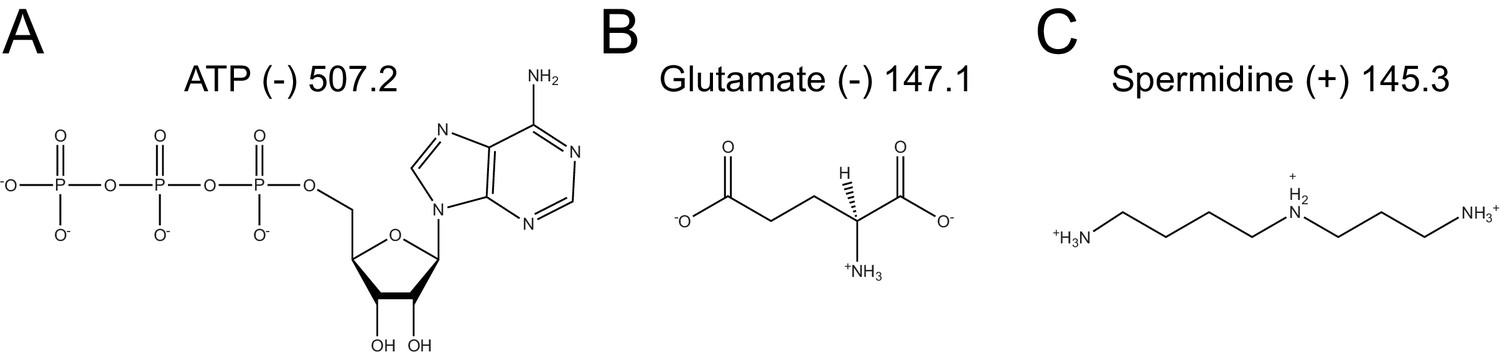
Chemical structures of metabolites.
Chemical structures, net charge, and molecular weight are shown for (A) adenosine triphosphate, (B) glutamate, and (C) spermidine.
Figure 4—figure supplement 2
ATP and Spermidine can flux through Pannexin 1 concurrently.
(A) Schematic depicting experimental design for treating Xenopus Pannexin 1 (fPanx1)-containing proteoliposomes with recombinant Caspase-3 (Casp3) overnight at 4°C before concurrent incubation with 4 μCi each of α[32P]-ATP (B, 1 mM; ~1:150,000, hot:cold) and [3H]-Spermidine (C, 8 µM; ~1:24) for 3 hr and filtration using a Whatman GF/B filter. Orange boxes depict 95% confidence intervals of Casp3-treated fPanx1 proteoliposome metabolite uptake of compounds incubated individually (from Figure 4B,D). By repeated-measures one-way ANOVA (ATP: F3,19 = 15.14, p=0.0002; spermidine: F3,16 = 12.17, p<0.0006), with p-values provided from Tukey’s multiple comparisons tests. Numerical data for ATP and spermidine concurrent flux are presented in Figure 4—figure supplement 2—source data 1.
-
Figure 4—figure supplement 2—source data 1
ATP and spermidine concurrent flux in proteoliposomes.
- https://cdn.elifesciences.org/articles/64787/elife-64787-fig4-figsupp2-data1-v2.xlsx
Tables
Key resources table
| Reagent type (species) or resource | Designation | Source or reference | Identifiers | Additional information |
|---|---|---|---|---|
| Gene (Xenopus tropicalis) | fPanx1 | GenBank | NM_001130256.1 | |
| Gene (Homo sapiens) | hPANX1 | GenBank | NM_015368.4 | |
| Cell line (Spodoptera frugiperda) | Sf9 | Expression Systems, Davis, CA | Parent cell line: IPLB-Sf-21-AE, RRID:CVCL_0518 | Clonal isolate derived from the parental cell line |
| Cell line (Homo sapiens) | HEK293T | ATCC | CRL-3216, RRID:CVCL_0063 | Negative for mycoplasma contamination at ATCC (obtained from Kodi Ravichandran lab) |
| Biological sample (Homo sapiens) | Caspase-3 | Kang et al. | ||
| Antibody | Anti-human/mouse/rat Pannexin-1 (rabbit monoclonal) | Cell Signaling Technology | D9M1C, RRID:AB_28000167 | 1:1000 dilution |
| Chemical compound, drug | Brain PC | Avanti Polar Lipids | 840053 | |
| Chemical compound, drug | Brain Total Lipid Extract | Avanti Polar Lipids | 131101 | |
| Chemical compound, drug | Brain PI(4,5)P2 | Avanti Polar Lipids | 840046 | |
| Chemical compound, drug | DPhPC | Avanti Polar Lipids | 860337 | |
| Chemical compound, drug | Sulforhodamine-B | Sigma Aldrich | S1402 | |
| Chemical compound, drug | Rhodamine B | Sigma Aldrich | 83689 | |
| Chemical compound, drug | Dextran, Tetramethylrhodamine,3000 MW, | ThermoFisher Scientific | D3307 | |
| Chemical compound, drug | Alexa 594 Carboxylic Acid, tris salt | ThermoFisher Scientific | A33082 | |
| Chemical compound, drug | Alexa 555 Carboxylic Acid, tris salt | ThermoFisher Scientific | A33080 | |
| Chemical compound, drug | ATTO 550 Phallodin | ATTO-TEC | AD 550–8 | |
| Chemical compound, drug | α-32P-ATP | PerkinElmer | BLU003H250UC | |
| Chemical compound, drug | 3H-Glutamate | PerkinElmer | NET490250UC | |
| Chemical compound, drug | 3H-Spermidine | PerkinElmer | NET522001MC | |
| Software, algorithm | LabView | Kiessling et al. | https://github.com/VolkerKirchheim/VK_TIRFsinglevesicleStep1 ; Narahari, 2021; (copy archived at 'swh:1:rev:79a55c09884d1fd3f4965ef1d1bf8f102711d828') |
Additional files
Download links
A two-part list of links to download the article, or parts of the article, in various formats.
Downloads (link to download the article as PDF)
Open citations (links to open the citations from this article in various online reference manager services)
Cite this article (links to download the citations from this article in formats compatible with various reference manager tools)
ATP and large signaling metabolites flux through caspase-activated Pannexin 1 channels
eLife 10:e64787.
https://doi.org/10.7554/eLife.64787


