Anti-ferroptotic mechanism of IL4i1-mediated amino acid metabolism
- Max Planck Institute of Biochemistry, Germany
- Universitätsklinikum Carl Gustav Carus Dresden, Germany
- Università degli Studi di Perugia, Italy
- The Donnelly Centre for Cellular and Biomolecular Research, University of Toronto, Canada
- SciGenom Research Foundation, India
- Helmholtz Zentrum München Center of Allergy and Environment (ZAUM), Technical University and Helmholtz Center Munich, Germany
- Vienna BioCenter Core Facilities GmbH, Austria
Figures
Figure 1 with 1 supplement
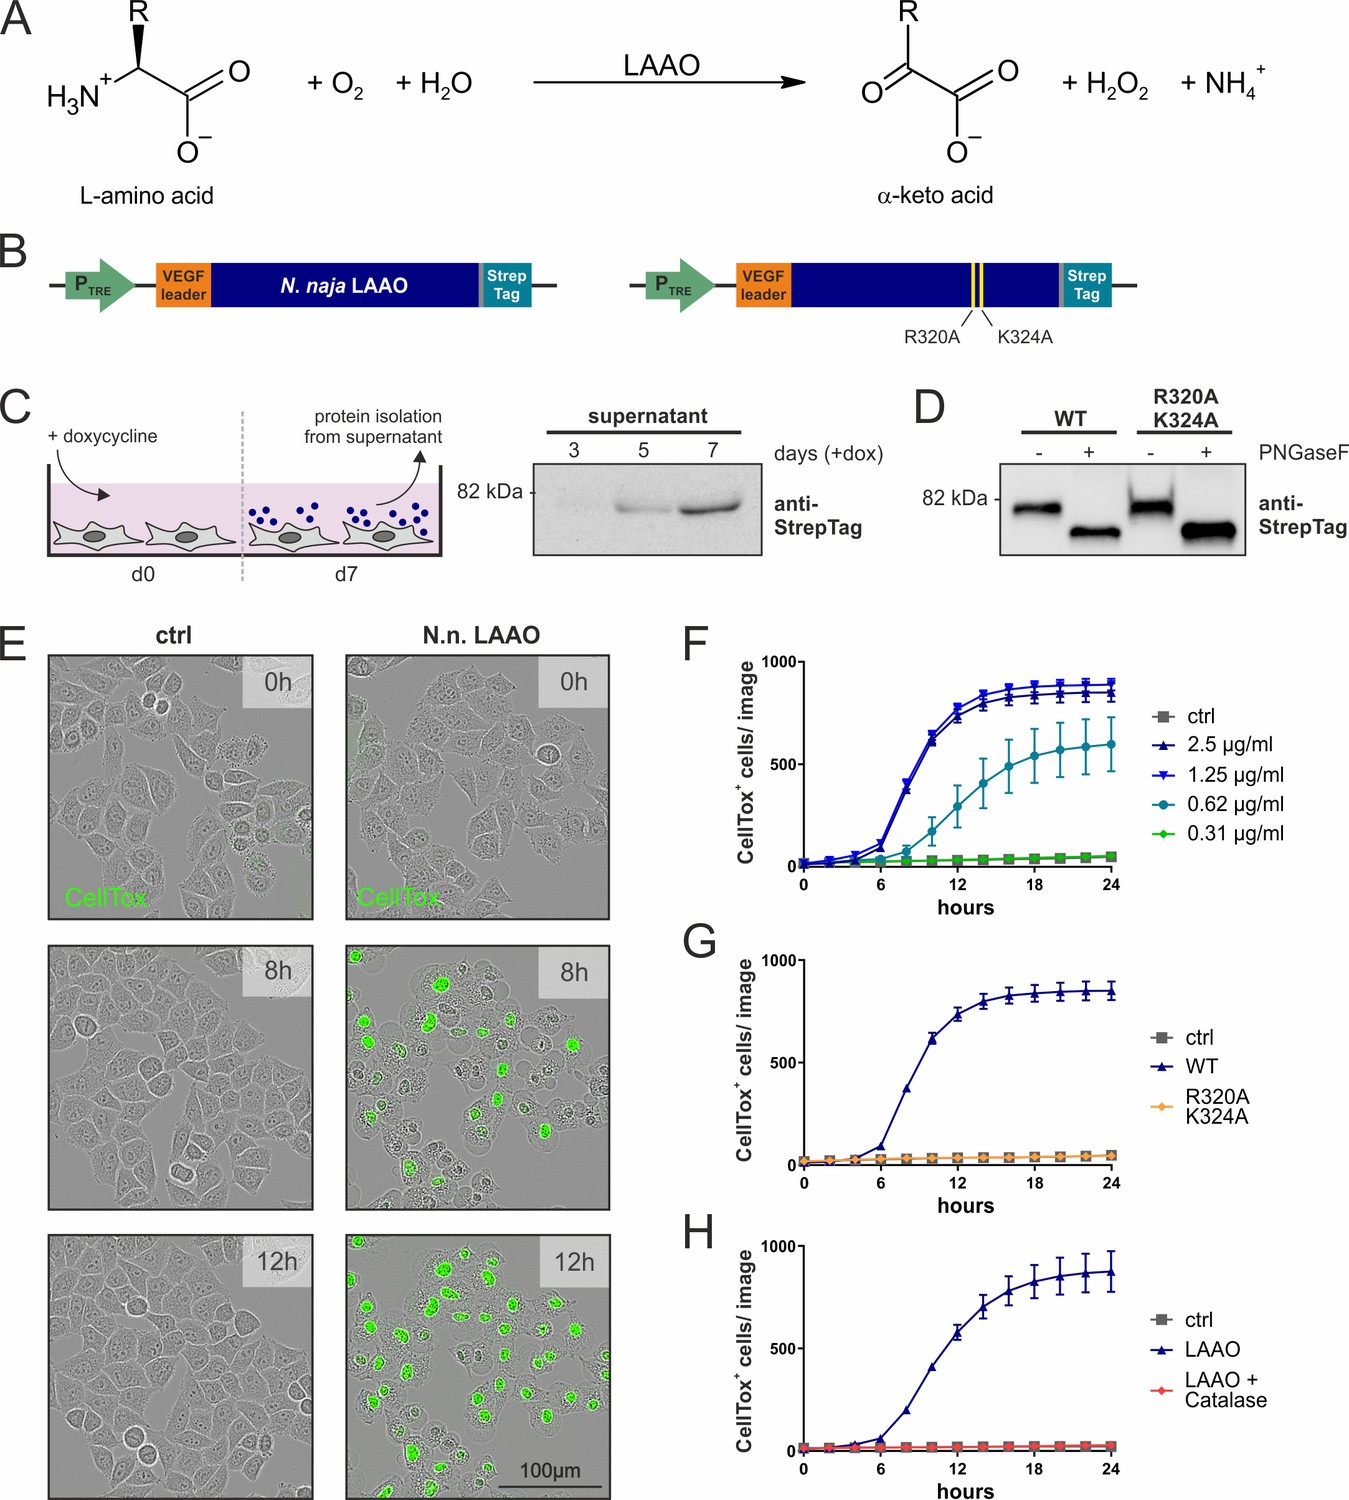
Naja naja LAAO is cell-lethal via H2O2.
(A) Reaction mechanism of L-amino acid oxidases (LAAOs). (B) Construct design to express venom LAAOs in mammalian cells. The N. naja LAAO variants contain the human VEGF signal sequence and a C-terminal Strep-tag to facilitate purification. Mutations R320A and K324A ablate catalytic activity. (C) Purification strategy for LAAO, which is isolated from the cell supernatant. (D) Immunoblotting of purified recombinant proteins. LAAO or the enzyme-dead variant are glycosylated in their secreted forms. (E) Representative microscopy images of HeLa cells stained with the cell death dye CellTox following addition of 2.5 µg/ml N. naja LAAO. (F) Quantification of cell death across time induced by N. naja LAAO. (G) N. naja LAAO R320A and K324A enzyme-dead version fails to induce death. 2.5 µg/ml of WT and mutant enzyme was added. (H) Addition of catalase (25 µg/ml) blocks cell death induced by N. naja LAAO (2.5 µg/ml). (F–H): n = 3 biological replicates; the graphs are representative for three independent experiments. All error bars represent standard deviation.
-
Figure 1—source data 1
Source data for the graphs in Figure 1.
- https://cdn.elifesciences.org/articles/64806/elife-64806-fig1-data1-v2.xlsx
Figure 1—figure supplement 1
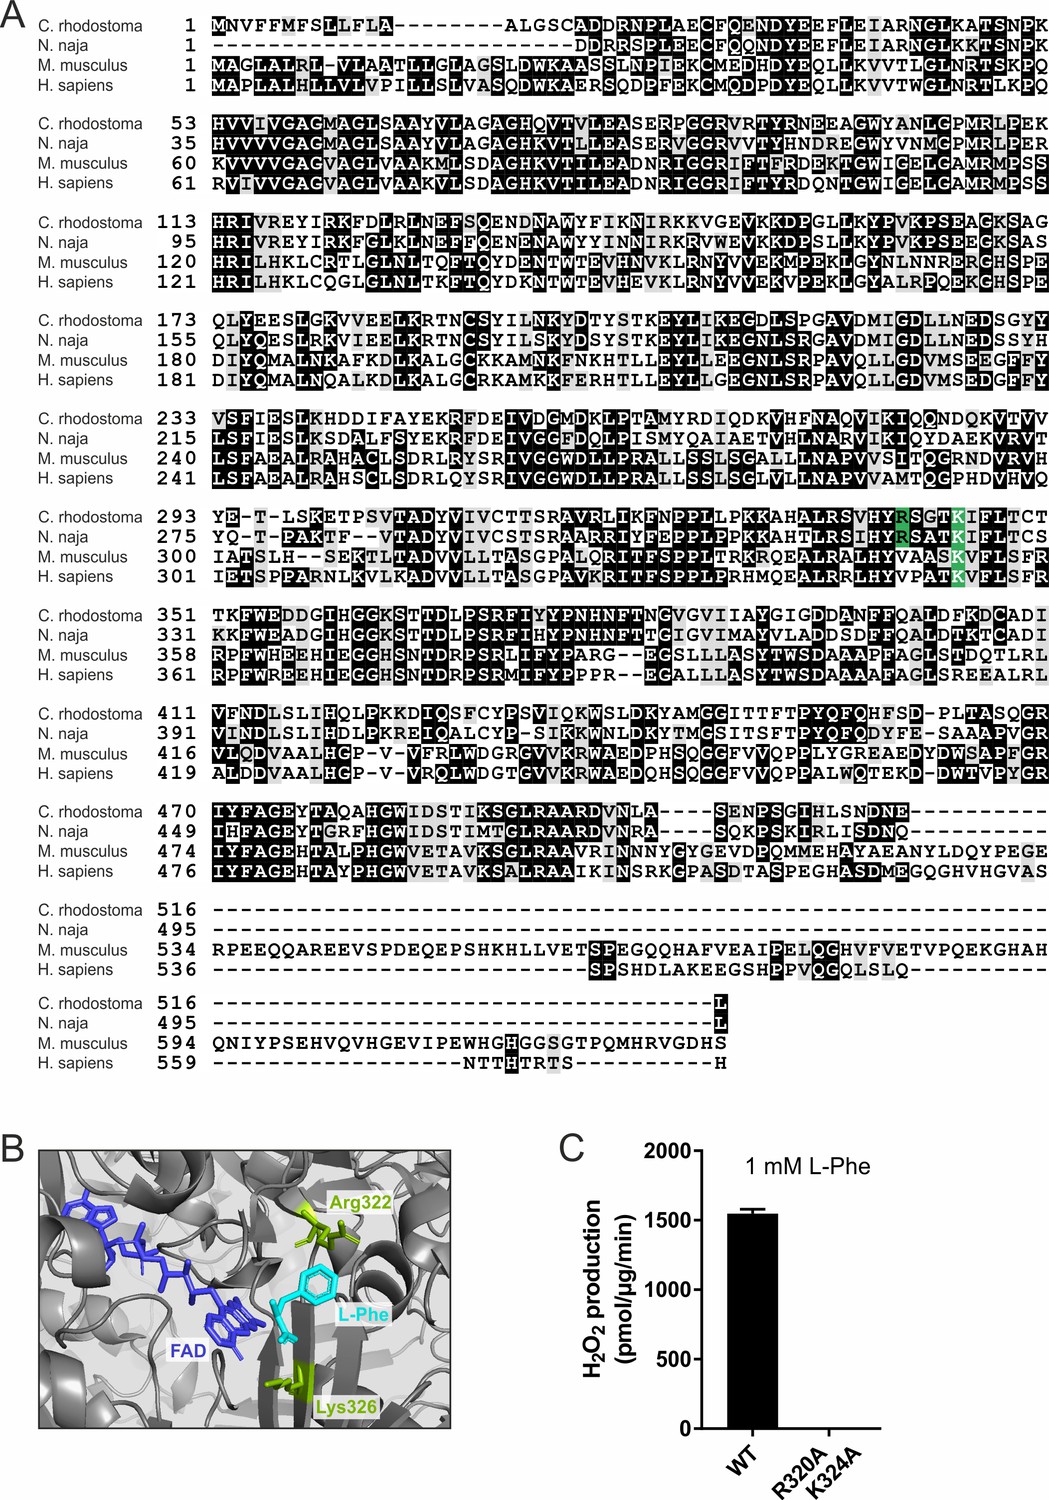
Naja naja LAAO is cell-lethal via H2O2.
(A) Multiple sequence alignment of Calloselasma rhodostoma, N. naja, LAAO, and Mus musculus and Homo sapiens IL4i1. Sites displayed in green represent residues used to generate enzyme-dead point mutants. (B) Representative structure of the catalytic domain of C. rhodostoma LAAO (PDB: 2IID) with co-factor FAD and substrate L-Phe. The conserved residues mutated in the N. naja enzyme-dead version are displayed in green. (C) LAAO WT and enzyme-dead variant activity, quantified as H2O2 production, with 1 mM of L-Phe as substrate (n = 3 technical replicates). Error bars represent standard deviation.
Figure 2 with 1 supplement
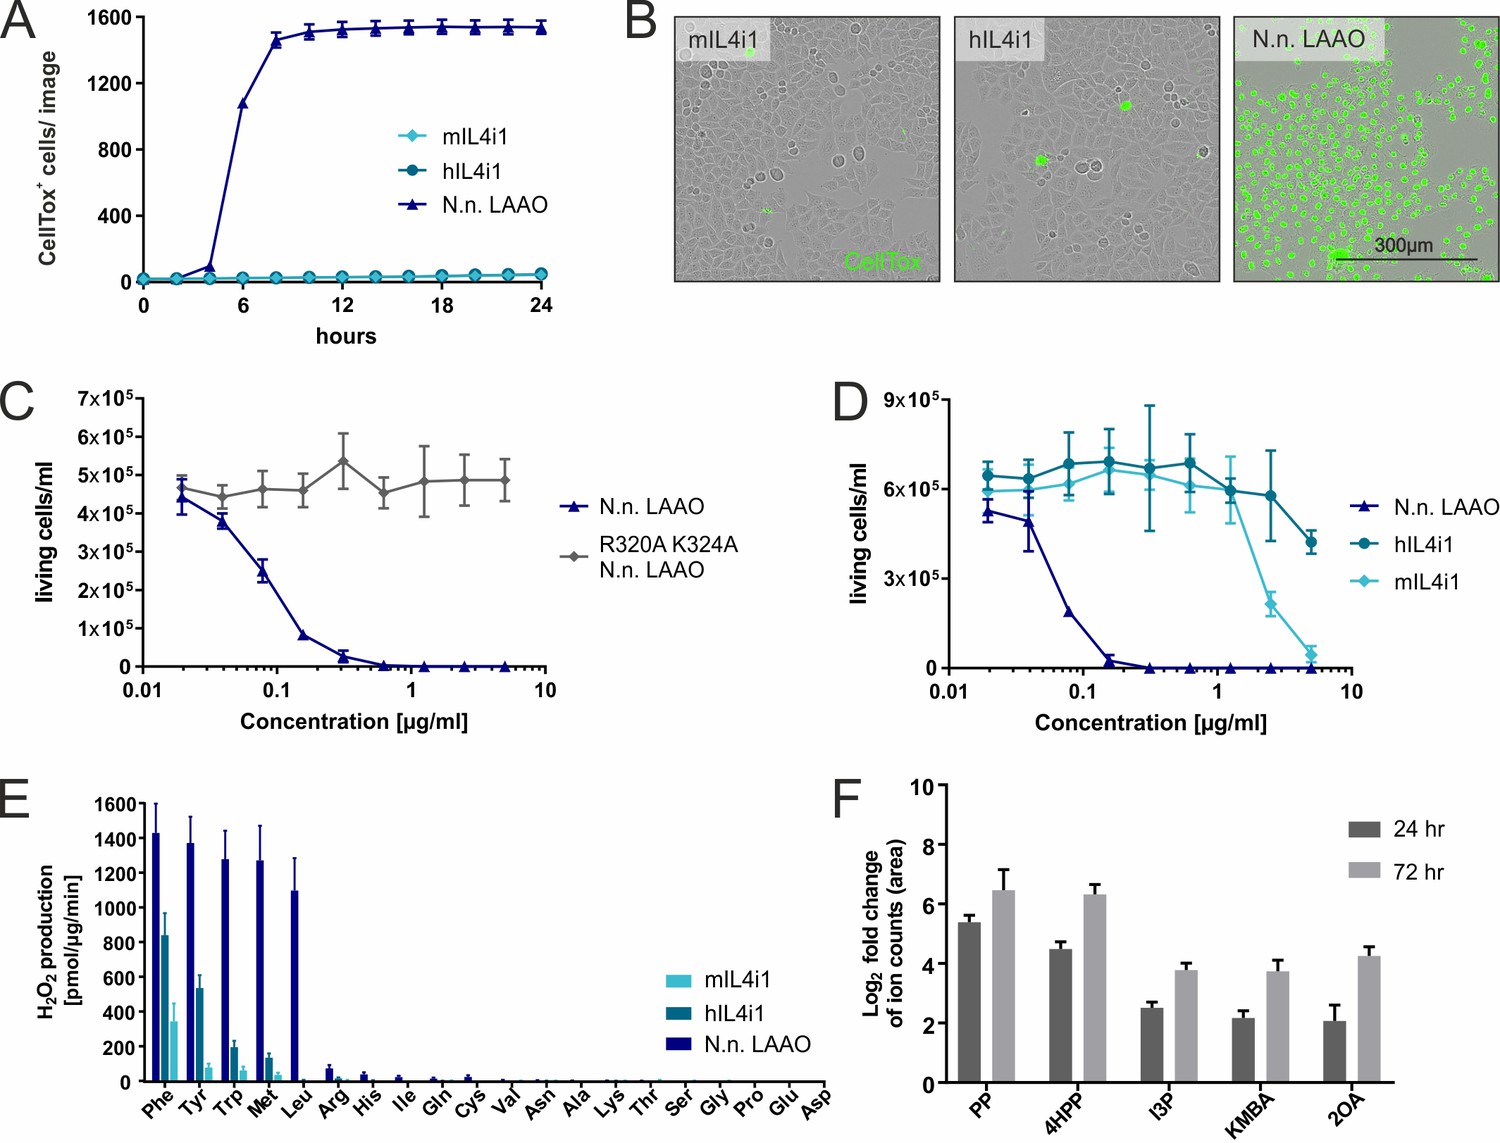
Substrate ranges and properties of IL4i1 compared to LAAO.
(A) Human or mouse IL4i1 fail to induce cell death of HeLa cells at equivalent concentrations to Naja naja LAAO (all enzymes added at 2.5 µg/ml) (n = 3 biological replicates). (B) Representative microscopy images with CellTox staining from an experiment similar to that in (A). (C) Activity of N. naja LAAO or its enzyme-dead mutant to RS4;11 human leukemia cells. 1 × 10⁴ cells were plated in round-bottom 96-well plates and treated with the indicated concentrations of LAAO enzyme. The final viable cell number was determined 72 hr after treatment (n = 3 biological replicates). (D) As in (C) comparing human and mouse IL4i1 to N. naja LAAO (n = 4 biological replicates). (E) Comparative enzyme activity of human and mouse IL4i1 versus N. naja LAAO using single amino acids. The graph includes three independent experiments. (F) Log2-fold change of ion counts compared to untreated medium of significantly increased amino acid metabolites (p<0.01) detected by untargeted metabolomics in DMEM incubated for 24 or 72 hr with 1 µg/ml of human IL4i1; n = 3 biological replicates. All error bars represent standard deviation.
-
Figure 2—source data 1
Source data for the graphs in Figure 2.
- https://cdn.elifesciences.org/articles/64806/elife-64806-fig2-data1-v2.xlsx
Figure 2—figure supplement 1
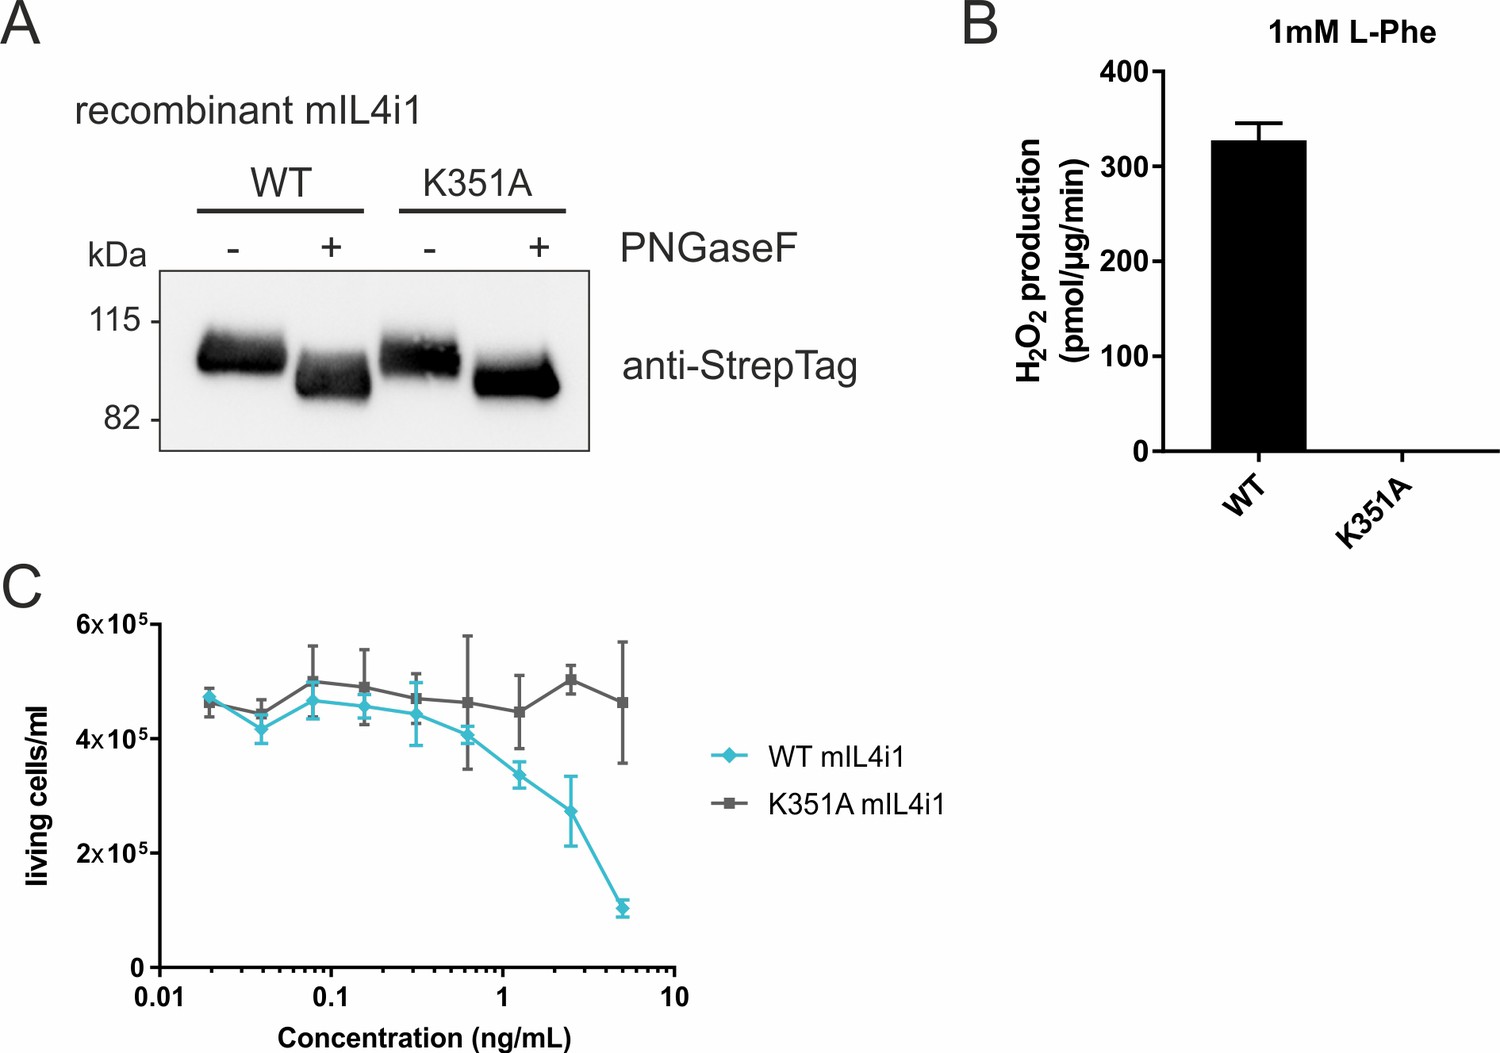
Substrate ranges and properties of IL4i1 compared to LAAO.
(A) Recombinant murine IL4i1 and the enzyme-dead variant are glycosylated in their secreted forms. (B) WT and mutant murine IL4i1 activity, quantified by H2O2 production with 1 mM of L-Phe as substrate (n = 3 technical replicates). (C) Cell viability of RS4;11 human leukemia cells in the presence of murine IL4i1 or its enzyme-dead mutant. 1 × 10⁴ cells were plated in round-bottom 96 well plates and treated with the indicated concentrations of IL4i1 enzyme. The final viable cell number was determined 72 hr after treatment (n = 3 biological replicates). All error bars represent standard deviation.
Figure 3
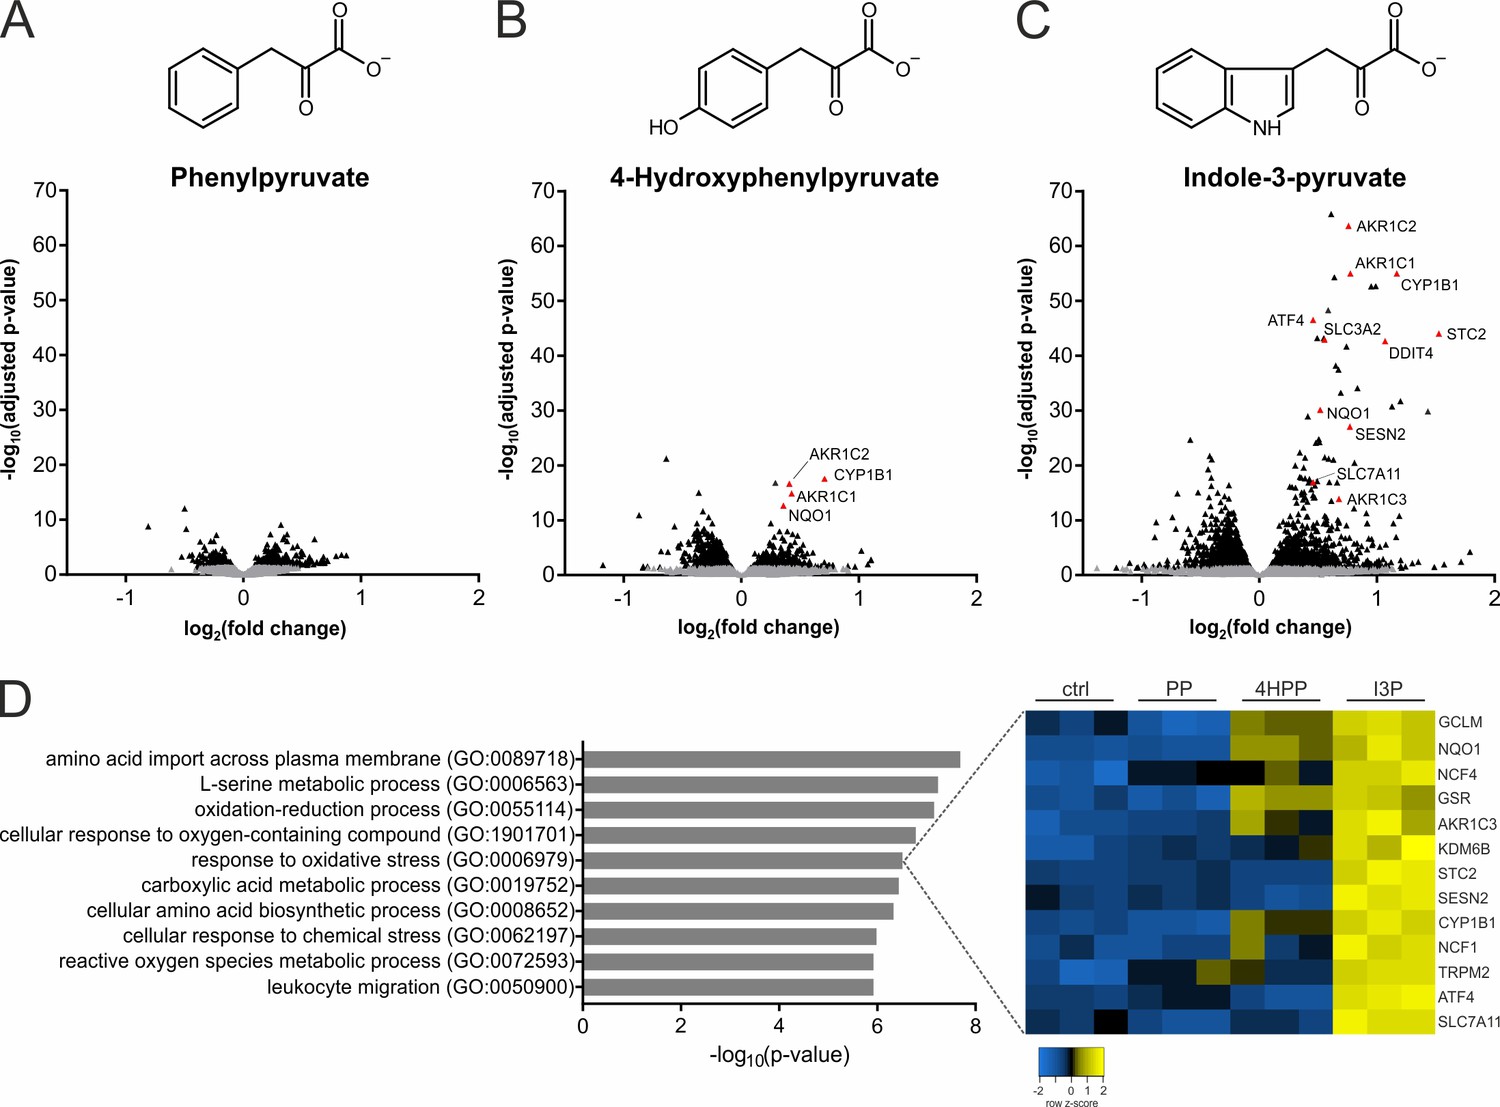
IL4i1 products induce specific stress and redox-protective gene expression programs.
(A–C) THP-1 human monocytic cells were trated for 24 hr with PP, 4HPP, or I3P (200 µM) and RNAseq analysis was used to quantify gene expression changes compared to untreated controls. (D) Top hits of GO term overrepresentation analysis of the most significantly (p-value cutoff p<10−9) upregulated genes by I3P treatment (left). The full table of significant GO terms is provided (Supplementary file 1). Heat map of genes detected in the analysis under the term GO:0006979 (right).
Figure 4 with 2 supplements
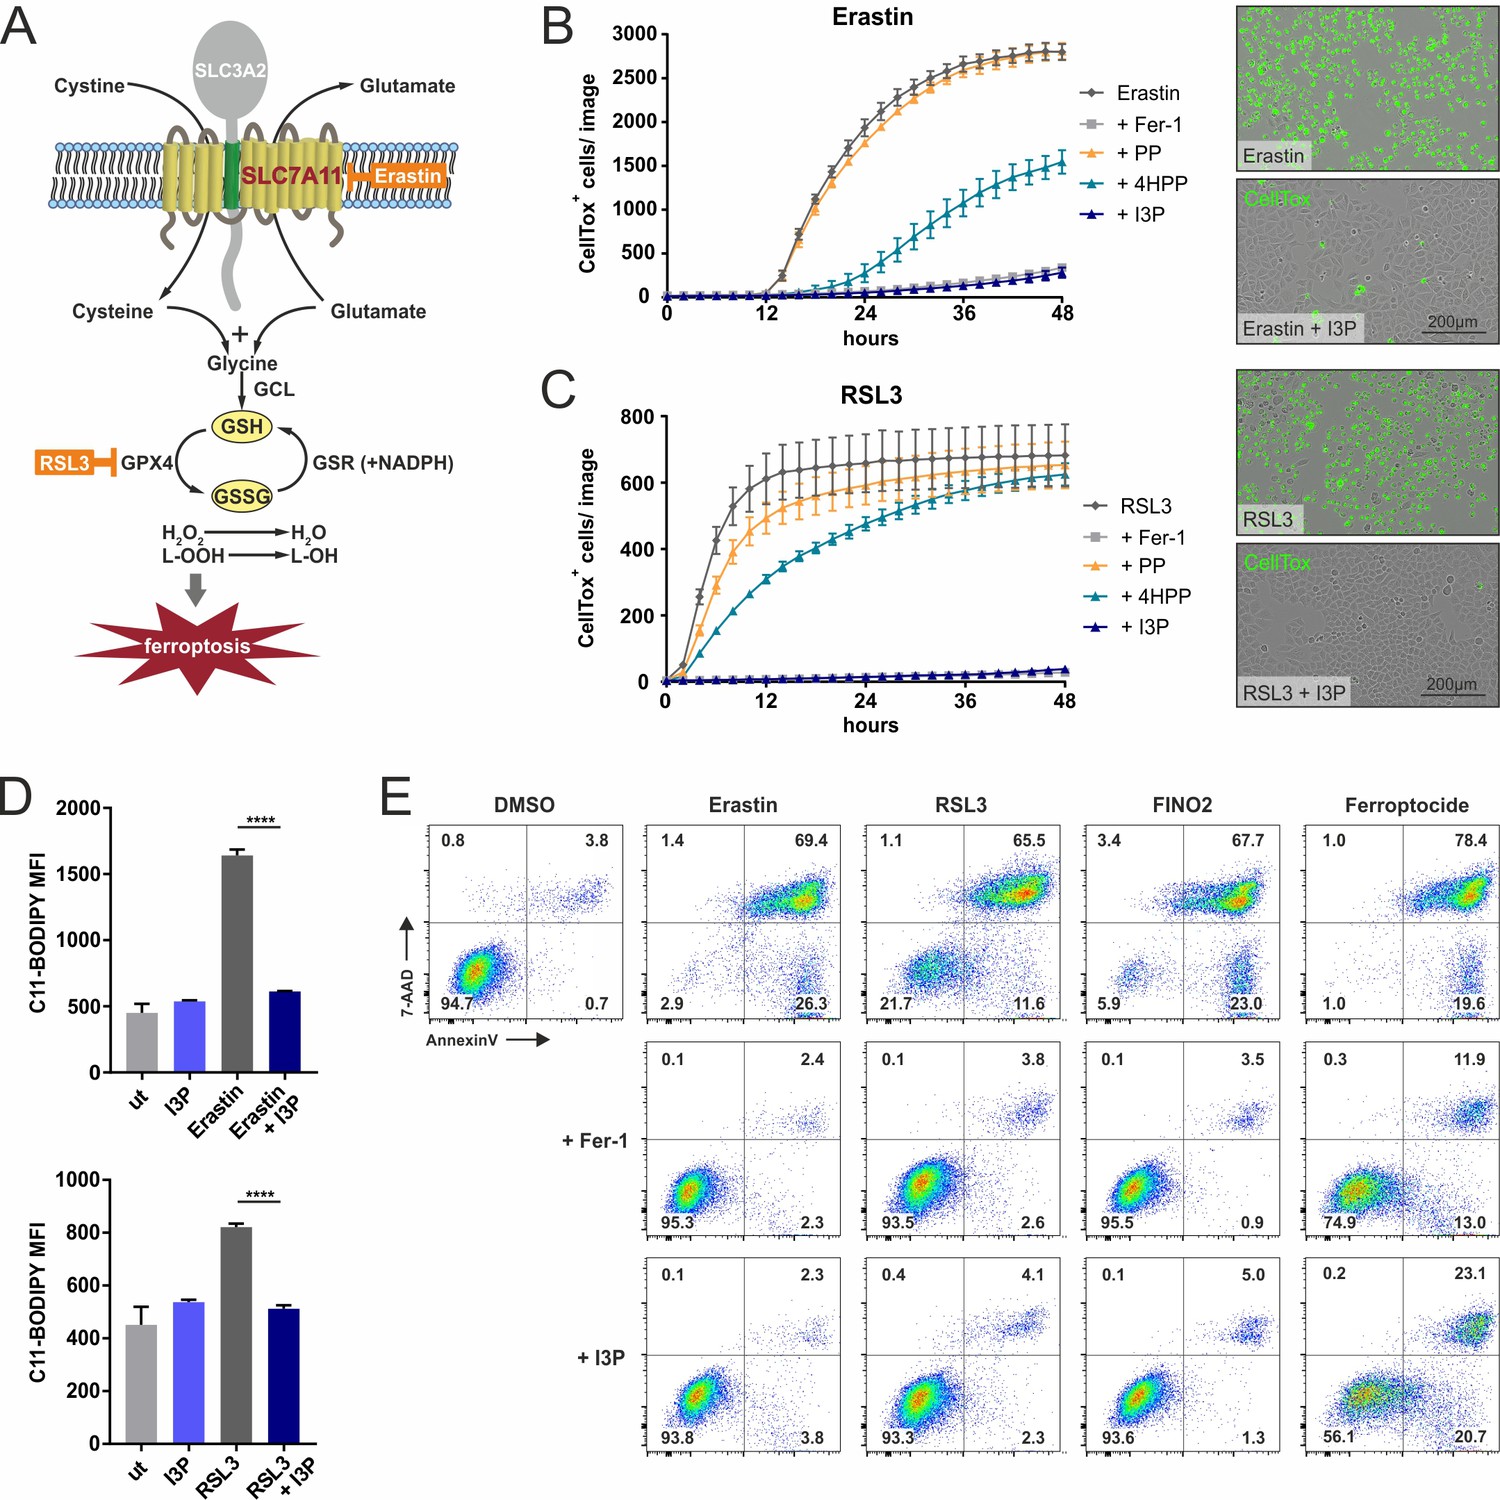
IL4i1 metabolites form an anti-ferroptotic hierarchy.
(A) Simplified schema of ferroptosis control showing the points of chemical perturbation by erastin and RSL3. (B) Quantification of cell death of HeLa cells treated with the ferroposis inducer erastin in the presence of 200 µM PP, 4HPP, or I3P by live cell imaging using CellTox straining. Ferrostatin-1 (Fer-1) was added as a control to block erastin-induced death and has an equivalent suppressing effect as I3P. Right panel, representative CellTox staining images from an experiment similar to (B). (C) As in B, using RSL3 to induce ferroptosis. B,C: n = 3 biological replicates. The graphs are representative for three independent experiments. (D) I3P blocks lipid peroxidation induced by erastin and RSL3 determined by flow cytometry using C11-BODIPY. n = 3 biological replicates; data were analyzed by one-way ANOVA with Tukey's multiple comparisons test; ****p<0.0001. All error bars represent standard deviation. (E) Flow cytometry analysis of the anti-ferroptotic activity of I3P (200 µM) using Fer-1 as positive control. Murine NIH3T3 cells were treated with erastin, RSL3, FINO2, or ferroptocide to induce ferroptosis in the absence or presence of Fer-1or I3P and death quantified by 7-AAD and Annexin-V staining. See 'Materials and methods' for details of reagent concentrations and timing. The plots are representative for two independent experiments.
-
Figure 4—source data 1
Source data for the graphs in Figure 4.
- https://cdn.elifesciences.org/articles/64806/elife-64806-fig4-data1-v2.xlsx
Figure 4—figure supplement 1
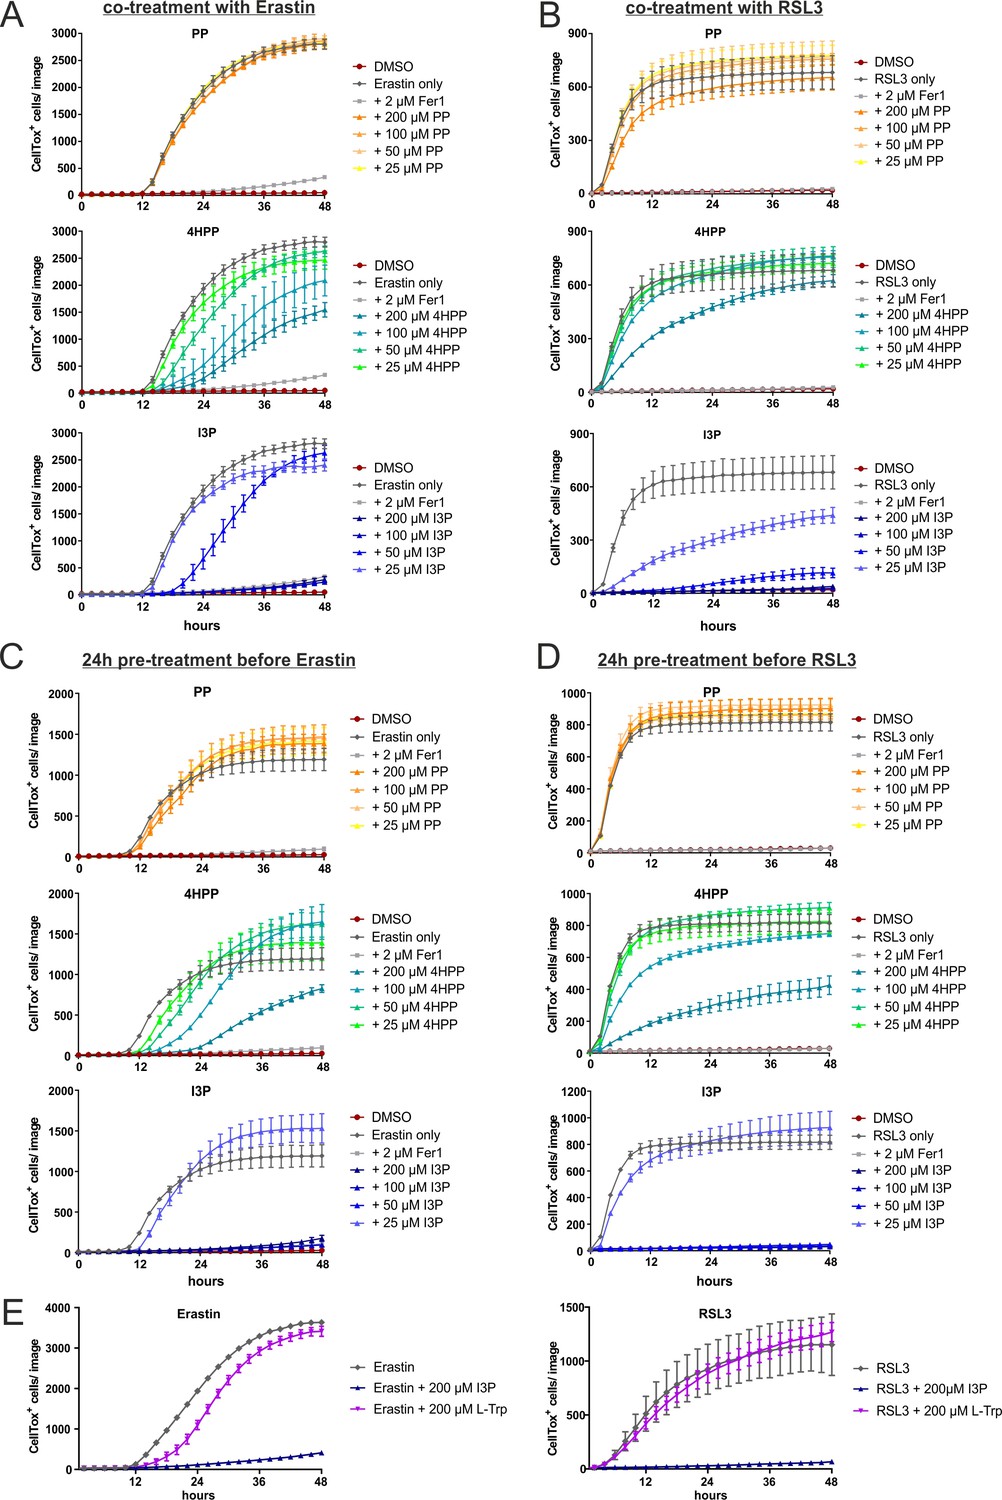
IL4i1 metabolites form an anti-ferroptotic hierarchy.
(A) HeLa cells were concurrently treated with erastin in the presence of increasing doses of PP, 4HPP, or I3P and death quantified over time using Incucyte imaging of CellTox straining. Ferrostatin-1 was added as a control. (B) As in (A), but using RSL3 to induce ferroptosis. (C) As in (A), but with 24 hr pre-treatment with the keto-acids before inducing ferroptosis with erastin. (D) As in (C), using RSL3 to induce ferroptosis. (E) HeLa cells were concurrently treated with erastin or RSL3 in the presence of 200 µM L-Trp, 200 µM I3P, or control DMEM medium. All experiments: n = 3 biological replicates; the graphs are representative for three independent experiments. All error bars represent standard deviation.
Figure 4—figure supplement 2
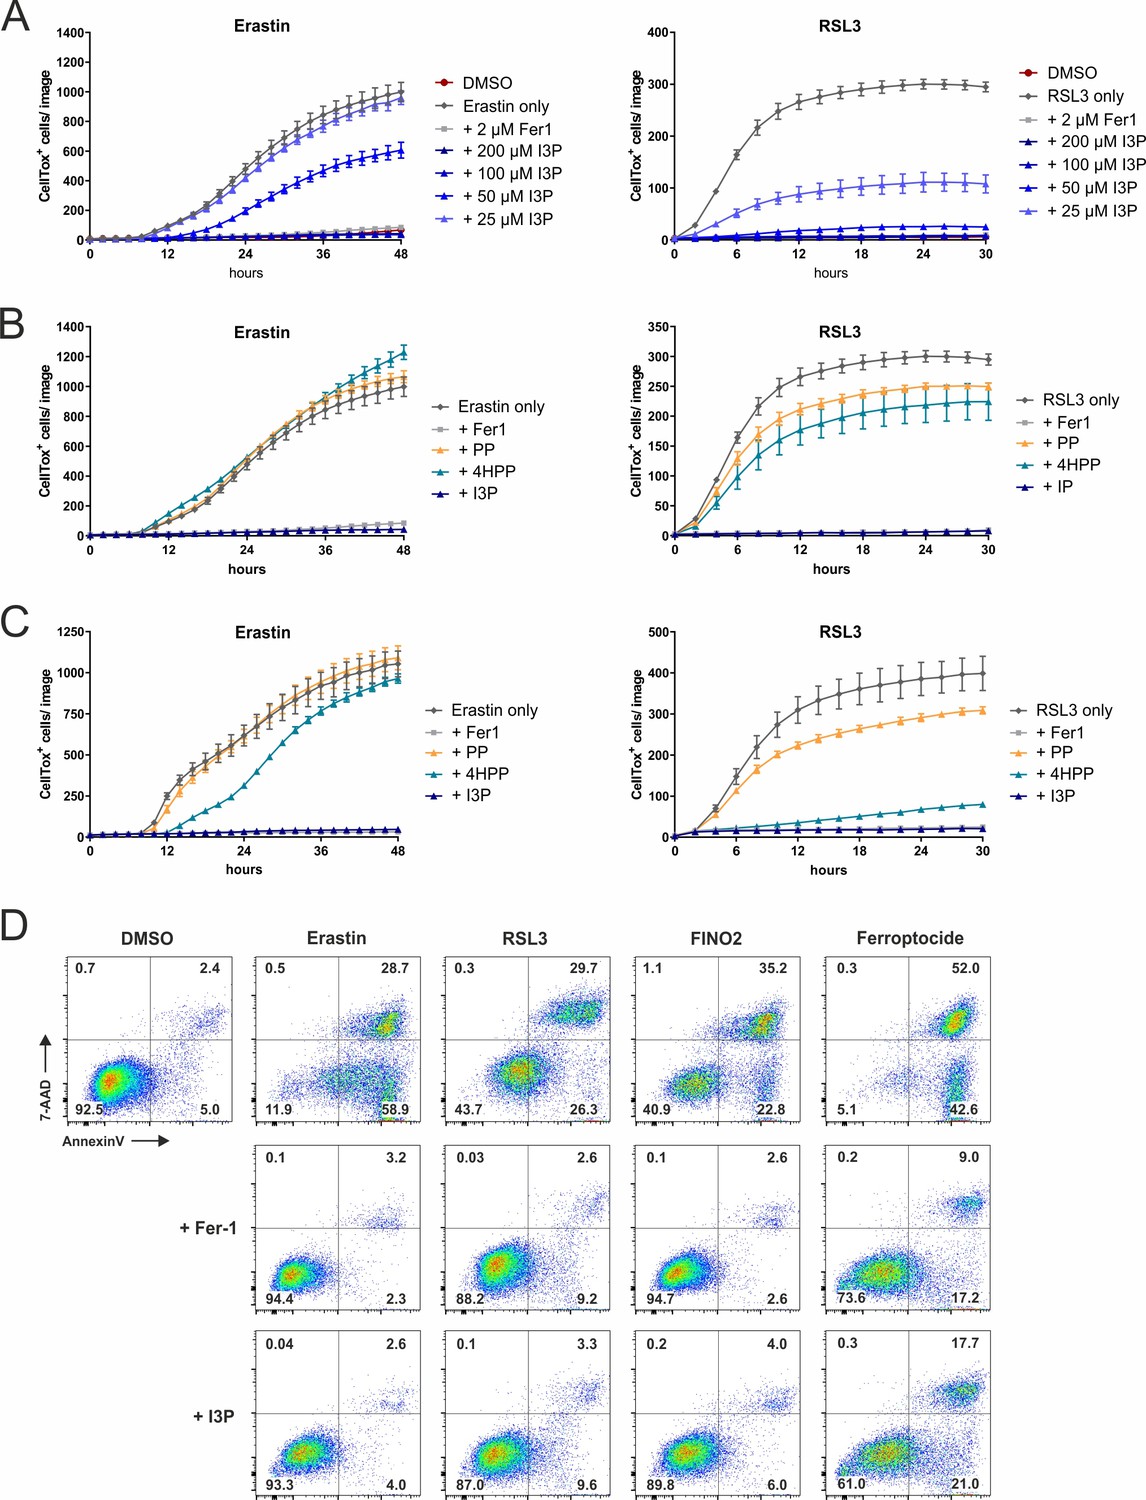
IL4i1 metabolites form an anti-ferroptotic hierarchy.
(A) HT1080 cells were concurrently treated with erastin (left) and RSL3 (right) in the presence of increasing doses of I3P and death quantified over time using Incucyte imaging of CellTox straining. Ferrostatin-1 was added as a control. (B) As in (A), comparing 200 µM of PP, 4HPP, and I3P. (C) As in (B), but with 24 hr of pre-treatment with the keto-acids before inducing ferroptosis. A–C: n = 3 biological replicates. The graphs are representative for two independent experiments. All error bars represent standard deviation. (D) Flow cytometry analysis of the anti-ferroptotic activity of I3P (200 µM) using Fer-1 as positive control. HT1080 cells were treated with erastin, RSL3, FINO2, or ferroptocide to induce ferroptosis in the absence or presence of ferrostatin or I3P and death quantified by 7-AAD and Annexin-V staining. The plots are representative for two independent experiments.
Figure 5 with 2 supplements
Anti-ferroptotic mechanisms of I3P.
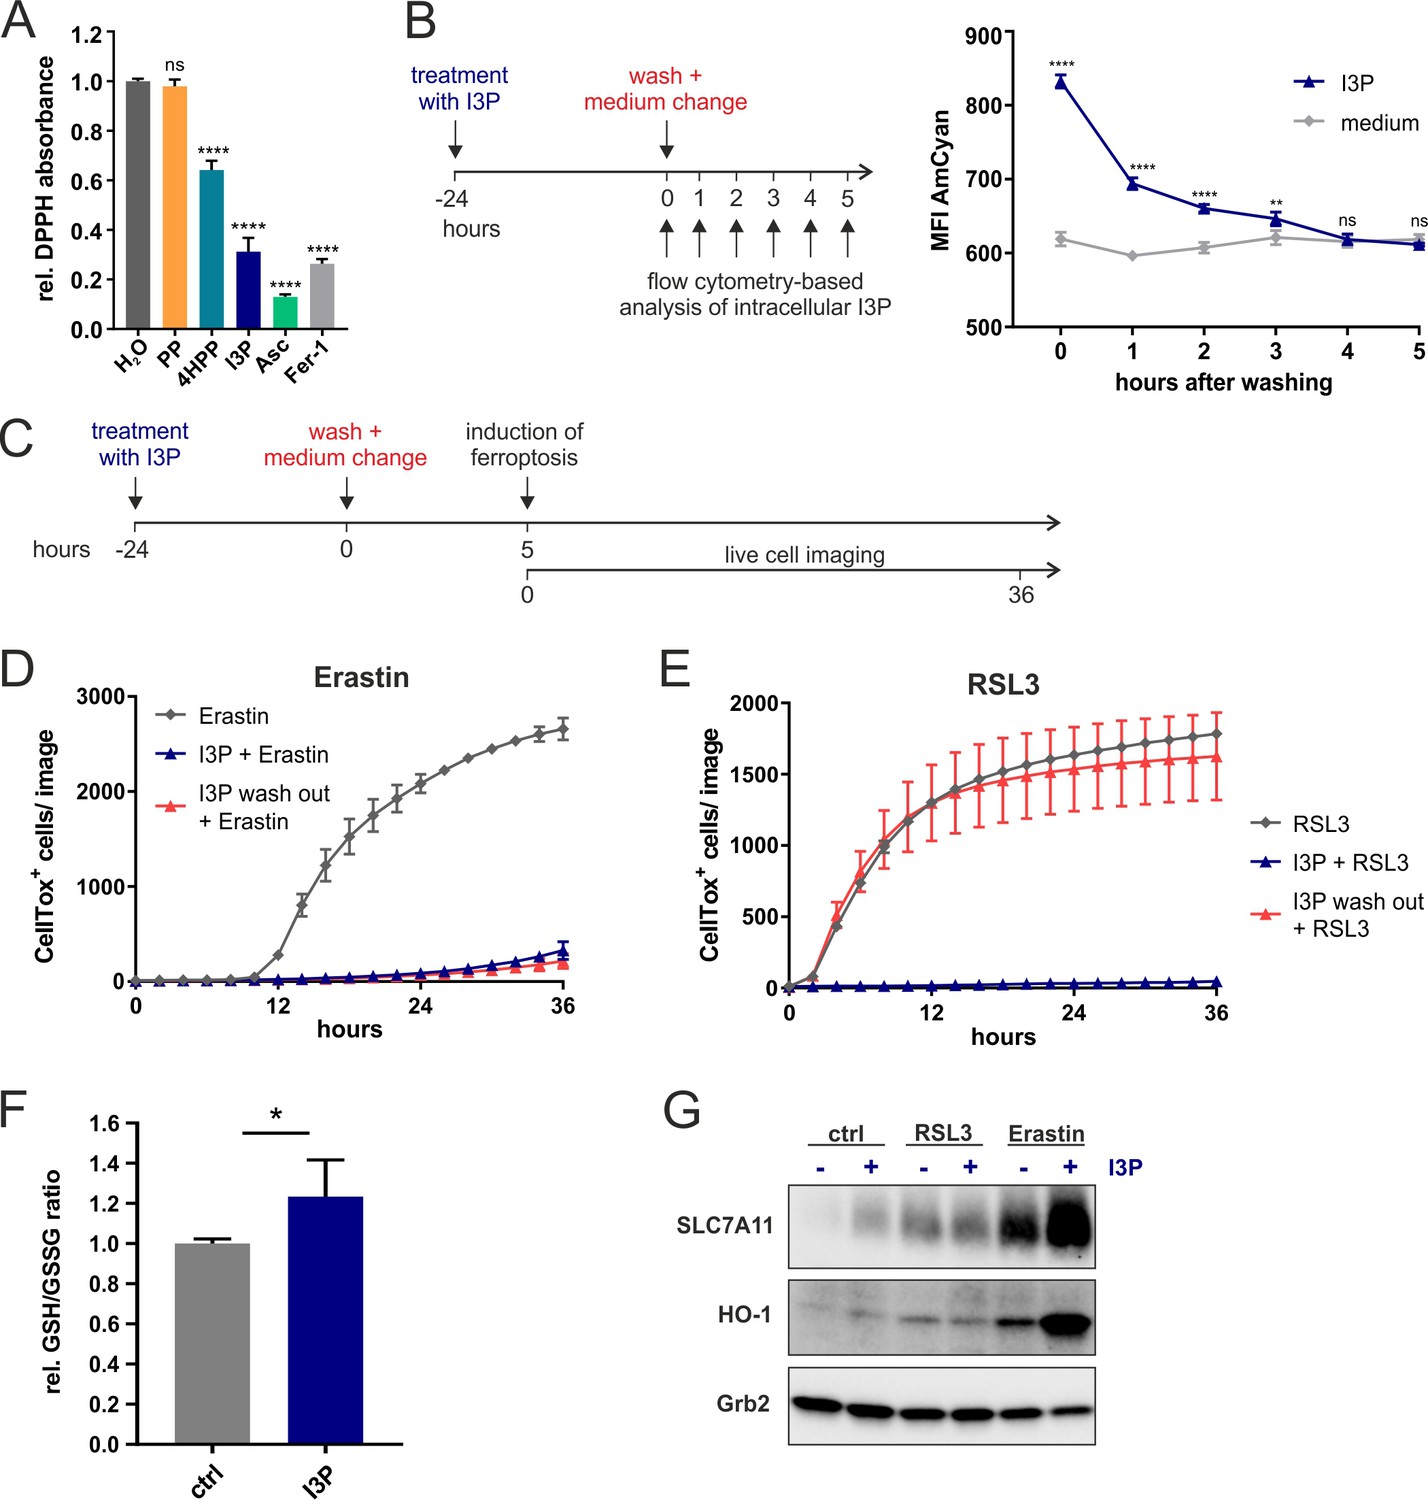
(A) Cell-free scavenging activity of 200 µM PP, 4HPP, I3P, ascorbic acid (Asc), and Fer-1 determined by changes in the absorbance at 517 nm of the stable radical DPPH relative to H2O control. n = 4 Technical replicates; the graphs are representative for three independent experiments. Data were analyzed by one-way ANOVA with Dunnett’s multiple comparisons test; ****p<0.0001; ns = not significant. (B) Design of a wash-out experiment to quantify intracellular I3P. HeLa cells were incubated for 24 hr with or without 200 µM I3P. After washing-out the I3P-containing medium, remaining intracellular I3P was determined by flow cytometry at the indicated time points. n = 3 biological replicates; the graphs are representative for three independent experiments. Data were analyzed by two-way ANOVA with Sidak's multiple comparisons test; **p<0.01; ****p<0.0001; ns = not significant. (C) Adaptation of the assay in (B) to quantify direct versus indirect protective effects of I3P. (D) I3P retains protective activity against erastin-induced ferroptosis after wash-out. (E) I3P only protects against RSL3-induced ferroptosis if present in cells during the time of GPX4 inhibition. D,E: n = 2 biological replicates; the graphs are representative for three independent experiments. (F) GSH/GSSG ratio in HeLa cells treated with 200 µM I3P for 24 hr relative to untreated control. n = 4 biological replicates; data were analyzed using an unpaired t-test; *p<0,05. All error bars represent standard deviation. (G) I3P induces the expression of SLC7A11 and HO-1 at protein level. HeLa cells were treated with I3P in the absence or presence of erastin or RSL3 for 24 hr and SLC7A11 and HO-1 levels determined by immunoblotting. Grb2 was used as loading control.
-
Figure 5—source data 1
Source data ffor the graphs in Figure 5.
- https://cdn.elifesciences.org/articles/64806/elife-64806-fig5-data1-v2.xlsx
Figure 5—figure supplement 1

Anti-ferroptotic mechanisms of I3P.
(A) Absorption (grey line) and emission (light blue line) spectra of I3P in neutral aqueous solution. (B) Flow cytometric evaluation of I3P uptake (200 µM, 24 hr) by HeLa cells. Data acquired using 405 nm violet laser. (C) HeLa cells were treated with 200 µM of I3P and 2, 6, and 24 hr and I3P uptake monitored by flow cytometry analyzing the mean fluorescence intensity in the AmCyan channel. n = 3 biological replicates; the graph is representative for three independent experiments. Error bars represent standard deviation.
Figure 5—figure supplement 2
Anti-ferroptotic mechanisms of I3P.
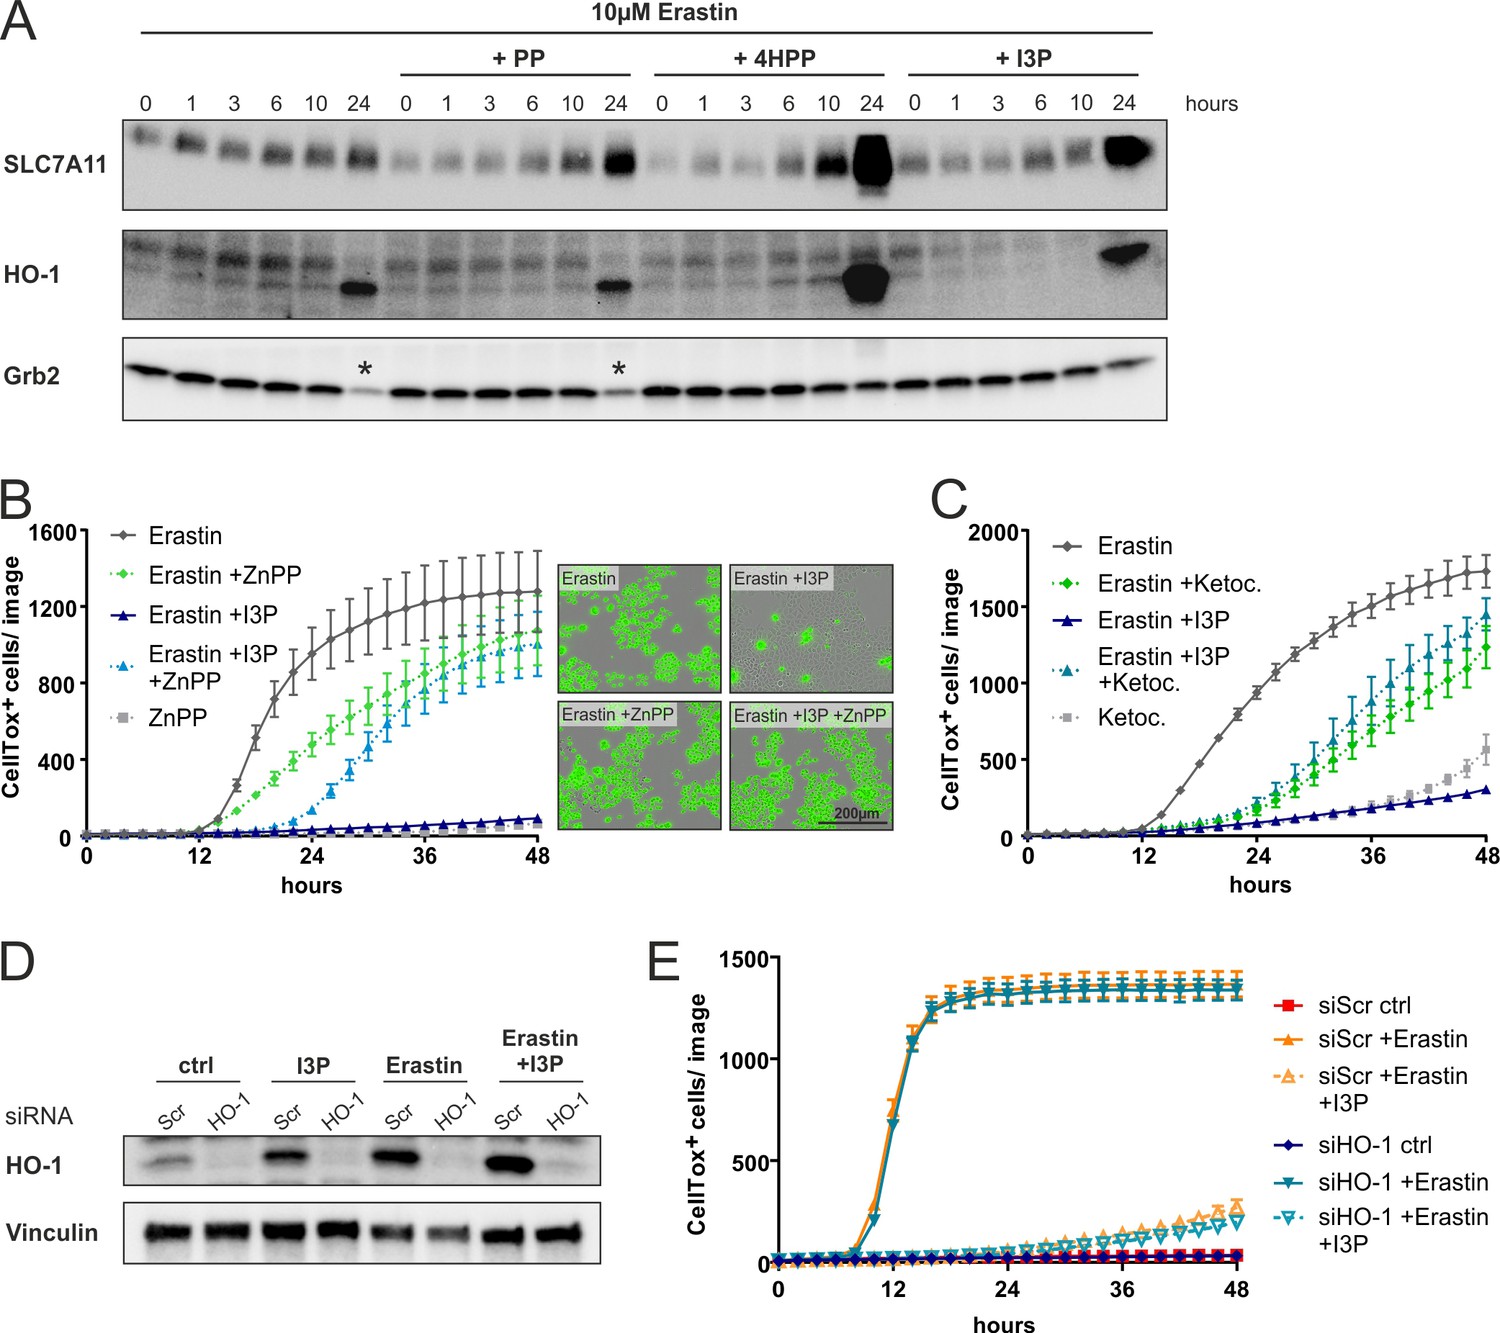
(A) I3P and 4HPP induce the expression of SLC7A11 and HO-1 at protein level. HeLa cells were treated with erastin in the presence of 200 µM of PP, 4HPP, and I3P for the indicated time and SLC7A11 or HO-1 protein levels were determined by immunoblotting; * indicates less protein amount due to cell death. (B) ZnPP (light blue triangles) interferes with the protective effects of I3P against erastin-induced ferroptosis. HeLa cells were treated with erastin in presence or absence of I3P with or without 10 µM of ZnPP and cell death quantified by CellTox Incucyte imaging. n = 2 biological replicates; the graph is representative for three independent experiments. Right: representative images of CellTox staining. (C) As in (B) using 100 µM ketoconazole. (D) Immunoblotting of HO-1 in cells transfected with 50 nM siRNA (siScr negative ctrl or siHO-1). Cells were lyzed 15 hr after treatment with 200 µM I3P, 10 µM erastin, or a combination of both. Vinculin was used as loading control. (E) HeLa cells were cells transfected with 50 nM siRNA (siScr negative ctrl or siHO-1). Ferroptosis was induced with 10 µM erastin in the presence or absence of 200 µM I3P and quantified by CellTox staining using the Incucyte device. n = 3 biological replicates; the graph is representative for three independent experiments. All error bars represent standard deviation.
Figure 6 with 1 supplement
IL4i1 generates an anti-ferroptotic milieu.
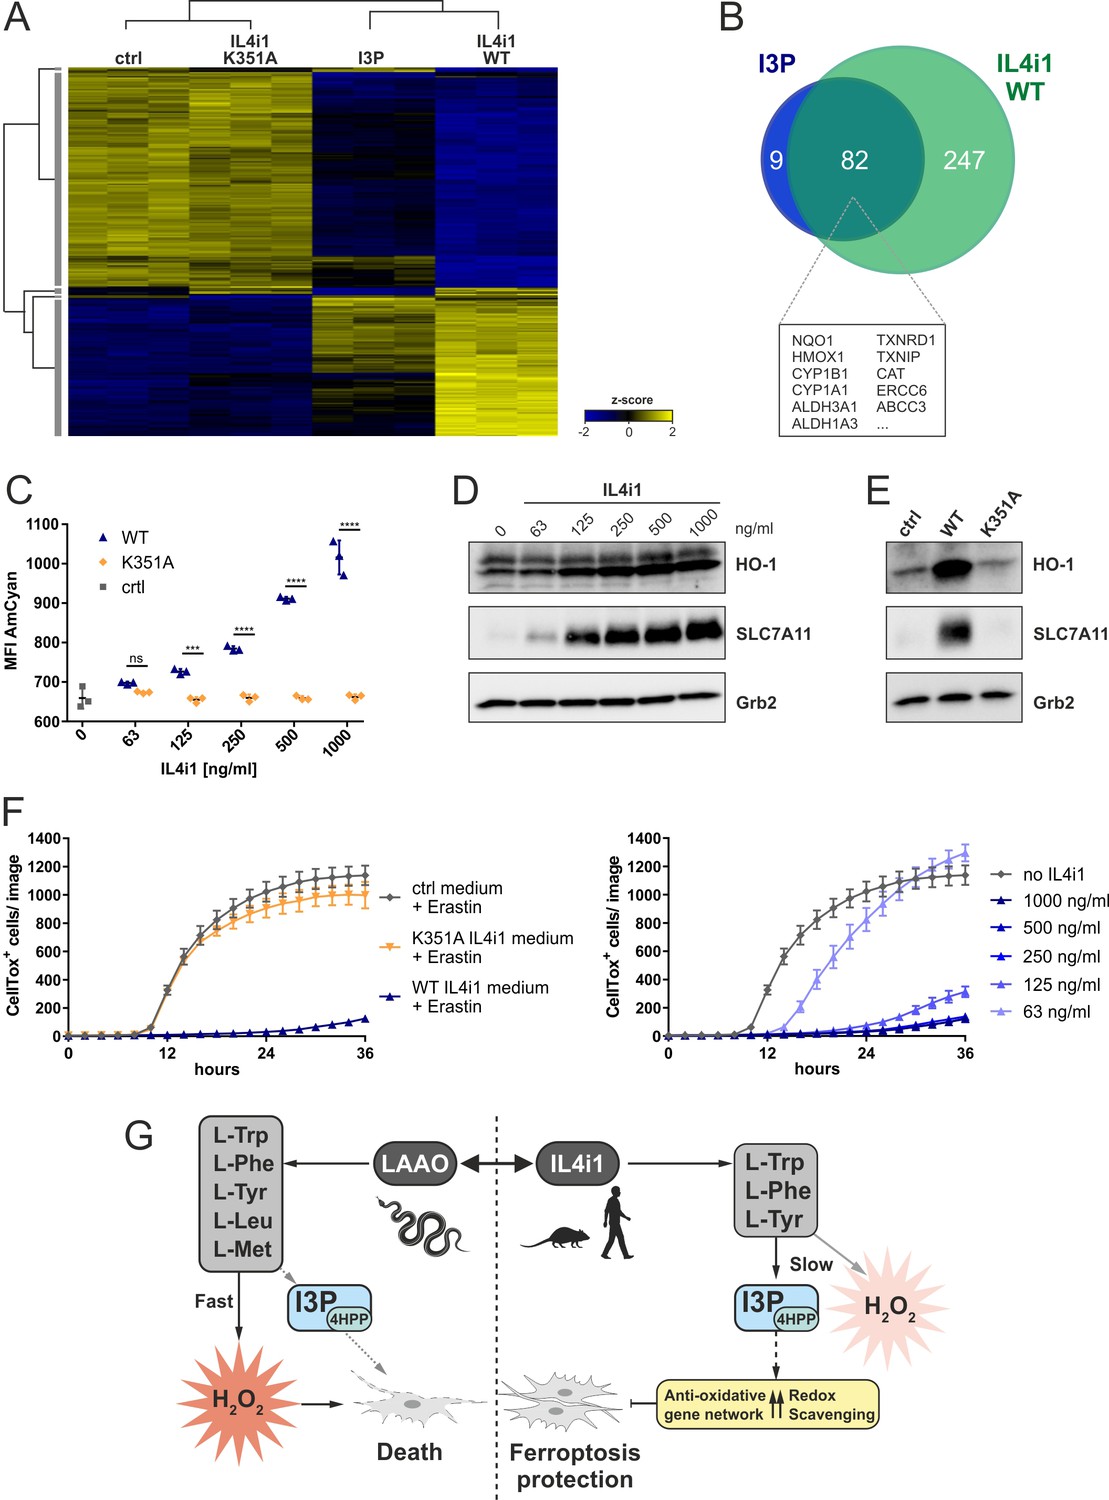
(A) Heat map of differentially expressed genes in HeLa cells after 24 hr incubation with IL4i1 (WT or K351A inactive mutant [Figure 2—figure supplement 1])-conditioned DMEM, 200 µM I3P, or untreated control medium. (B) Overlap of most significantly upregulated genes as compared to the untreated HeLa cells (adjusted p-value<10−9) in HeLa cells treated with I3P and WT IL4i1 conditioned medium. Many of the overlapping genes are associated with Nrf2 and AhR signaling. (C) I3P uptake by HeLa cells was quantified after 24 hr of incubation with IL4i1 conditioned DMEM by flow cytometry. n = 3 biological replicates; the graph is representative for three independent experiments. Data were analyzed by two-way ANOVA with Sidak's multiple comparisons test; ***p<0.001; ****p<0.0001; ns = not significant. (D, E) HO-1 or SLC7A11 expression was determined by immunoblotting following transfer of complete DMEM media treated with increasing concentrations of IL4i1 or enzyme-dead K351A mutant for 24 hr. (F) Quantification of erastin-induced ferroptosis in HeLa cells in the presence of IL4i1 conditioned DMEM. WT but not K351A mutant IL4i1 conditioned medium (1 µg/ml) suppressed ferroptosis (left). The anti-ferroptotic effect of IL4i1 is concentration dependent (right). n = 2 biological replicates; the graphs are representative for three independent experiments. All error bars represent standard deviation. (G) Schematic representation of the death-inducing versus death-protection mechanisms of venom LAAO versus mammalian IL4i1.
-
Figure 6—source data 1
Source data for the graphs in Figure 6.
- https://cdn.elifesciences.org/articles/64806/elife-64806-fig6-data1-v2.xlsx
Figure 6—figure supplement 1

IL4i1 generates an anti-ferroptotic milieu.
(A) Quantification of RSL3-induced ferroptosis in HeLa cells in the presence of IL4i1 conditioned DMEM. WT but not K351A mutant IL4i1 conditioned medium (1 µg/ml) suppressed ferroptosis (left). The anti-ferroptotic effect of IL4i1 is concentration dependent (right). n = 2 biological replicates; the graphs are representative for three independent experiments. (B) Simplified schema and representative immunoblot of IL4i1 removal by filtration of the conditioned medium using a 10 kDa centrifugal filter. (C) HO-1 and SLC7A11 expression in HeLa cells after 24 hr incubation with filtered DMEM media treated or not treated with recombinant IL4i1 (1 µg/ml) was analyzed by immunoblotting. (D) Filtered DMEM without or treated with recombinant IL4i1 (1 µg/ml) was used to quantify ferroptosis suppression of erastin (left) and RSL3 (right) treated HeLa cells (n = 3 biological replicates). (E) Quantification of erastin-induced ferroptosis in HeLa cells in the presence of medium with human plasma concentrations of amino acids and glucose. The medium was pre-incubated for 72 hr with IL4i1, transferred to the cells and ferroptosis induced with 1 µM erastin. (F) Quantification of cell death induced by 1.25 µg/ml snake venom LAAO in HeLa cells in the presence of IL4i1 conditioned DMEM. (G) Quantification of cell death induced by 1.25 µg/ml snake venom LAAO in HeLa cells in the presence of the ferroptosis inhibitors ferrostatin-1 (Fer-1, 2 µM) and liproxstatin-1 (Lip-1, 1 µM). E–G: n = 3 biological replicates. The graphs are representative for three independent experiments. All error bars represent standard deviation.
Author response image 1
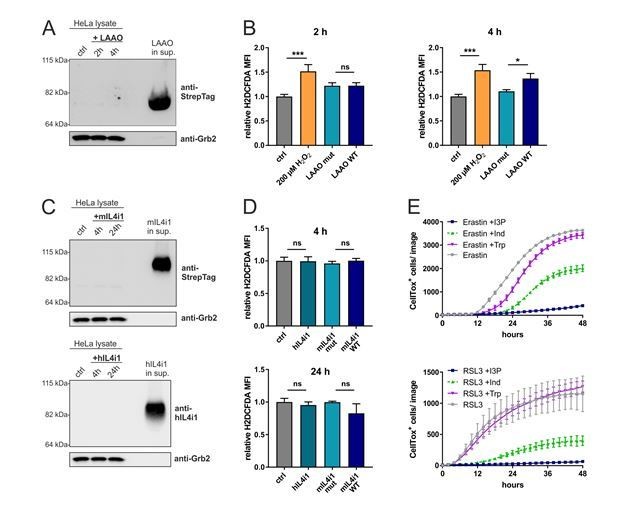
(A) Immunoblotting of LAAO in HeLa cell lysates and supernatant after 2 and 4 hr treatment with 1µg/ml of the recombinant LAAO enzyme.
(B) ROS quantification in HeLa cells treated for 4 hr with WT and mutant LAAO by flow cytometry using the ROS probe H2DCFDA. 200 µM H2O2 was used as a positive control. n=3 biological replicates, the graph is representative for 3 independent experiments. Data was analyzed by one-way ANOVA with Tukey's multiple comparisons test; *p<0.05; ***p<0.001; ns = not significant. (C) Immunoblotting of IL4i1 in HeLa cell lysates and supernatant after 4 and 24 hr treatment with 1µg/ml of the recombinant mouse and human IL4i1 enzyme. (D) ROS quantification in HeLa cells treated for 4 or 24 hr with human, mouse WT and mouse mutant IL4i1 by flow cytometry using the ROS probe H2DCFDA. n=3 biological replicates, the graph is representative of 3 independent experiments. Data was analyzed by one-way ANOVA with Tukey's multiple comparisons test; ns = not significant. (E) HeLa cells were concurrently treated with erastin or RSL3 in presence of 200 µM I3P, 200 µM Indole or 200 µM L-Trp. n=3 biological replicates, the graph is representative for 3 independent experiments. All error bars represent standard deviation.
Videos
Video 1
Video file of Naja naja LAAO action on HeLa cells.
Tables
Key resources table
| Reagent type (species) or resource | Designation | Source or reference | Identifiers | Additional information |
|---|---|---|---|---|
| Chemical compound, drug | Doxycycline | Sigma | D9891 | 1 µg/ml |
| Chemical compound, drug | PNGaseF | New England Biolabs | P0704 | |
| Chemical compound, drug | Erastin | Selleckchem | S7242 | |
| Chemical compound, drug | (1S, 3R)-RSL3 | Selleckchem | S8155 | |
| Chemical compound, drug | Catalase | Sigma | C1345 | |
| Chemical compound, drug | Zinc (II) protoporphyrin IX | Sigma | 691550 | |
| Chemical compound, drug | Ketoconazole | Acros Organics | 455470010 | |
| Chemical compound, drug | Ferrostatin-1 | Sigma | SML0583 | 2 µM |
| Chemical compound, drug | Liproxstatin-1 | Selleckchem | S7699 | 1 µM |
| Chemical compound, drug | Indole-3-pyruvic acid | Sigma | I7017 | |
| Chemical compound, drug | Sodium phenylpyruvate | Alfa Aesar | H56767.06 | |
| Chemical compound, drug | 4-Hydroxyphenylpyruvic acid | Sigma | 114286 | 200 µM |
| Chemical compound, drug | 2,2-Diphenyl-1-pikryl-hydrazyl | Sigma | D9132 | |
| Chemical compound, drug | Horse radish peroxidase | Sigma | P8375 | |
| Peptide recombinant protein | Recombinant human IL4i1 | R and D systems | 5684-AO-020 | |
| Sequence-based reagent | HO-1 siRNA | Invitrogen | 4390824 (S6673) | 50 nM |
| Sequence- based reagent | Scrambled siRNA | Invitrogen | 4390843 | 50 nM |
| Antibody | Anti-Slc7a11 (rabbit monoclonal) | Cell Signaling Technology | 12691 | 1:1000 |
| Antibody | Anti-HO-1 (rabbit polyclonal) | Enzo | ADI-SPA-895 | 1:1000 |
| Commercial assay, kit | CellTox Green | Promega | G8731 | 1:4000 |
| Commercial assay, kit | Amplex UltraRed | Thermo Fisher Scientific | A36006 |
Additional files
-
Supplementary file 1
I3P RNAseq GO terms.
- https://cdn.elifesciences.org/articles/64806/elife-64806-supp1-v2.xlsx
-
Transparent reporting form
- https://cdn.elifesciences.org/articles/64806/elife-64806-transrepform-v2.docx
Download links
A two-part list of links to download the article, or parts of the article, in various formats.
Downloads (link to download the article as PDF)
Open citations (links to open the citations from this article in various online reference manager services)
Cite this article (links to download the citations from this article in formats compatible with various reference manager tools)
Anti-ferroptotic mechanism of IL4i1-mediated amino acid metabolism
eLife 10:e64806.
https://doi.org/10.7554/eLife.64806


