The transcription factor Rreb1 regulates epithelial architecture, invasiveness, and vasculogenesis in early mouse embryos
- Developmental Biology Program, Sloan Kettering Institute, Memorial Sloan Kettering Cancer Center, United States
- Wellcome Trust-Medical Research Council Centre for Stem Cell Research, University of Cambridge, Jeffrey Cheah Biomedical Centre Cambridge Biomedical Campus, United Kingdom
- Cancer Biology and Genetics Program, Sloan Kettering Institute, Memorial Sloan Kettering Cancer Center, United States
Figures
Figure 1 with 1 supplement
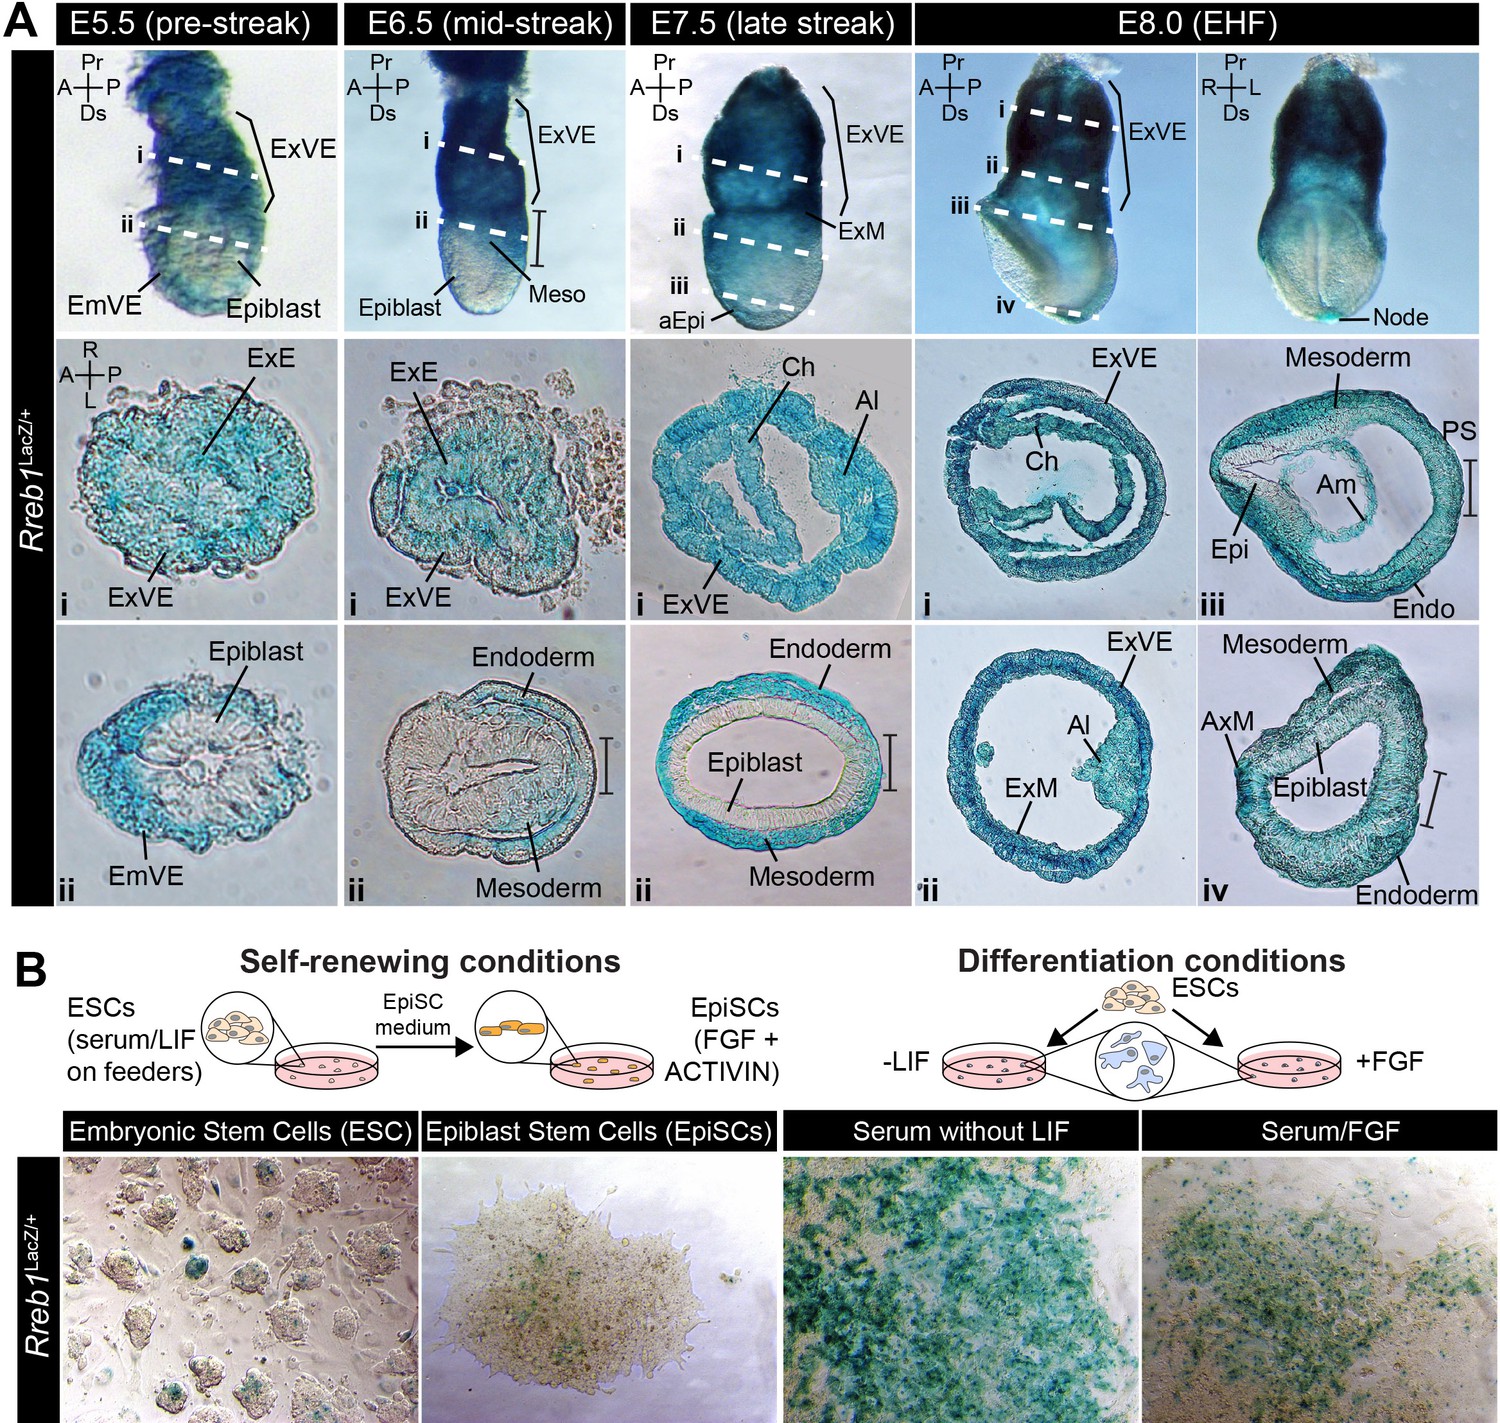
Rreb1 is expressed within embryonic and extraembryonic tissues.
(A) Wholemount images of Rreb1LacZ/+ mouse embryos from embryonic day (E) 5.5–8.0. Dashed lines mark approximate plane of transverse sections shown in lower panels. Section iii from E7.5 is located in Figure 1—figure supplement 1C. Bracket demarcates the primitive streak. (B) Rreb1LacZ reporter mouse embryonic stem cells (ESCs) (i) and epiblast stem cells (EpiSCs) (ii) under self-renewing conditions. ESCs were grown in serum/LIF on feeders. Panels (iii) and (iv) show ESCs after 7 days of differentiation in the absence of LIF or in the absence of LIF plus 12 ng/ml FGF2. A, anterior; P, posterior; Pr, proximal; Ds, distal; L, left; R, right; EHF, early headfold; ExM, extraembryonic mesoderm; ExVE, extraembryonic visceral endoderm; AVE, anterior visceral endoderm; aEpi, anterior epiblast; Meso, mesoderm; Endo, endoderm; Epi, epiblast; Am, amnion; Al, allantois; Ch, chorion; AxM, axial mesoderm.
Figure 1—figure supplement 1
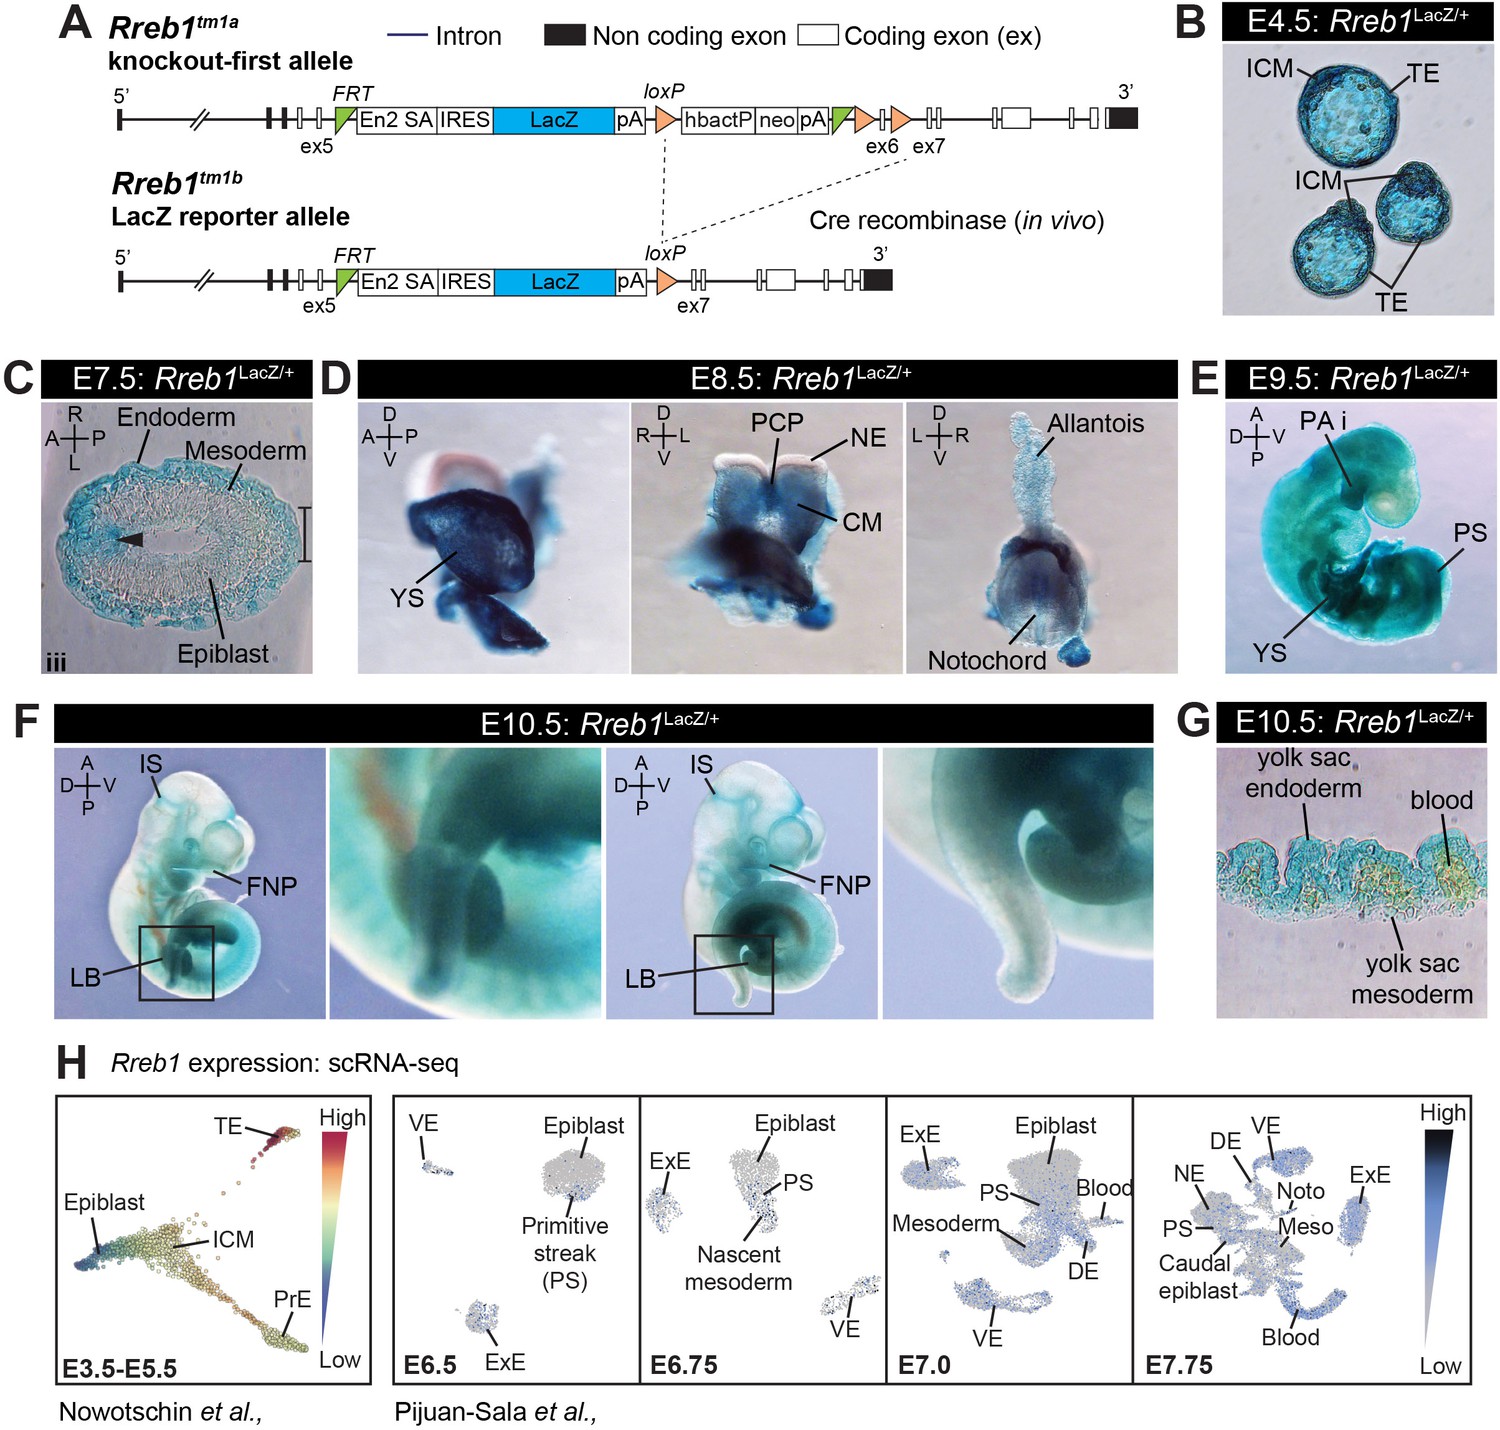
Rreb1 expression during mouse embryonic development.
(A) Schematic diagram showing the EUCOMM knockout-first (Tm1a) allele (upper panel) and the Rreb1 null LacZ reporter (Tm1b) allele generated by Cre-mediated recombination of Tm1a (lower panel). Engrailed two splice acceptor (En2 SA), internal ribosome entry side (IRES), human beta actin promoter (hbactP), Neomycin cassette (neo), single polyadenylation sequences (pA), FRT sites (green triangles), loxP sites (orange triangles). (B) Wholemount images of E4.5 Rreb1LacZ/+ blastocysts. (C) Transverse cryosection through a distal region of an E7.5 Rreb1LacZ/+ embryos from Figure 1A. Arrowhead indicates expression within the distal anterior epiblast. Bracket marks the primitive streak/tailbud. (D–F) Wholemount images of Rreb1LacZ/+ embryos. (G) Transverse cryosection of the yolk sac of an E10.5 Rreb1LacZ/+ embryo. (H) Rreb1 expression in different cell types of the early mouse embryo, from published single-cell RNA-sequencing datasets. Left panel: Force-directed layout plot showing relative Rreb1 expression in cells of E3.5–4.5 pre-implantation and E5.5 early post-implantation embryos from single-cell RNA sequencing (scRNA seq.) data. Plot was generated using data from Nowotschin et al., 2019 (https://endoderm-explorer.com/). Right panel: Uniform manifold approximation and projection (UMAP) plot, generated using single-cell sequencing data from Pijuan-Sala et al., 2019 (https://marionilab.cruk.cam.ac.uk/MouseGastrulation2018/), showing Rreb1 expression levels in all the cells at E6.5, 6.75, 7.0, and 7.75. TE, trophectoderm; ICM, inner cell mass; PrE, primitive endoderm; VE, visceral endoderm; ExE, extraembryonic ectoderm; PS, primitive streak; DE, definitive endoderm; Epi, epiblast; Noto, notochord; Meso, mesoderm; NE, neurectoderm; PCP, prechordal plate; Pr, proximal; Ds, distal; A, anterior; P, posterior; L, left; R, right; YS, yolk sac; PA i, pharyngeal arch 1; FNP, frontonasal process; LB, limb bud; IS, isthmus; CM, cephalic mesenchyme.
Figure 2 with 1 supplement
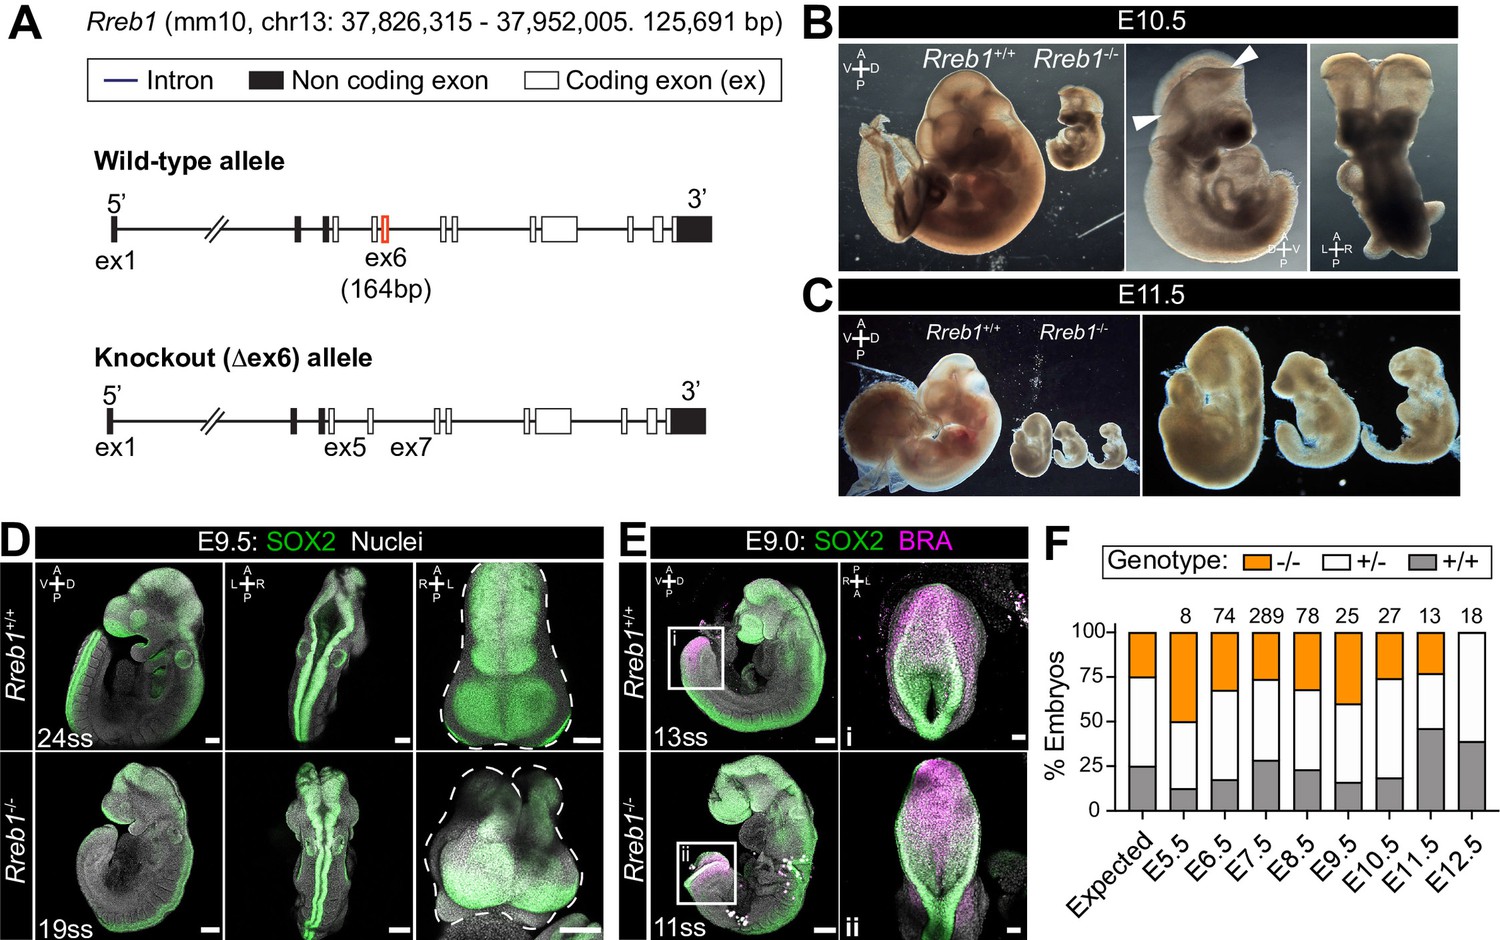
Rreb1 is necessary for mouse embryonic development.
(A) Schematic diagram showing the strategy used to generate the Rreb1 mutant allele. CRISPR-Cas9 was used to delete the majority of the coding DNA sequence of Exon 6. We created a large (approximately 700 bp) and small (approximately 540 bp) deletions. Both lines exhibited comparable phenotypes, thus we combined these data. UTR, untranslated region. (B–C) Brightfield images of Rreb1+/+ and Rreb1-/- littermates at E10.5 and E11.5 Arrowheads indicate boundary of open neural tube. Righthand panels show mutant embryos at higher magnification. (D–E) Confocal maximum intensity projection (MIP) of wholemount E9.0 and 9.5 mouse embryos, scale bar (sb) 200 μm. Number of somite pairs (ss) shown on images. (D) Right panel shows an MIP frontal view and outline (dashed line) of the head of the embryo emphasizing the neural tube closure defects in the Rreb1-/-. (E) Box highlights image of posterior neuropore shown in high magnification in adjacent panel, sb 100 μm. (F) Bar chart summarizing the percentage of Rreb1+/+, Rreb1+/- and Rreb1-/- embryos recovered at each developmental stage. The first bar indicates the expected Mendelian ratios of each genotype. N numbers shown above each bar. D, dorsal; V, ventral; A, anterior; P, posterior; L, left; R, right.
Figure 2—figure supplement 1
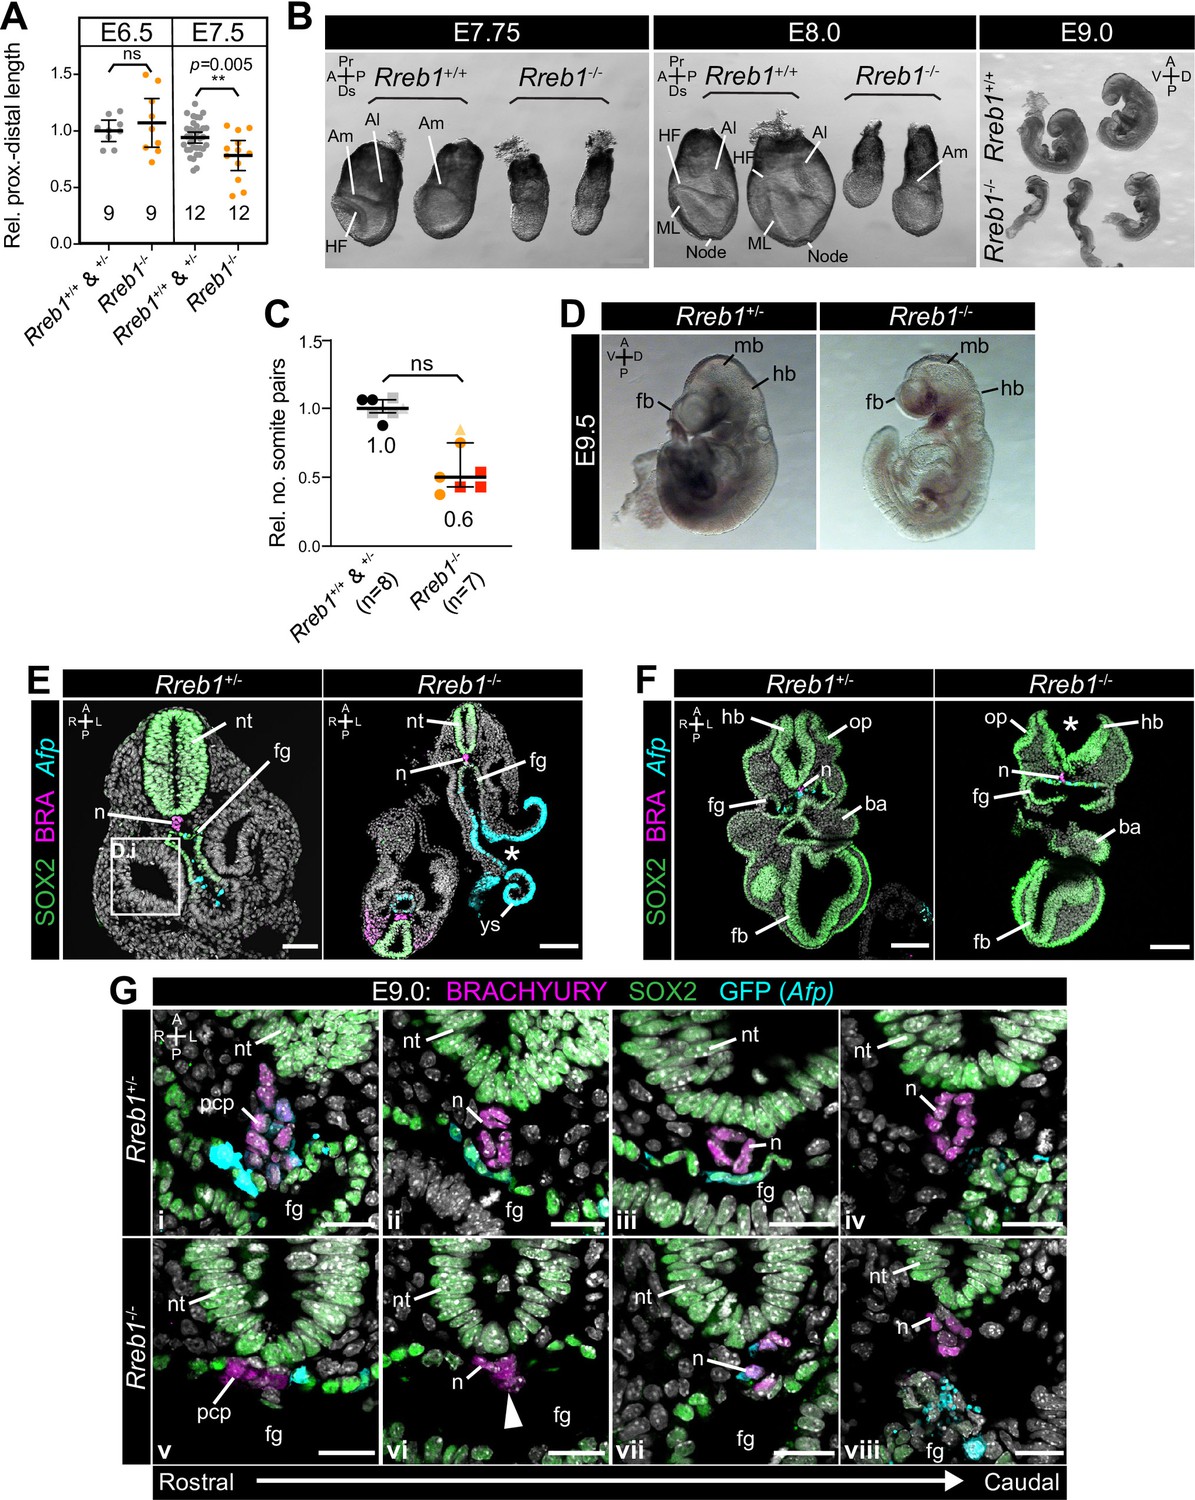
Rreb1 mutant embryos exhibit defects at midgestation.
(A) Quantification of the proximal to distal length of Rreb1 wild-type (Rreb1+/+) and heterozygous (Rreb1+/-) versus mutant (Rreb1-/-) littermates at E6.5 (3 litters) and 7.5 (5 litters). Each point represents an individual embryo. Total number of embryos is shown on the graph. Data is shown relative to the average wild-type/heterozygote proximo-distal length of each litter. Bars represent mean and IQR. ** p=≤0.005, unpaired t-test. (B) Brightfield images of wild-type (Rreb1+/+) and mutant (Rreb1-/-) littermates at embryonic day (E) 7.75, 8.0 and 9.0. Rreb1-/- embryos are smaller than wild-type littermates and do not show stage-appropriate morphological landmarks. (C) Quantification of relative number of somite pairs in E8.5–9.5 Rreb1 wild-type (Rreb1+/+) and heterozygous (Rreb1+/-) versus mutant (Rreb1-/-) littermates. Each point represents an individual embryo. Data is shown relative to the average somite number of each litter. Separate litters are indicated by different colored points. Bars represent mean and IQR. (E–F) Transverse cryosections of E9.0 Rreb1 heterozygous and homozygous mutant, Afp-GFP littermates. Boxes mark the regions shown in higher magnification in H. Asterisks mark the open neural tube and gut tube in Rreb1-/-. Sb, 50 μm. (G) Confocal optical sections of transverse cryosections from E9.0 embryos in the region of the notochord. From left to right, images show sections from rostral to caudal regions of the anterior embryo. Sb, 20 μm. Pr, proximal; Ds, distal; A, anterior; P, posterior; L, left lateral; R, right; D, dorsal; V, ventral; Am, amnion; Al, allantois; HF, headfolds; ML, midline; n, notochord; nt, neural tube; fg, foregut; ys, yolk sac; pcp, prechordal plate; hb, hindbrain; op, otic pit; ba, branchial arch; fb, forebrain; mb, midbrain.
Figure 3 with 1 supplement
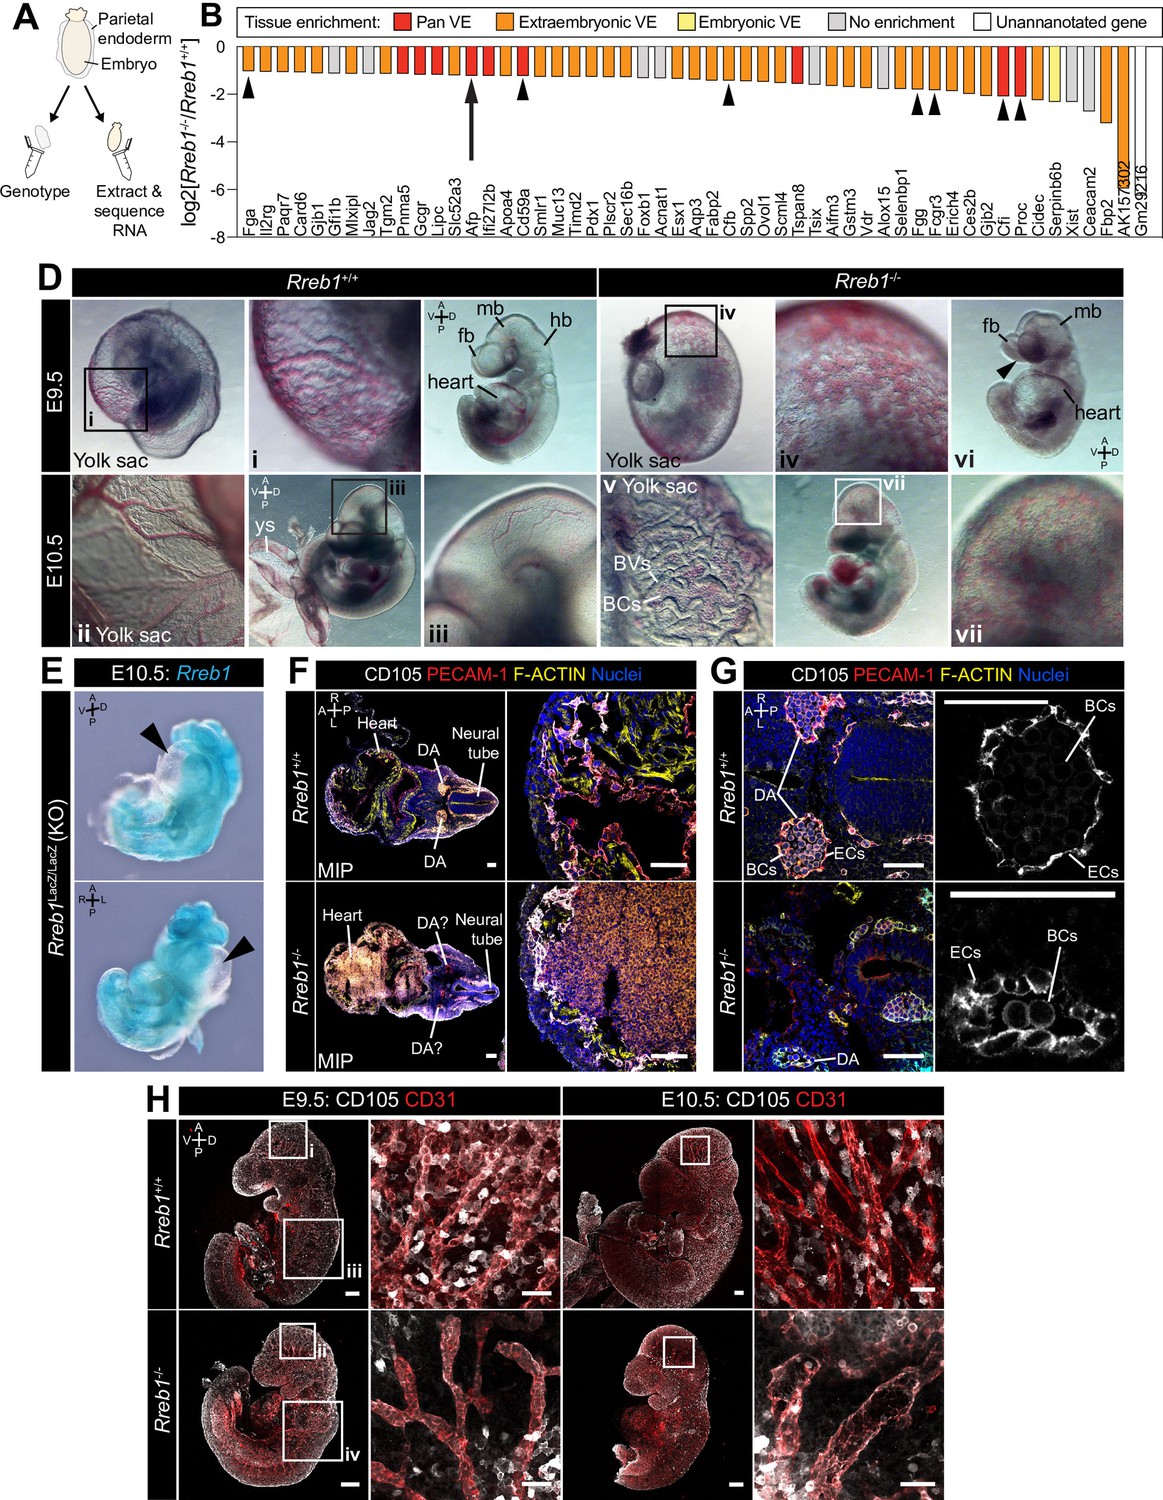
Loss of Rreb1 causes cardiovascular defects in the early mouse embryo.
(A) Schematic diagram depicting the sample collection methodology for whole embryo RNA-seq. Individual embryos were isolated from the uterus and the parietal endoderm dissected, lysed, and used for genotyping. The remaining part of the embryo was used for RNA extraction. Following genotyping, five individual wild-type and five individual mutant embryos were selected for sequencing. (B) Graph showing the list of significantly downregulated genes in Rreb1-/- versus Rreb1+/+ embryos that were detected via single-cell sequencing in Pijuan-Sala et al., 2019. Each gene was manually categorized based on its enrichment in different tissues within this dataset. ‘No enrichment’ indicates genes that did not show a tissue-specific expression or enrichment. Arrow highlights Afp and arrowheads highlight genes associated with the complement and coagulation cascades. (D) Brightfield images of E9.5 and 10.5 embryos showing abnormal defects in the vasculature of Rreb1-/- embryos. In panel vi, arrowhead highlights the open anterior neural tube. (E) Confocal maximum intensity projections of whole E9.5 and 10.5 embryos (Sb, 200 μm) with adjacent high-magnification images of the cranial vasculature (Sb, 50 μm). Boxes i-iv in E9.5 are shown at higher magnification in Figure 3—figure supplement 1J. PECAM-1 marks vasculature. ENDOGLIN marks endothelial cells as well as hematopoietic, mesenchymal, and neural stem cells. To note, the tail of the lower right embryo was damaged during dissection. (F) Wholemount image of an E10.5 Rreb1LacZ/LacZ mutant embryo. Arrowhead highlights pericardial edema. A, anterior; P, posterior; Pr, proximal; Ds, distal; D, dorsal; V, ventral; L, left; R, right; ExVE, extraembryonic VE; EmVE, embryonic VE; ys, yolk sac; BCs, blood cells; cm; cephalic mesenchyme; ne, neurectoderm; EC, endothelial cells.
-
Figure 3—source data 1
List of genes that are differentially expressed between wild-type and Rreb1 mutant embryos.
Differentially expressed genes were defined as those meeting fold change cutoff log2(2), adjusted p-value cutoff 0.05, and mean coverage of at least 15.
- https://cdn.elifesciences.org/articles/64811/elife-64811-fig3-data1-v3.xlsx
-
Figure 3—source data 2
Gene Ontology (GO) analysis of genes significantly upregulated and downregulated in E7.5 Rreb1 mutant embryos.
Gene ontology analyses were performed using the Database for Annotation, Visualization, and Integrated Discovery (DAVID) Bioinformatics resource gene ontology functional annotation tool with all NCBI Mus musculus genes as a reference list.
- https://cdn.elifesciences.org/articles/64811/elife-64811-fig3-data2-v3.xlsx
-
Figure 3—source data 3
KEGG pathway analysis of genes significantly upregulated and downregulated in E7.5 Rreb1 mutant embryos.
KEGG pathway analysis was performed using the Database for Annotation, Visualization, and Integrated Discovery (DAVID) Bioinformatics tool.
- https://cdn.elifesciences.org/articles/64811/elife-64811-fig3-data3-v3.xlsx
Figure 3—figure supplement 1
Rreb1-/- embryos exhibit cardiovascular defects.
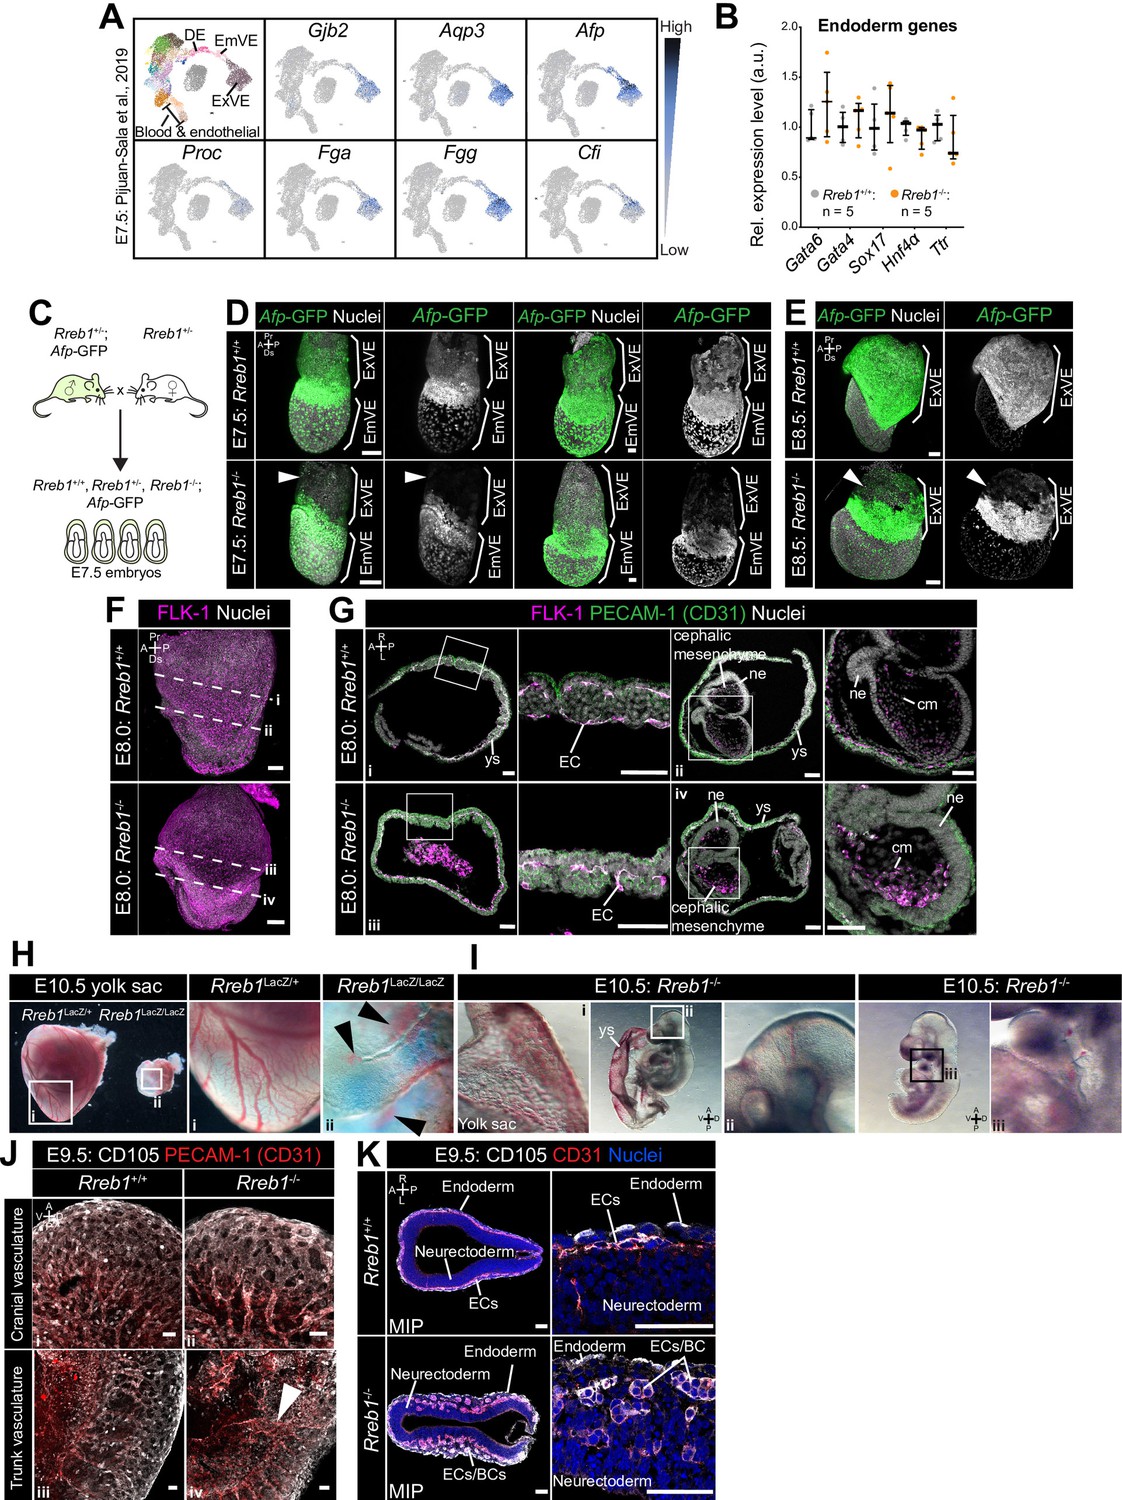
(A) Uniform manifold approximation and projection (UMAP) plot, generated using single-cell sequencing data from Pijuan-Sala et al., 2019. Left plot shows distinct clusters of cells representing different cell types within the embryo. Adjacent plots show the expression pattern of example genes that were significantly downregulated in Rreb1-/- embryos and whose expression is enriched within endoderm tissues. (B) Graph showing the relative expression level of a panel of endoderm-associated genes from RNA-sequencing of individual Rreb1+/+ and Rreb1-/- embryos that showed no significant difference in expression between genotypes. Each point represents a single embryo. Statistical analysis was performed using an Unpaired t-test. Bars represent median and IQR. Expression is shown relative to the mean expression in wild-type embryos. (C) Diagram illustrating the breeding scheme used to generate Afp-GFPTg/+; Rreb1+/+ and Rreb1-/- embryos. (D, E) Confocal MIPs of immunostained Afp-GFP; Rreb1+/+ and Rreb1-/- embryos. Arrowheads highlight the proximal ExVE that, in contrast to wild-type embryos, shows little to no Afp-GFP expression (E7.5 0/12 Rreb1+/+ and 9/11 Rreb1-/-, E8.5 0/3 Rreb1+/+ and 2/2 Rreb1-/- exhibited little to no Afp-GFP expression in the proximal ExVE). Sb, 50 μm. (F) Confocal maximum intensity projections (MIPs) of E8.0 embryos immunostained for FLK-1, a marker of hematopoietic and endothelial precursors. Dashed lines mark approximate plane of transverse sections in panel G. Sb, 50 μm. (G) Confocal optical sections of transverse cryosections through E8.0 mouse embryos Sb, 50 μm. (H) Wholemount images of E10.5 Rreb1LacZ/+ (heterozygous) and Rreb1LacZ/LacZ (mutant) embryos within the yolk sac. Mutant embryos have reduced yolk sac vasculature and blood leaking into the extravascular space (arrowheads). (I) Brightfield image of two distinct E10.5 Rreb1-/- embryos with reduced cranial vasculature (left) and little blood within the fetus (right). Boxes show regions of higher magnification in adjacent panels. (J) Confocal maximum intensity projections showing the cranial and trunk vasculature of E9.5 embryos from Figure 3D. Sb, 50 μm. PECAM-1 marks vasculature. CD105 (ENDOGLIN) marks endothelial cells as well as hematopoietic, mesenchymal and neural stem cells. Arrowhead marks large blood vessel not observed in wild-type littermate. (K) Transverse cryosections through the dorsal most region of the head of E9.5 mouse embryos. Rreb1-/- embryos have clusters of FLK-1 +PECAM-1+ (CD31) cells that may be endothelial or blood cells. Sb, 100 μm. A, anterior; P, posterior; Pr, proximal; Ds, distal; D, dorsal; V, ventral; ExVE, extraembryonic VE; EmVE, embryonic VE; DE, definitive endoderm; cm, cephalic mesenchyme; ne, neurectoderm; ys, yolk sac; ec, endothelial cells; bc, blood cells.
Figure 4 with 1 supplement
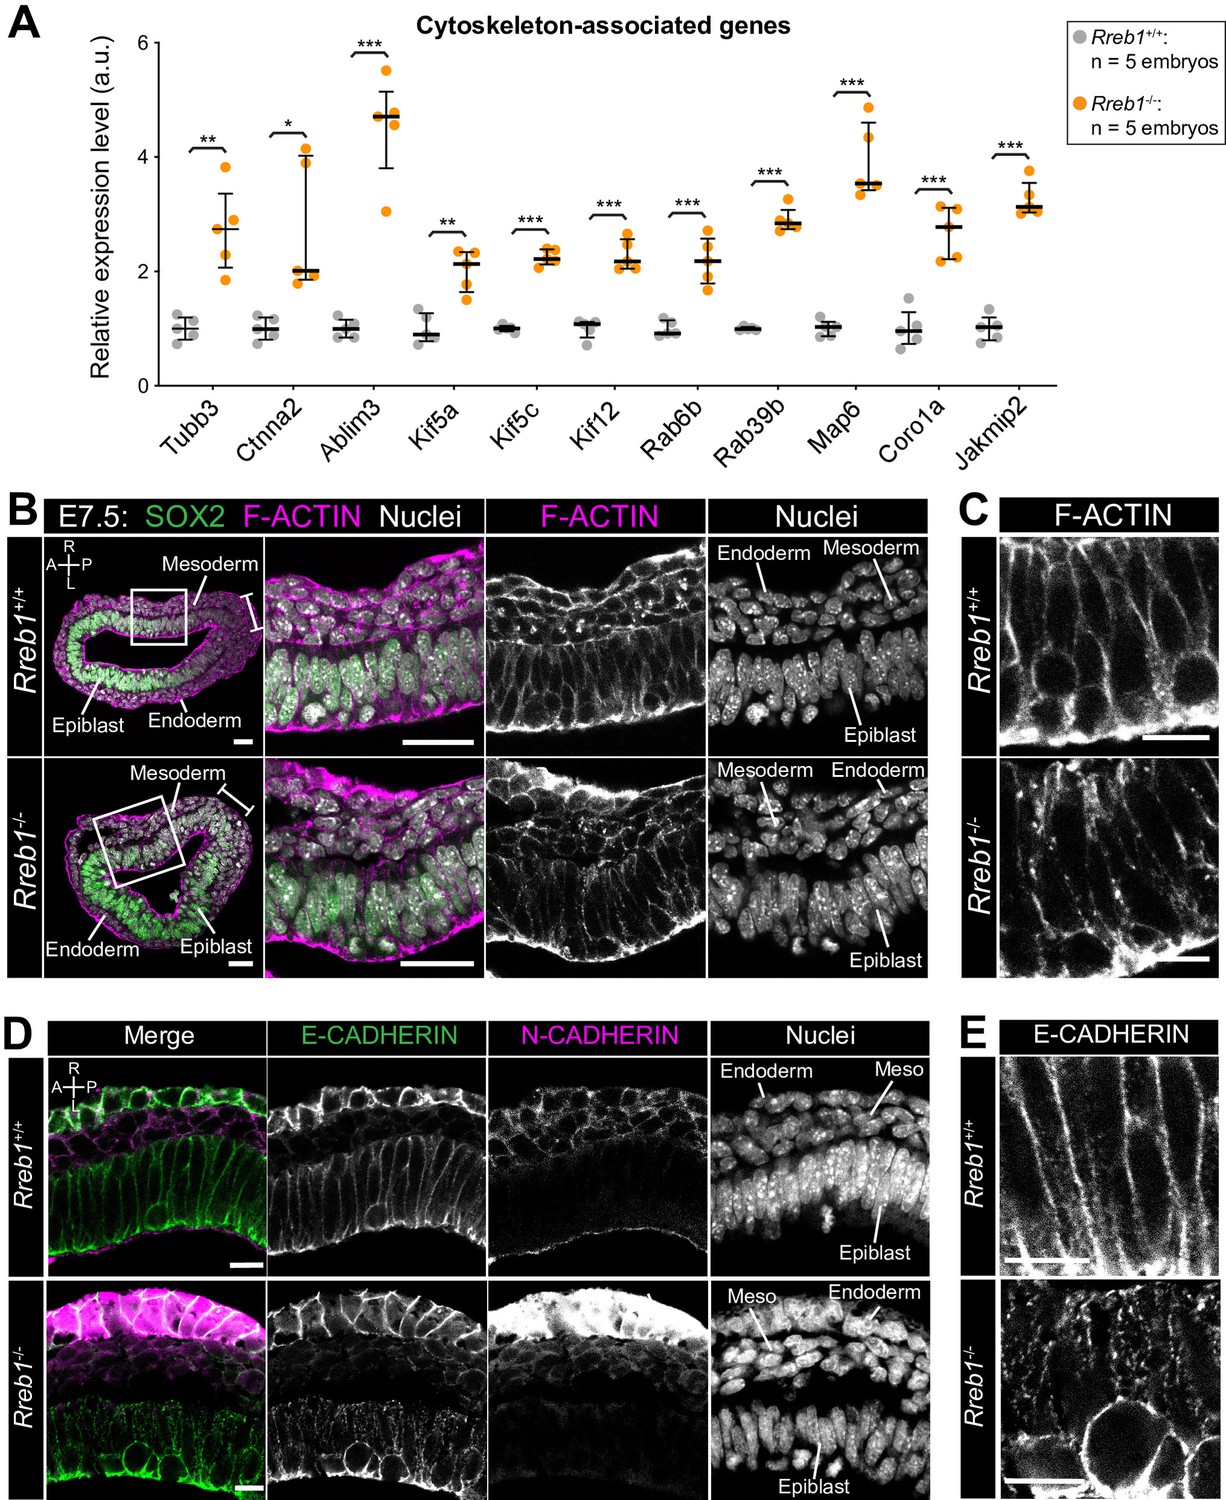
The Rreb1-/- epiblast shows altered cytoskeleton and adherens junction organization.
(A) Graph showing the relative expression level of cytoskeleton-associated genes from RNA-sequencing of individual Rreb1+/+ and Rreb1-/- embryos. Each point represents a single embryo. Statistical analysis was performed using an Unpaired t-test (*p<0.05, **p<0.005, ***p<0.001). Bars represent median and IQR. Expression is shown relative to the mean expression in wild-type embryos. (B-E) Confocal optical sections showing transverse cryosections of immunostained Rreb1+/+ and Rreb1-/- embryos. Boxes indicate lateral epiblast regions shown at higher magnification in adjacent panels. Rreb1-/- embryos exhibit a punctate localization of E-CADHERIN (n = 4/4 embryos). Sb, 10 μm. (C,E) Highest magnification images showing a small region of the epiblast epithelium. Sb, 10 μm. Brackets mark the primitive streak. A, anterior; P, posterior; L, left; R, right.
Figure 4—figure supplement 1
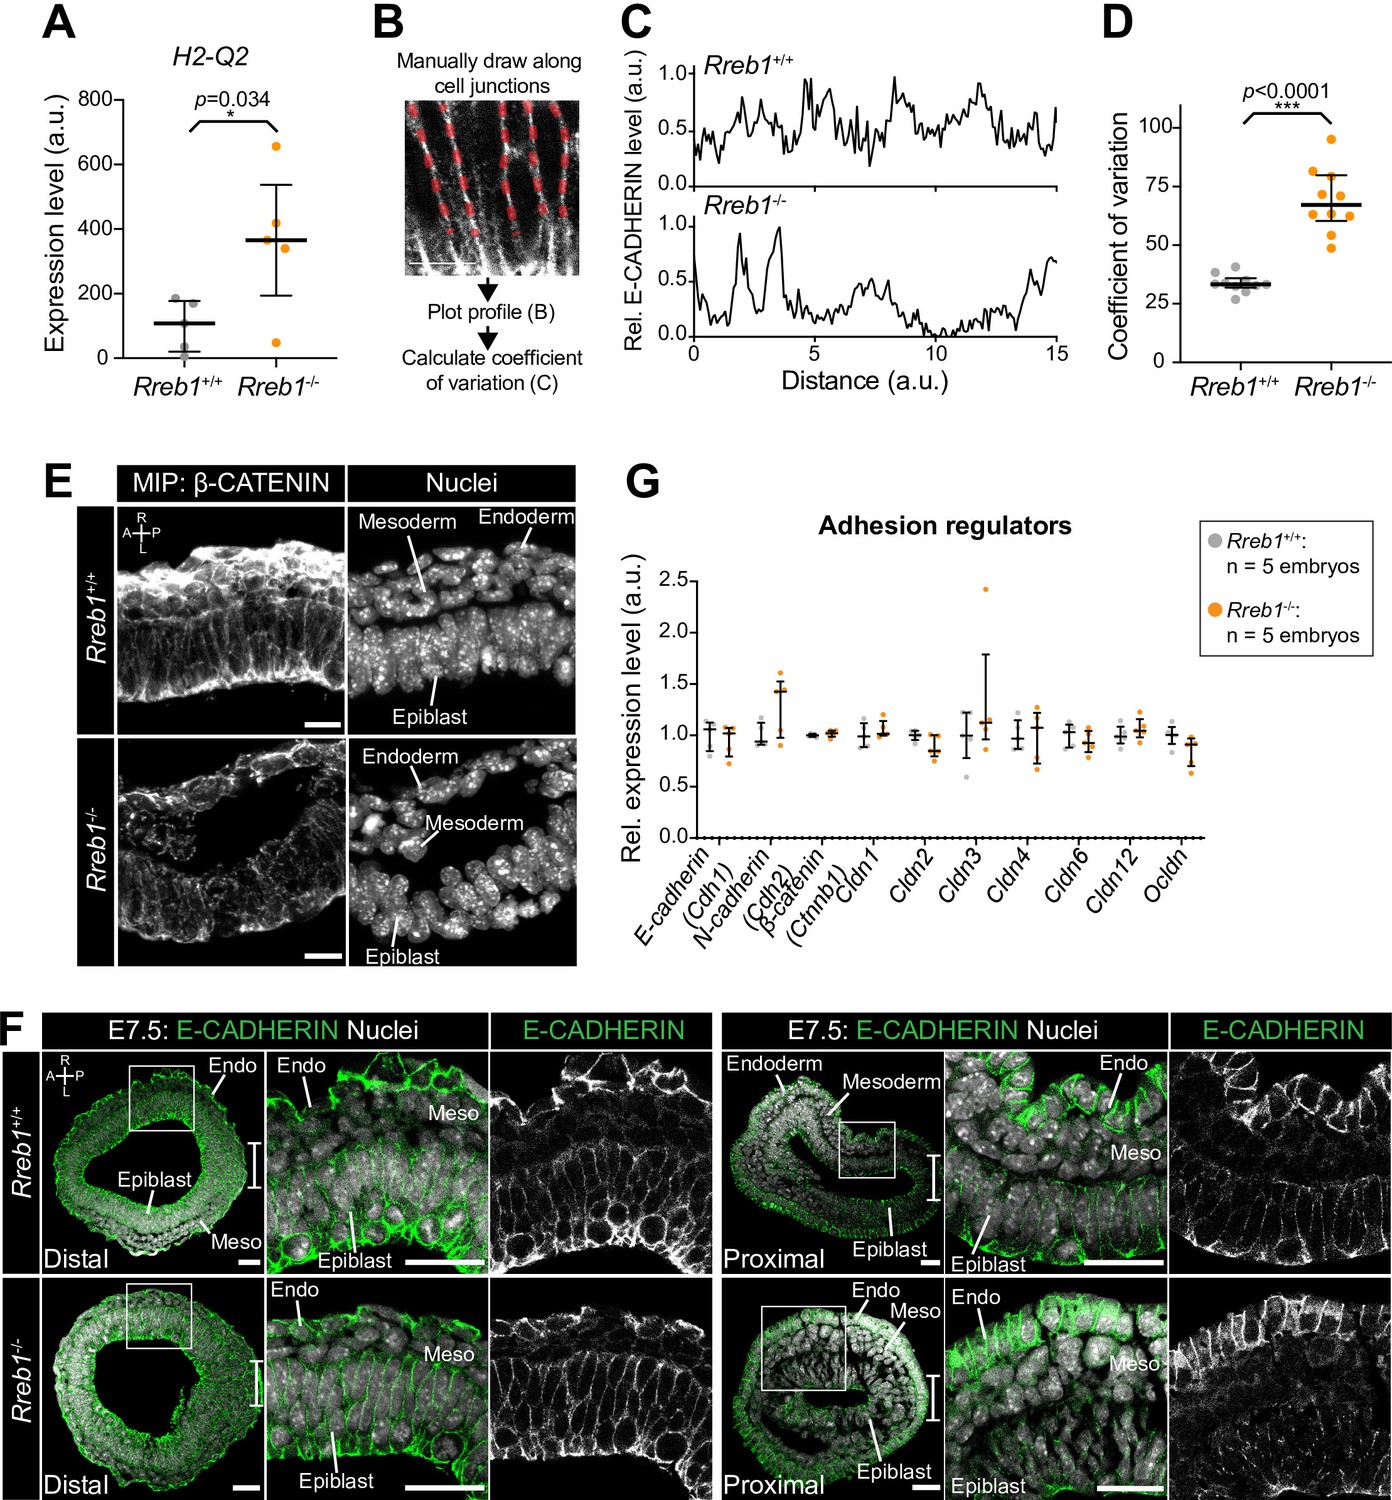
Loss of Rreb1 alters epiblast adherens junction organization.
(A) Graph showing the relative expression level of H2-A2, the mouse homolog of human HLA-G from RNA-sequencing of individual Rreb1+/+ and Rreb1-/- embryos. Each point represents a single embryo. Statistical analysis was performed using an Unpaired t-test. Bars represent median and IQR. (B) Diagram showing the methodology for quantification of E-CADHERIN protein levels along epiblast cell junctions. Lines were manually drawn along cell junctions and the relative profile of E-CADHERIN immunostaining fluorescence level along the junction was plotted, with the highest value representing 1. We then calculated the coefficient of variation of E-CADHERIN levels for each individual junction. (C) Representative relative profile of E-CADHERIN levels in arbitrary units (a.u.) at a single Rreb1+/+ and Rreb1-/- epiblast cell junction. (D) Quantification of the coefficient of variation of E-CADHERIN immunostaining fluorescence levels at epiblast cell junctions. Each point represents a single cell junction. Bars represent mean and IQR. *** p=≤0.0005, unpaired t-test. (E) Confocal maximum intensity projections of transverse cryosections of a lateral region of the epiblast of immunostained Rreb1+/+ and Rreb1-/- embryos. Sb, 10 μm. (F) Confocal optical sections of transverse sections through distal and proximal (just below the embryonic-extraembryonic boundary) regions of mouse embryos at E7.5. Sb, 25 μm. Bracket demarcates the primitive streak. (G) Graph showing the relative expression level of a panel of adhesion-associated genes from RNA-sequencing of individual Rreb1+/+ and Rreb1-/- embryos. Each point represents a single embryo. Statistical analysis was performed using an Unpaired t-test (*p<0.05, **p<0.005, ***p<0.001). Bars represent median and IQR. Expression is shown relative to the mean expression in wild-type embryos. A, anterior; P, posterior; L, left; R, right; Endo, endoderm; Meso, mesoderm.
Figure 5 with 2 supplements
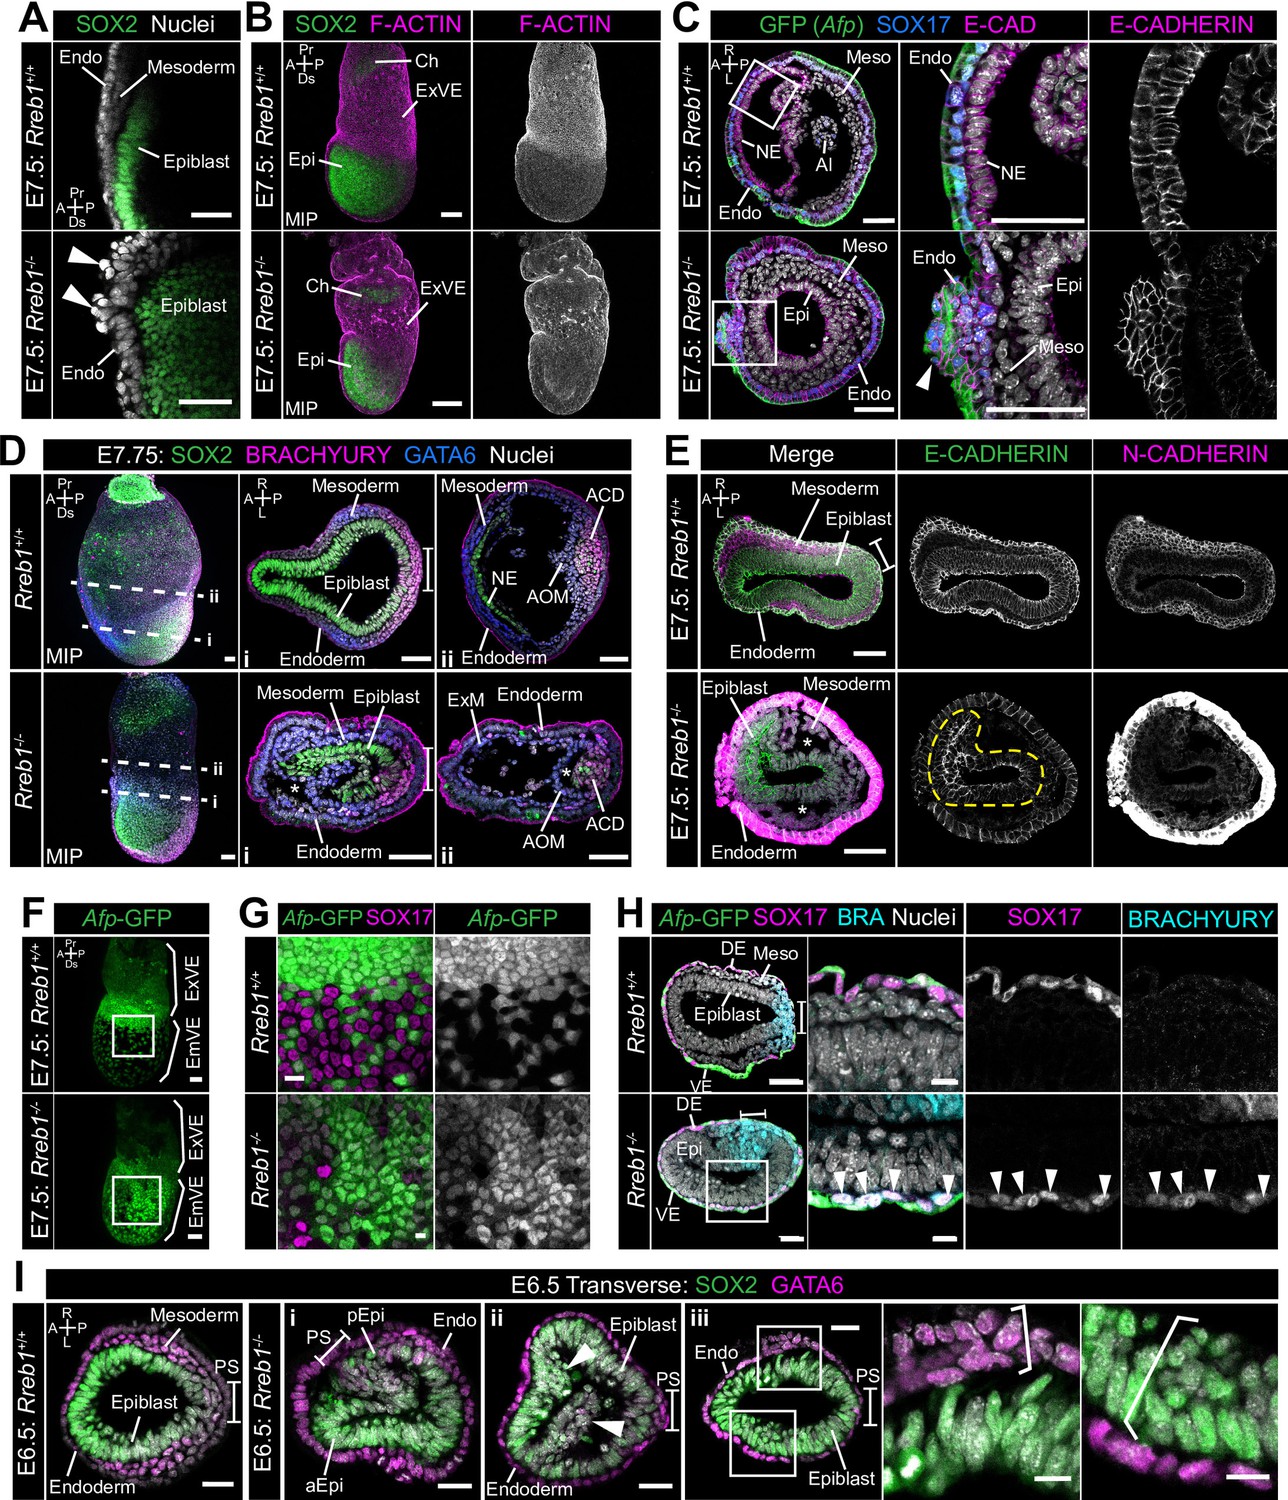
Rreb1 maintains epithelial organization in the early mouse embryo.
(A) Sagittal confocal optical section of the anterior of E7.5 Rreb1 wild-type and homozygous mutant embryos. Arrowheads highlight cells abnormally protruding from the VE overlying the epiblast. Sb, 25 μm. (B) Confocal maximum intensity projections (MIP) of immunostained E7.5 embryos showing ruffling of the extraembryonic VE (n = 7/8 E7.5 Rreb1-/- embryos exhibit endoderm ruffling). Sb, 100 μm. (C) Confocal optical sections showing transverse cryosections of E7.5 Afp-GFP Rreb1 wild-type and homozygous mutant embryos. Boxes indicate regions shown in higher magnification in adjacent panels. Arrowhead indicates abnormal accumulation of Afp + VE cells and underlying Afp- DE cells at the anterior embryonic-extraembryonic boundary in Rreb1-/- (n = 7/52 E7.5 Rreb1-/- embryos exhibit anterior endoderm accumulations). Sb, 50 μm. (D, E) Maximum intensity projections (MIPs) of wholemount E7.5 embryos and confocal optical sections of transverse cryosections. (D) Dashed lines mark approximate plane of section. Sb, 50 μm. (E) Dashed yellow line outlines the epiblast. Sb, 50 μm. Asterisks mark abnormal gaps between tissue layers, which was the most common defect observed (n = 38/52 E7.5 Rreb1-/-). (F) Representative images of Rreb1+/+ and Rreb1-/- embryos highlighting the epithelial defects observed: (i) abnormal accumulations of cells in the epiblast, (ii) epiblast folding (n = 8/52 52 E7.5 Rreb1-/- embryos exhibit abnormal epiblast folding), in this case the epiblast is folded such that the putative anterior (aEpi) and posterior (pEpi) regions are adjacent to one another, (iii) formation of multilayered regions (highlighted with brackets) in the, typically monolayer, endoderm and epiblast. Sb 25 μm, high mag sb, 10 μm. (G–I) Confocal MIPs (G,H) and confocal optical sections showing transverse cryosections of Afp-GFP; Rreb1+/+ and Rreb1-/- embryos (I). Boxes indicate region shown in higher magnification in H. Sb, 50 μm. Pr, proximal; Ds, distal; A, anterior; P, posterior; R, right; L, left; Epi, epiblast; aEpi, anterior epiblast; pEpi, posterior epiblast; PS, primitive streak; Endo, endoderm; ACD, allantois core domain; AOM, allantois outer mesenchyme; Ch, chorion; Meso, mesoderm; ExVE, extraembryonic visceral endoderm; EmVE, embryonic visceral endoderm; DE, definitive endoderm; NE, neurectoderm; Al, allantois.
Figure 5—figure supplement 1

Rreb1 mutant embryos have perturbed epithelial architecture.
(A) Confocal optical sections showing transverse cryosections in the extraembryonic region of E6.5 embryos. Arrowheads highlight regions where cell layers are abnormally separated from one another. Sb, 25 μm. (B) Brightfield images of Rreb1+/+ and Rreb1-/- littermates at embryonic day 7.5. Arrowheads highlight the abnormal accumulation of cells at the anterior embryonic-extraembryonic boundary. (C) Arrows highlight SOX17-expressing definitive endoderm cells within the wings of mesoderm. Sb, 50 μm (A,B) and 25 μm (C). (D) Confocal sagittal optical sections of immunostained embryos. The Rreb1-/- embryo displays abnormal epithelial folding. Sb, 50 μm. (E) Schematic depicting methodology for angle measurements. We measured the angle of the elongated nuclear axis of epiblast cells relative to the underlying Laminin basement membrane (BM). Sb, 10 μm. (F) Quantification of the angle between the elongated nuclear axis and the BM of E6.5 epiblast cells. Bars represent median and IQR. Each point represents a single cell. (G) Quantification of the coefficient of variation (COV) for the nucleus-BM embryo angle in each embryo (individual points). Bars represent mean and IQR. *** p=≤0.0005, unpaired t-test. (H) Confocal optical sections of transverse cryosections in lateral (i) and anterior (ii) regions of E7.5 embryos. Arrowheads highlight regions where cell layers are abnormally separated from one another. Sb, 25 μm. (I) Confocal optical sections of transverse cryosection of immunostained E7.5 Rreb1-/- embryo. Arrowheads highlight a break in apical F-ACTIN through which epiblast cells are protruding. Box indicates region shown at higher magnification. Sb, 25 μm. (J) Confocal optical sections of transverse cryosections of immunostained E7.5 embryos. In wild-type embryos, epiblast cells divide adjacent to the cavity (arrowheads), maintain apical F-ACTIN and remain within the epithelium. In Rreb1-/- embryos, we also observed dividing cells outside of the epithelium (arrowheads), within the amniotic cavity. Sb, 25 μm. (K) Confocal maximum intensity projections (left) and optical sections of transverse cryosections of immunostained embryos stained for phosphorylated Histone H3 (pHH3), which marks mitotic cells. Sb, 50 μm. (L) Quantification of proliferation in Rreb1+/+ and Rreb1-/- littermates. We quantified the absolute number of pHH3-positive cells per 10 μm cryosection (left panel) and the % of pHH3 mitotic cells in each germ layer per 10 μm cryosection (right panel) for three entire embryos. There was no significant difference (unpaired t-test) in proliferation rate between genotypes, other than in the ExE, which is likely a reflection of the low sample number in that region. Each point represents a single dividing cell. Bars represent mean and IQR. (M) Transverse cryosection of a lateral region of E7.5 epiblasts immunostained for the basal marker, Laminin, and apical marker, ZO-1. Rreb1-/- embryos maintain appropriate expression of polarity markers. To note, we observed strong anti-N-CADHERIN and ZO-1 VE fluorescence, which correlates with an apparent difference in the structure of the outer VE layer compared to wild-type embryos. This signal is also observed with other antibodies and likely represents non-specific binding. Sb, 25 μm. (N) Histogram showing fluorescence levels, in arbitrary units (a.u.), of Laminin and ZO-1 immunostaining measured along the apical-basal axis of a representative region of the epiblast epithelium from image in panel. Pr, proximal; Ds, distal; A, anterior; P, posterior; L, left; R, right; PS, primitive streak; Endo, endoderm; Epi, epiblast; ExVE, extraembryonic visceral endoderm; Meso, mesoderm; ExE, extraembryonic ectoderm.
Figure 5—figure supplement 2
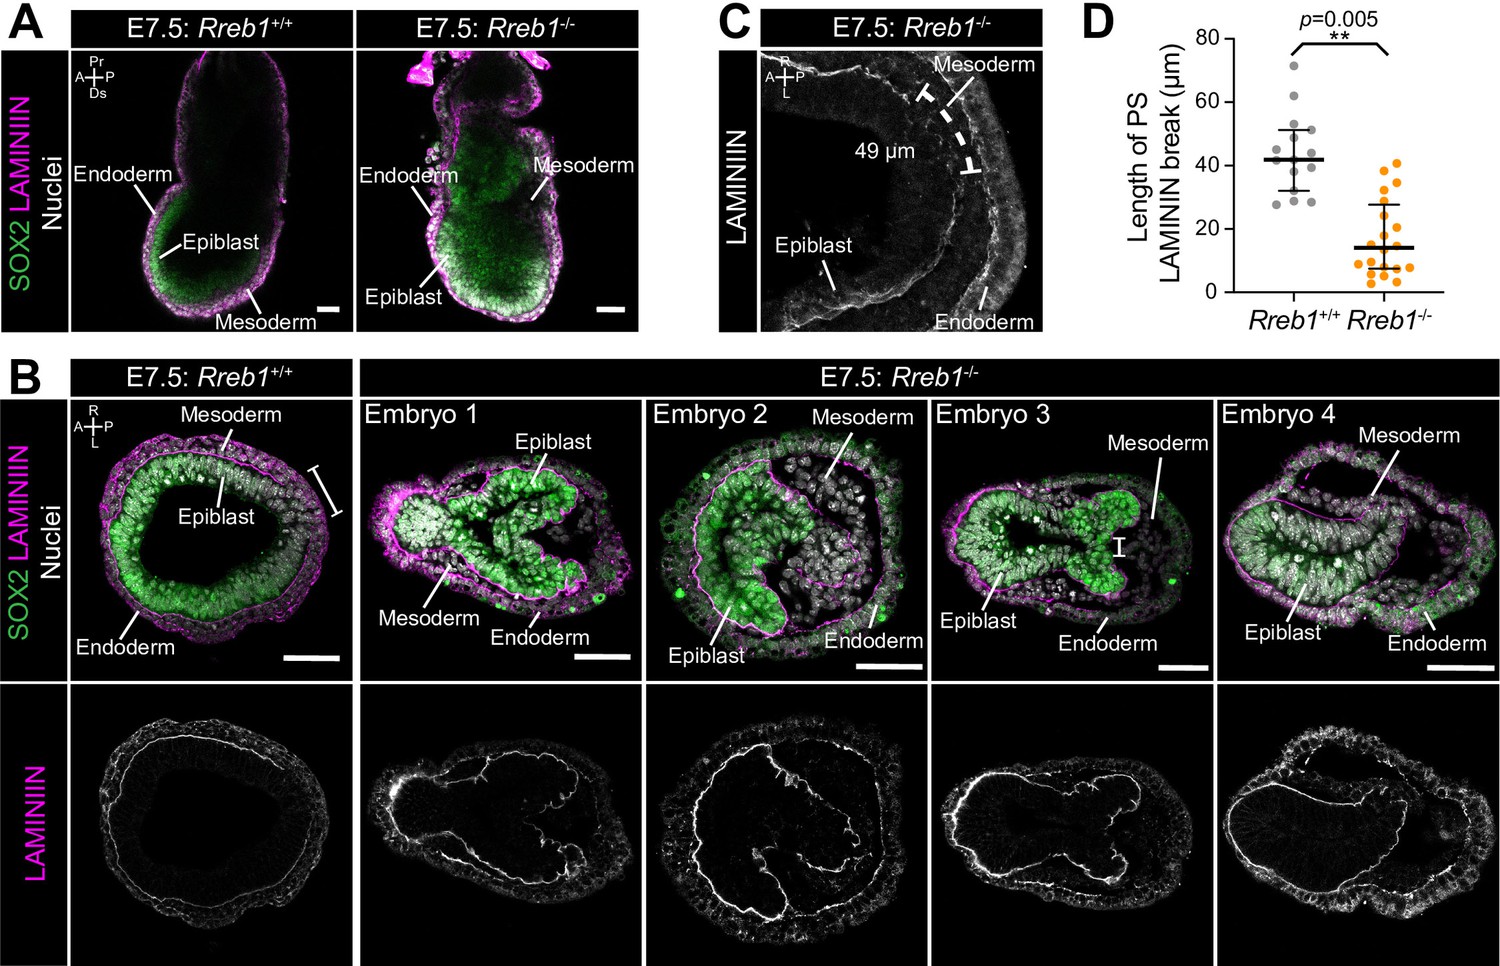
Severity of Rreb1 mutant phenotypes is dependent on genetic background.
(A) Sagittal confocal optical sections of Rreb1+/+ and Rreb1-/- embryos at E7.5. Sb, 50 μm. (B) Confocal optical sections of transverse cryosections through the proximal primitive streak of E7.5 embryos. Sb, 50 μm. (C) Confocal maximum intensity projection (MIP) of the primitive streak of an E7.5 Rreb1+/+ embryo. We used these data to measure the distance between LAMININ basement membrane breaks at the primitive streak. (D) Graph showing the distance between LAMININ basement membrane breaks as measured in panel C. n = 3 Rreb1+/+ and 4 Rreb1-/- embryos (measurements were taken from the proximal-most five sections through the primitive streak per embryo).
Figure 6 with 2 supplements
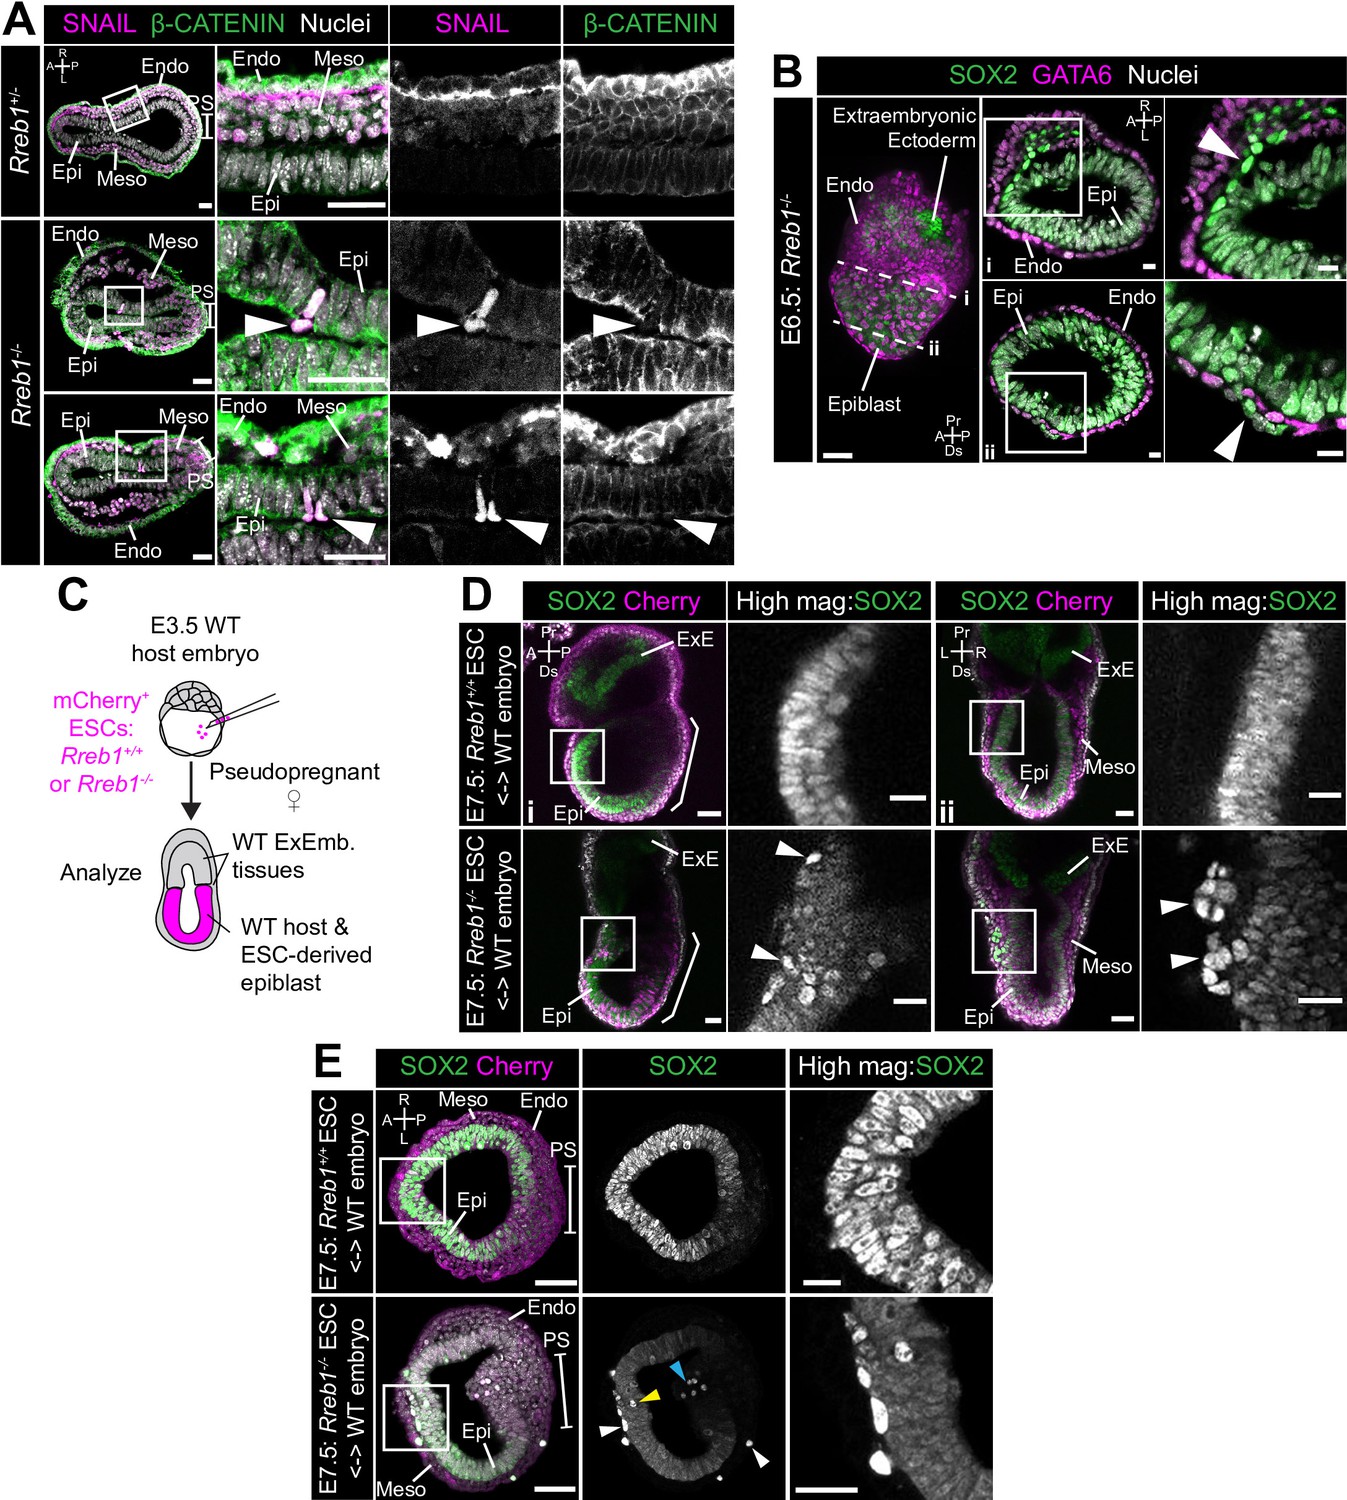
Loss of Rreb1 results in invasive cell behaviors.
(A) Confocal optical sections of transverse cryosections of immunostained E7.5 embryos. Boxes show regions displayed at higher magnification in adjacent panels. Arrowheads indicate ectopic SNAIL expression in epiblast cells exiting the epithelium. Sb, 25 μm. (B) Confocal optical sections of maximum intensity projection (MIP, Sb, 50 μm) and transverse cryosections of immunostained E6.5 Rreb1-/- embryos. Dashed lines mark approximate plane of transverse section. Arrowhead marks ectopic SOX2 + cells leaving the epiblast and traversing the outer endoderm layer. Sb, 10 μm. (C) Schematic diagram illustrating how chimeras were generated. Rreb1+/+ or Rreb1-/-embryonic stem cells (ESCs) constitutively expressing an mCherry lineage label were injected into wild host E3.5 embryos. Embryos were then transferred to pseudopregnant host females and dissected for analysis at later developmental stages. (D,E) Sagittal (D i), lateral (D ii) and transverse (E) confocal optical sections of immunostained E7.5 chimeric embryos containing either Rreb1+/+ or Rreb1-/- cells. Arrowheads mark abnormal SOX2 + cells, expressing higher levels of SOX2 than their neighbors, in the epiblast (yellow), primitive streak (blue arrowhead) or between the epiblast and visceral endoderm layers (white). Sb, 50 μm. High-magnification inset Sb, 25 μm. A, anterior; P, posterior; L, left; R, right; Endo, endoderm; Meso, mesoderm; Epi, epiblast; PS, primitive streak.
Figure 6—figure supplement 1
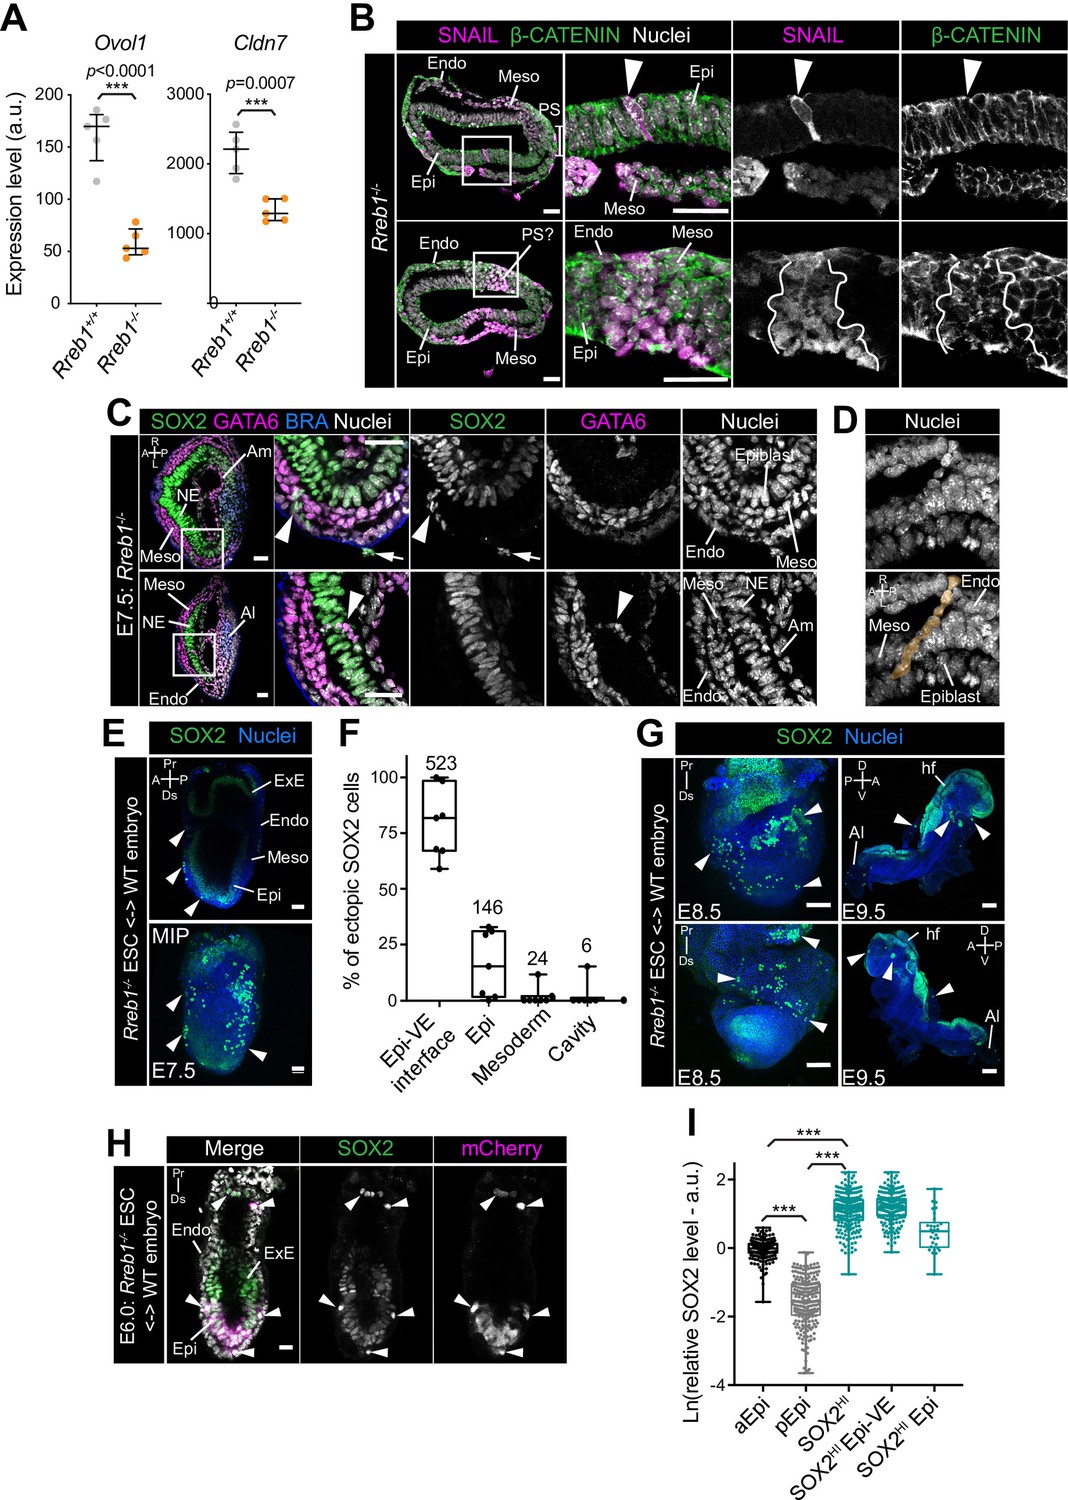
Loss of Rreb1 promotes invasive cell behaviors.
(A) Graph showing the expression level in arbitrary units (a.u.) of Ovol1 and Cldn7 from RNA-sequencing of individual Rreb1+/+ and Rreb1-/- embryos. Each point represents a single embryo. ***p<0.001, unpaired t-test. Bars represent median and IQR. (B) Confocal optical sections showing transverse cryosections through immunostained embryos. Sb, 50 μm. In the Rreb1-/- shown in the lower panel, SNAIL is expressed laterally on either side of the posterior epiblast rather than at the posterior pole. Thus, it is unclear whether this expression demarcates a primitive streak-like structure in this case (PS?). (G) Arrowheads indicate ectopic SNAIL expression in epiblast cells. White lines demarcate a region containing a large cluster of epiblast cells ectopically expressing SNAIL, which exhibit more punctate Beta-CATENIN localization than in surrounding SNAIL-negative epiblast cells. Pr, proximal; Ds, distal; A, anterior; P, posterior; L, left; R, right; Meso, mesoderm; Endo, endoderm; Epi, epiblast; PS, primitive streak. (C) Confocal optical sections of transverse cryosection of immunostained E7.5 Rreb1-/- embryo. Arrowhead marks ectopic cells, in the upper panel, SOX2 + cells leaving the epiblast and traversing the outer endoderm layer and in the lower panel, GATA6 +mesoderm cells traversing the epiblast. Arrow marks SOX2 +debris on the outside of the embryo which may represent dead cells. Sb, 25 μm. (D) Images highlighting a chain of cells apparently exiting the epiblast and traversing the outer endoderm layer. Chain of cells is artificially colored in orange in lower panel. (E) Confocal sagittal optical section (upper panel) and maximum intensity project (MIP) (lower panel) of an immunostained E7.5 chimeric embryo containing Rreb1-/- ESCs. Arrowheads indicate ectopic SOX2 + cells. Sb, 50 μm. (F) Graph showing the proportion of SOX2HI cells localized inside the Epi, at the Epi-VE interface, mesoderm or amniotic cavity in E7.5 Rreb1-/- chimeric embryos. Data shown as the percentage of the total SOX2HI cells analyzed per embryo in each location. Each point represents scoring for an individual embryo. Total number of cells per location is shown above each bar. For all box plots, top and bottom edges of boxes represent third and first quartiles, respectively (interquartile range, IQR). Middle lines mark the median. Whiskers extend to 1.5 * IQR. (G) Confocal MIPs of immunostained E8.5 (Sb, 100 μm) and 9.5 (Sb, 200 μm) chimeric embryos containing Rreb1-/- ESCs. Arrowheads indicate ectopic SOX2 + cells. (H) Confocal sagittal optical section of a pre-gastrulation E6.0 chimeric embryo containing Rreb1-/- ESCs. Arrowheads mark ectopic SOX2 + cells. mCherry marks ESC progeny. Sb, 25 μm. Boxes show regions displayed at higher magnification. Brackets mark primitive streak. (I) Quantification of SOX2 protein levels in arbitrary units (a.u.) in normal anterior (aEpi) and posterior (pEpi) Epi cells and SOX2 high (SOX2HI) cells in E7.5 Rreb1-/- chimeric embryos. Data shown relative to mean SOX2 levels within typical aEpi cells. Each point represents a measurement from an individual nucleus (n = 696 cells, ***p<0.0001). A, anterior; P, posterior; L, left; R, right; Pr, proximal; Ds, distal; Epi, epiblast; Endo, endoderm; Meso; mesoderm; PS, primitive streak; NE, neurectoderm; Am, amnion; Al, allantois; ExE, extraembryonic ectoderm.
Figure 6—figure supplement 2
Ectopic cells in Rreb1 chimeras have a PGC-like marker profile.
(A-D) Confocal optical sections of transverse cryosections (A, C, D) and sagittal optical sections through E7.5 mouse chimeric embryos generated with Rreb1-/- ESCs. Arrowheads highlight aberrant cells exiting the epiblast epithelium. Bracket marks the primitive streak. Dashed lines delineate the boundary between the epiblast and endoderm layers. A, anterior; P, posterior; L, left; R, right; Pr, proximal; Ds, distal. Sb, 50 μm.
Figure 7 with 1 supplement
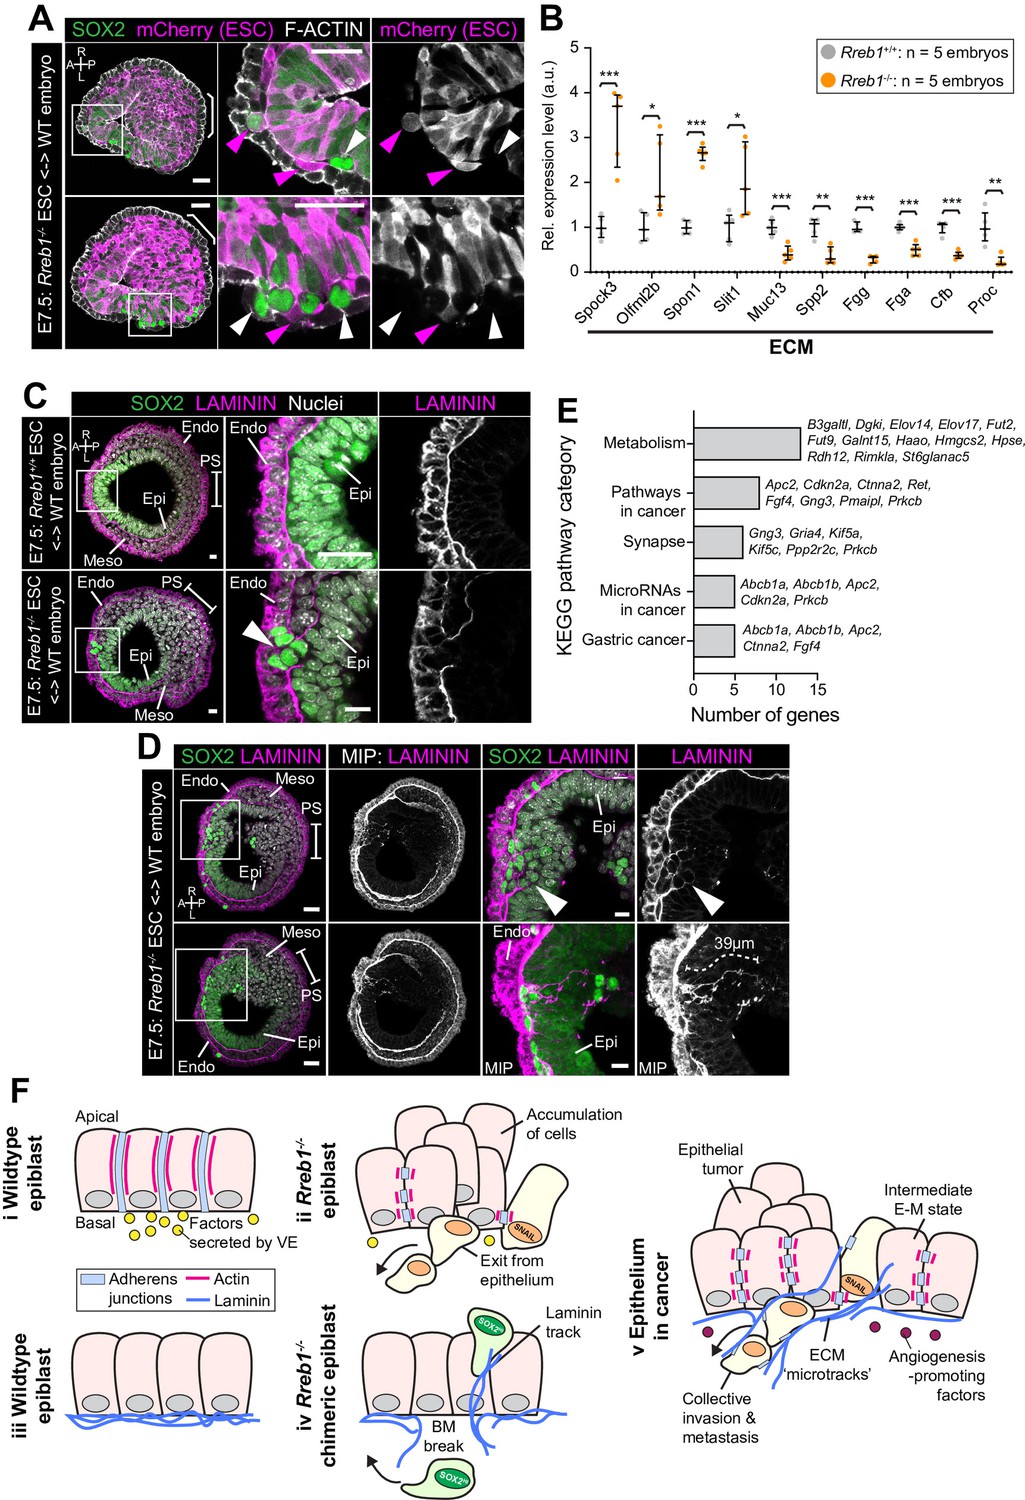
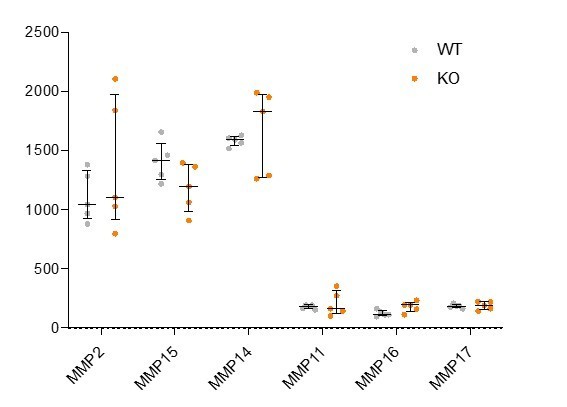
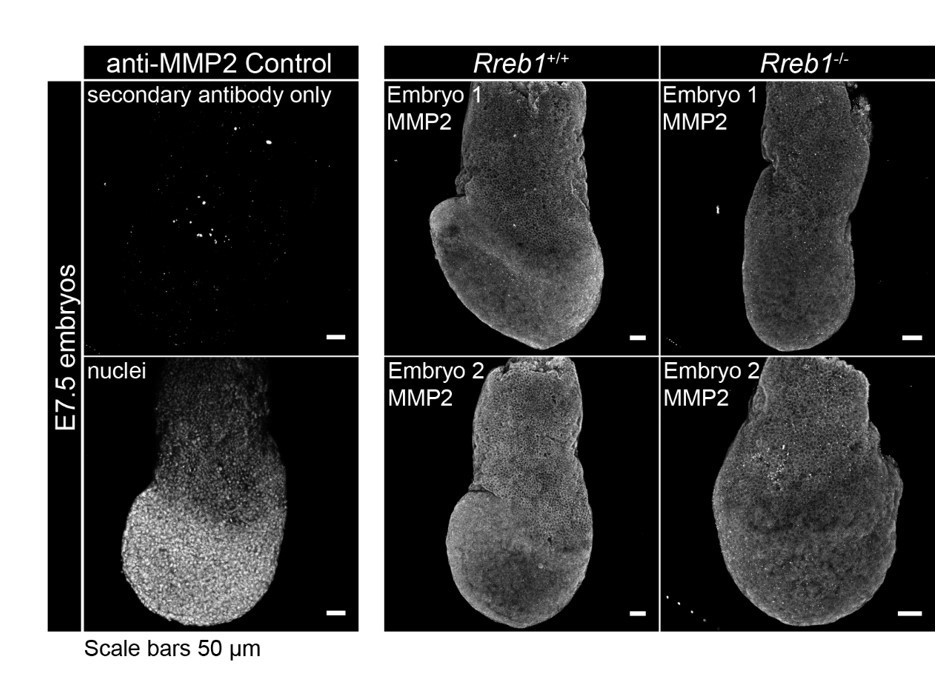
Rreb1-/- chimeras exhibit changes in ECM organization.
(A,C,D) Confocal images showing transverse cryosections of immunostained E7.5 chimeric embryos containing Rreb1+/+ or Rreb1-/- cells. (A) Confocal optical sections of Rreb1-/- chimeras. Cherry fluorescence is a constitutive lineage label marking the progeny of Rreb1-/-embryonic stem cells (ESCs) introduced into host embryos. Arrowheads mark ectopic SOX2 + cells derived from wild-type host cells (white) or from Rreb1-/- cells (magenta). Sb, 25 μm. (C) Confocal optical sections of Rreb1-/- chimeras. Arrowhead marks ectopic SOX2 + cells traversing a break in the basement membrane between the epiblast and outer visceral endoderm layer. Sb, 10 μm. (D) Confocal optical sections and maximum intensity projections (MIP) of Rreb1-/- chimeras. Upper and lower panels are sections taken from the same embryo, 20 μm apart. Arrowheads mark invasive SOX2 + cells surrounded by Laminin. Dashed line marks the approximate line of measurement of the length of the adjacent Laminin track. Sb, 25 μm and 10 μm for high-magnification image. (B) Graph showing the relative expression level of a panel of ECM- associated genes from RNA-sequencing of individual Rreb1+/+ and Rreb1-/- embryos. Each point represents a single embryo. Statistical analysis was performed using an Unpaired t-test (*p<0.05, **p<0.005, ***p<0.001). Bars represent median and IQR. Expression is shown relative to the mean expression in wild-type embryos. (E) Graph showing the top five results from KEGG pathway analysis of genes that were significantly upregulated in Rreb1-/- versus Rreb1+/+ embryos. The genes associated with each category are shown on the graph. (F) Schematic diagram summarizing some of the key findings in this paper. i. In the wild-type epiblast epithelium of the mouse embryo, adherens junction components, such as E-CADHERIN, form continuous belts along cell junctions and F-ACTIN forms linear filaments that run parallel to these junctions. ii. In Rreb1-/- embryos, there was a reduction in the expression of a cohort of factors secreted by the VE, which may alter the behavior of epiblast cells. Furthermore, we observed various phenotypes in the Rreb1-/- epiblast epithelium including a more variable cell orientation compared to that of wild-type embryos, abnormal accumulations of cells, ectopic expression of the mesenchymal marker SNAIL, and chains of cells apparently exiting the epithelial layer. iii. The wild-type epiblast epithelium forms a Laminin basement membrane at its basal surface. iv. In contrast, in chimeric embryos that contain a mix of both wild-type and Rreb1-/- cells, we observed cells of both genotypes traversing breaks in the underlying basement membrane which were then found ectopically throughout the embryo. Moreover, we observed the formation of long Laminin tracks closely associated with abnormal SOX2HI cells. v. The cell behaviors observed in Rreb1-/- embryos and chimeras are similar to those observed in cancer. For example, abnormal accumulations of epithelial cells are the basis of tumor formation, changes in cytoskeleton organization combined with a switch from linear to punctate E-CADHERIN and ectopic expression of mesenchymal markers characterizes an intermediate EMT state that is associated with collective invasion during cancer metastasis. Remodeling of the ECM into parallel fibers, known as ECM microtracks, facilitates collective cell invasion in cancer metastasis. Furthermore, the tumor microenvironment commonly show a change in the expression of secreted factors that promote angiogenesis. A, anterior; P, posterior; L, left; R, right; Pr, proximal; Ds, distal; Epi, epiblast; Endo, endoderm; ExE, extraembryonic ectoderm; Meso, mesoderm.
Figure 7—figure supplement 1

Rreb1 chimeras display changes in ECM organization.
(A,C,D) Confocal optical sections and maximum intensity projections (MIP) of transverse cryosections of immunostained E7.5 chimeric embryos containing Rreb1-/- ESCs. Sb, 10 μm. (A) Cherry fluorescence is a constitutive lineage label marking the progeny of Rreb1-/-embryonic stem cells (ESCs) introduced into host embryos. Magenta arrowheads mark ectopic SOX2 + cells derived from Rreb1-/- cells. (C) Arrowhead marks an ectopic break in the basement membrane in a lateral region of the embryo. (D) Dashed line traces the approximate line of measurement of the Laminin track. Boxes show regions displayed at higher magnification. A, anterior; P, posterior; L, left; R, right; Epi, epiblast; Endo, endoderm; Meso; mesoderm.
Author response image 1
Author response image 2
Author response image 3
Author response image 4
Additional files
Download links
A two-part list of links to download the article, or parts of the article, in various formats.
Downloads (link to download the article as PDF)
Open citations (links to open the citations from this article in various online reference manager services)
Cite this article (links to download the citations from this article in formats compatible with various reference manager tools)
The transcription factor Rreb1 regulates epithelial architecture, invasiveness, and vasculogenesis in early mouse embryos
eLife 10:e64811.
https://doi.org/10.7554/eLife.64811


