Tachykinin signaling inhibits task-specific behavioral responsiveness in honeybee workers
- Institute of Apicultural Research/Key Laboratory of Pollinating Insect Biology, Ministry of Agriculture, Chinese Academy of Agricultural Science, China
- Department of Biology, University of North Carolina Greensboro, United States
- Biometrology and Inspection & Quarantine, College of Life Science, China Jiliang University, China
- Institute of Horticultural Research, Shanxi Academy of Agricultural Sciences, Shanxi Agricultural University, China
- Department of Biological Sciences, University of Alberta, Canada
Figures
Figure 1
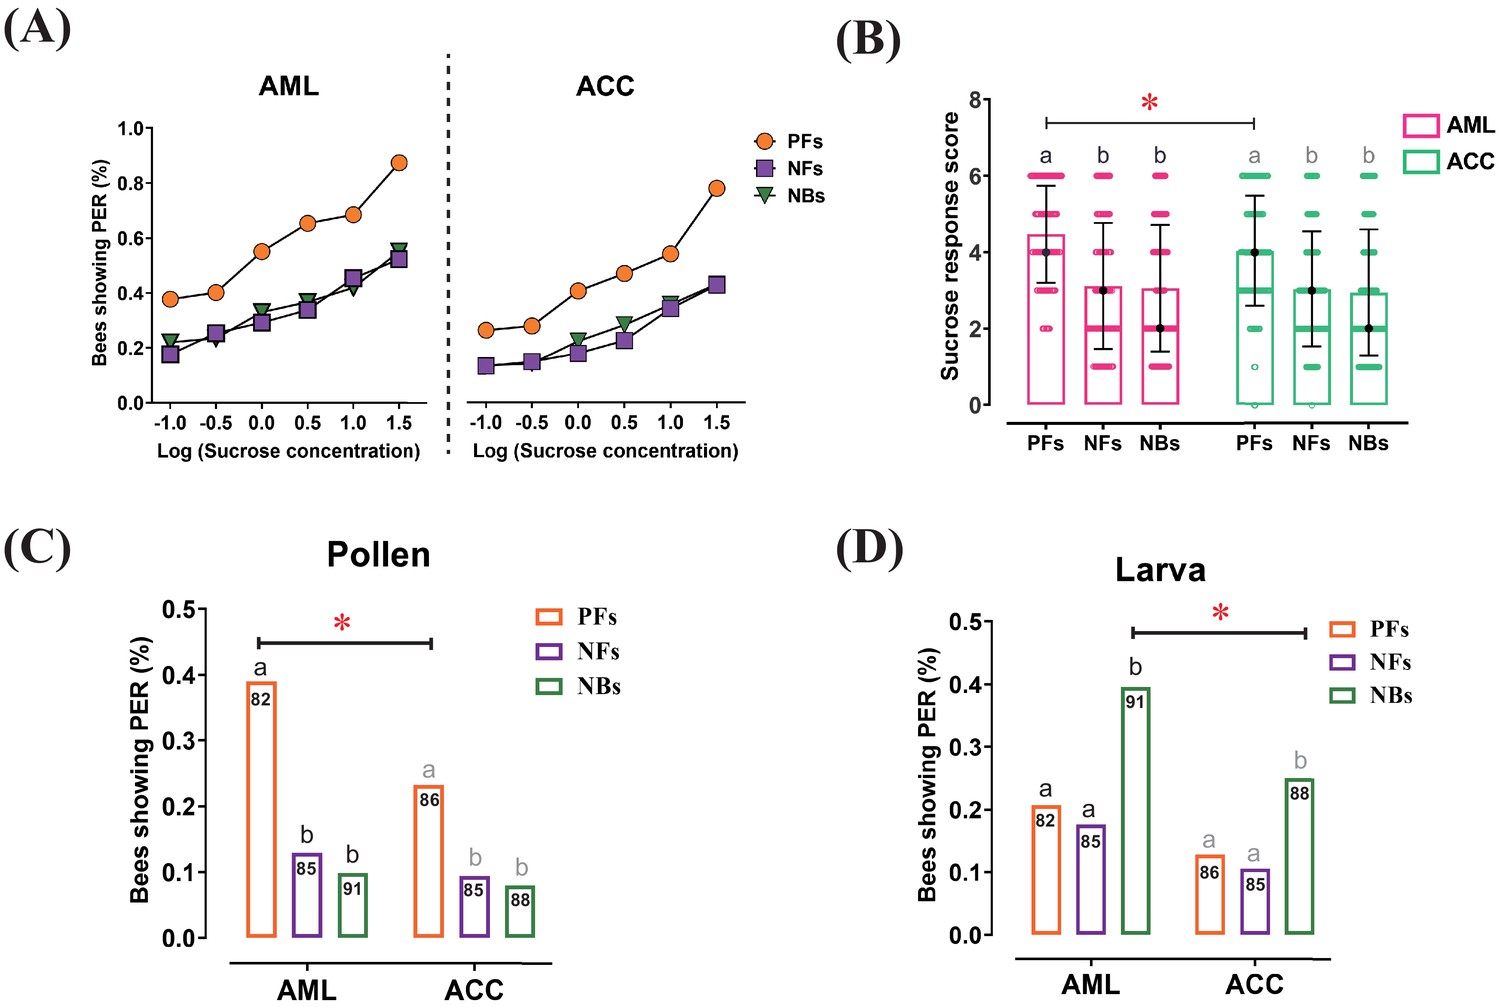
Responses to sucrose solution, pollen, and larva stimulations were significantly different among behavioral phenotypes and between honeybee species.
(A) The proportion of pollen foragers (PFs), nectar foragers (NFs), and nurse bees (NBs) showing a proboscis extension reflex (PER) increased with increasing concentrations of sucrose solutions. Left: Apis mellifera ligustica (AML), right: Apis cerana cerana (ACC). Details of the statistical results of our comparisons of sucrose responsiveness between behavioral phenotypes and bee species are listed in Supplementary file 1. (B) Median sucrose response scores (SRS; intermediate lines) and quartiles (upper and lower lines) of PFs, NFs, and NBs. The number of bees per group was between 125 and 136. Kruskal-Wallis tests with Bonferroni correction were used to compare the SRSs of the three behavioral phenotypes in the same species and significant differences are denoted by letters at p<0.05. Pairwise Mann-Whitney U tests were used for comparing the same phenotype between two honeybee species (*p<0.05). (C) Proportion of PFs, NFs, and NBs showing PER to pollen stimulation of their antennae. (D) Proportion of PFs, NFs, and NBs showing PER to antennal stimulation with larvae. Numbers in bars represent the number of individuals sampled in each group. Independent chi-square tests were used to compare the responsiveness to pollen or larvae between species (*p<0.05) and among behavioral phenotypes within species (letters indicate significant difference at p<0.05).
-
Figure 1—source data 1
The proboscis extension response of Apis mellifera ligustica and Apis cerana cerana worker bees to different sucrose solutions.
- https://cdn.elifesciences.org/articles/64830/elife-64830-fig1-data1-v2.docx
Figure 2
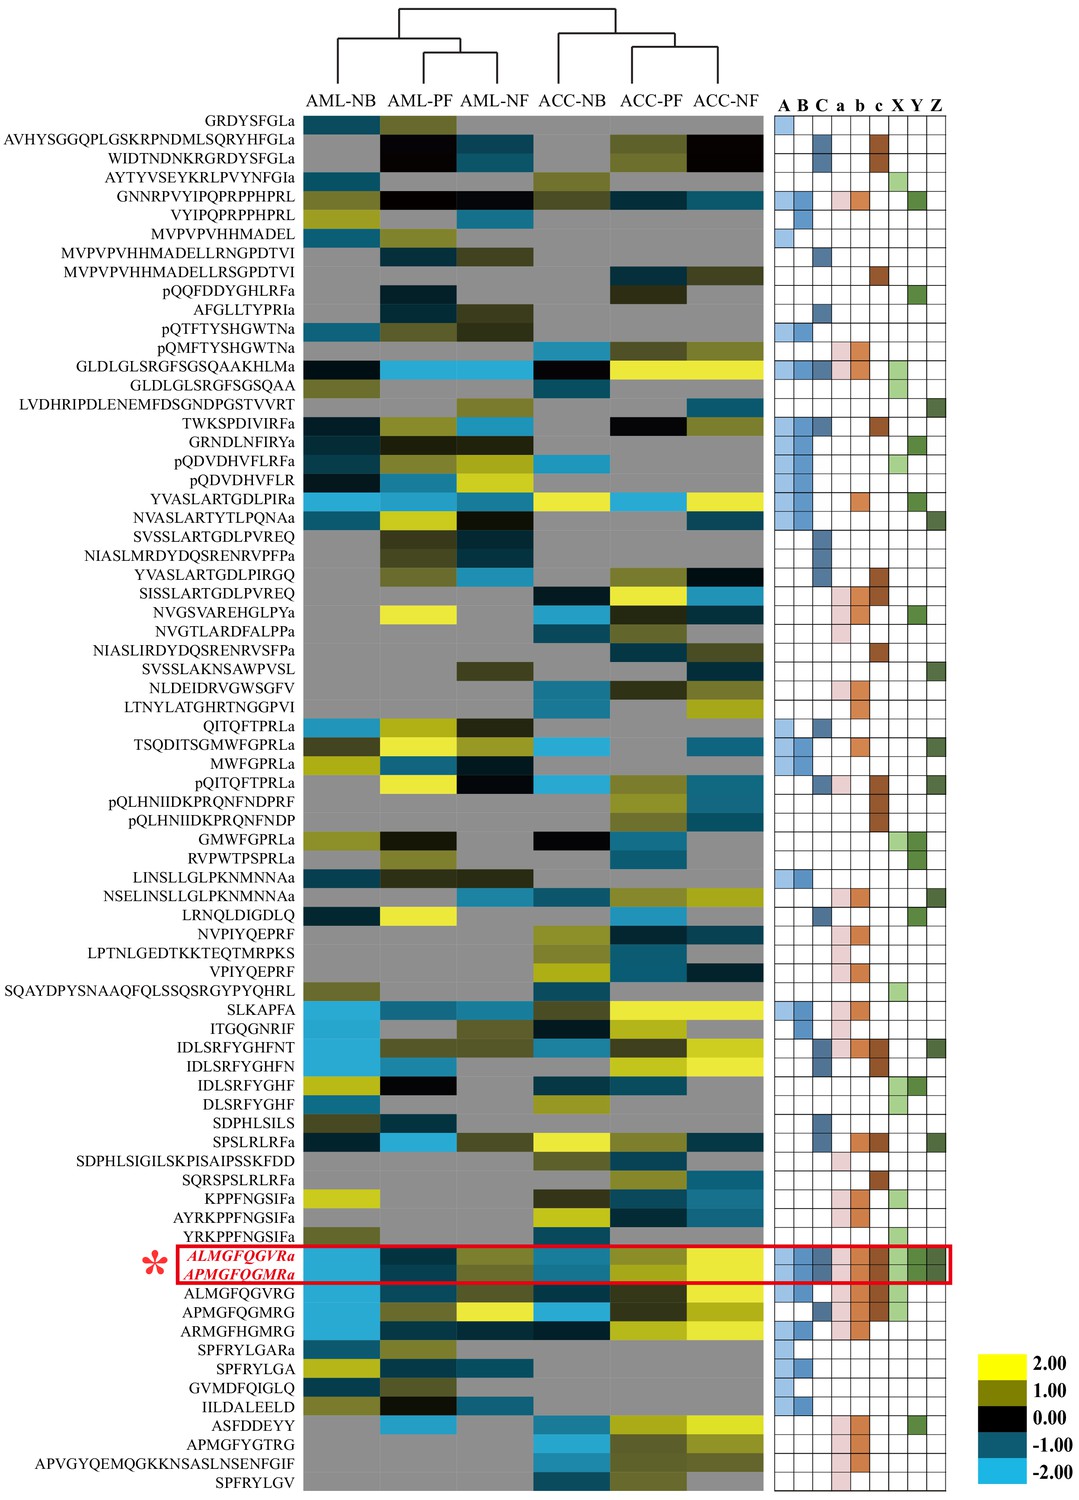
Quantitative comparison of the brain neuropeptides among behavioral phenotypes and species.
The brain neuropeptides were quantitatively compared between nurse bees (NBs), pollen foragers (PFs), and nectar foragers (NFs) of Apis mellifera ligustica (AML) and Apis cerana cerana (ACC). The up- and downregulated peptides are indicated by yellow and blue colors, respectively. Color intensity indicates the relative expressional level, as noted in the key. Letters A, B, and C on the right represent significant differences between NBs and PFs, NBs and NFs, and PFs and NFs in AML, respectively; a, b, and c represent significant differences between NBs and PFs, NBs and NFs, and PFs and NFs in ACC, respectively; X, Y, and Z represent significant differences of NBs, PFs, and NFs between AML and ACC, respectively. For detailed quantitative comparison results, see Figure 2—source data 1, 2, and 3.
-
Figure 2—source data 1
Quantitative neuropeptide comparison of different behavioral phenotypes of Apis mellifera ligustica workers.
- https://cdn.elifesciences.org/articles/64830/elife-64830-fig2-data1-v2.docx
-
Figure 2—source data 2
Quantitative neuropeptide comparison of different behavioral phenotypes of Apis cerana cerana workers.
- https://cdn.elifesciences.org/articles/64830/elife-64830-fig2-data2-v2.docx
-
Figure 2—source data 3
Quantitative neuropeptide comparison between Apis cerana cerana and Apis mellifera ligustica.
- https://cdn.elifesciences.org/articles/64830/elife-64830-fig2-data3-v2.docx
Figure 3
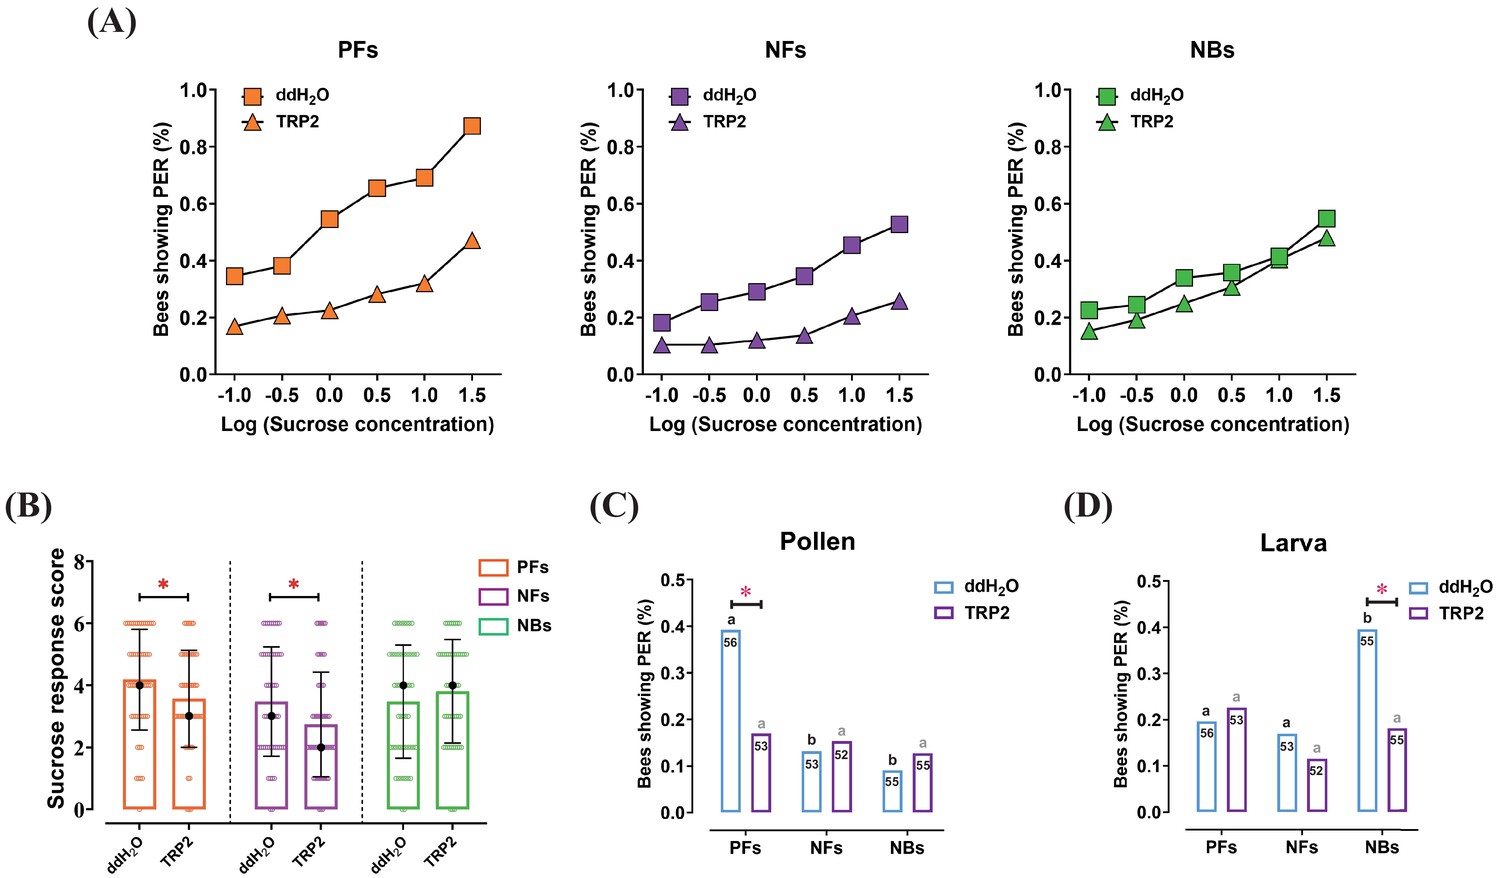
Injection of tachykinin-related peptide 2 (TRP2) decreased task-specific responsiveness of worker bees ( Apis mellifera ligustica).
(A) The proportion of pollen foragers (PFs), nectar foragers (NFs), and nurse bees (NBs) exhibiting a positive proboscis extension reflex (PER) increased with increasing concentrations of sucrose solutions but was overall decreased in PFs and NFs after injection of TRP2 compared to ddH2O injection. (B) Median sucrose response scores (SRS; intermediate lines) and quartiles (upper and lower lines) of ddH2O-injected and TRP2-injected groups of PFs, NFs, and NBs. The number of bees varied between 52 and 58 per group. Mann-Whitney U tests were used to compare the SRS (*p<0.05). The proportion of PFs, NFs, and NBs showing PER to pollen stimulation (C) and larva stimulation (D) after injection of TRP2 or ddH2O. Numbers in bars are the number of individuals sampled in each group. Independent chi-square tests were used to compare the responsiveness between different treatments (*p<0.05) and between different behavioral phenotypes within treatments (significant differences are denoted by letters, p<0.05).
-
Figure 3—source data 1
The proboscis extension response of workers after injection of ddH2O and tachykinin-related peptide 2 (TRP2).
- https://cdn.elifesciences.org/articles/64830/elife-64830-fig3-data1-v2.docx
Figure 4

RNAi-mediated knockdown of tachykinin-related peptide (TRP) and its receptor (TRPR) expression increased task-specific responses of worker bees ( Apis mellifera ligustica).
(A) Proportion of positive proboscis extension reflex (PER) responses of pollen foragers (PFs), nectar foragers (NFs), and nurse bees (NBs) increases with increasing concentrations of sucrose solutions but overall increases occur only in PFs and NFs after knockdown of TRP or TRPR transcripts compared to GFP control. Statistical details of these sucrose responsiveness comparisons are shown in Supplementary file 5. (B) Median sucrose response scores (SRS; intermediate lines) and quartiles (upper and lower lines) of ddH2O-injected and TRP2-injected PFs, NFs, and NBs. The number of bees per group varied between 50 and 56. Kruskal-Wallis tests with Bonferroni correction were used to compare the SRSs of the three treatment groups of each behavioral phenotype and significant differences are denoted by letters (p<0.05). The proportion of PFs, NFs, and NBs showing PER to pollen stimulation (C) and larvae stimulation (D) after GFP, TRP, or TRPR knockdown. Numbers in bars are the number of individuals sampled in each group. Independent chi-square tests were used to compare the task-specific responsiveness between different treatments (*p<0.05, **p<0.01) within behavioral phenotypes and between different behavioral phenotypes within each treatment (significant differences are denoted by letters, p<0.05).
-
Figure 4—source data 1
The proboscis extension response of workers after injection of dsGFP, dsTRP, and dsTRPR.
- https://cdn.elifesciences.org/articles/64830/elife-64830-fig4-data1-v2.docx
Figure 5 with 5 supplements

Biochemical characterization of Apis mellifera tachykinin-related peptide (TRP) signaling in cell culture.
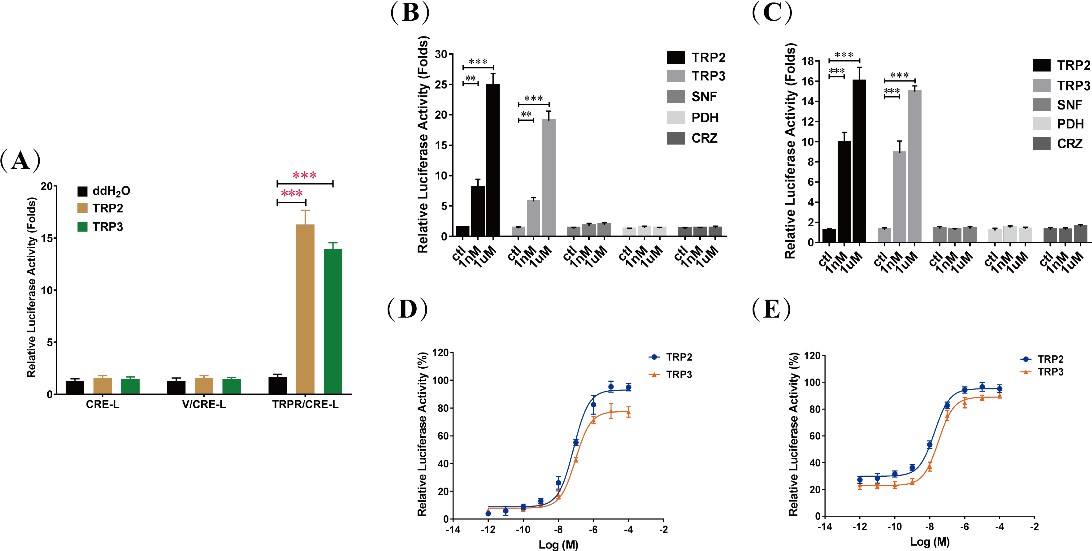
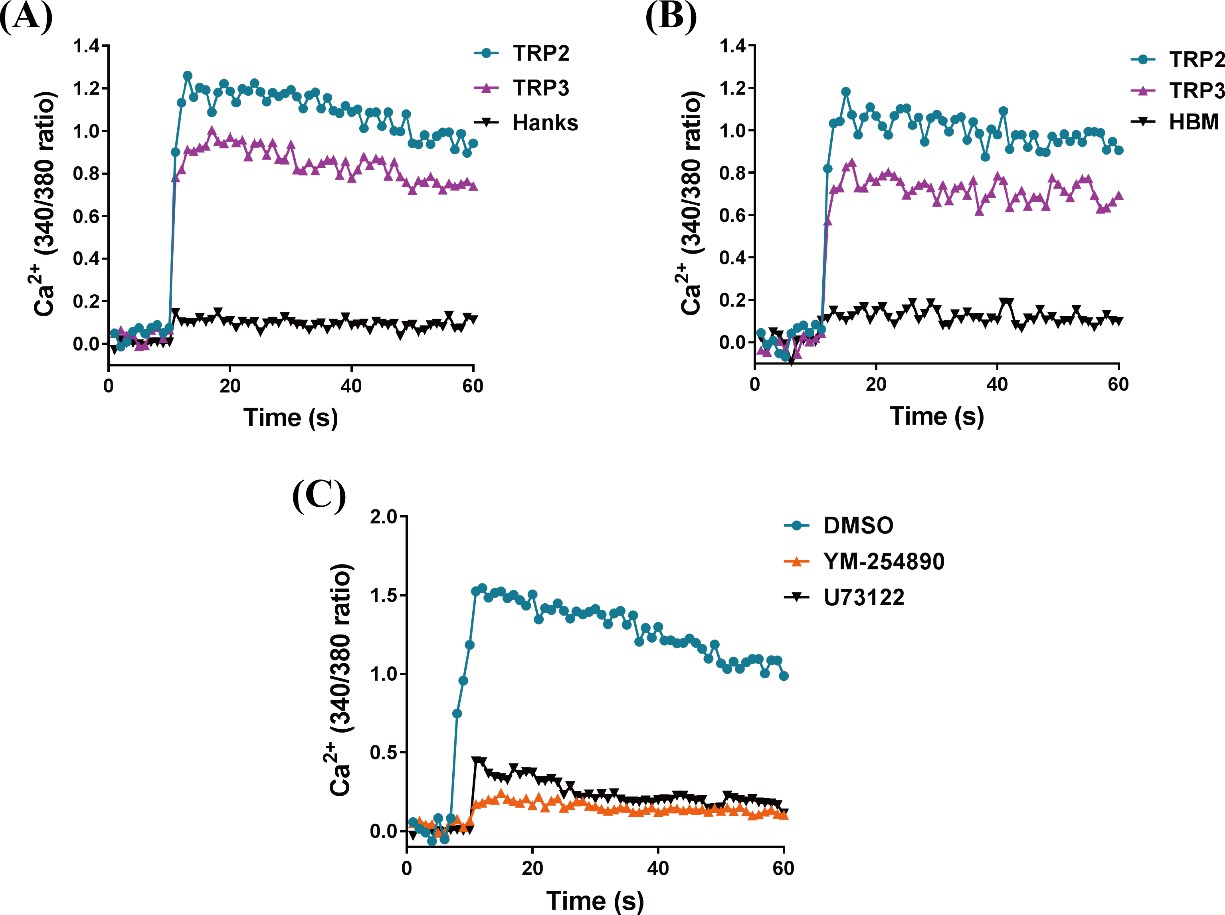
(A) To confirm the predicted membrane localization of the cloned A. mellifera TRP receptor (TRPR), Sf21 cells expressing the TRPR tagged with EGFP (green) were stained with the membrane plasma probe DiI (red) and nuclear probe Hoechst (blue). (B) Luciferase activity of HEK293 cells transfected with the reporter gene pCRE-Luc (CRE-L) and co-transfected with pFLAG-TRPR (TRPR) or vehicle vector (V) indicated that 1 μM treatment of TRP2 or TRP3 increases cAMP levels more than 10-fold. (C) Intracellular Ca2 levels of HEK293 cells expressing TRPR rose sharply in response to TRP2 and TRP3, based on fluorescence measures of the Ca2+ indicator Fura-2 AM. Hepes-buffered medium (HBM) was used as a control. (D) Dose-dependent response of ERK1/2 phosphorylation to TRP2 stimulation of Sf21 cells that expressed TRPR and were incubated with increasing doses of TRP2 (from 0.1 pM to 1 μM) before their harvest for Western blot analysis (log TRP2 (M) = logarithm of the molar concentration of TRP2).
-
Figure 5—source data 1
Competitive binding assays with labeled tachykinin-related peptide 2 (TRP2) and TRP3.
- https://cdn.elifesciences.org/articles/64830/elife-64830-fig5-data1-v2.xlsx
-
Figure 5—source data 2
Tachykinin-related peptide 2 (TRP2) and TRP3 exclusively activate its receptor (TRPR) and trigger cAMP signaling.
- https://cdn.elifesciences.org/articles/64830/elife-64830-fig5-data2-v2.xlsx
-
Figure 5—source data 3
Tachykinin-related peptide 2 (TRP2)-induced cAMP accumulation is regulated by G-protein inhibitors and activators.
- https://cdn.elifesciences.org/articles/64830/elife-64830-fig5-data3-v2.xlsx
-
Figure 5—source data 4
Intracellular Ca2+ mobilization is induced by tachykinin-related peptide 2 (TRP2) and TRP3, and regulated by Gαq inhibitor.
- https://cdn.elifesciences.org/articles/64830/elife-64830-fig5-data4-v2.xlsx
-
Figure 5—source data 5
Extracellular-signal-regulated kinase (ERK) phosphorylation levels in response to TRP/TRPR (tachykinin-related peptide and its receptor) signaling.
- https://cdn.elifesciences.org/articles/64830/elife-64830-fig5-data5-v2.xlsx
Figure 5—figure supplement 1
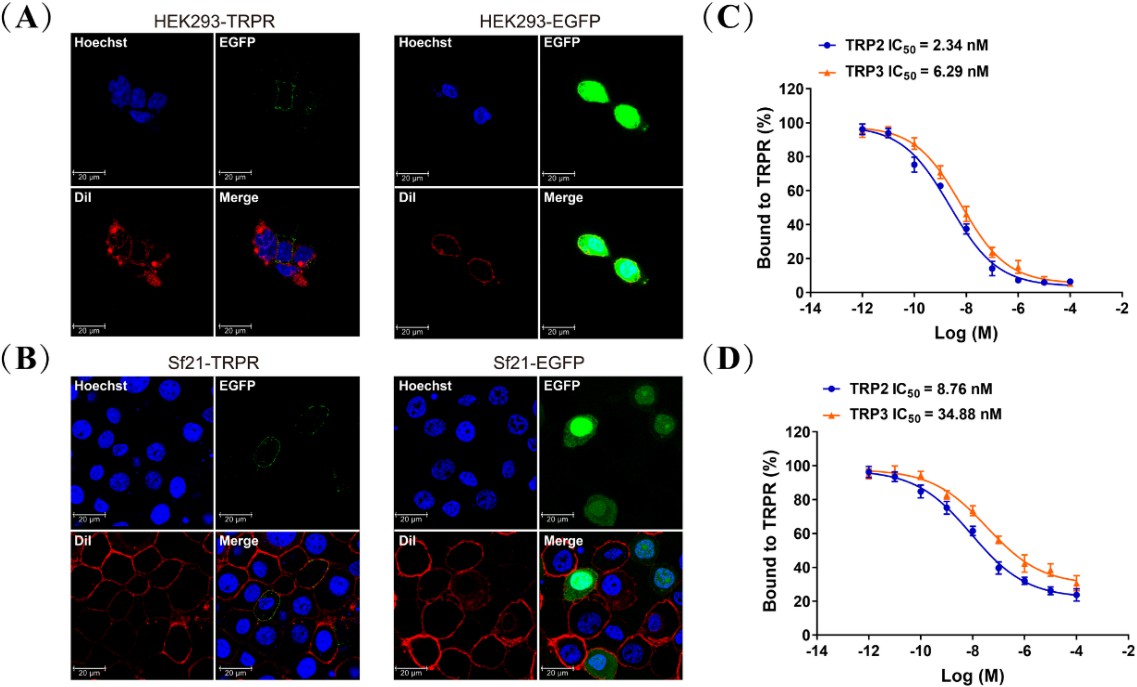
Tachykinin-related peptide receptor (TRPR) localization and competitive binding of TRP2 and TRP3.
Expression of TRPR and direct interaction of TRPs with TRPR in cell culture. (A and B) HEK293 and Sf21 cells expressing TRPR-EGFP and EGFP (green) were stained with a membrane plasma probe DiI (red) and a nuclei probe Hoechst (blue), and assessed by confocal microscopy. (C and D) Competitive inhibition of TAMRA-TRP2 and TAMRA-TRP3 binding to TRPR in HEK293 and Sf21 cells, and all data are presented as mean ± s.e.m. from three independent experiments.
Figure 5—figure supplement 2
cAMP generation is specific to tachykinin-related peptide 2 (TRP2) and TRP3 and dose-dependent TRP/TRPR (TRP and its receptor)-mediated cAMP accumulation in cells.
(A) Luciferase activity of HEK293 cells transfected with the reporter gene pCRE-Luc (CRE-L) and co-transfected with pFLAG-TRPR (TRPR) or vehicle vector (V) were determined in response to ddH2O and TRP (TRP2 or TRP3, 1 μM) treatment. TRP-dependent TRPR activation increases cAMP levels more than 10-fold (see also main text). Luciferase activity of HEK293 cells (B) and Sf21 cells (C) co-transfected with TRPR and CRE-L were determined in response to different neuropeptides (TRP2, TRP3, short neuropeptide F [SNF], pigment-dispersing hormone [PDH], and corazonin [CRZ]) at different concentrations (1 nM or 1 μM). Increase of cAMP was specific to TRP2 and TRP3. Dose-dependent changes of luciferase activities, indicating cAMP increases, in HEK293 cells (D) and Sf21 cells (E) co-transfected with TRPR and CRE-L revealed typical kinetics in response to TRP2 and TRP3. All data are presented as mean ± s.e.m. from three independent experiments. Student’s t-tests were used for pairwise comparisons (**p < 0.01, ***p < 0.001).
Figure 5—figure supplement 3

TRP/TRPR (tachykinin-related peptide and its receptor) signaling induces cAMP accumulation via Gαq and Gαs pathways.
(A) Effects of Gαi inhibitor pertussis toxin (PTX) and Gαs activator cholera toxin (CTX) on TRP2-mediated stimulation of cAMP accumulation. HEK293 cells expressing TRPR were pretreated with PTX (100 ng/ml) or CTX (300 ng/ml) overnight prior to treatment with TRP2 (1 μM). (B) Effects of Gαq inhibitor YM-254890 and PKA inhibitor H89 on TRP2-mediated stimulation of cAMP accumulation. HEK293 cells expressing TRPR were pretreated with YM-254890 (1 μM) or H89 (10 μM) for 2 hr prior to treatment with TRP2 (1 μM). All data are presented as mean ± s.e.m. from three independent experiments. Student’s t-tests were used for pairwise comparisons between water and TRP2 treatments (*p < 0.05, **p < 0.01, ***p < 0.001). One-way ANOVAs followed by Tukey’s post hoc tests were used for comparisons among control, PTX, and CTX groups within water or TRP2 treatments, and significant differences (p < 0.05) are denoted by letters.
Figure 5—figure supplement 4
TRP/TRPR (tachykinin-related peptide and its receptor) signaling mediates intracellular Ca2+ influx via Gαq/PLC pathway.
HEK293 cells (A) and Sf21 cells (B) expressing TRPR were measured in response to TRP2 and TRP3 using the fluorescent Ca2+ indicator Fura-2 AM. Hanks solution (Hanks) and Hepes-buffered medium (HBM) were used as a control, respectively. (C) Effects of Gαq inhibitor YM-254890 and PLC inhibitor U73122 compared to vehicle control DMSO on TRP2-mediated intracellular Ca2+ influx. HEK293 cells expressing TRPR were pretreated with YM-254890 (1 μM) or U73122 (10 μM) for 2 hr then stimulated with TRP2 (1 μM). Each figure is a representative of three independent replicate experiments.
Figure 5—figure supplement 5

Extracellular-signal-regulated kinase (ERK) phosphorylation is dose- and time-dependent and can be inhibited.
Gαq/PKC and Gαs/PKA pathways involved in tachykinin-related peptide (TRP) and its receptor (TRPR)-induced ERK1/2 phosphorylation. Dose- and time-response analyses of TRP/TRPR-induced ERK1/2 phosphorylation in HEK293 cells (A) and Sf21 cells (B). Cells expressing TRPR were serum-starved then incubated either with an increasing dose of TRP2 (from 0.1 pM to 1 μM) for 10 min or with 100 nM TRP2 for different times (from 0 to 90 min), then harvested to quantify ERK1/2 phosphorylation. Effects of Gαi inhibitor pertussis toxin (PTX), MEK inhibitor U0126, PKA inhibitor H89, and PKC inhibitor Go6983 on TRP2-induced ERK1/2 phosphorylation in HEK293 cells (C) and Sf21 cells (D). The cells were pretreated with or without inhibitors for 2 hr then stimulated with ddH2O (control) or TRP2 (10 nM or 1 μM) for 10 min. The phosphorylated ERK was normalized to a loading control (total ERK). All data are presented as mean ± s.e.m. from three independent replicates, and blots shown are representative of these experiments. One-way ANOVAs followed by Tukey’s post hoc tests were used for multi-group comparisons, and significant differences (p < 0.05) are denoted by letters.
Figure 6
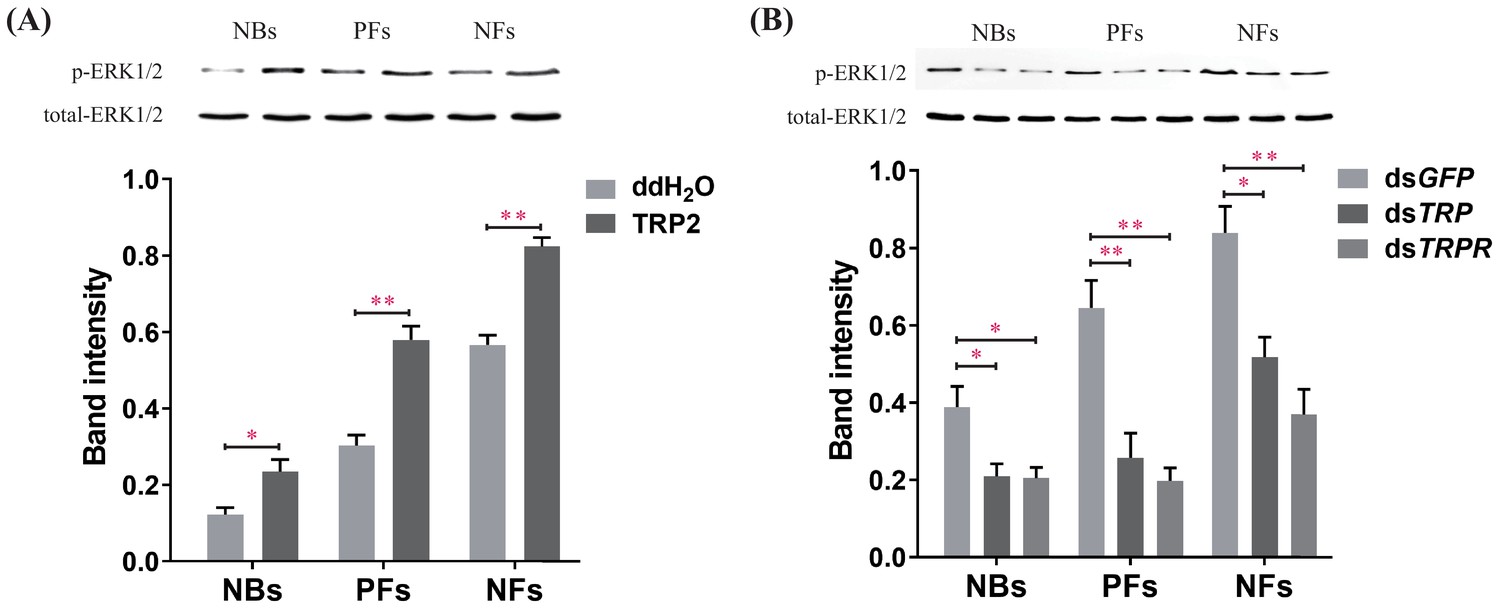
Manipulations of tachykinin-related peptide (TRP) and its receptor (TRPR) levels change extracellular-signal-regulated kinase (ERK) phosphorylation states in the brain of worker bees (Apis mellifera ligustica).
(A) The ERK phosphorylation (p-ERK) levels after injection of TRP2 or ddH2O into pollen foragers (PFs), nectar foragers (NFs), and nurse bees (NBs) of A. mellifera ligustica. (B) The p-ERK levels after transcript knockdown of GFP, TRP, or TRPR in PFs, NFs, and NBs. The p-ERK was normalized to a loading control (total-ERK). The data shown are representative of three independent experiments, and blots shown are representative of these experiments. Student’s t-tests were used for pairwise comparisons between control and treatment groups within each behavioral phenotype (*p<0.05, **p<0.01, ***p<0.001).
-
Figure 6—source data 1
Extracellular-signal-regulated kinase (ERK) phosphorylation levels in response to manipulations of tachykinin-related peptide (TRP) and its receptor (TRPR) levels.
- https://cdn.elifesciences.org/articles/64830/elife-64830-fig6-data1-v2.xlsx
Figure 7

Conceptual model representation the TRP signaling effect.
Worker honeybees specialize into nurse bees, pollen foragers, and nectar foragers through various influences and display task-specific response thresholds to brood (blue bar), pollen (orange bar), and nectar (yellow bar) stimuli. The tachykinin pathway (tachykinin-related peptide [TRP] and its receptor [TRPR] signaling) can regulate the extent of specialization by specifically decreasing (pathway active: dark gray arrow with + symbol) or increasing (pathway inactive: light gray arrow with – symbol) the responsiveness of each behavioral phenotype to its specific stimuli. This study demonstrates the task-specific response thresholds and how TRP/TRPR signaling affects these thresholds. The predicted behavioral effects of increasing (high) or decreasing (low) the specialization of the behavioral phenotypes remains to be demonstrated.
Tables
Key resources table
| Reagent type (species) or resource | Designation | Source or reference | Identifiers | Additional information |
|---|---|---|---|---|
| Gene (Apis mellifera) | TRP | BEEBASE | GB49248 | |
| Gene (Apis mellifera) | TRPR | BEEBASE | GB49973 | |
| Strain, strain background (Escherichia coli) | DH5α competent cells | TaKaRa | Cat#9057 | |
| Cell line (Homo sapiens) | HEK293 (embryonic kidney cell line) | ATCC | Cat#CRL-1573, RRID:CVCL_0045 | |
| Cell line (Spodoptera frugiperda) | Sf21 (pupal ovary cell line) | Thermo Fisher Scientific | Cat#11497013, RRID:CVCL_0518 | |
| Antibody | Anti-ERK1/2 (rabbit monoclonal) | Cell Signaling Technology | Cat#4695T; RRID:AB_390779 | (1:1000) |
| Antibody | Anti-phospho-ERK1/2 (rabbit polyclonal ) | Cell Signaling Technology | Cat#9101S; RRID:AB_331646 | (1:1000) |
| Antibody | Anti-rabbit IgG, HRP-linked (goat, polyclonal) | Cell Signaling Technology | Cat#7074S; RRID:AB_2099233 | (1:5000) |
| Recombinant DNA reagent | pCMV-FLAG (plasmid) | Sigma-Aldrich | Cat#E 8770 | |
| Recombinant DNA reagent | pEGFP-N1 (plasmid) | Clontech | Cat#6085–1 | |
| Sequence-based reagent | TRPRf_F | This paper | PCR primers | See Supplementary file 6 |
| Sequenced-based reagent | TRPRf_R | This paper | PCR primers | See Supplementary file 6 |
| Sequence-based reagent | TRPRe_F | This paper | PCR primers | See Supplementary file 6 |
| Sequence-based reagent | TRPRe_R | This paper | PCR primers | See Supplementary file 6 |
| Sequence-based reagent | TRPRi_F | This paper | RNAi primers | See Supplementary file 6 |
| Sequence-based reagent | TRPRi_R | This paper | RNAi primers | See Supplementary file 6 |
| Sequence-based reagent | TRPRq_F | This paper | qPCR primers | See Supplementary file 6 |
| Sequence-based reagent | TRPRq_R | This paper | qPCR primers | See Supplementary file 6 |
| Sequence-based reagent | TRPi_F | This paper | RNAi primers | See Supplementary file 6 |
| Sequence-based reagent | TRPi_R | This paper | RNAi primers | See Supplementary file 6 |
| Sequence-based reagent | TRPq_F | This paper | qPCR primers | See Supplementary file 6 |
| Sequence-based reagent | GFPi_F | This paper | RNAi primers | See Supplementary file 6 |
| Sequence-based reagent | GFPi_R | This paper | RNAi primers | See Supplementary file 6 |
| Sequence-based reagent | TRPq_R | This paper | qPCR primers | See Supplementary file 6 |
| Commercial assay or kit | PrimeScript RT reagent kit | TaKaRa | Cat#RR047A | |
| Commercial assay or kit | TB Green Fast qPCR Mix | TaKaRa | Cat#RR430A | |
| Commercial assay or kit | Luciferase assay system | Promega | Cat#E1500 | |
| commercial assay or kit | T7 RiboMAX Express RNAi System | Promega | Cat#P1700 | |
| Chemical compound, drug | TAMRA-ALMGFQGVRa | SynPeptide | ||
| Chemical compound, drug | TAMRA-APMGFQGMRa | SynPeptide | ||
| Chemical compound, drug | ALMGFQGVR | SynPeptide | ||
| Chemical compound, drug | APMGFQGMRa | SynPeptide | ||
| Chemical compound, drug | CBR-5884 | Sigma-Aldrich | SML1656 | |
| Chemical compound, drug | Pertussis toxin | Tocris Bioscience | Cat#3097/50U | CAS: 70323-44-3 |
| Chemical compound, drug | H89 | Tocris Bioscience | Cat#2910/1 | CAS: 130964-39-5 |
| Chemical compound, drug | U73122 | Tocris Bioscience | Cat#1268/10 | CAS: 112648-68-7 |
| Chemical compound, drug | Cholera toxin | Tocris Bioscience | Cat#HY-P1446 | CAS: 9012-63-9 |
| Chemical compound, drug | YM-254890 | Tocris Bioscience | Cat#HY-111557 | CAS: 568580-02-9 |
| Software, algorithm | SPSS Statistics 20.0 | IBM | RRID:SCR_019096 | |
| Software, algorithm | Xcalibur 3.0 | Thermo Fisher Scientific | RRID:SCR_014593 | |
| Software, algorithm | PEAKS 8.5 | Bioinformatics Solutions | ||
| Software, algorithm | Gene cluster 3.0 | de Hoon et al., 2004 | https://doi.org/10.1093/bioinformatics/bth078 | |
| Software, algorithm | Primer Premier 5.0 | PREMIER Biosoft | ||
| Other | Hoechst 33342 stain | Beyotime | Cat#C1027 | (1 µg/ml) |
| Other | DiI stain | Beyotime | Cat#C1036 | (1 µg/ml) |
| Other | Lipo6000 transfection reagent | Beyotime | Cat#C0526 | |
| Other | LipoInsect transfection reagent | Beyotime | Cat#C0551 |
Additional files
-
Supplementary file 1
Statistical differences in sucrose responsiveness of different behavioral phenotypes.
- https://cdn.elifesciences.org/articles/64830/elife-64830-supp1-v2.docx
-
Supplementary file 2
Neuropeptides identified in the brain of Apis mellifera ligustica workers.
- https://cdn.elifesciences.org/articles/64830/elife-64830-supp2-v2.docx
-
Supplementary file 3
Neuropeptides identified in the brain of Apis cerana cerana workers.
- https://cdn.elifesciences.org/articles/64830/elife-64830-supp3-v2.docx
-
Supplementary file 4
Efficiencies of dsRNA-mediated knockdown of TRP and TRPR.
- https://cdn.elifesciences.org/articles/64830/elife-64830-supp4-v2.docx
-
Supplementary file 5
Statistical differences in sucrose responsiveness after injection of dsGFP, dsTRP, and dsTRPR.
- https://cdn.elifesciences.org/articles/64830/elife-64830-supp5-v2.docx
-
Supplementary file 6
Sequence information of primers used in this study.
- https://cdn.elifesciences.org/articles/64830/elife-64830-supp6-v2.docx
-
Transparent reporting form
- https://cdn.elifesciences.org/articles/64830/elife-64830-transrepform-v2.docx
Download links
A two-part list of links to download the article, or parts of the article, in various formats.
Downloads (link to download the article as PDF)
Open citations (links to open the citations from this article in various online reference manager services)
Cite this article (links to download the citations from this article in formats compatible with various reference manager tools)
Tachykinin signaling inhibits task-specific behavioral responsiveness in honeybee workers
eLife 10:e64830.
https://doi.org/10.7554/eLife.64830


