Variations of intracellular density during the cell cycle arise from tip-growth regulation in fission yeast
- Department of Cell and Tissue Biology, University of California, San Francisco, United States
- Department of Bioengineering, Stanford University, United States
- Koch Institute for Integrative Cancer Research, Massachusetts Institute of Technology, United States
- MRC Laboratory for Molecular Cell Biology, University College, United Kingdom
- Department of Physics, Massachusetts Institute of Technology, United States
- Brain Science Institute, Korea Institute of Science and Technology, Republic of Korea
- Informatics Institute, University of Amsterdam, Netherlands
- Department of Biological Engineering, Massachusetts Institute of Technology, United States
- Department of Mechanical Engineering, Massachusetts Institute of Technology, United States
- Department of Microbiology and Immunology, Stanford University School of Medicine, United States
- Chan Zuckerberg Biohub, United States
Figures
Figure 1 with 1 supplement
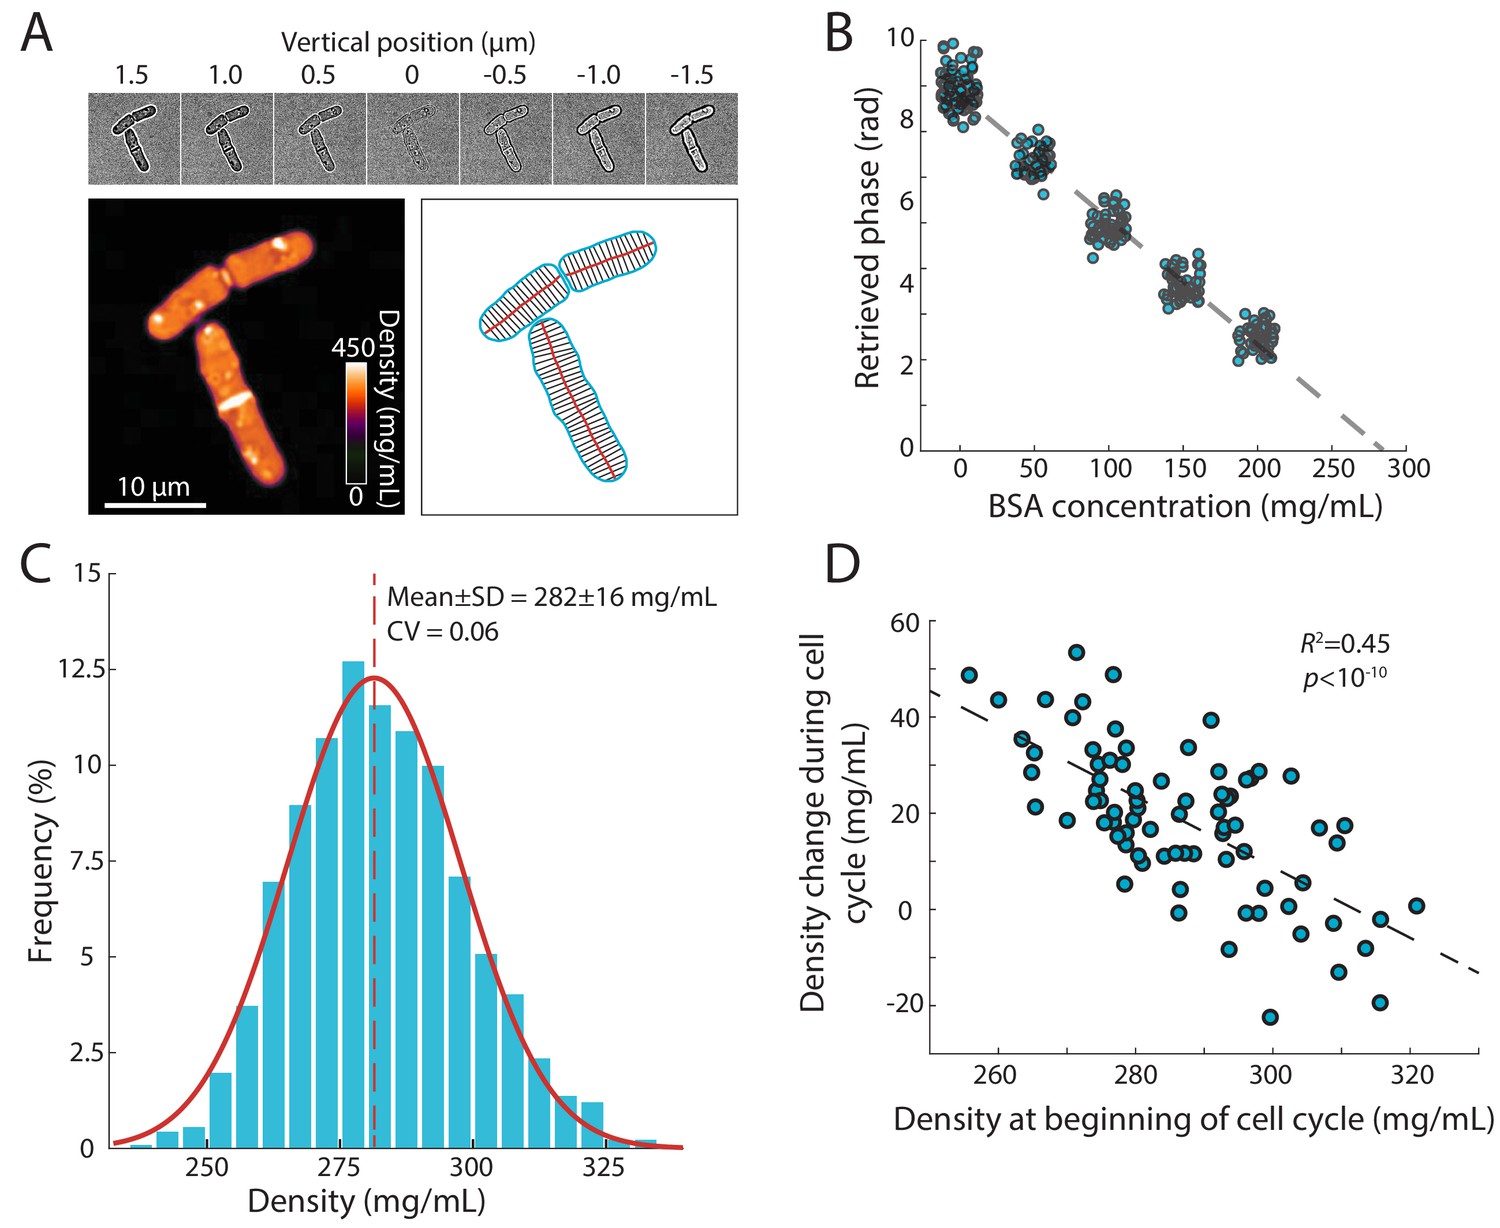
Precise measurement of intracellular density using QPI based on a z-stack of bright-field images.
(A) QPI method for computing cytoplasmic density from bright-field images. A z-stack of bright-field images of fission yeast cells ±1.5 µm around the mid-plane focal position (top panel) were computationally analyzed by solving the transport-of-intensity equation (Bostan et al., 2016) to retrieve pixel-by-pixel phase-shift maps (bottom left). Cellular dimensions were determined via segmentation and skeletonization (bottom right). (B) QPI phase shifts were calibrated by imaging cells in media supplemented with a range of concentrations of BSA. The retrieved phase shift is linearly related to concentration (dashed line is the linear best fit). (C) Histogram of dry-mass density measurements of exponential-phase fission yeast cells grown at 30°C in YE5S medium. A Gaussian fit (red) yielded a mean (dashed line) density of 282 ± 16 mg/mL (n = 2345 time points, 78 cells). SD, standard deviation. (D) Cell density at the beginning of the cell cycle was inversely correlated to the change in density during the cell cycle, indicative of homeostatic behavior (n = 76 cells). The distribution of density changes was not centered around 0 mg/mL due to a ~ 15 mg/mL density decrease after cell separation (see Figure 2F).
-
Figure 1—source data 1
Source Data for Figure 1B on BSA calibration for QPI.
- https://cdn.elifesciences.org/articles/64901/elife-64901-fig1-data1-v2.xlsx
-
Figure 1—source data 2
Source Data for Figure 1C on density distribution in wildtype cells.
- https://cdn.elifesciences.org/articles/64901/elife-64901-fig1-data2-v2.xlsx
-
Figure 1—source data 3
Source Data for Figure 1D on density homeostasis behavior.
- https://cdn.elifesciences.org/articles/64901/elife-64901-fig1-data3-v2.xlsx
Figure 1—figure supplement 1
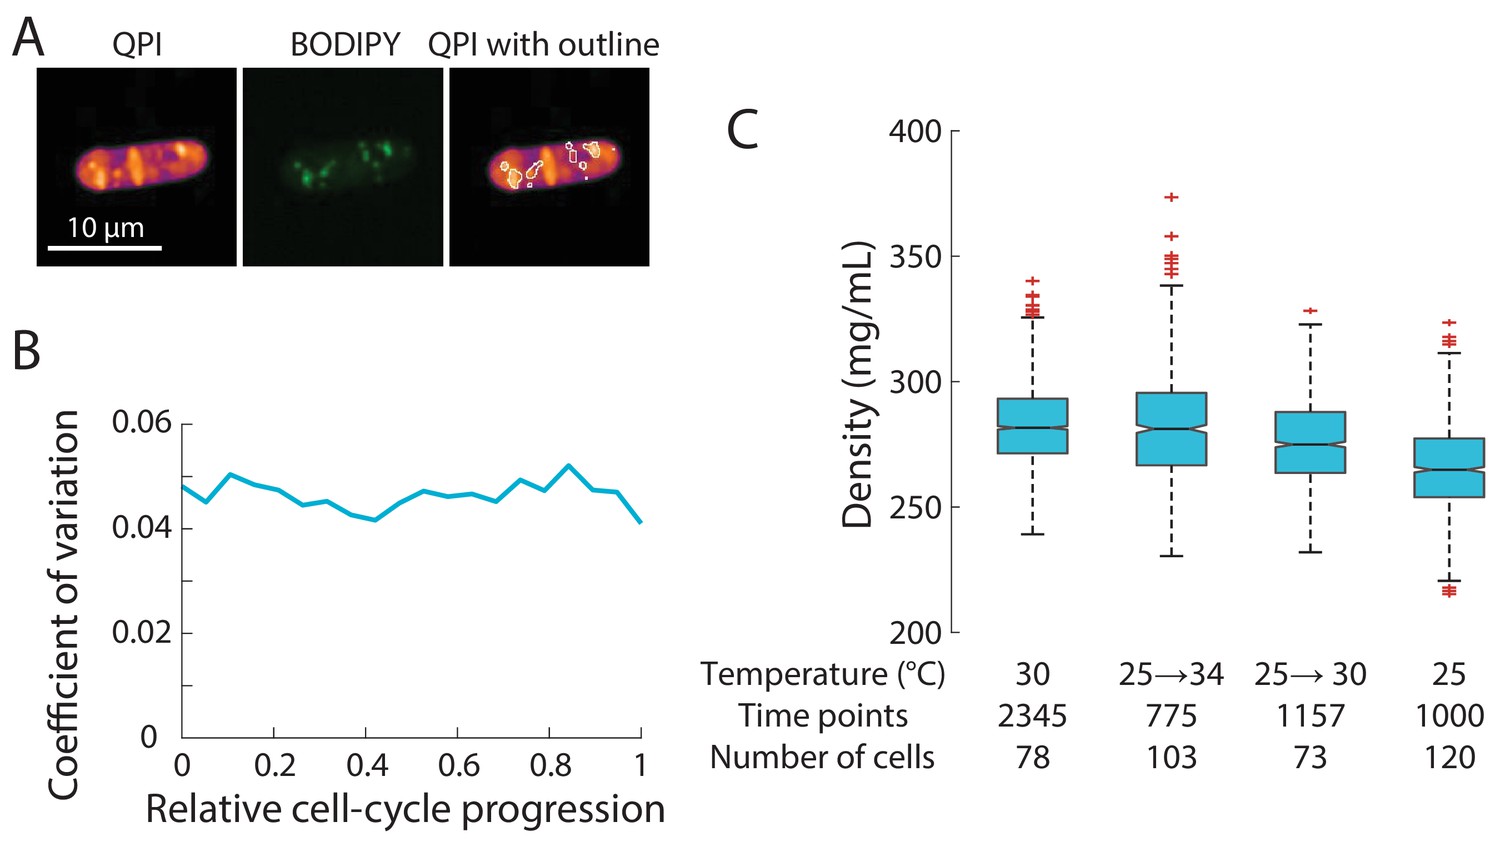
Density distribution is robustly maintained.
(A) High-density features in QPI co-localize with lipid droplets. Cells were stained with BODIPY dye to identify lipid droplets. QPI density map (left) and the corresponding fluorescence image of a representative BODIPY-stained wild-type fission yeast cell (middle). The fluorescence intensity image was thresholded to identify regions containing lipid droplets (outlines), which overlapped with high-density regions in QPI (right). (B) Coefficient of variation (CV) of intracellular density over the cell cycle. The CV at each specific stage of cell-cycle progression (<5%) was slightly lower than the CV across an entire cell population (6%, Figure 1C), supporting the notion that some population-wide variation arises from cell cycle-dependent density variations. (C) Average cell density varied by less than 10% across temperatures and temperature shifts. Edges of the boxes indicate 25th and 75th percentiles, centerline is the median, and whiskers indicate extreme points not considered outliers. In experiments in which the temperature was shifted up, cells were initially grown at 25°C and then moved to the microscope pre-heated to the indicated temperature for long-term imaging.
-
Figure 1—figure supplement 1—source data 1
Source Data for Figure 1—figure supplement 1C on temperature effects on density.
- https://cdn.elifesciences.org/articles/64901/elife-64901-fig1-figsupp1-data1-v2.xlsx
Figure 2 with 4 supplements
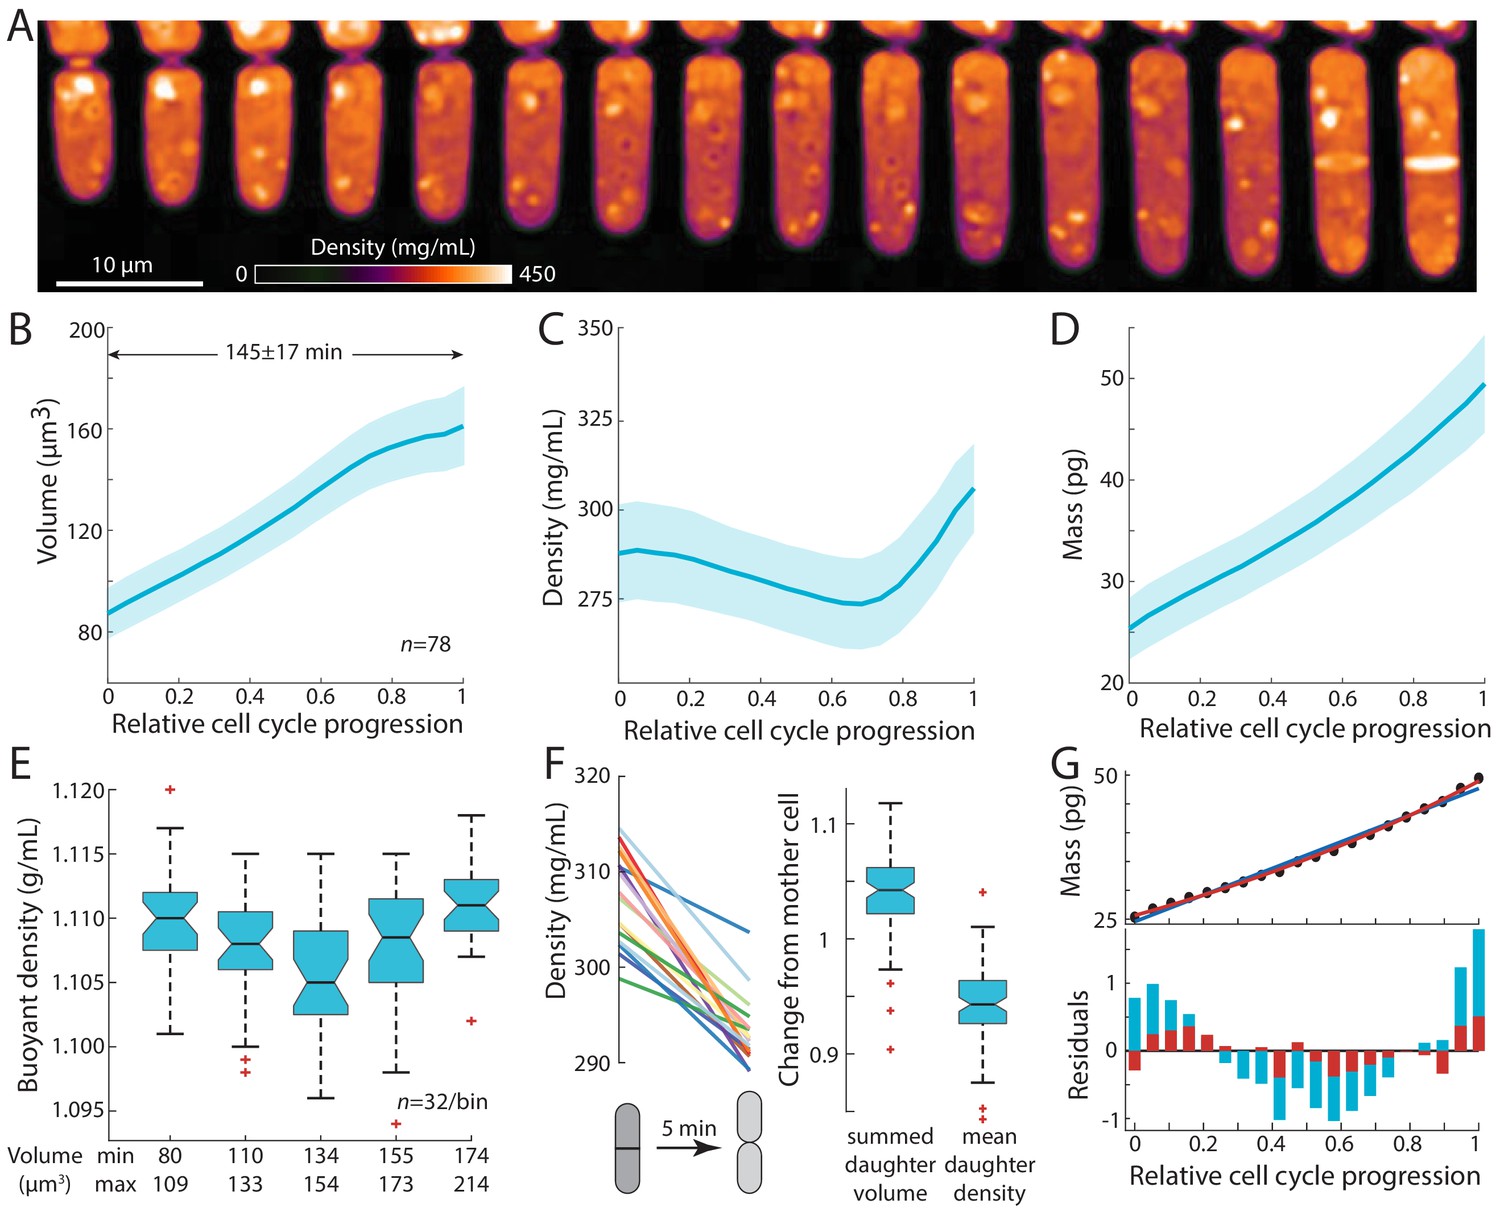
Intracellular density varies across the cell cycle.
(A) Wild-type fission yeast cells in exponential phase were imaged in time lapse in a microfluidic chamber and phase-shift maps were extracted by QPI. Shown are images of a representative cell traversing the cell cycle from (left) cell birth to (right) septation (10 min/frame). (B,C,D) Cell volume (B), density (C), and dry mass (D) of cells aligned by their relative progression in the cell cycle. Curves are mean values and shaded regions represent one standard deviation (n = 78 cells). Mass was estimated from volume and density measurements. (E) SMR-based measurements of fission yeast cells in an asynchronous culture (binned by cell volume) showed a similar decrease in buoyant density at intermediate volume as QPI measurements of dry-mass density (C). (F) Cell density decreases upon cell separation. Left: density measurements of cells just before and just after cell separation (5 min apart). Right: normalized changes in volume and density between the mother and resultant daughter cells. (G) Dry mass grows more exponentially than linearly. The residuals (bottom) of an exponential fit (red) to mass growth (D) were much smaller than a linear fit (blue). See also Figure 2—figure supplement 3A.
-
Figure 2—source data 1
Source Data for Figure 2 on density measurements during the cell cycle.
- https://cdn.elifesciences.org/articles/64901/elife-64901-fig2-data1-v2.xlsx
Figure 2—figure supplement 1

Measurements of buoyant density and buoyant mass using SMR and refractive index measurements using holography and QPI show cell-cycle-dependent density variations.
(A) QPI-based dry-mass density measurements of individual cells showed similar variation throughout the cell cycle as the population (Figure 2C). (B) Replicate SMR experiment for data in Figure 2E. Medium-sized cells exhibited lower buoyant density than small and large cells, similar to QPI measurements (Figure 2C). Boxes indicate 25th and 75th percentiles and horizontal line indicates the median. Whiskers indicate the most extreme datapoints not considered outliers. (C) Distribution of the volumes of cells in each bin of the buoyant density measurements in (B). Each bin contains 29 cells sorted by volume. (D) Representative holographic images of cells at an early, middle, and late stage in the cell cycle. (E) Mean refractive index was calculated from holographic images of non-septated cells (blue) and septated cells (red). The negative correlation (Pearson’s correlation coefficient) of refractive index with non-septated cells (dashed line) indicates that refractive index decreases with increasing cell length.
-
Figure 2—figure supplement 1—source data 1
Source Data for Figure 2E and Figure 2—figure supplement 1 on buoyant density measurements.
- https://cdn.elifesciences.org/articles/64901/elife-64901-fig2-figsupp1-data1-v2.xlsx
Figure 2—figure supplement 2
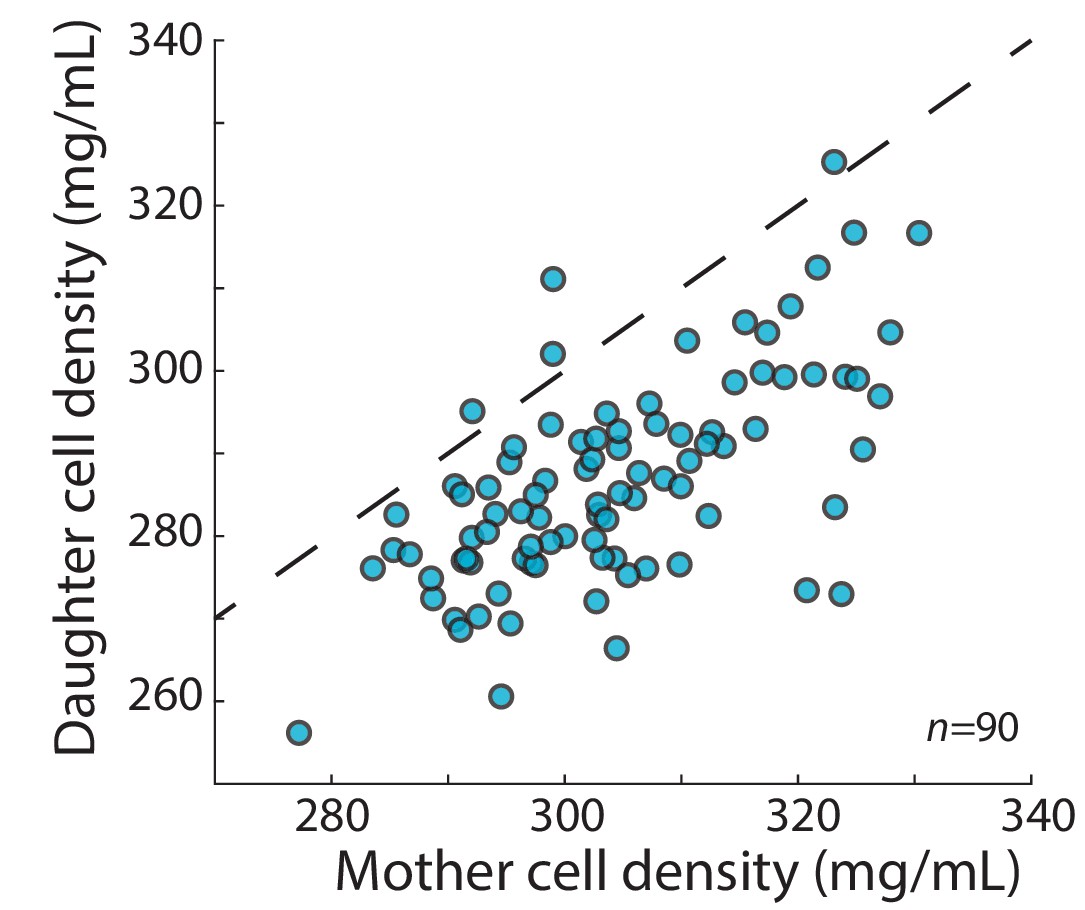
The mean density of S. pombe daughter cells was typically lower than the density of the mother cell.
The densities of the mother cell and the associated daughter cells were measured from consecutive QPI density maps (5 min apart) directly before and after cell division, respectively. The daughter cell densities were then averaged. In most cases, the newly born daughter cells were less dense than the mother cell 5 min beforehand. Dashed line indicates y = x.
-
Figure 2—figure supplement 2—source data 1
Source Data for Figure 2F and Figure 2—figure supplement 2 on mother/daughter density differences.
- https://cdn.elifesciences.org/articles/64901/elife-64901-fig2-figsupp2-data1-v2.xlsx
Figure 2—figure supplement 3
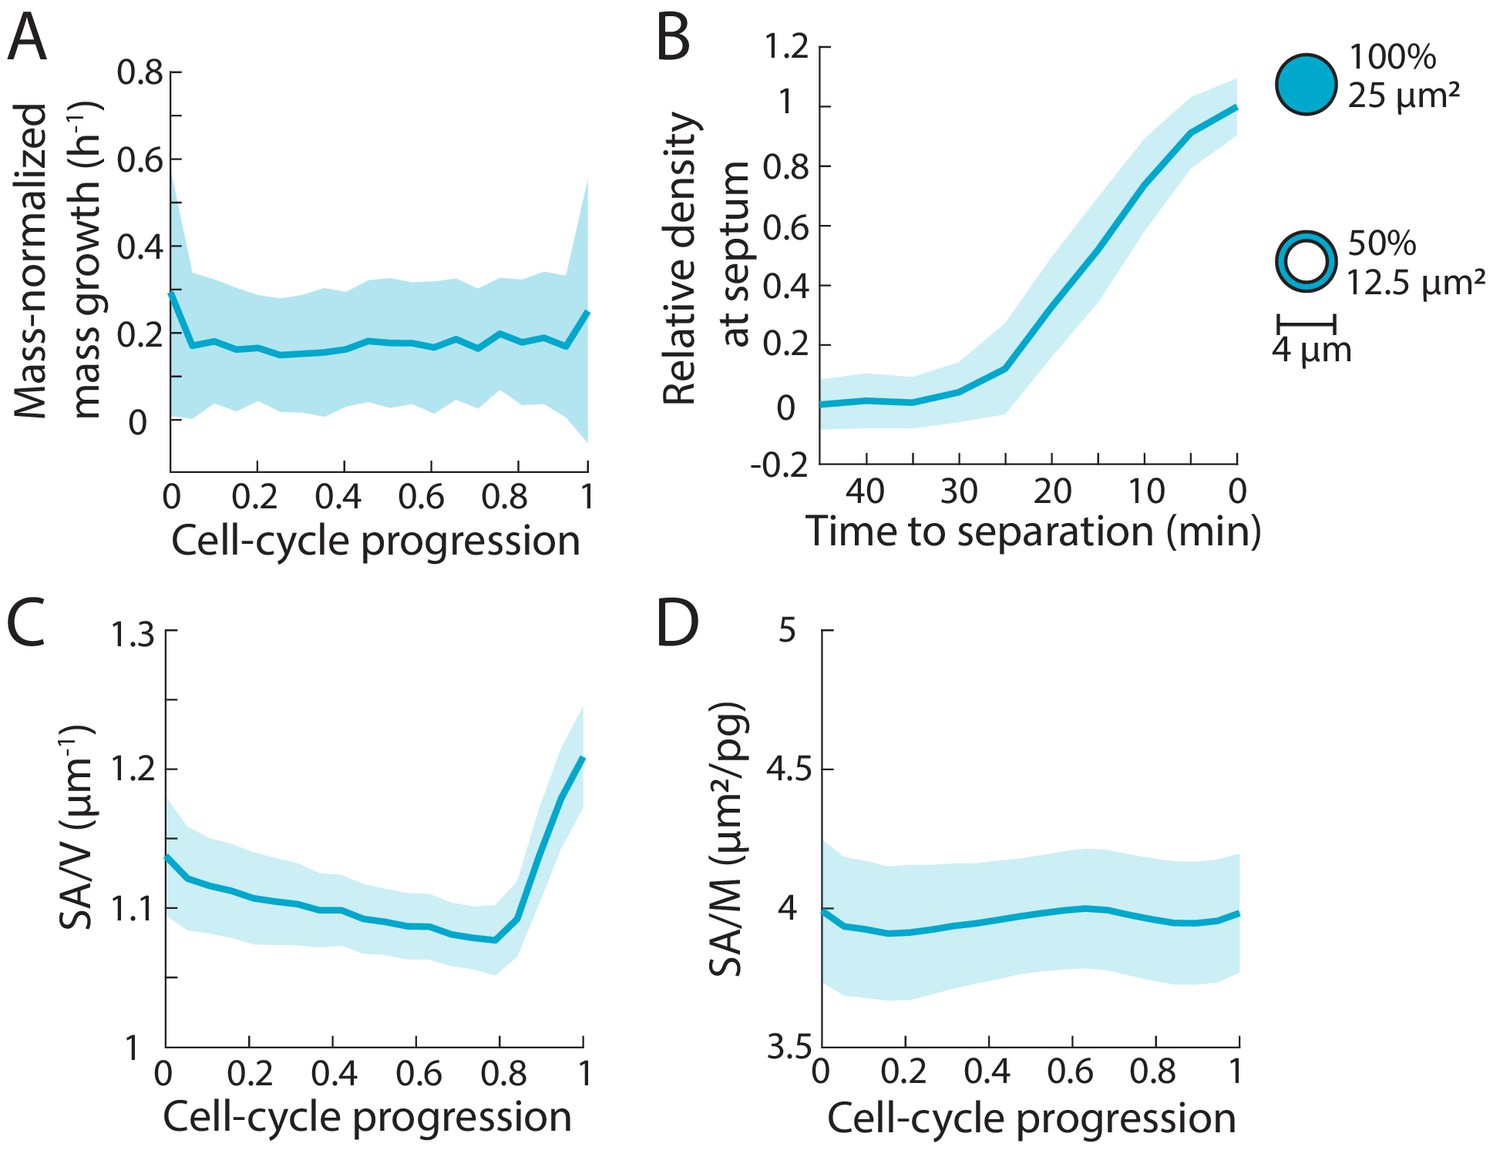
Cellular surface area-to-mass ratio varies less than dry-mass density during the S. pombe cell cycle.
(A) Mass increases exponentially throughout the cell cycle, as evidenced by the constant rate of normalized growth (1/M dM/dt). The dry mass of individual cells was measured as in Figure 2. Larger cells added more mass per unit time, a characteristic of exponential mass growth. Curves are mean values and shaded regions represent one standard deviation (n = 78 cells). (B) To measure surface area, we took into account the surface area added at the septum during cytokinesis. The dimensions of the growing septum were measured from the QPI images, and the surface area of the septum was calculated by assuming a double-layered structure with a diameter of 4 µm. Curves are mean values and shaded regions represent one standard deviation (n = 78 cells). (C) Surface area to volume (SA/V) ratio increased at the end of the cell cycle, as volume growth slowed and surface area increased due to septum formation. Curves are mean values and shaded regions represent one standard deviation (n = 78 cells). (D) Surface area to mass (SA/M) ratio varied by only ~5%. Curves are mean values and shaded regions represent one standard deviation (n = 78 cells). Thus, SA/M shows less variation than the ratio of volume to mass (the inverse of density).
-
Figure 2—figure supplement 3—source data 1
Source Data for Figure 2—figure supplement 3B on septum area calculation.
- https://cdn.elifesciences.org/articles/64901/elife-64901-fig2-figsupp3-data1-v2.xlsx
-
Figure 2—figure supplement 3—source data 2
Source Data for Figure 2 and Figure 2—figure supplement 3 on volume, mass, and area relationships.
- https://cdn.elifesciences.org/articles/64901/elife-64901-fig2-figsupp3-data2-v2.xlsx
Figure 2—video 1
QPI density maps of wild-type fission yeast cells.
Wild-type fission yeast cells growing and dividing in exponential phase in rich media were imaged every 5 min in a microfluidic chamber as described in Figure 2A. Phase-shift maps were extracted by QPI. Periodic additions of 100 mg/mL BSA to the medium were included for calibration purposes.
Figure 3
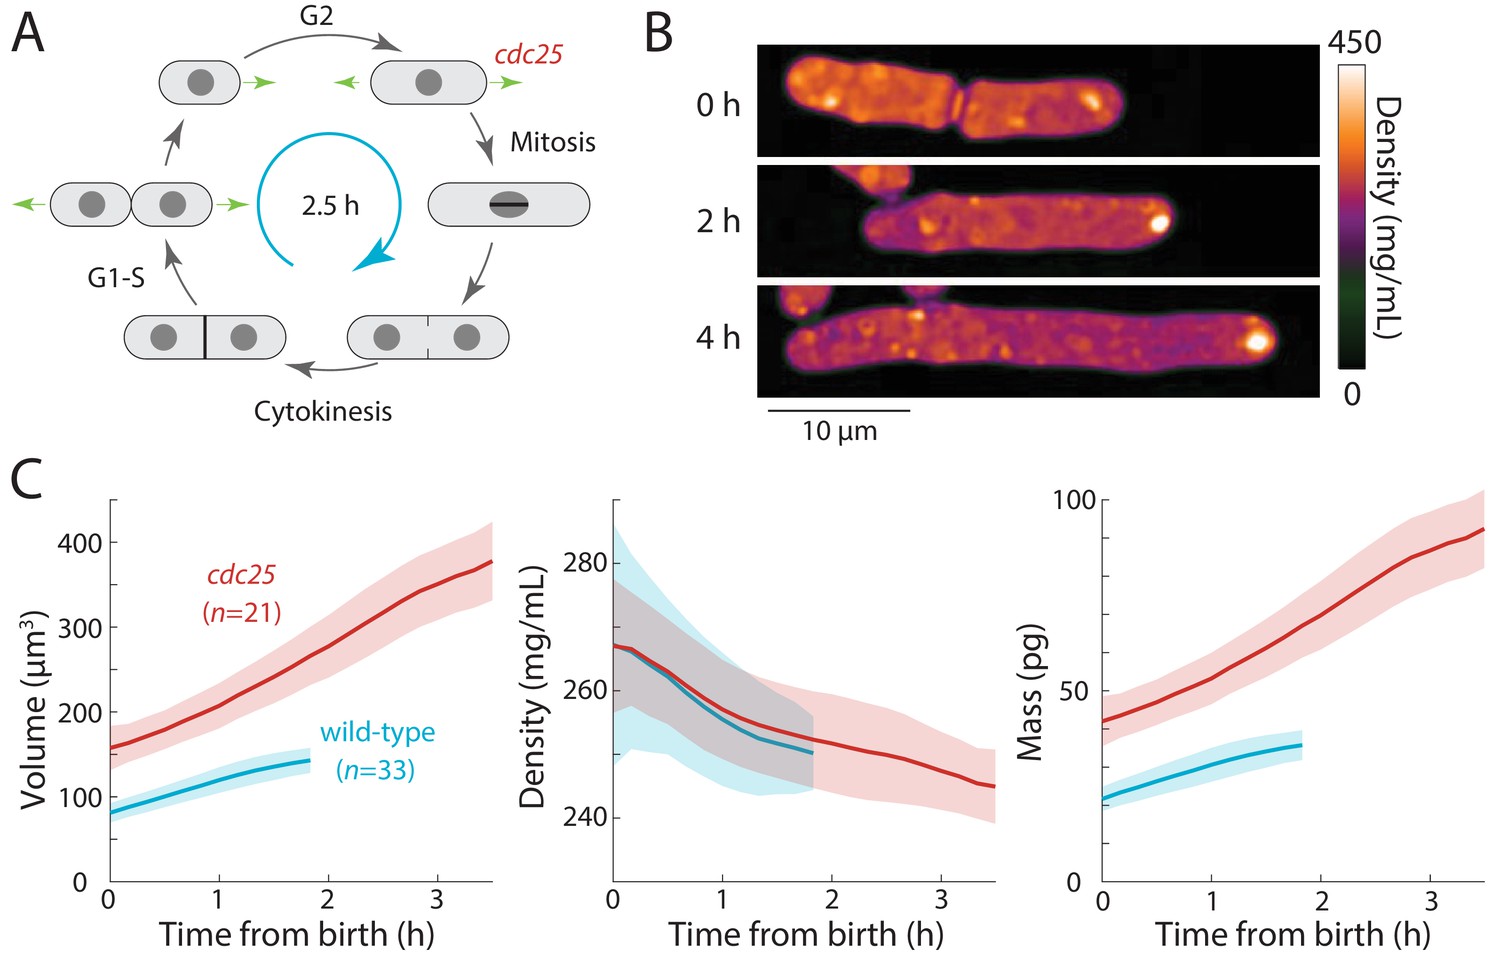
Extension of the G2 phase of the S. pombe cell cycle results in cell elongation and decreased intracellular density.
(A) Schematic of the fission yeast cell cycle, highlighting the point at which the cdc25 temperature-sensitive mutant delays the G2-M transition. (B) cdc25-22 cells were shifted from the permissive temperature 25°C to the semi-permissive temperature 32°C to extend G2 phase, leading to continued cell elongation. QPI density maps of a representative cell are shown. Note that density decreased during cell elongation. (C) QPI-based measurements of volume (left), density (middle), and dry mass (right) of cdc25-22 cells (red) that grew at least 2.5-fold relative to their birth length before dividing, compared with wild-type cells (blue) under the same conditions. Measurements are aligned from cell birth until elongation rate decreased to 20 nm/min (as an indication of the transition to mitosis). Curves are mean values and shaded regions represent one standard deviation.
-
Figure 3—source data 1
Source Data for Figure 3 on cdc25 mutant experiment.
- https://cdn.elifesciences.org/articles/64901/elife-64901-fig3-data1-v2.xlsx
Figure 4
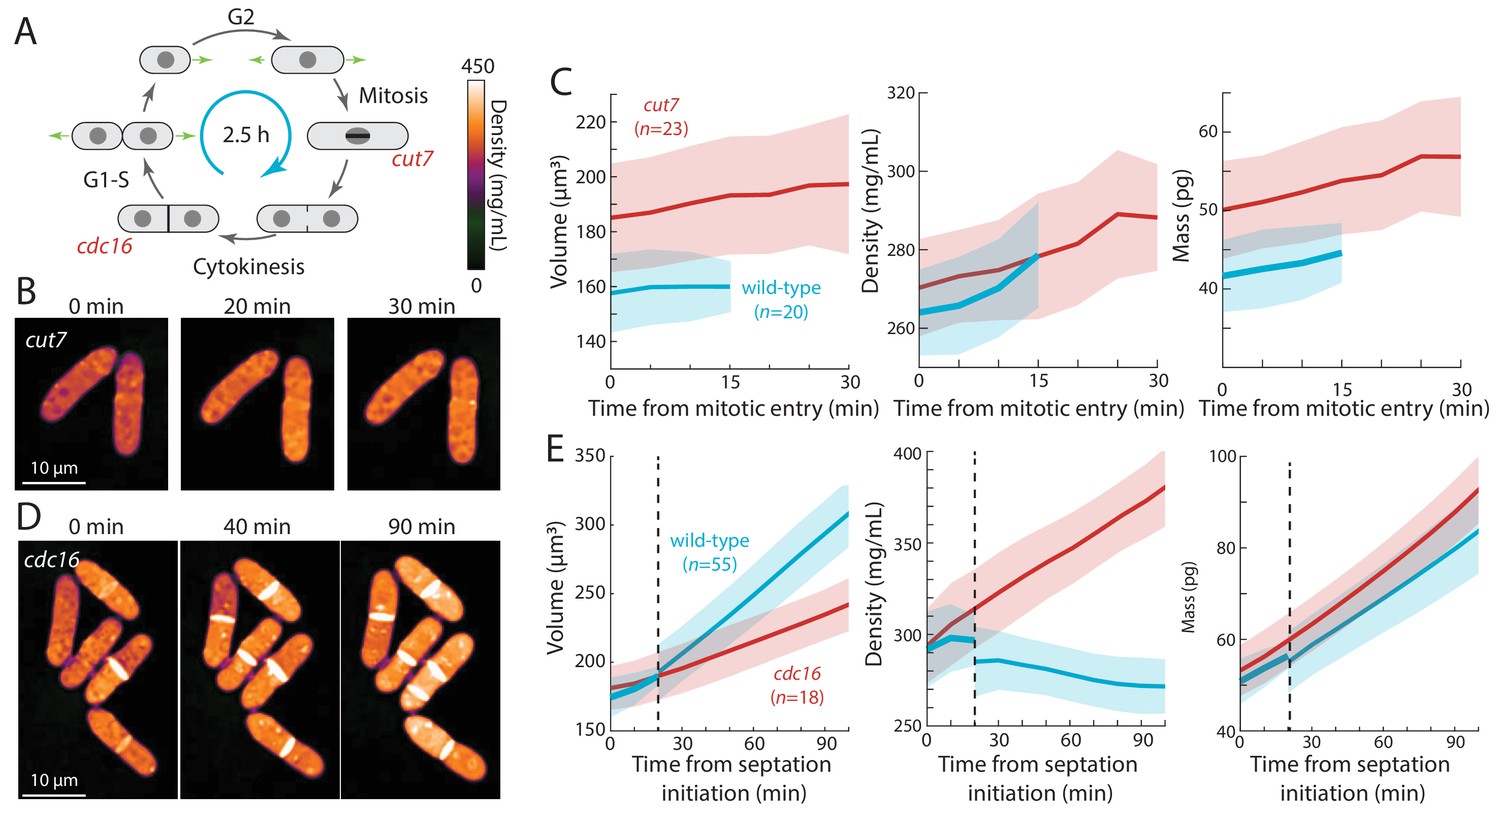
Cell-cycle arrests in mitosis and cytokinesis result in increased intracellular density in S. pombe.
(A) Temperature-sensitive mutants cut7-446 (spindle kinesin-5) and cdc16-116 block the cell cycle in mitosis and cytokinesis, respectively. (B) cut7-446 cells were shifted from 25°C to 30°C to delay mitotic progression. QPI of two representative cells delayed in mitosis for ~20 min until the onset of septation (30 min time point). Note that density continued to increase during mitotic arrest. (C) QPI-based measurements of volume (left), density (middle), and dry mass (right) of cut7-446 cells from mitotic entry (t = 0) through initiation of septum formation at cytokinesis. Curves are mean values and shaded regions represent one standard deviation. (D) cdc16-116 cells were shifted from 25°C to 34°C to arrest cells in cytokinesis. QPI of five representative cells are shown. cdc16 cells generally did not complete cell separation and often assembled additional septa without elongating. Note that density increased during this cytokinetic arrest. (E) QPI-based measurements of volume (left), density (middle), and dry mass (right) of cdc16-116 cells from initiation of the first septum (t = 0). Wild-type cells separated after ~20 min (dashed line), and thereafter the behavior of the daughter cells was tracked for comparison with cdc16 cells (volume and dry mass were summed for the two daughter cells). Curves are mean values and shaded regions represent one standard deviation.
-
Figure 4—source data 1
Source Data for Figure 4 on cdc7 and cdc16 mutant experiment.
- https://cdn.elifesciences.org/articles/64901/elife-64901-fig4-data1-v2.xlsx
Figure 5 with 1 supplement
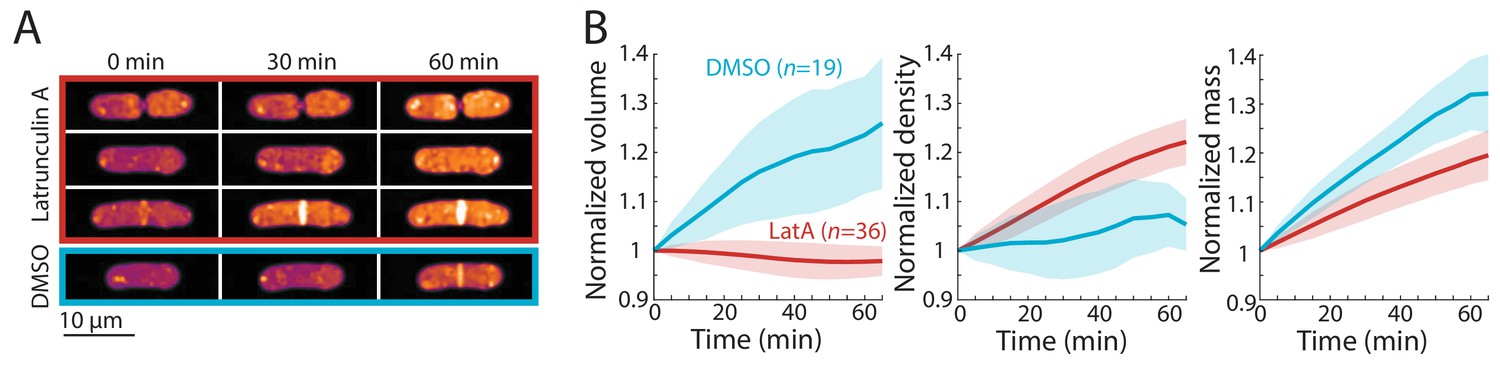
Cell-cycle-independent growth inhibition by latrunculin A results in increased intracellular density in S. pombe.
(A) Latrunculin A treatment inhibited cell growth and increased intracellular density regardless of cell-cycle stage. Representative QPI density maps of three wild-type cells at different points of the cell cycle treated with 200 μM latrunculin A for the indicated times. As a control, cells were treated with 1% DMSO; growth continued and density remained relatively constant. (B) QPI-based volume (left), density (middle), and dry mass (right) measurements of latrunculin A (LatA)-treated or DMSO-treated wild-type cells from the start of treatment (t = 0). Growth halted and density increased due to continued mass synthesis during treatment. Note that the average density in the DMSO control rose slightly due to the removal of cells within the asynchronous population from analysis after cell division. Curves are mean values and shaded regions represent one standard deviation.
-
Figure 5—source data 1
Source Data for Figure 5 on effect of latrunculin A treatment on intracellular density.
- https://cdn.elifesciences.org/articles/64901/elife-64901-fig5-data1-v2.xlsx
Figure 5—figure supplement 1
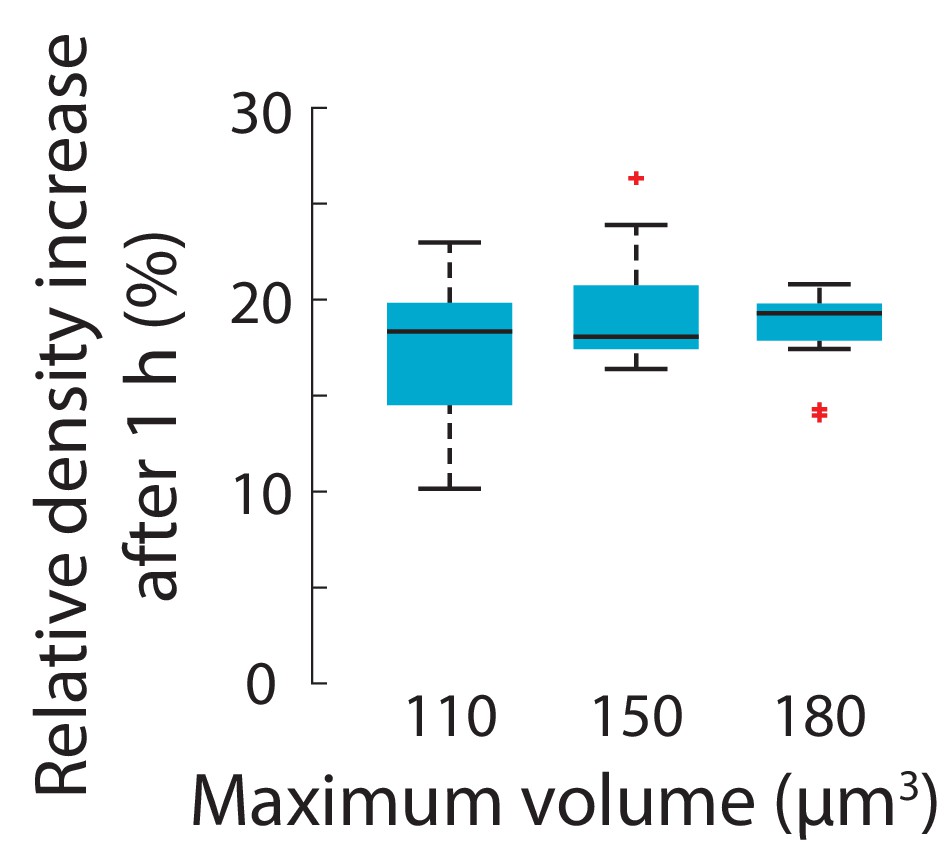
The increase in intracellular density due to treatment with the actin inhibitor latrunculin A is not dependent on cell size.
Wild-type S. pombe cells were treated with 0.2 mM latrunculin A for 1 hr and density maps were measured using QPI. Density increase over 1 hr normalized to mean density at the first time point was approximately invariant across initial cell sizes. Cells per bin, left to right: 10, 10, 12. Boxes indicate 25th and 75th percentiles and horizontal line indicates the median. Whiskers indicate the most extreme datapoints not considered outliers.
-
Figure 5—figure supplement 1—source data 1
Source Data for Figure 5—figure supplement 1 on latrunculin A effect on density of cells of different sizes.
- https://cdn.elifesciences.org/articles/64901/elife-64901-fig5-figsupp1-data1-v2.xlsx
Figure 6 with 2 supplements
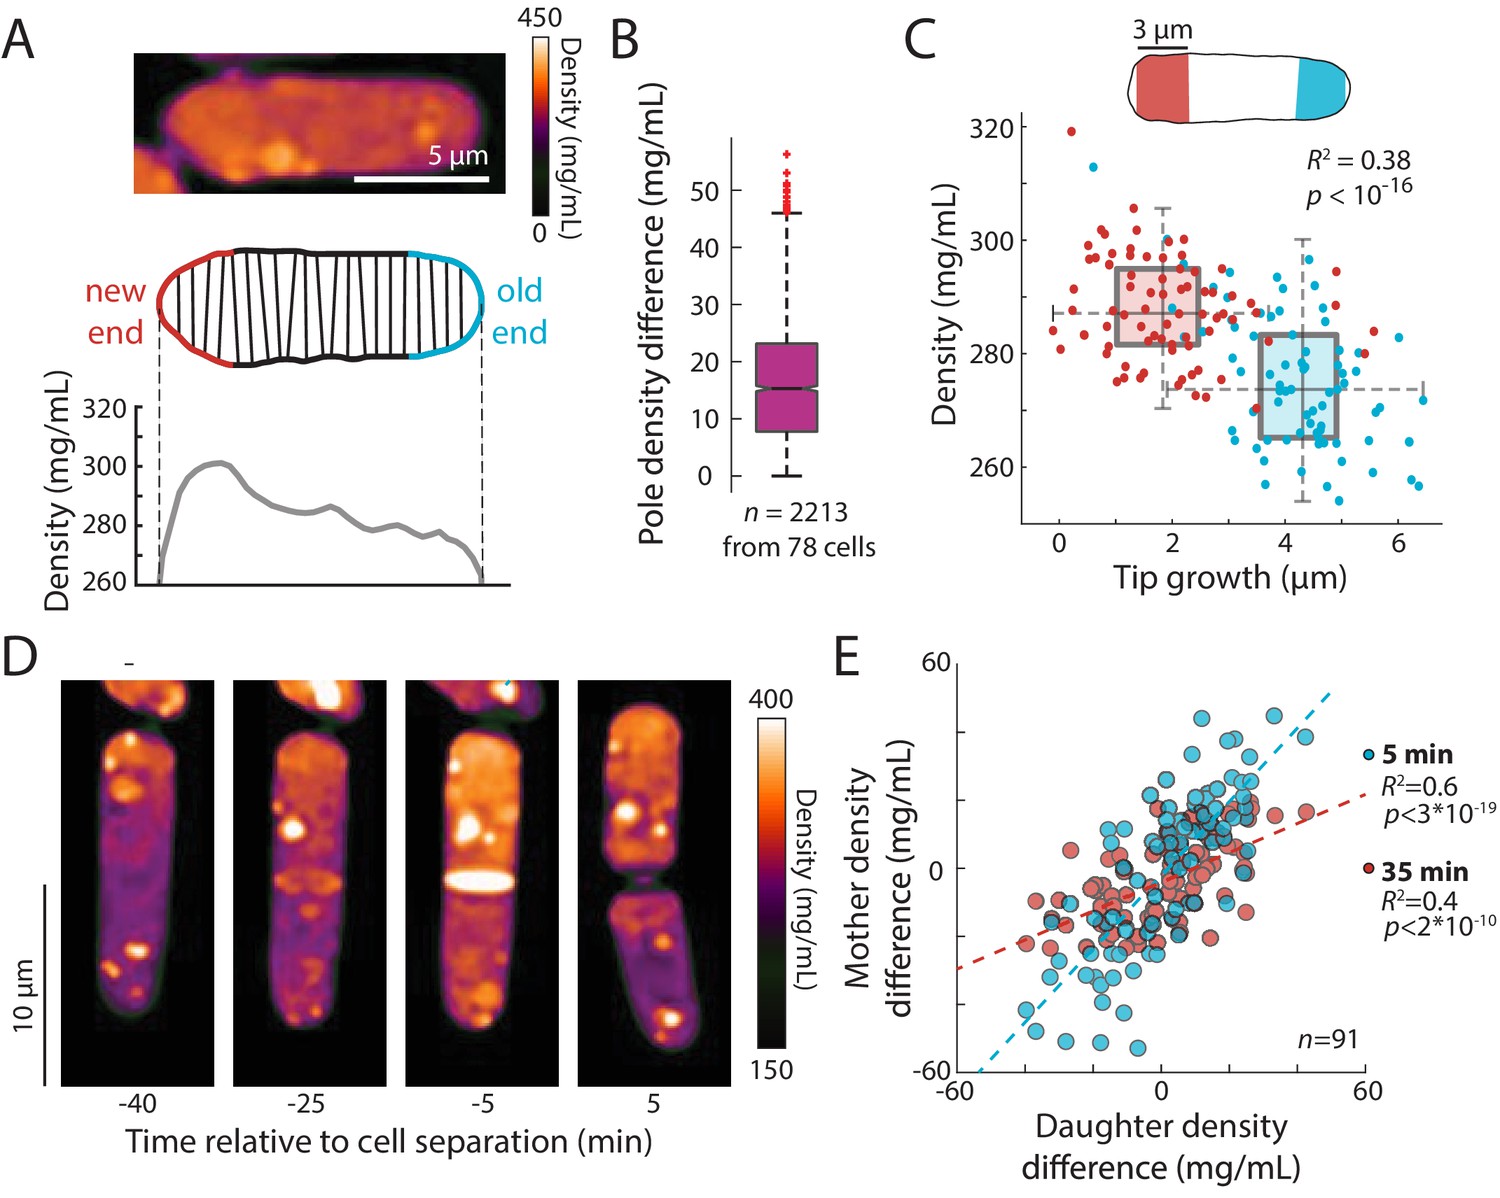
An intracellular density gradient negatively correlates with tip growth in S. pombe.
(A) Top: QPI of a representative cell displaying an intracellular gradient of density. Middle: Density was measured in slices perpendicular to the long axis. Bottom: The new end (non- or slowly growing) exhibited a higher density than the old (growing) end. (B) Density was substantially different between the new and old ends in many cells. Time-lapse QPI was used to measure the densities in regions within 3 µm of each cell end. Shown is the density difference between the cell poles averaged over the cell cycle. Box extends from 25th to 75th percentile, with the median as a horizontal bar. Whiskers indicate extreme points not considered outliers (n = 78 cells). (C) Mean density and amount of tip growth over an entire cell cycle was measured in 3 µm regions at the old (blue) and new (red) ends. Old ends grew more and exhibited lower mean densities over the course of the cell cycle than new ends. Box and whiskers plot is as described in (B). (D) QPI density map of a representative cell at interphase, the start of septum formation, late in septum formation, and after cell division. The gradient of intracellular density in the interphase cell was maintained over time and passed on to the daughter cells. (E) Asymmetric density patterns are propagated to the next cell cycle. The density difference between the two ends of a mother cell correlated with the density difference between the progeny daughter cells. Shown are Pearson’s correlation coefficient between the density difference of daughter cells and the corresponding halves of the mother cell at 5 min (blue) or 35 min (red) before cell division. The halves of the mother cell exhibited a larger range of density differences at the later time point, when they were more consistent with the density differences between daughter cells.
-
Figure 6—source data 1
Source Data for Figure 6 on density relationship to tip growth.
- https://cdn.elifesciences.org/articles/64901/elife-64901-fig6-data1-v2.xlsx
Figure 6—figure supplement 1
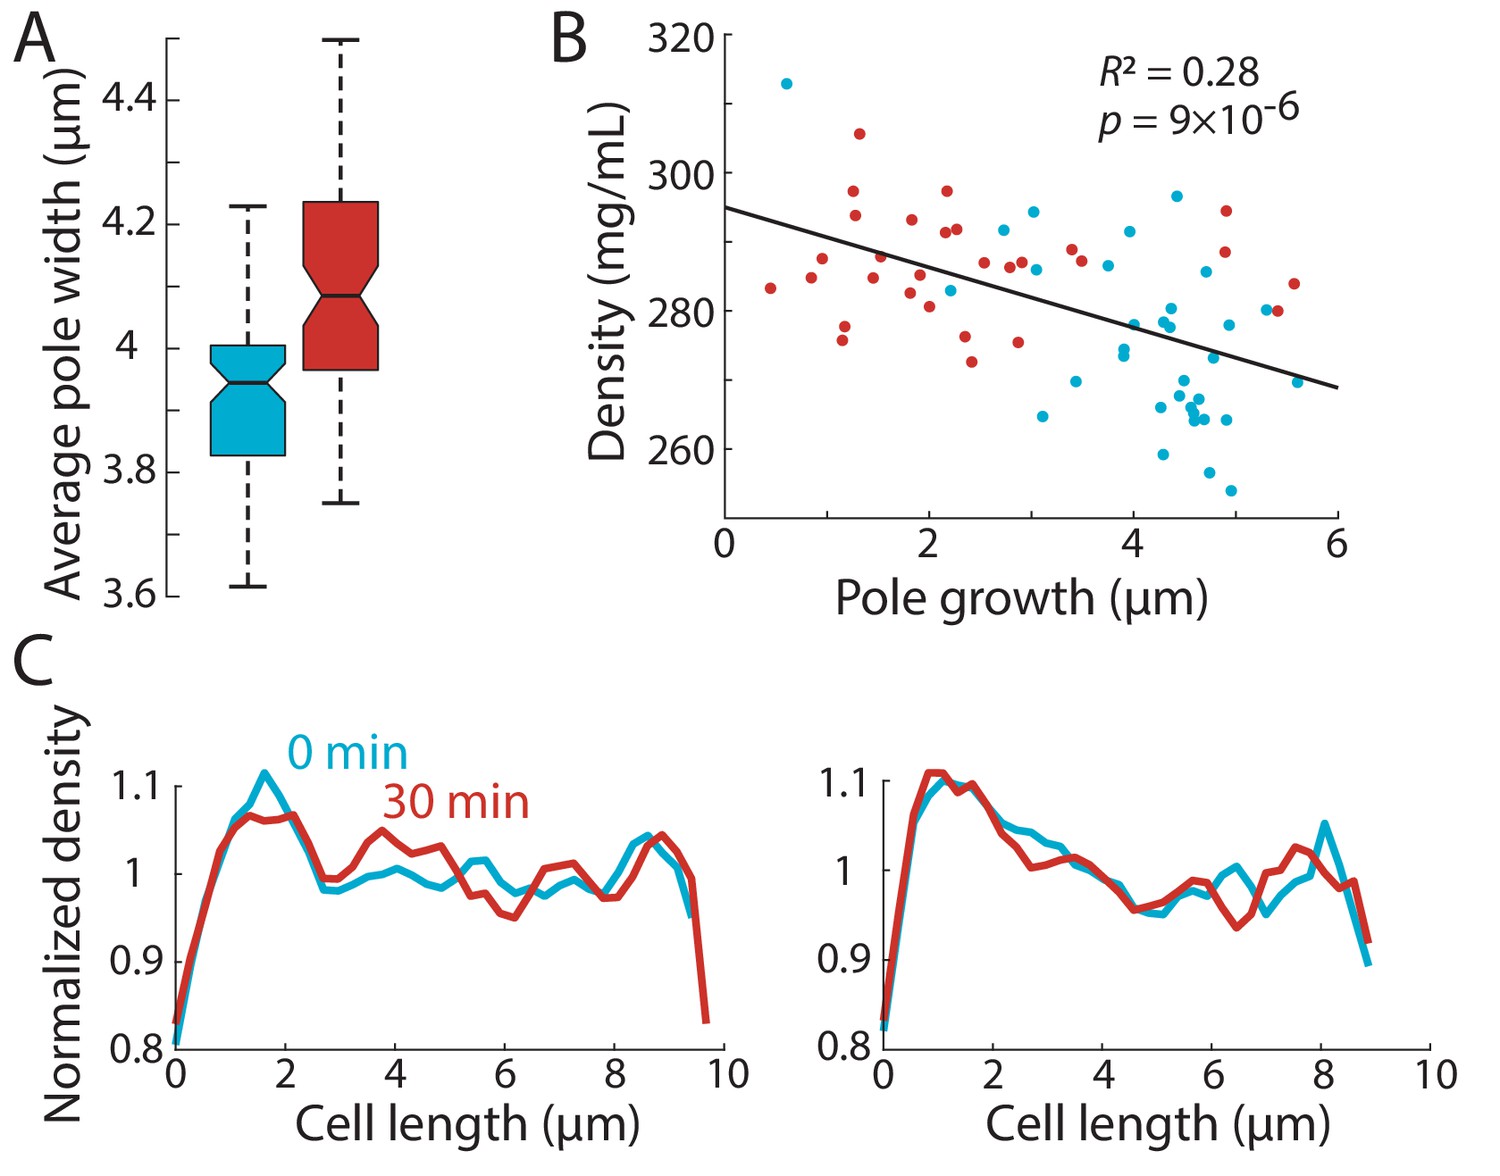
Spatial intracellular density gradients are present in cells with similar widths, and are stably maintained in cells treated with latrunculin A.
(A) The new cell end is wider than the old end. The mean width of the region 1.5–3 µm away from the cell pole was extracted for the new and old ends over time and averaged. The average old end width was ~0.15 µm smaller than that of new ends. Boxes indicate 25th and 75th percentiles and horizontal line indicates the median. (B) To address a caveat that differences in QPI density maps may arise from differences in cellular height, we restricted our measurements of average pole density to poles with similar widths (between 3.9 and 4.1 µm, corresponding to the medians in (A)). Tip growth through the cell cycle and average density at the ends were plotted as in Figure 3C. The negative correlation (Pearson’s correlation coefficient) between pole growth and density observed in Figure 3B persisted, suggesting that the difference in measured density between poles is not due to differences in sample height. (C) The density gradient was stable in latrunculin A-treated cells. Cells were treated with latrunculin A and imaged using QPI as in Figure 5. Normalized QPI density plots along the long axis of two individual cells before and 30 min after treatment with latrunculin A. The density gradient was maintained in the absence of F-actin and tip growth.
-
Figure 6—figure supplement 1—source data 1
Source Data for Figure 6—figure supplement 1A on density gradient.
- https://cdn.elifesciences.org/articles/64901/elife-64901-fig6-figsupp1-data1-v2.xlsx
Figure 6—figure supplement 2
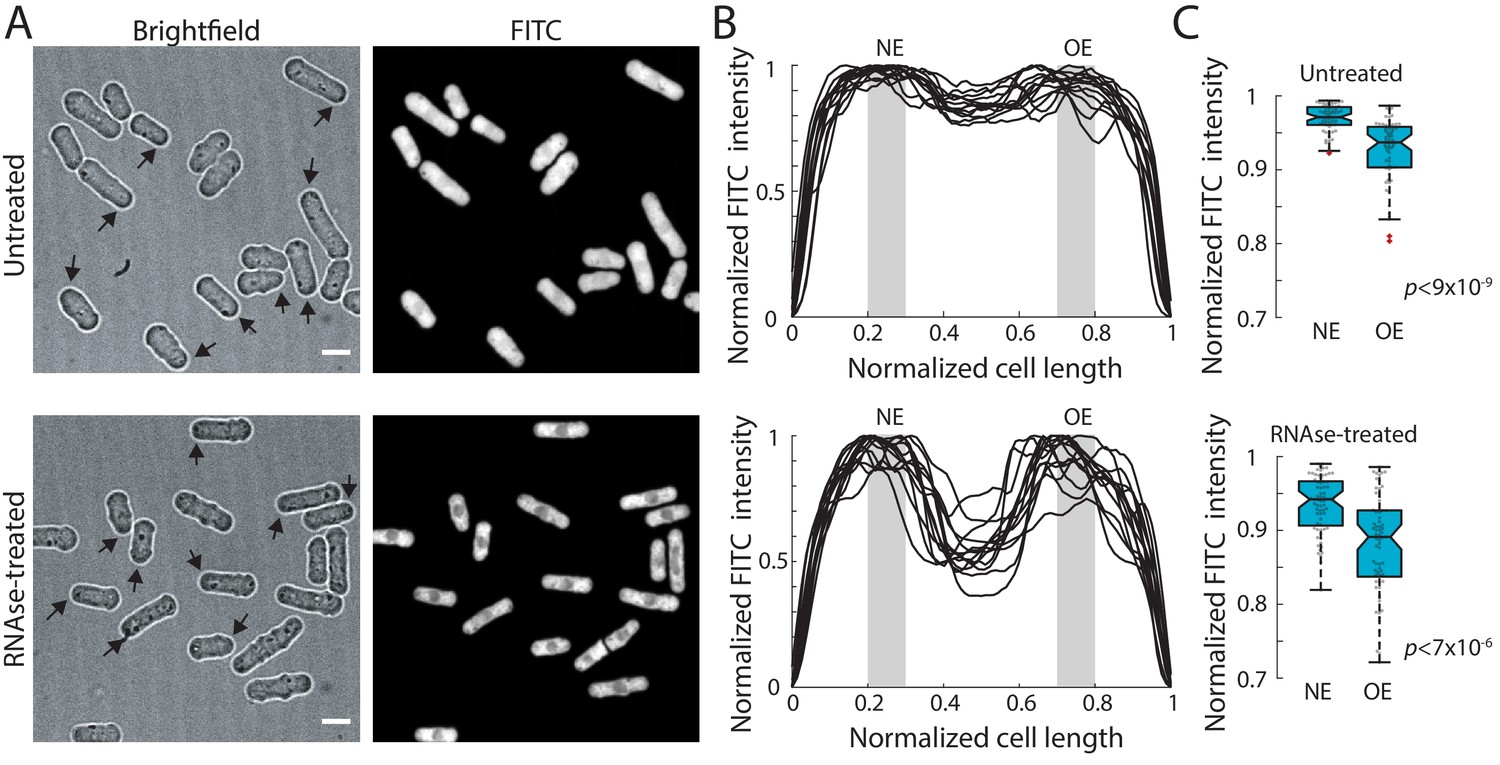
Total protein and RNA exhibit intracellular spatial gradients.
(A) Cells were fixed and stained with FITC, a dye that stains total protein and RNA (Materials and methods). RNAse treatment removed the RNA staining, revealing the distribution of total protein. Panel shows bright-field (left) and mid-focal plane confocal images (right) of FITC-stained untreated (top) or RNAse-treated cells (bottom). Arrows in the bright-field images indicate the old end (OE) of monopolar cells selected for analysis. Scale bar: 5 µm. (B) Quantification of FITC intensity along the long axis of individual cells normalized by cell length. Intensities were normalized to the maximal value in each trace. Shown are line profiles for a representative subset of cells. Gray boxes depict the regions used to measure FITC signals corresponding to the new end (NE) and old end (OE). (C) The normalized FITC intensity is higher at the NE than at the OE in both untreated (top, n = 64 cells) and RNAse-treated cells (bottom, n = 69 cells). Results are summed intensities of three z-sections separated by 300 nm around the medial focal plane. Similarly significant differences were also observed using a single medial focal plane or summed z-planes spanning the whole cell (data not shown).
-
Figure 6—figure supplement 2—source data 1
Source Data for Figure 6—figure supplement 2 on FITC staining.
- https://cdn.elifesciences.org/articles/64901/elife-64901-fig6-figsupp2-data1-v2.xlsx
Figure 7 with 1 supplement
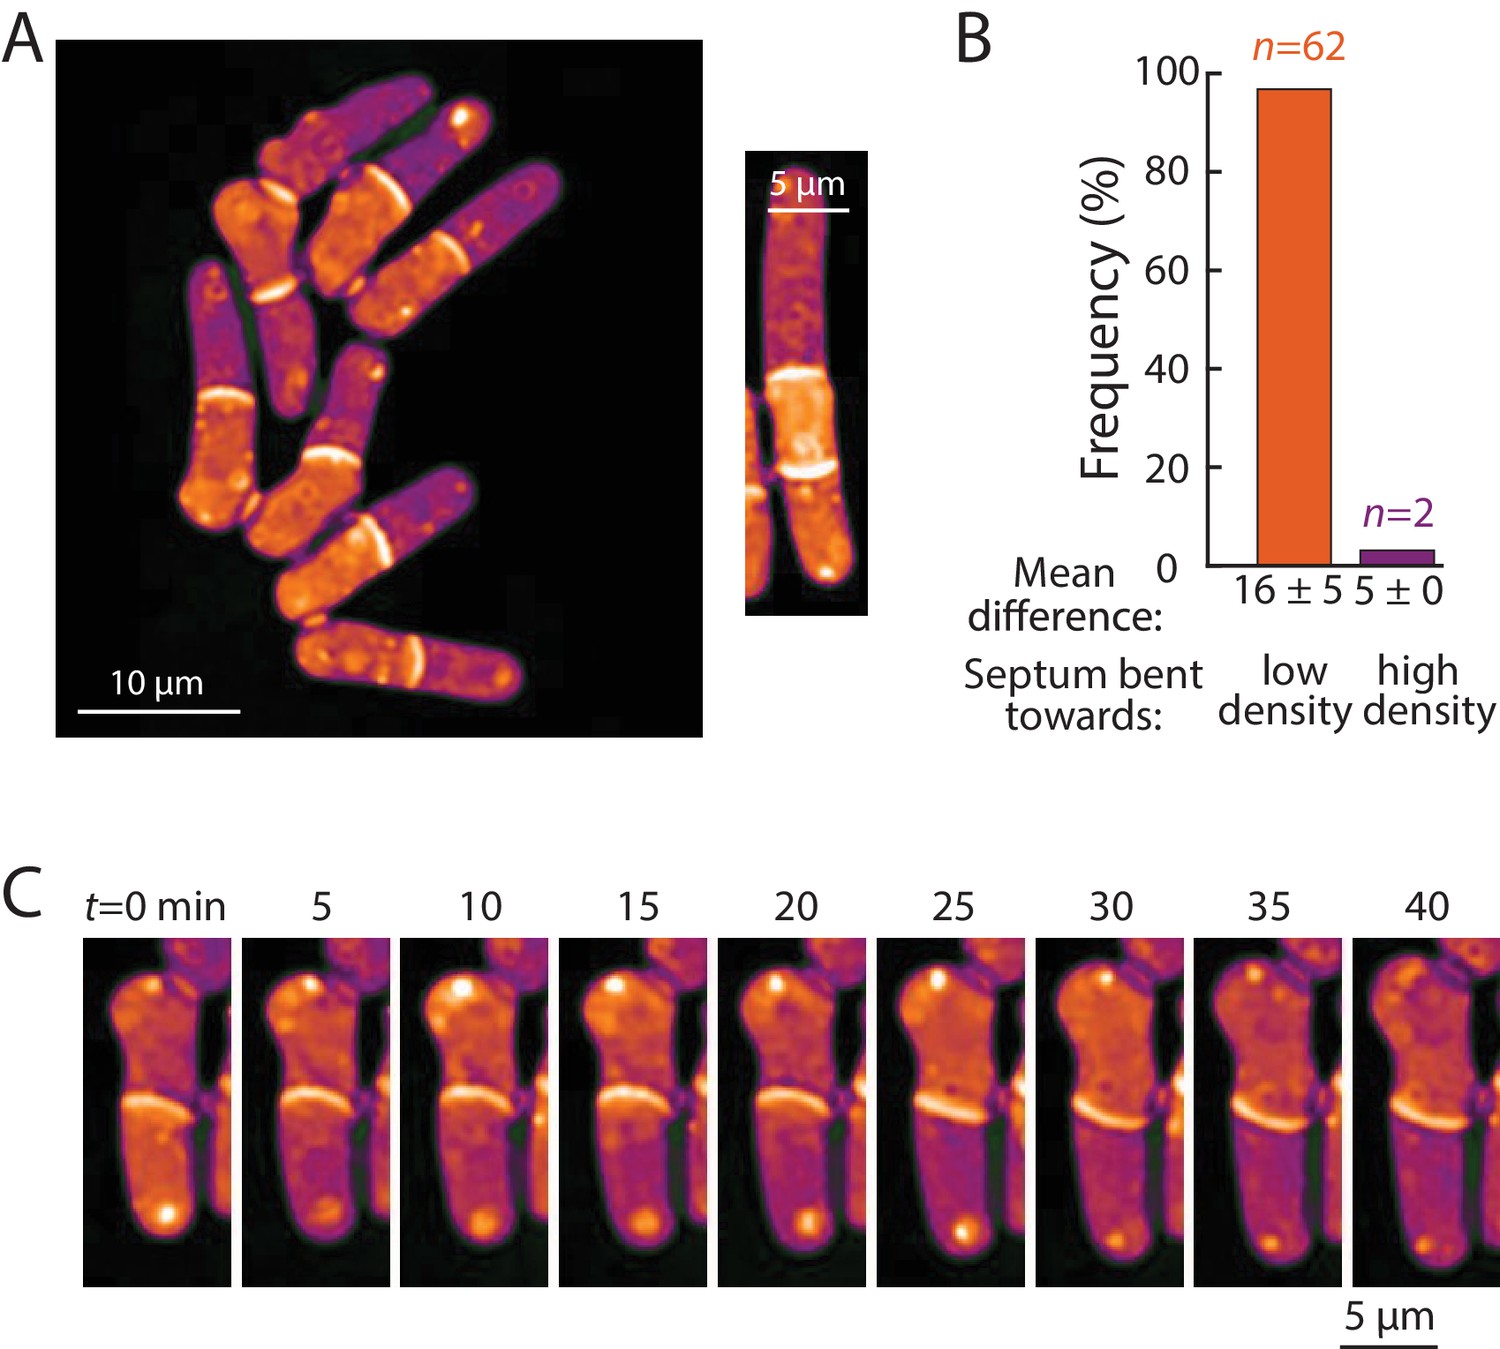
Bending of the septum reveals a link between intracellular density and osmotic pressure.
(A) Left: QPI density map of mid2∆ cells that are delayed in cell separation showed bent septa and density differences between two daughter-cell compartments. Note that the septa are bent away from the denser compartment in all cells in this image. Right: In multi-septated mid2∆ cells, internal compartments bounded by two septa exhibited higher density than the surrounding compartments; in these situations, both septa typically bent away from the higherdensity compartment. (B) The direction of septum bending was almost always toward the lower density daughter cell. The direction of the bent septum was measured at the time of maximum density difference between daughter-cell compartments. (C) An example of a cell in which the direction of septal bending and the sign of the density difference between daughter-cell compartments fluctuated over time. After the bottom compartment decreased and the top compartment increased in density, the septum bent in the opposite direction, consistent with the correlation between bending and density difference in (B).
Figure 7—figure supplement 1

Septa bend away from the compartment of higher density in mid2 and cdc16 mutant cells.
(A) QPI density maps of mid2∆ cells delayed in cell separation often exhibited differences in density between sister-cell compartments, and in most cases, the septum was bent away from the compartment of higher density. (B) QPI density map of cdc16 cells grown at 25°C and then imaged on a microscope pre-heated to 34°C; image shows t = 3 hr time point. These cells often exhibited an asymmetrically positioned septum, which formed a small cellular compartment that grew very little and increased in density and septum bending (arrows).
Tables
Key resources table
| Reagent type (species) or resource | Designation | Source or reference | Identifiers | Additional information |
|---|---|---|---|---|
| Strain, strain background (Schizosaccharomyces pombe) | Wild-type S. pombe | Other | FC15, h- wild-type strain 972 | Figures 1, 2, 3, 4, 5 and 6; Figure 1—figure supplement 1, Figure 2—figure supplement 1, Figure 2—figure supplement 2, Figure 2—figure supplement 3, Figure 5—figure supplement 1, Figure 6—figure supplement 1 FC lab collection; https://www.uniprot.org/taxonomy/284812 |
| Genetic reagent (S. pombe) | cdc25-22 mutant | Other | FC342, h-cdc25-22 | Figure 3; FC lab collection; https://www.pombase.org/genotype/cdc25-22-C532Y-amino_acid_mutation-expression-not_assayed |
| Genetic reagent (S. pombe) | cut7-446 mutant | Other | FC1455, h-cut7-446 leu1-32 | Figure 4; FC lab collection; https://www.pombase.org/genotype/cut7-446-I954T-amino_acid_mutation-expression-knockdown |
| Genetic reagent (S. pombe) | cdc16-116 mutant | Other | FC13, h-cdc16-116 | Figure 4; FC lab collection; https://www.pombase.org/genotype/cdc16-116-unknown-unknown-expression-not_assayed |
| Genetic reagent (S. pombe) | mid2 mutant | Other | FC881 h-mid2::kanMX ade6 leu1-32 ura4-D18 | Figure 7; FC lab collection; https://www.pombase.org/genotype/mid2delta |
| Genetic reagent (S. pombe) | gpd1 mutant | Other | FC3291, h-gpd1::hphMX6ade6-M216leu1-32 ura4-D18his3-D1 | Figure 6—figure supplement 2 FC lab collection |
| Peptide, recombinant protein | Bovine Serum Albumin | Sigma Aldrich | Cat. #: A3608 | |
| Peptide, recombinant protein | Lectin | Sigma Aldrich | Cat. #: L1395 | |
| Peptide, recombinant protein | RNAse | Thermo Scientific | Cat. #: EN0531 | |
| Chemical compound, drug | Latrunculin A | Abacam | Cat. #: ab144290 | |
| Chemical compound, drug | BODIPY 493/503 | Thermo Fisher | Cat. #: D3922 | |
| Chemical compound, drug | FITC | Sigma Aldrich | Cat. #: F7250 | |
| Chemical compound, drug | OptiPrep | Sigma Aldrich | Cat. #: D1556 | |
| Software, algorithm | Matlab | Mathworks | R2019a | |
| Software, algorithm | FIJI | https://imagej.net/Fiji/Downloads | v. 1.53c | |
| Software, algorithm | Algorithm to retrieve phase information | https://bitbucket.org/kchuanglab/quantitative-phase-imaging/src/master/ Bostan et al., 2016 | ||
| Software, algorithm | Morphometrics | SimTK: Morphometrics: Project Home Ursell et al., 2017 | ||
| Other | CellASIC Onix2 microfluidic control system | Merck | Cat. #: CAX2-S0000 | |
| Other | CellASIC ONIX microfluidic plates | Merck | Cat. #: Y04C-02-5PK | |
| Other | Optical filter | Chroma Technology | Cat. #: D680/3m |
Additional files
Download links
A two-part list of links to download the article, or parts of the article, in various formats.
Downloads (link to download the article as PDF)
Open citations (links to open the citations from this article in various online reference manager services)
Cite this article (links to download the citations from this article in formats compatible with various reference manager tools)
Variations of intracellular density during the cell cycle arise from tip-growth regulation in fission yeast
eLife 10:e64901.
https://doi.org/10.7554/eLife.64901


