Convalescent COVID-19 patients are susceptible to endothelial dysfunction due to persistent immune activation
- Lee Kong Chian School of Medicine, Nanyang Technological University, Singapore
- A*STAR ID Labs, Agency for Science, Technology and Research, Singapore
- Singapore Immunology Network, Agency for Science, Technology and Research, Singapore
- Department of Biological Sciences, National University of Singapore, Singapore
- National Centre for Infectious Diseases, Singapore
- Department of Infectious Diseases, Tan Tock Seng Hospital, Singapore
- Division of Clinical Microbiology, Department of Laboratory Medicine, Karolinska Institute, ANA Futura, Campus Flemingsberg, Sweden
- National Heart Centre Singapore, Singapore
- Duke-NUS Medical School, Singapore
- Department of Infectious Diseases, Changi General Hospital, Singapore
- Department of Medicine, National University Hospital, Singapore
- Yong Loo Lin School of Medicine, National University of Singapore, Singapore
- Institute of Molecular and Cell Biology, Agency for Science, Technology and Research, Singapore
Figures
Figure 1
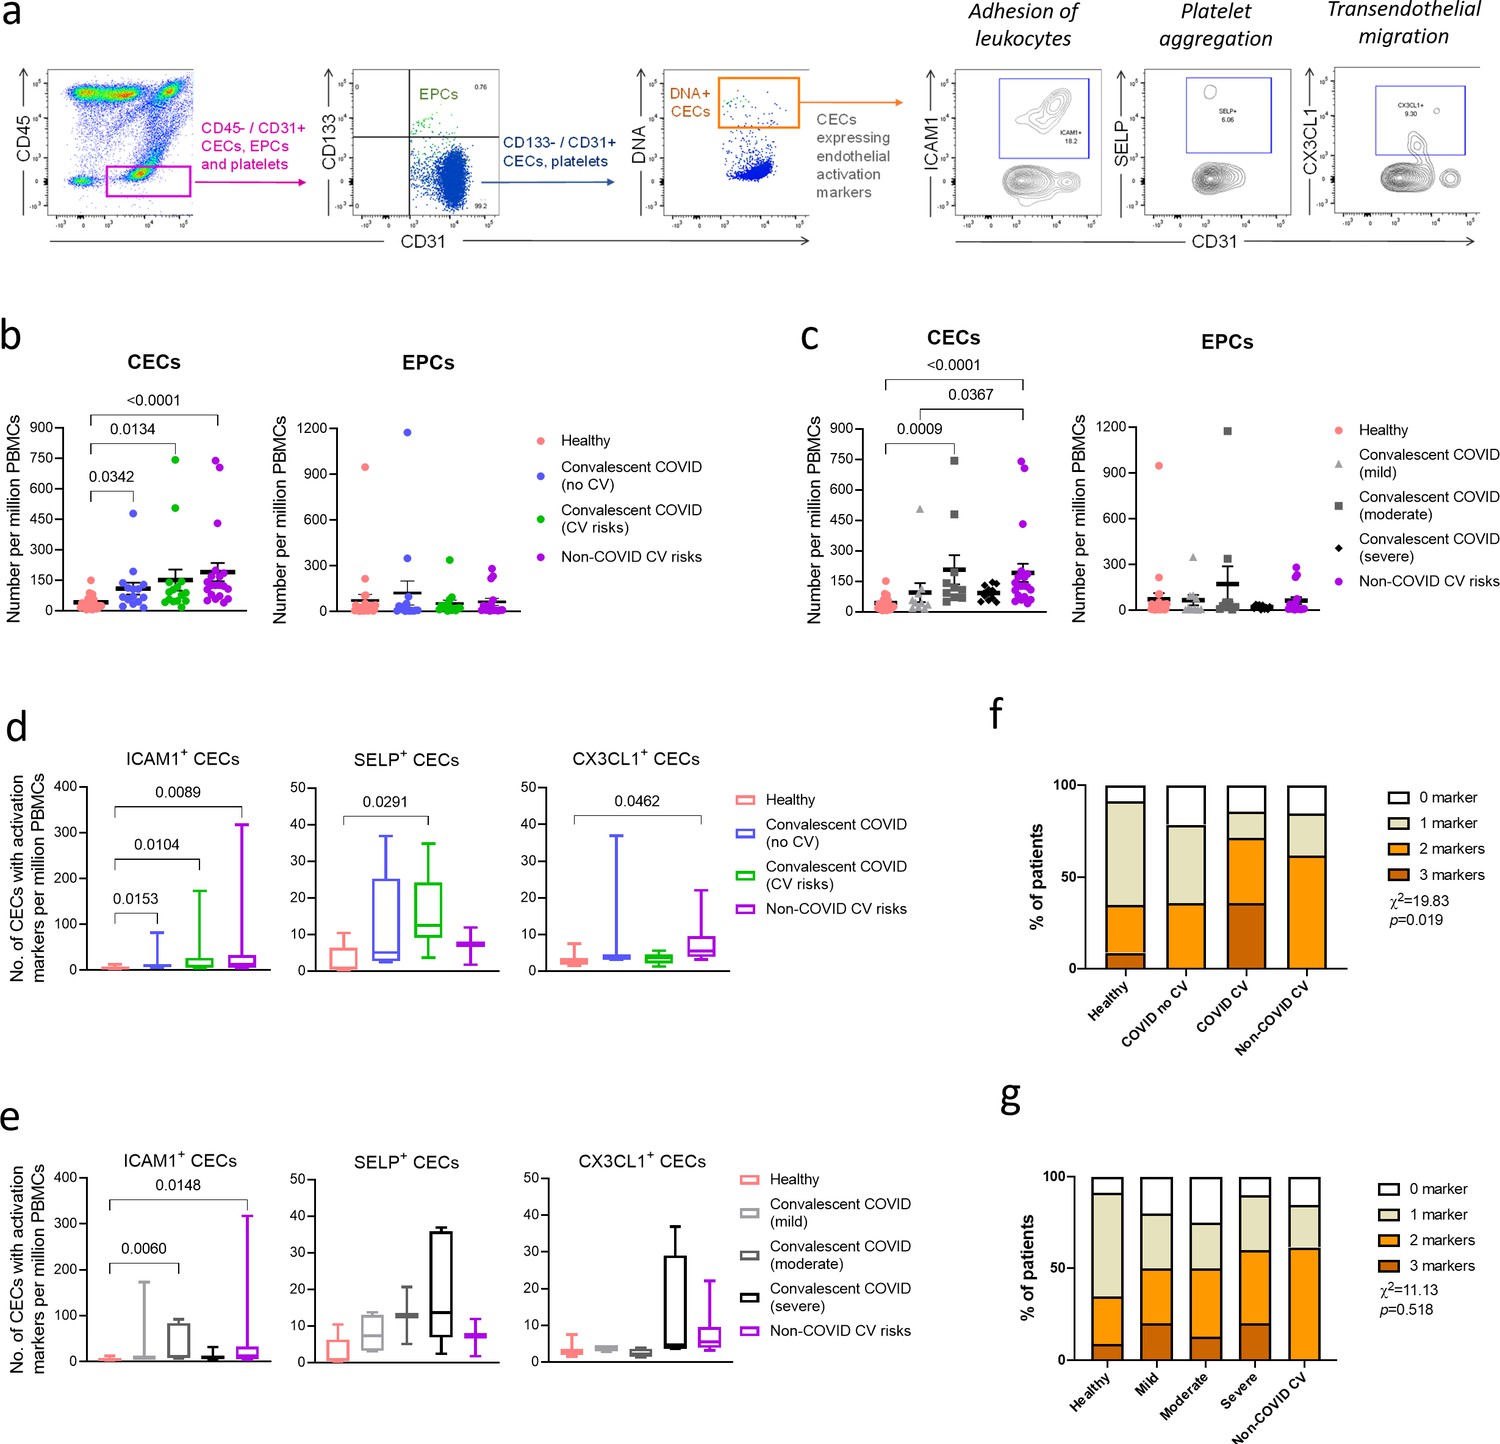
Enumeration and characterization of circulating endothelial cells (CECs) from COVID-19 convalescents (n = 30), non-COVID-19 patients (n = 20), and healthy participants (n = 24).
(a) Using flow cytometry, CEC populations were gated from peripheral blood mononuclear cells (PBMCs) using a strategy involving positive (nuclear stain and CD31) and negative (CD45 and CD133) markers before characterization with three separate markers of endothelial activation. (b) and (c) Scatterplot visualization of the number of CECs and endothelial progenitor cells (EPCs) per million PBMCs identified from each sample with mean and standard error of mean for each group shown. (d) and (e) Boxplots extending from 25th to 75th percentile with bar showing mean and whiskers indicating the minimum and maximum number of CECs per million PBMCs from each group staining positive for endothelial activation markers ICAM1, SELP, or CX3CL1. Kruskal—Wallis test was performed (b—e) to test for difference between the groups with Dunn’s multiple comparison test carried out for pairwise testing post hoc. (f) and (g) Cumulative analysis of patient frequency data of CECs staining positive for endothelial activation markers, ICAM1, SELP, and/or CX3CL1. Chi-squared goodness-of-fit test was performed to assess for difference in frequencies between the groups in (f) and (g).
Figure 2
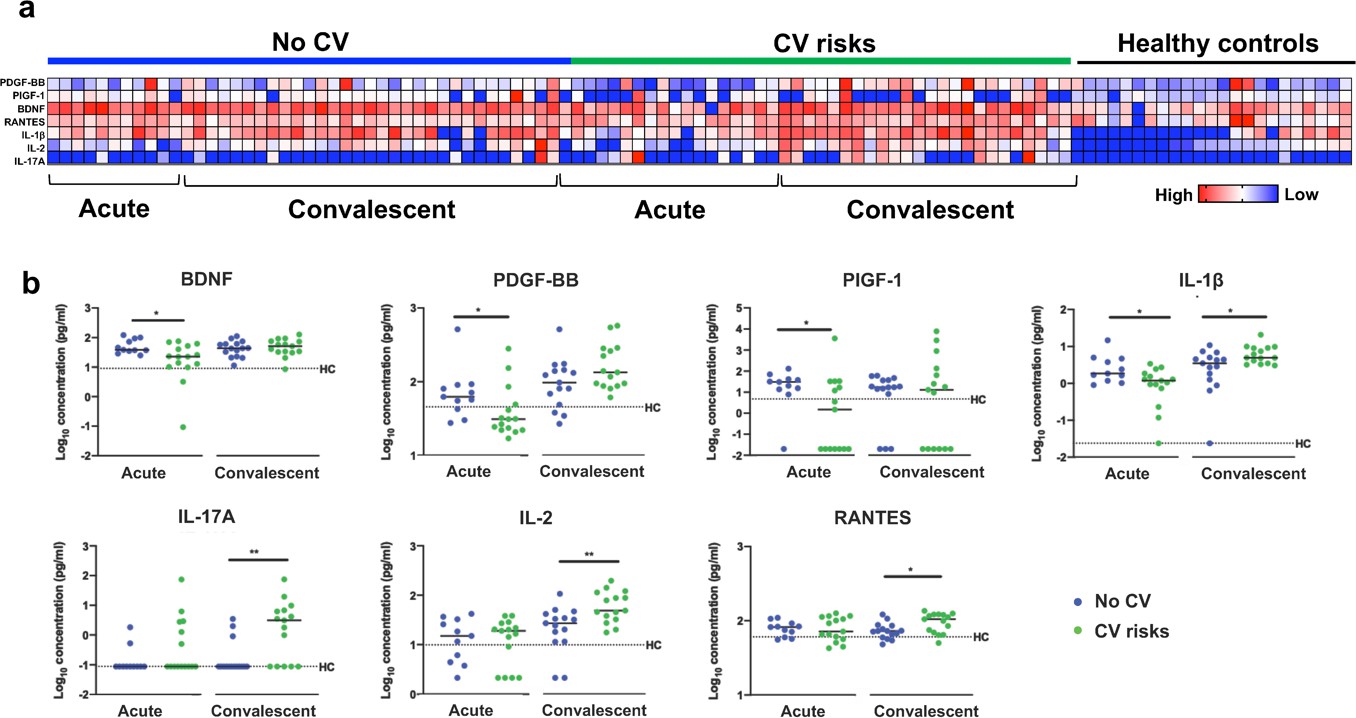
Plasma cytokine levels of COVID-19 patients with and without cardiovascular risk factors during the acute and convalescent phases of infection.
Concentrations of 45 immune mediators were quantified using a 45-plex microbead-based immunoassay. (a) Heatmap of immune mediator levels in plasma samples of patients with (n = 15) and without (n = 15) cardiovascular risk factors at both acute (median 10 days post-illness onset), convalescent (0—90 days post-hospital discharge) phases of SARS-CoV-2 infection, and non-COVID-19 healthy controls. Each color represents the relative concentration of a particular analyte. Blue and red indicate low and high concentrations, respectively. (b) Profiles of significant immune mediators of COVID-19 patients with and without cardiovascular risk factors during acute and convalescent phases are illustrated as scatter plots. Cytokine levels in plasma fraction samples from first collection time point during hospital admission (acute, median 10 days post-illness onset) and discharge (convalescent, median 7 days post-hospital discharge) were compared. Mann—Whitney U tests were performed on the logarithmically transformed concentration (*p<0.05; **p<0.01). Immune mediator levels for healthy control (n = 23) are indicated by the black dotted line. Patient samples with concentration out of measurement range are presented as the value of logarithm transformation of Limit of Quantification.
Figure 3
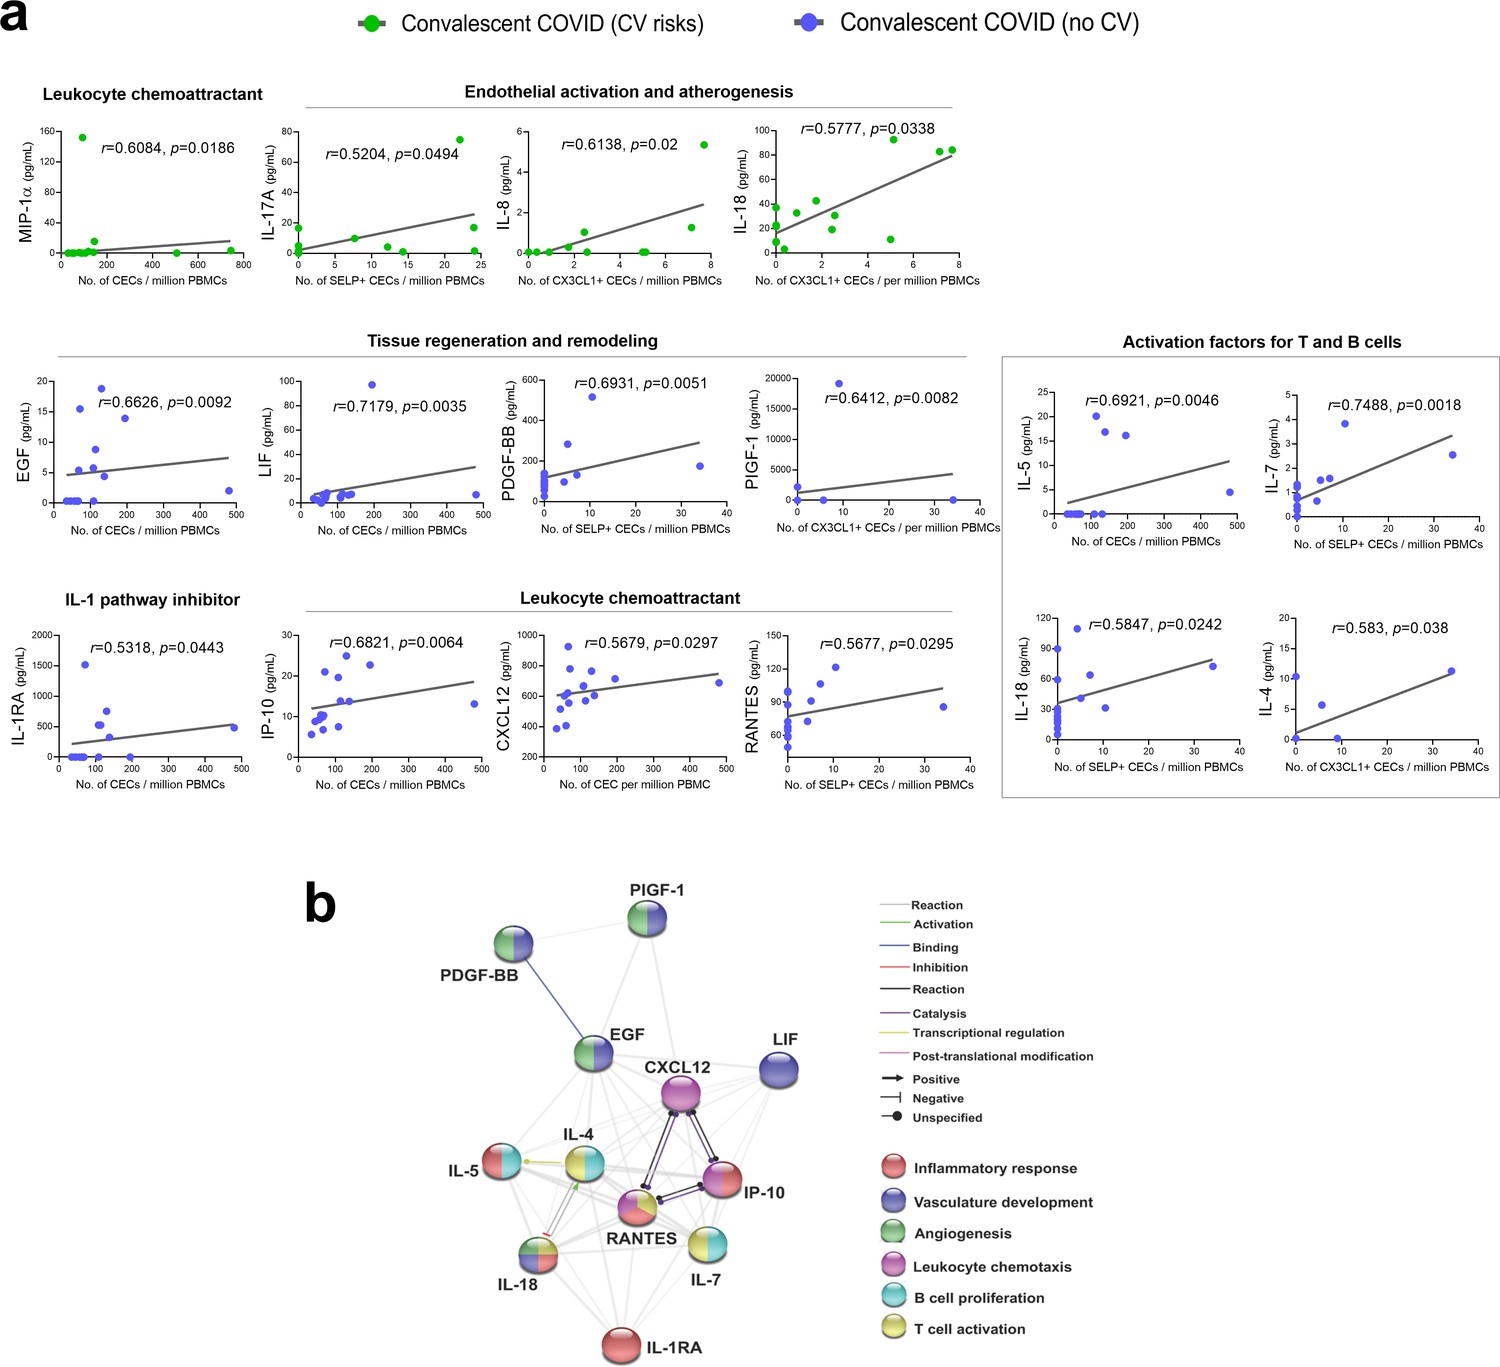
Significantly correlated cytokines with CEC attributes in COVID-19 convalescent patients.
(a) Spearman rank correlation coefficients were calculated to assess the associations between the level of cytokines and CEC attributes in terms of mean numbers of CECs, SELP+ CECs, or CX3CL1+ CECs. Spearman’s correlation coefficient r and p values (two-tailed test) were shown in plots. Source data relating to this figure is available. (b) Network analysis of CEC-associated cytokines in the convalescent COVID-19 patients without prior cardiovascular risk factors. Interactive relationships between the cytokines or chemokines were determined by Search Tool for the Retrieval of Interacting Genes/ Proteins (STRING) analysis, with a confidence threshold of 0.4.
-
Figure 3—source data 1
Significantly correlated cytokines with CEC attributes in COVID-19 convalescent patients.
Concentrations of cytokines (pg/ml) and CEC attributes in terms of mean numbers of CECs, SELP+ CECs or CX3CL1+ CECs per million PBMCs were used to calculate Spearman rank correlation coefficients shown in Figure 3.
- https://cdn.elifesciences.org/articles/64909/elife-64909-fig3-data1-v1.xlsx
Figure 4 with 1 supplement

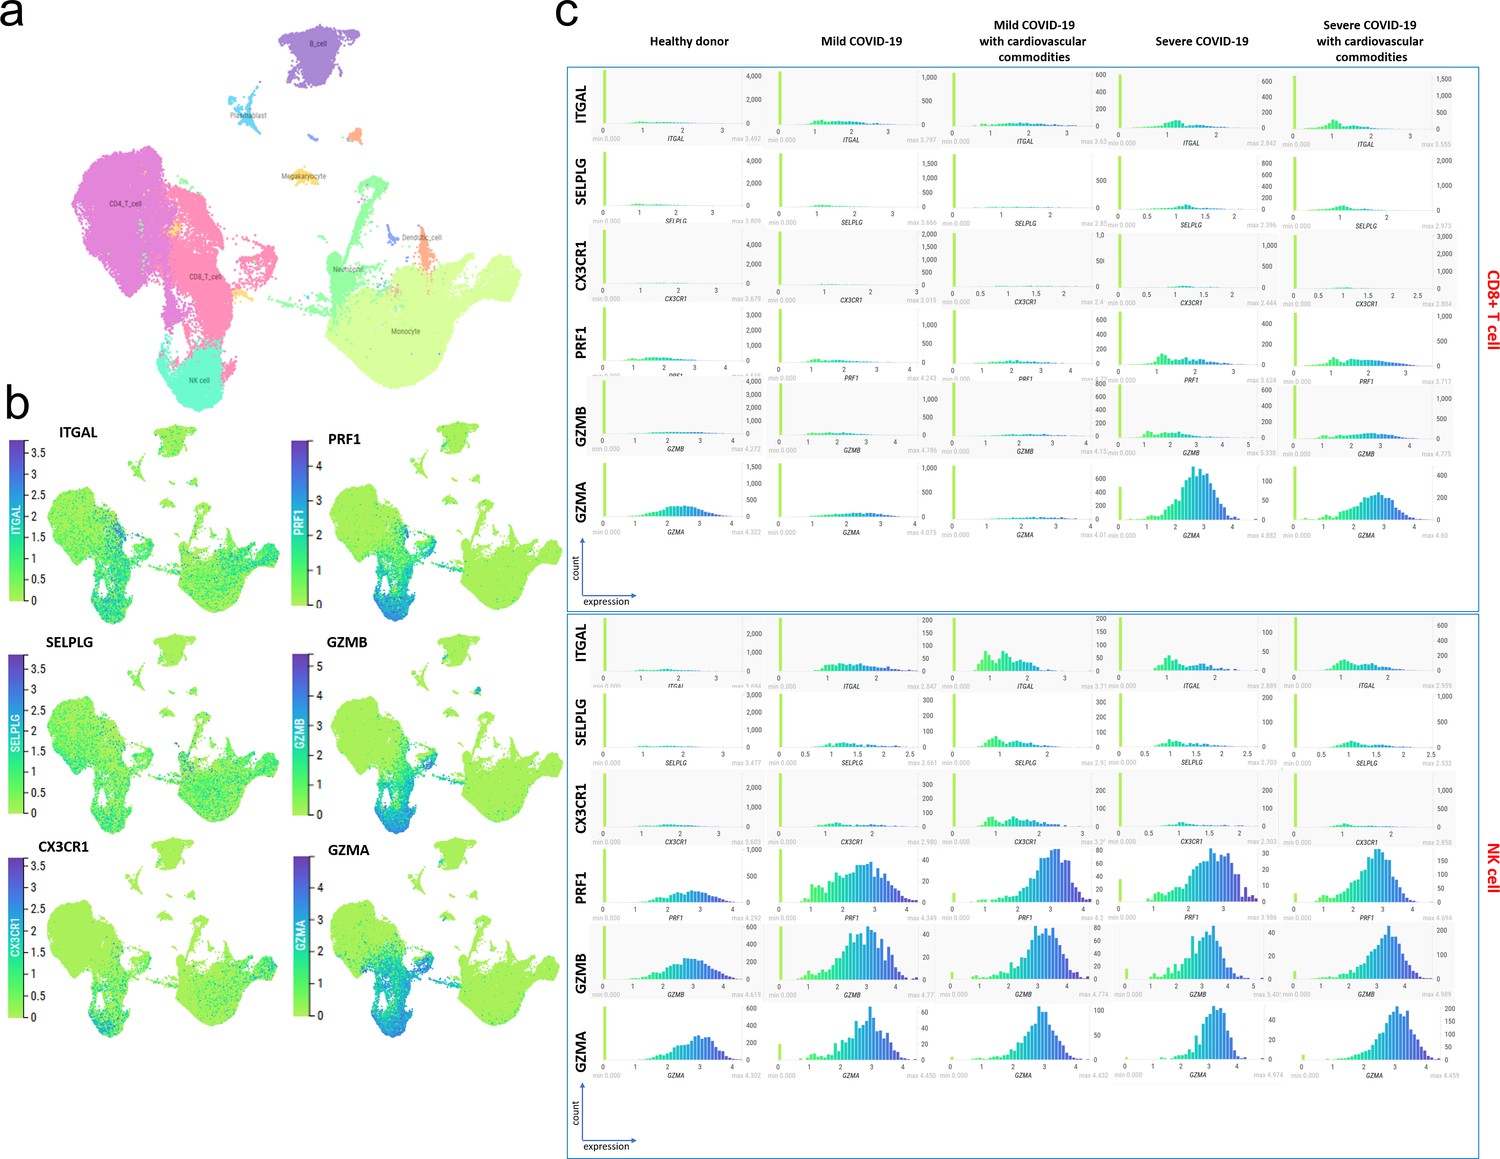
Immune interactors of activated endothelial cells.
(a) UMAP representations of immune cell populations from healthy participants and COVID-19 patients annotated by cell types (left) and differential expressions of counter receptors ITGAL, SELPLG, and CX3CR1, which are known to interact with surface molecules of activated endothelial cells (right). (b) Distribution of the expressions of cytotoxic genes GZMA, GZMB, and PRF1 across immune cell populations.
Figure 4—figure supplement 1
COVID-19 samples with or without cardiovascular comorbidity have a higher proportion of immune cells expressing counter receptor and cytotoxicity-associated genes.
(a) Single cell transcriptomic dataset published by Schulte-Schrepping et al., 2020 were re-analyzed using the cellxgene platform hosted by Fastgenomics database (https://beta.fastgenomics.org/datasets/detail-dataset-952687f71ef34322a850553c4a24e82e#Cellxgene). The samples were annotated as mild (WHO 2–4) or severe (5—7) COVID-19 disease according to the WHO clinical ordinal scale and with or without cardiovascular commodity following publication Table S1 annotations. The UMAP representing immune cell populations compilated from healthy donor (n = 21), mild with (n = 4) or without (n = 4) cardiovascular comorbidity, and severe with (n = 8) or without (n = 2) cardiovascular comorbidity was annotated using the metadata included in the ‘cluster_labels_res.0.4els_res.0.4’ taxonomy. For better clarity, the clusters of the same cell type were pooled together. (b) Expression of counter receptors (ITGAL, SELPLG, and CX3CR1) and cytotoxicity-associated genes (PFR1, GMZB and GMZA) across immune cell population. Both set of genes are mainly expressed by CD8+ and NK cells and to some extent monocyte. (c) Distribution of the expression of counter receptors and cytotoxicity associated genes in CD8+ cell (top) and NK (bottom) in mild and severe COVID-19 samples with or without cardiovascular comorbidity. Compared to healthy donors, mild and severe COVID-19 samples have a higher proportion of NK or both CD8+ and NK cells expressing counter receptors and cytotoxicity-associated genes, respectively. No difference can be observed in presence or absence of cardiovascular comorbidity.
Figure 5
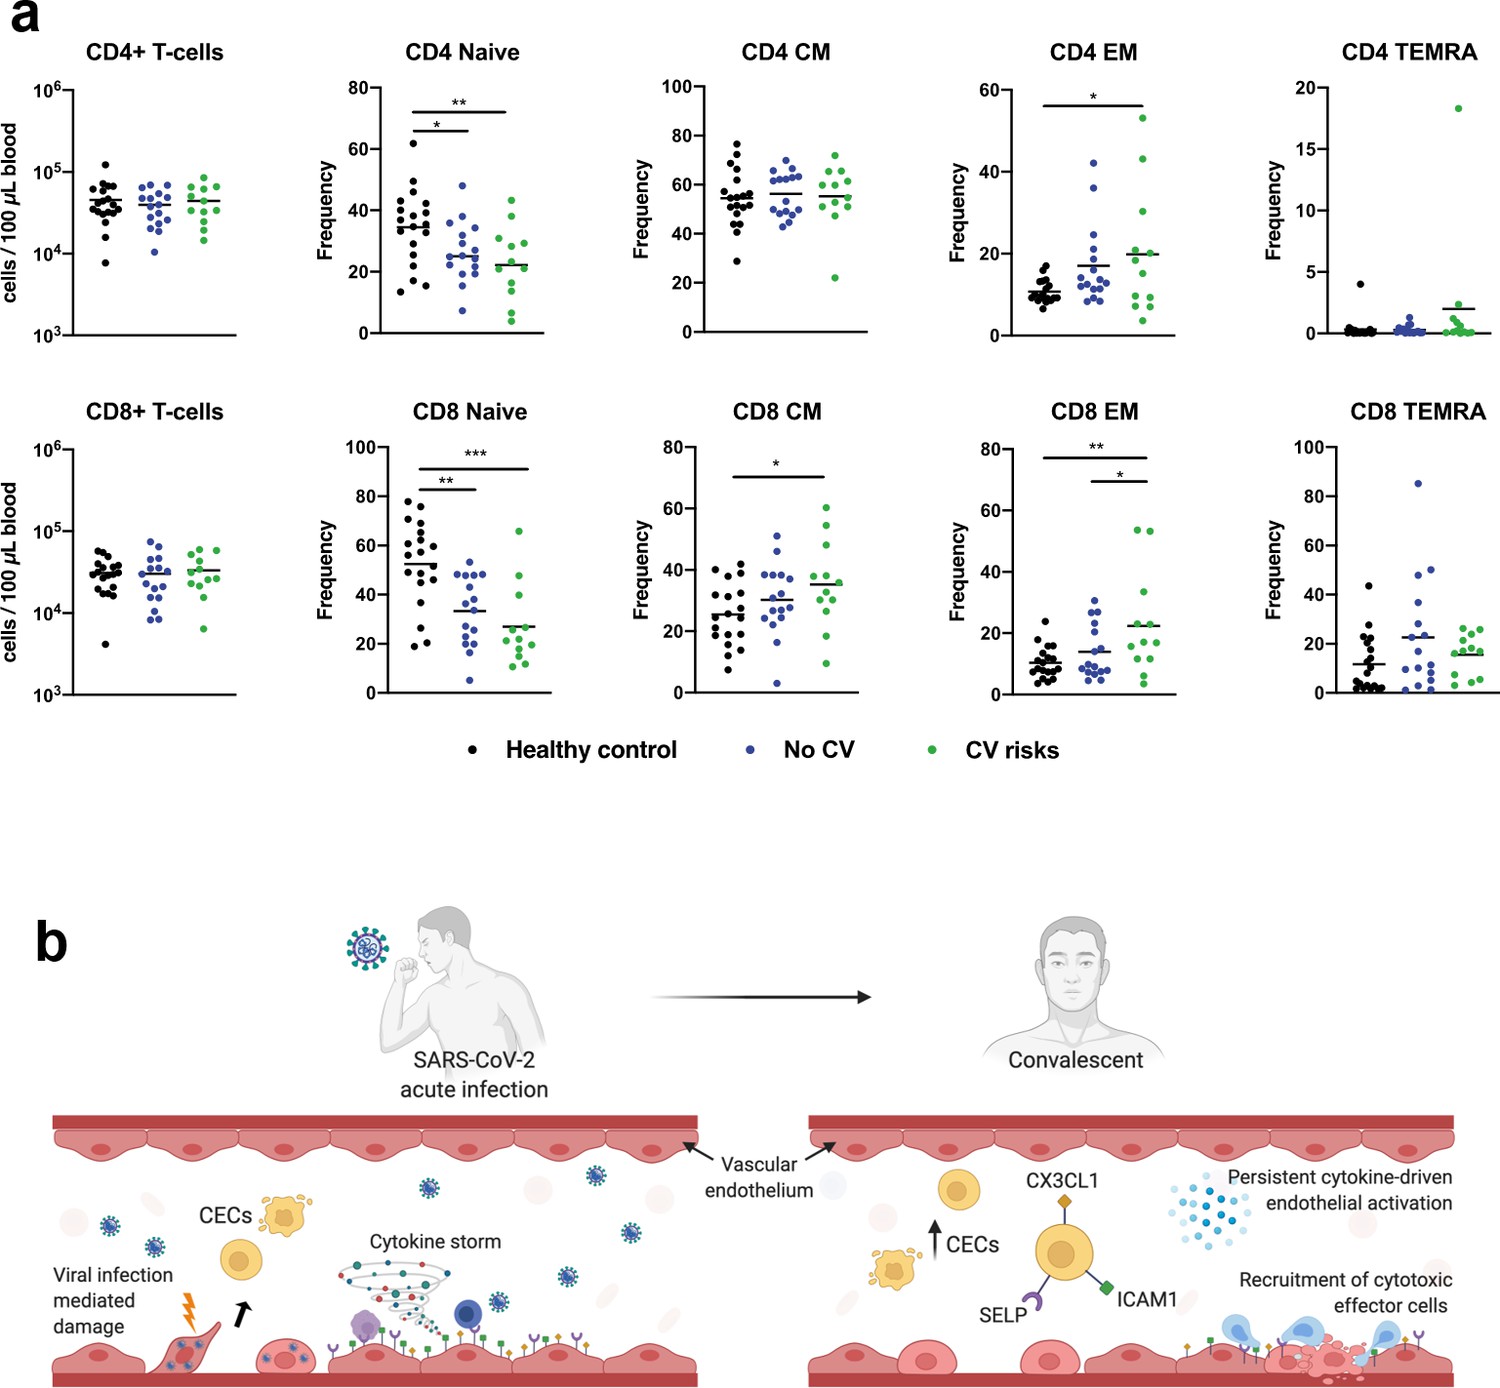
CD4+ and CD8+ T cells in COVID-19 patients with and without cardiovascular risk factors during the convalescent phase of infection.
(a) Flow cytometry was performed on whole blood obtained from COVID-19 patients with (n = 12) and without (n = 16) cardiovascular risk factors at convalescent (11—50 days post hospital discharge) phase of SARS-CoV-2 infection, and non-COVID-19 healthy controls (n = 19). Naïve, terminally differentiated effector memory cells (TEMRA), central memory (CM), and effector memory (EM) T cells were characterized based on CD45RA and CD27 expressions. Absolute counts of CD4/CD8+ T cells and individual frequencies of CD45RA vs. CD27 differentiation stage of T cells are illustrated as scatter plots. One-way ANOVA with post hoc tests were performed to compare the profiles across the groups (*p<0.05; **p<0.01; ***p<0.01). (b) Proposed mechanisms of endothelial dysfunction in COVID-19 from acute infection to convalescence.
Tables
Table 1
Demographics of patients and healthy controls.
| Characteristics, N (%) | Healthy participants (n = 24) | Non-COVID-19 patients with cardiovascular risk factors (n = 20) | Convalescent COVID-19 individuals (n = 30) | |
|---|---|---|---|---|
| Cardiovascular risk factors (n = 15) | No cardiovascular risk (n = 15) | |||
| Age* | 46.5 (9.9) years | 62.4 (8.7) years | 54 (8.7) years | 42 (13.5) years |
| Age, male* | 46.3 (11.3) years | 62.3 (10.4) years | 54 (8.2) years | 36 (6.1) years |
| Age, female* | 46.8 (8.8) years | 63 (7.3) years | 54 (9.9) years | 48 (17.1) years |
| Gender, male | 12 (50) | 10 (50) | 8 (53.3) | 8 (53.3) |
| Gender, female | 12 (50) | 10 (50) | 7 (46.7) | 7 (46.7) |
| Ethnicity | Chinese 22 (91.7) | Chinese 17 (85) | Chinese 11 (73.3) | Chinese 13 (86.6) |
| Filipino 2 (8.3) | Indian 3 (15) | Malay 2 (13.3) | Indian 1 (6.7) | |
| Bangladeshi 1 (6.7) | Caucasian 1 (6.7) | |||
| Filipino 1 (6.7) | ||||
| Days post-symptom onset (median [IQR]) | N.A. | N.A. | 34 (27–46) days | |
| COVID-19 severity | N.A. | N.A. | Mild 5 (33.3) | Mild 5 (33.3) |
| Moderate 5 (33.3) | Moderate 5 (33.3) | |||
| Severe 5 (33.3) | Severe 5 (33.3) | |||
| Comorbidities | ||||
| Hypertension | 0 (0) | 20 (100) | 10 (66.7) | 0 (0) |
| Hyperlipidemia | 0 (0) | 10 (50) | 11 (73.3) | 0 (0) |
| Diabetes mellitus | 0 (0) | 9 (45) | 7 (46.7) | 0 (0) |
| Fatty liver | 0 (0) | Information not available | 2 (13.3) | 0 (0) |
| Chronic liver disease | 0 (0) | Information not available | 1 (6.7) | 0 (0) |
| Coronary artery disease | 0 (0) | 6 (30) | Information not available | Information not available |
| Myocardial infarction | 0 (0) | 0 (0) | 2 (13.3) | 0 (0) |
-
All values are reported as N (%) where N indicates the number of observations.
*Values are expressed as mean (± standard deviation).
Key resources table
| Reagent type (species) or resource | Designation | Source or reference | Identifiers | Additional information |
|---|---|---|---|---|
| Biological sample (human) | Peripheral blood mononuclear cells | Singapore Immunology Network, National Heart Centre, Singapore | Frozen PBMCs from healthy participants, convalescent COVID-19 patients, non-COVID-19 patients with cardiovascular risk | |
| Antibody | Anti-mouse Ig, κ/negative control compensation particles set | BD Bioscience, San Jose, California, United States | Cat# 552843 RRID: AB_10051478 | To optimize fluorescence compensation settings for Flow Cytometry |
| Antibody | Hoechst 33342 Ready Flow Reagent | Invitrogen, Thermo Fisher Scientific, Waltham, Massachusetts, United States | Cat# R37165 | Flow Cytometry (5:100) |
| Antibody | PE/cyanine7 anti-human CD31 antibody (mouse IgG1, κ, clone# WM59) | Biolegend, San Diego, California, United States | Cat# 303118 RRID: AB_2247932 | Flow Cytometry (4:100) |
| Antibody | APC anti-human CD133 antibody (mouse IgG1, κ, clone# clone 7) | Biolegend, San Diego, California, United States | Cat# 372806 RRID: AB_2632882 | Flow Cytometry (4:100) |
| Antibody | Human CX3CL1/fractalkine chemokine domain Alexa Fluor 488-conjugated antibody (monoclonal mouse IgG1 clone# 51637) | Research And Diagnostic Systems, Inc (R&D Systems, Inc), Minneapolis, Minnesota, United States | Cat# IC365G-100UG RRID: AB_2885194 | Flow Cytometry (6:100) |
| Antibody | Alexa Fluor 488 anti-human CD62P (P-selectin) antibody (mouse IgG1, κ, clone# AK4) | Biolegend, San Diego, California, United States | Cat# 304916 RRID: AB_10719839 | Flow Cytometry (5:100) |
| Antibody | PE anti-human CD45 antibody (mouse IgG1, κ, clone# 2D1) | Biolegend, San Diego, California, United States | Cat# 368510 RRID: AB_2566370 | Flow Cytometry (3:100) |
| Antibody | BV711 mouse anti-human CD54 (mouse BALB/c IgG1, κ, clone# HA58 (RUO)) | BD Bioscience, San Jose, California, United States | Cat# 564078 RRID: AB_2738579 | Flow Cytometry (5:100) |
| Commercial assay or kit | Cytokine/ chemokine/ growth factor 45-Plex Human ProcartaPlex Panel 1 | Invitrogen, Thermo Fisher Scientific, Waltham, Massachusetts, United States | Cat# EPX450-12171-901 | Luminex assay |
| Software, algorithm | Bio-Plex Manager 6.1.1 software | Bio-Rad Laboratories, Hercules, California, United States | Data analysis of multiplex assay | |
| Software, algorithm | GraphPad Prism, version 8.3.1 | GraphPad Software | Data analysis, statistics, and graphing | |
| Software, algorithm | FACSDiva software, version 8.0.1 | BD Bioscience, San Jose, California, United States | Flow data acquisition | |
| Software, algorithm | FlowJo software, version 10.7.1 | BD Bioscience, San Jose, California, United States | Flow analysis | |
| Software, algorithm | STRING (Search Tool for the Retrieval of Interacting Genes/Proteins) | ELIXIR Core Data Resources, Europe | Protein-Protein interaction networks and functional enrichment analysis | |
| Software, algorithm | Cellxgene | The Chan Zuckerberg Initiative Wilk et al dataset: https://cellxgene.cziscience.com/d/Single_cell_atlas_of_peripheral_immune_response_to_SARS_CoV_2_infection-25.cxg/ Schulte-Schrepping et al dataset: https://beta.fastgenomics.org/datasets/detail-dataset-952687f71ef34322a850553c4a24e82e#Cellxgene | Analysis and visualization of scRNA-seq data |
Additional files
-
Supplementary file 1
Statistical adjustment for age.
- https://cdn.elifesciences.org/articles/64909/elife-64909-supp1-v1.docx
-
Transparent reporting form
- https://cdn.elifesciences.org/articles/64909/elife-64909-transrepform-v1.docx
Download links
A two-part list of links to download the article, or parts of the article, in various formats.
Downloads (link to download the article as PDF)
Open citations (links to open the citations from this article in various online reference manager services)
Cite this article (links to download the citations from this article in formats compatible with various reference manager tools)
Convalescent COVID-19 patients are susceptible to endothelial dysfunction due to persistent immune activation
eLife 10:e64909.
https://doi.org/10.7554/eLife.64909


