Castration delays epigenetic aging and feminizes DNA methylation at androgen-regulated loci
- Department of Anatomy, University of Otago, New Zealand
- Department of Biostatistics, Fielding School of Public Health, University of California, Los Angeles, United States
- Applied Translational Genetics Group, School of Biological Sciences, Centre for Brain Research, The University of Auckland, New Zealand
- Department of Human Genetics, David Geffen School of Medicine, University of California, Los Angeles, United States
- Livestock and Farming Systems, South Australian Research and Development Institute, Australia
- Blackstone Hill Station, Becks, RD2, New Zealand
- Department of Ecology and Evolutionary Biology, UCLA, United States
- Center for Neurobehavioral Genetics, Semel Institute for Neuroscience and Human Behavior, University of California, Los Angeles (UCLA), United States
- Department of Psychiatry and Biobehavioral Sciences, David Geffen School of Medicine at UCLA, United States
Figures
Figure 1 with 2 supplements

Association between age and DNA methylation in sheep.
(A) Depiction of sheep cohort for this study. (B) Manhattan plot of all CpGs and their correlation with chronological age. (C) Methylation levels of highly age-correlated probes within biologically relevant genes: FGF8 cg10708287 (r = 0.64, p=1.38E−51), PAX6 cg00953859 (r = 0.62, p=2.71E−47), PAX5 cg16071226 (r = 0.59, p=5.75E−43), and HOXC4 cg12097121 (r = 0.59, p=4.47E−43). (D) Methylation levels of IGF1 cg18266944 in ear of females only (r = 0.60, p=7.43−15). The p-values of the correlation were calculated using the standardScreeningNumericTrait function in WGNCA (Student's t-test).
Figure 1—figure supplement 1
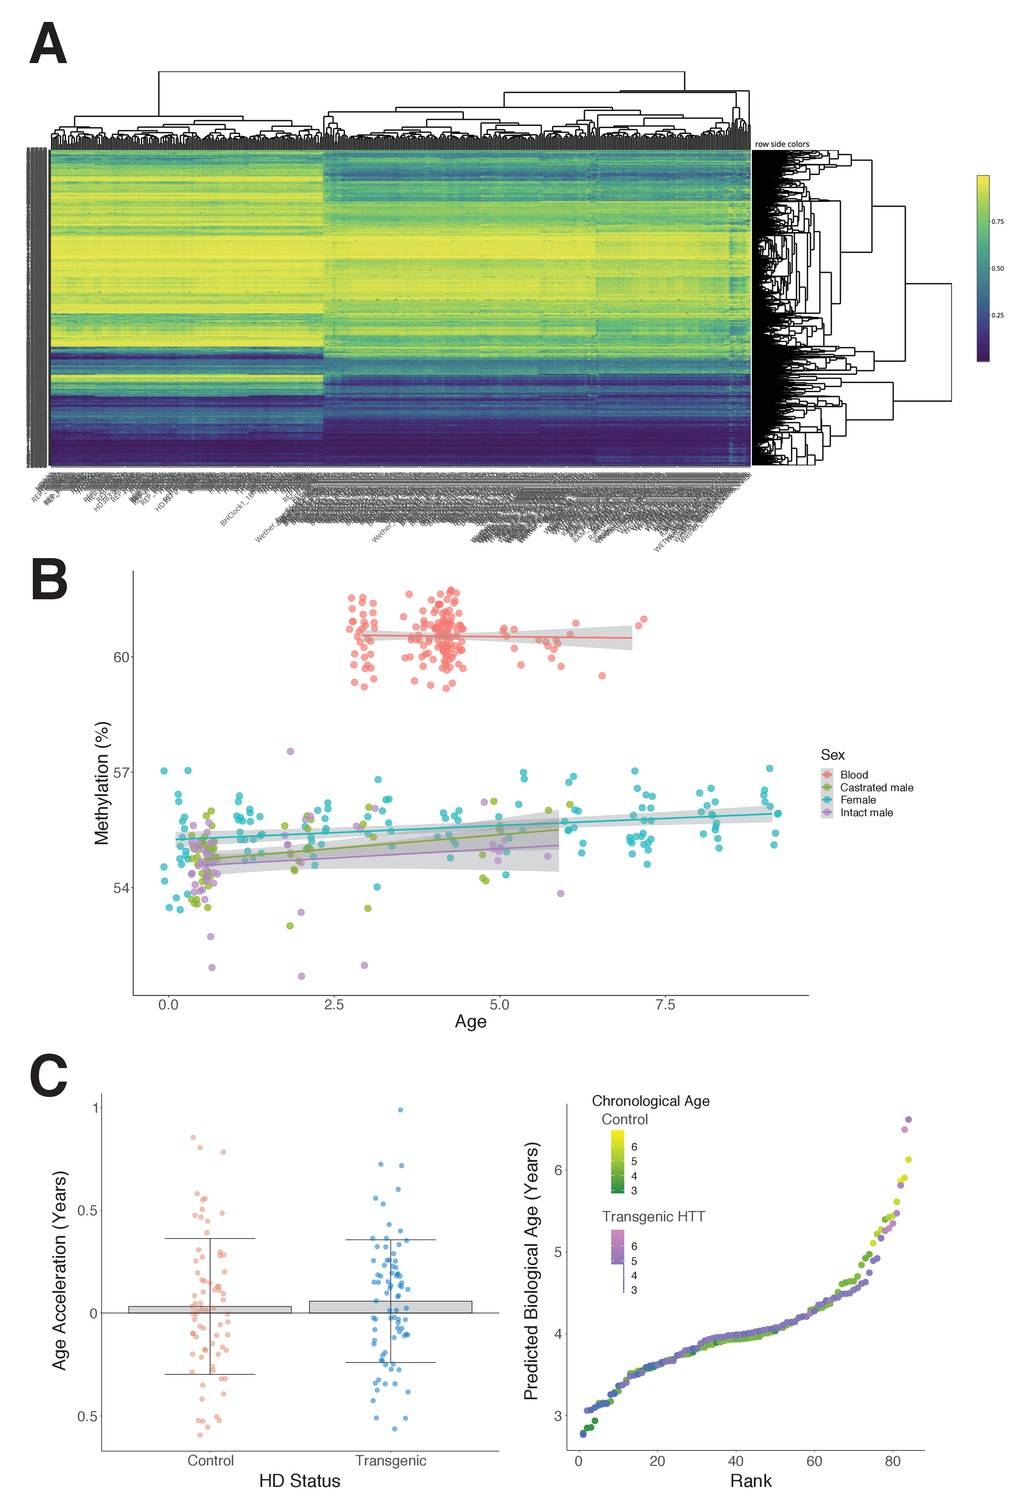
Characteristics of the sheep study cohort.
(A) Hierarchical clustering heat map shows methylation profiles grouped by sheep tissue type; blood (left side) vs. ear (right side).
(B) Average methylation in sheep ear and blood as age progresses. (C) The epigenetic ages of control and transgenic Huntingtin (HTT) sheep are not significantly different (p=0.30, Mann–Whitney U test).
Figure 1—figure supplement 2
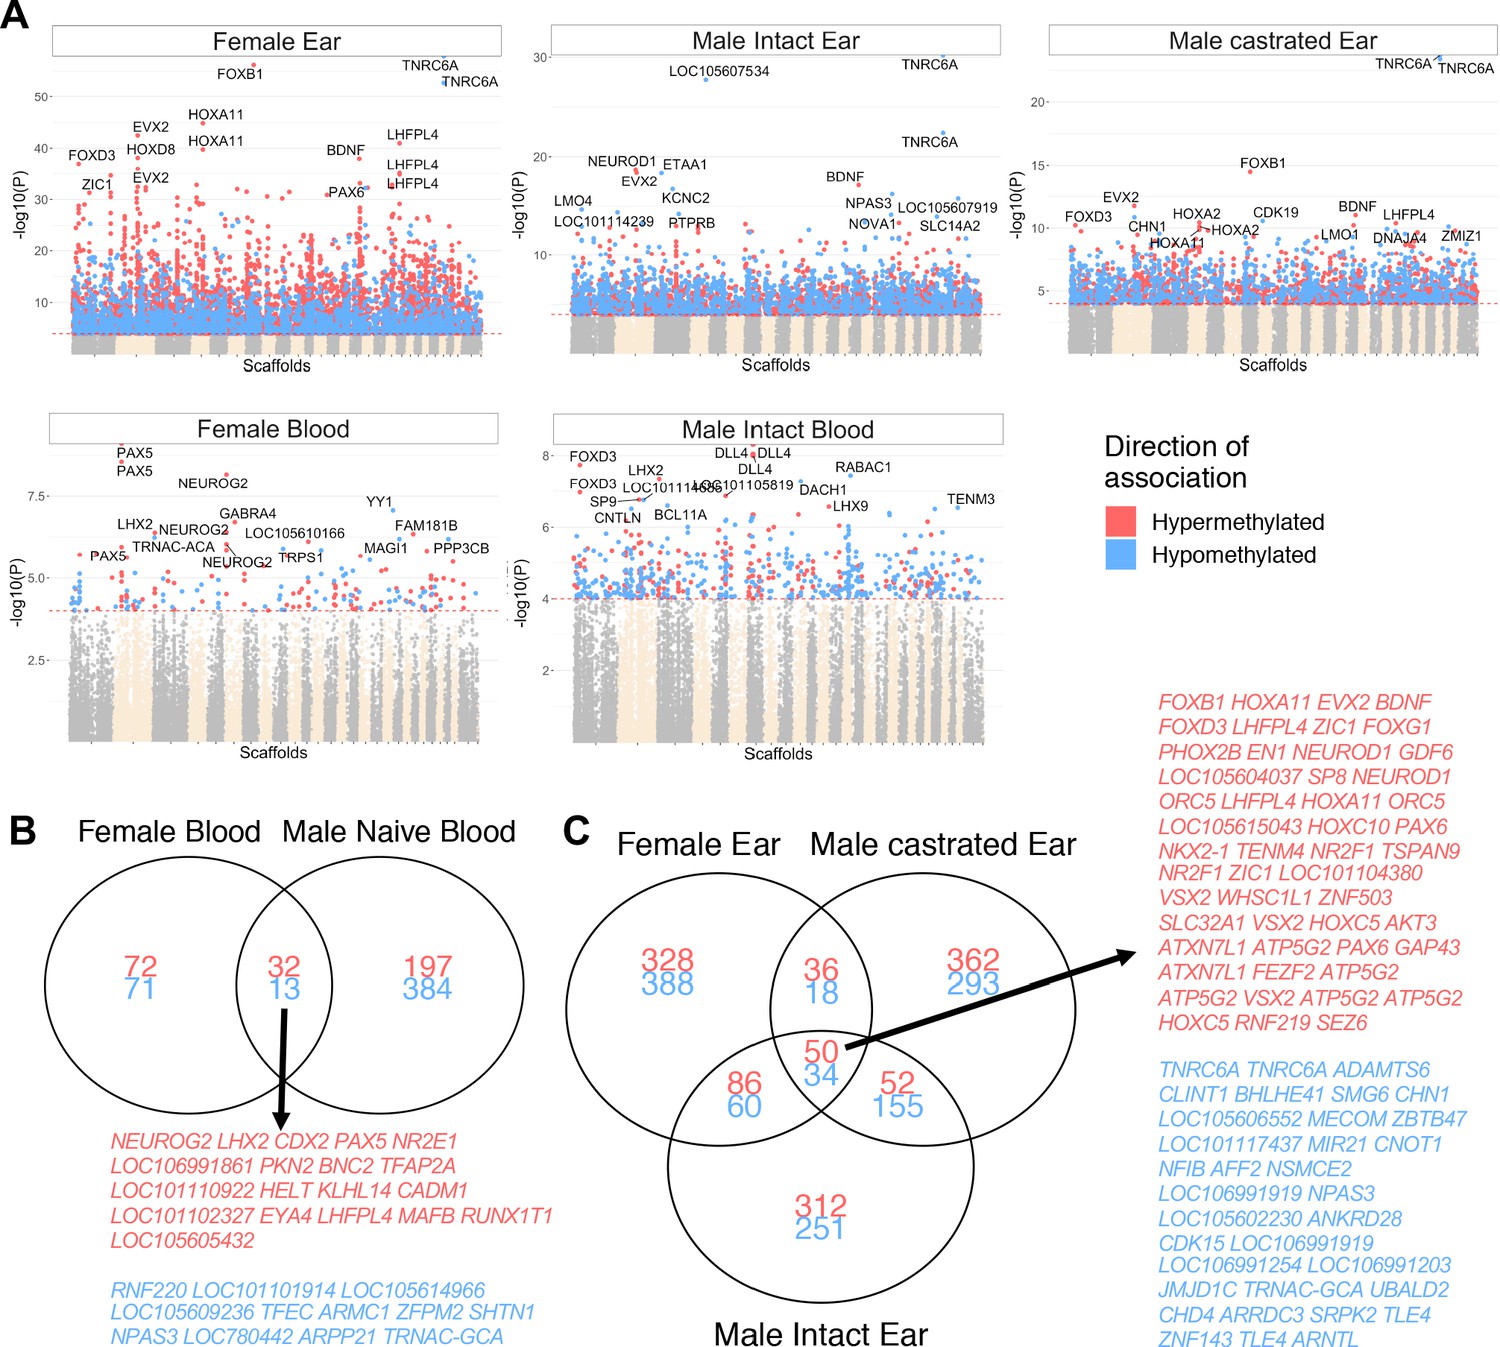
Correlation between methylation and age with group stratification.
(A) Manhattan plot of all CpGs and their correlation with chronological age when subdivided into ear punch samples (top row; females, males intact and castrated males) and blood samples (females and intact males). Those with significant hypermethylation (red) and hypomethylation (blue) correlations that are shared between sex groups in (B) blood and (C) ear are indicated. While many significantly correlated sites were shared between sexes and castration groups (45 and 84 for blood and ear punch, respectively), only four sites were shared between tissue groups.
Figure 2
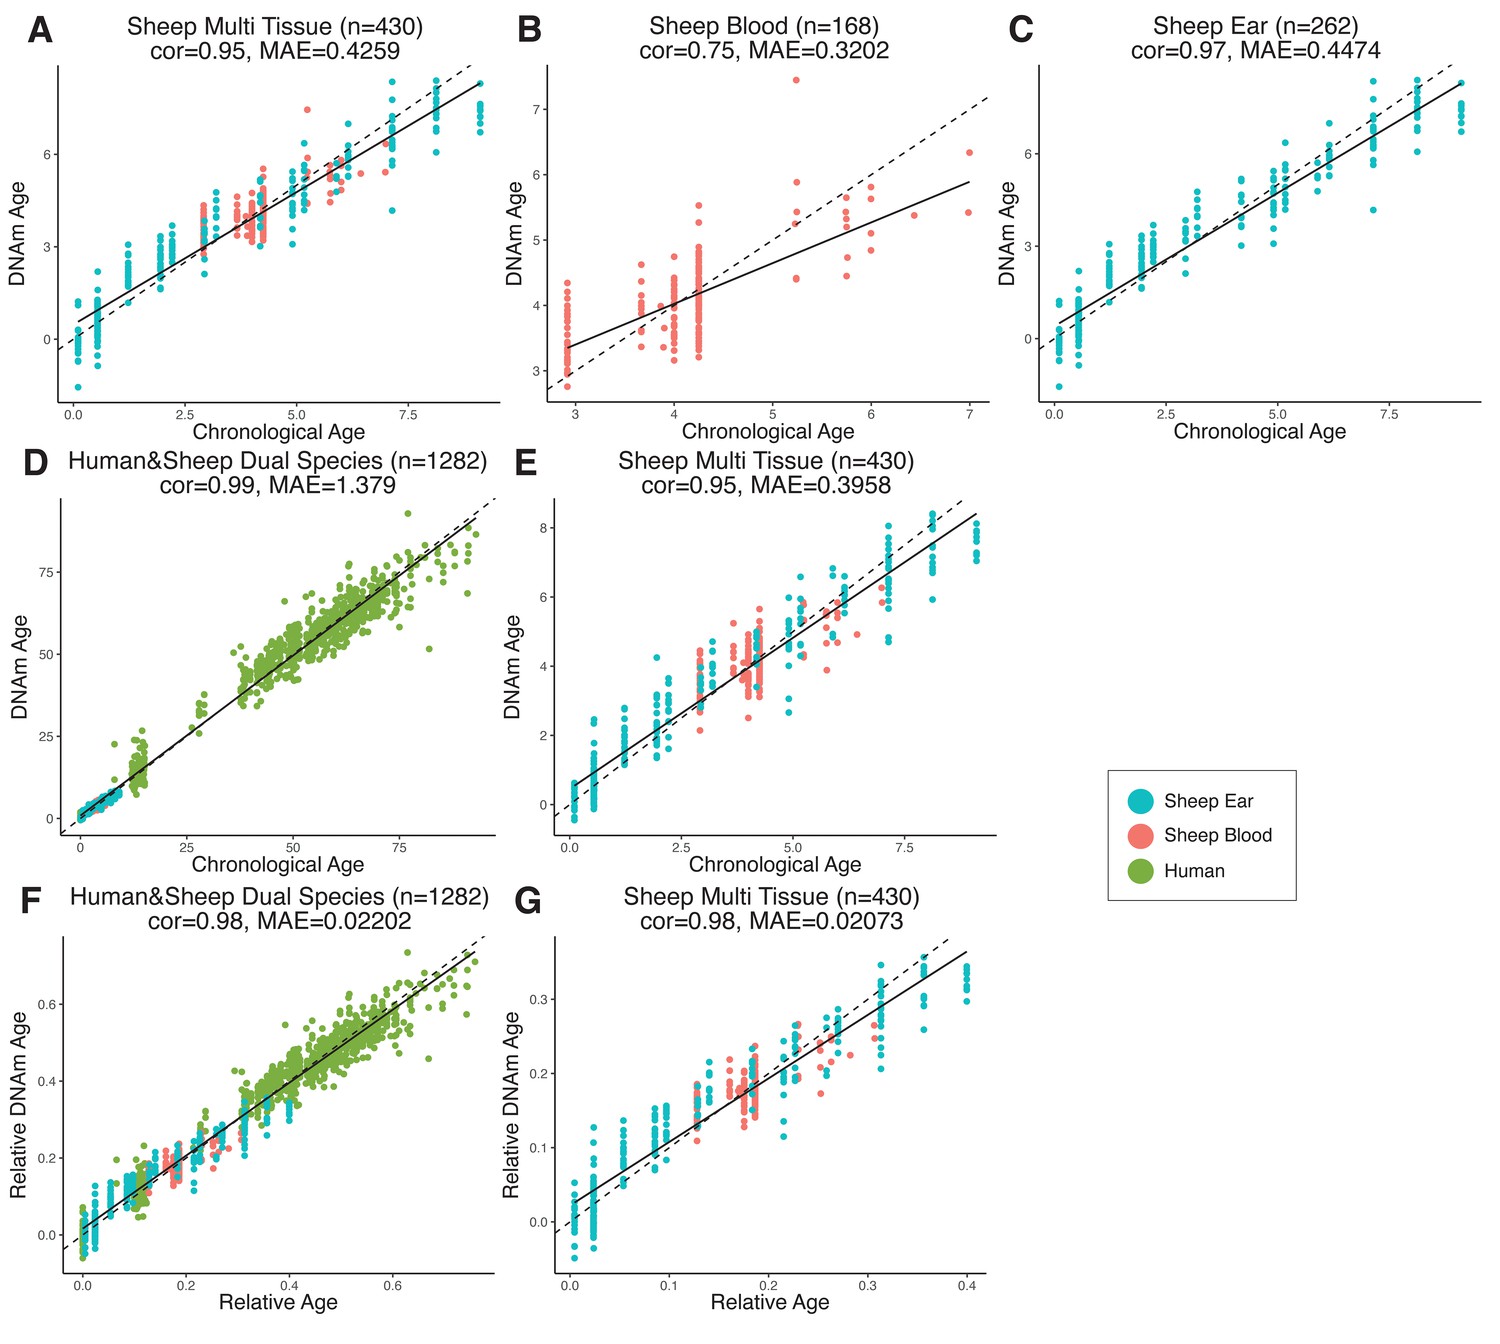
Comparison of chronological age (x-axis) and epigenetic age (y-axis) for a variety of clock models trained on (A–C) sheep only or (D–G) humans and sheep.
Epigenetic age (DNAm age), correlation (cor), and median absolute error (MAE) are indicated for (A) sheep multi-tissue (ear and blood) (cor = 0.95, MAE = 0.4259), (B) sheep blood (cor = 0.75, MAE = 0.3202), and (C) sheep ear (cor = 0.97, MAE = 0.4474) clocks. For (D–G), clocks were created using methylation data from both humans and sheep, with DNAm age predictions displayed for (D) human and sheep (cor = 0.99, MAE = 1.379) and (E) sheep only (cor = 0.95, MAE = 0.3958) as calculated using absolute time (years). DNAm age was also calculated relative to maximum lifespan for (F) human and sheep (cor = 0.98, MAE = 0.02202) and (G) sheep only (cor = 0.98, MAE = 0.02073). Maximum lifespan values used were for human and sheep, respectively, were 122.5 years and 22.8 years. Each data point represents one sample, colored based on origin.
Figure 3 with 1 supplement
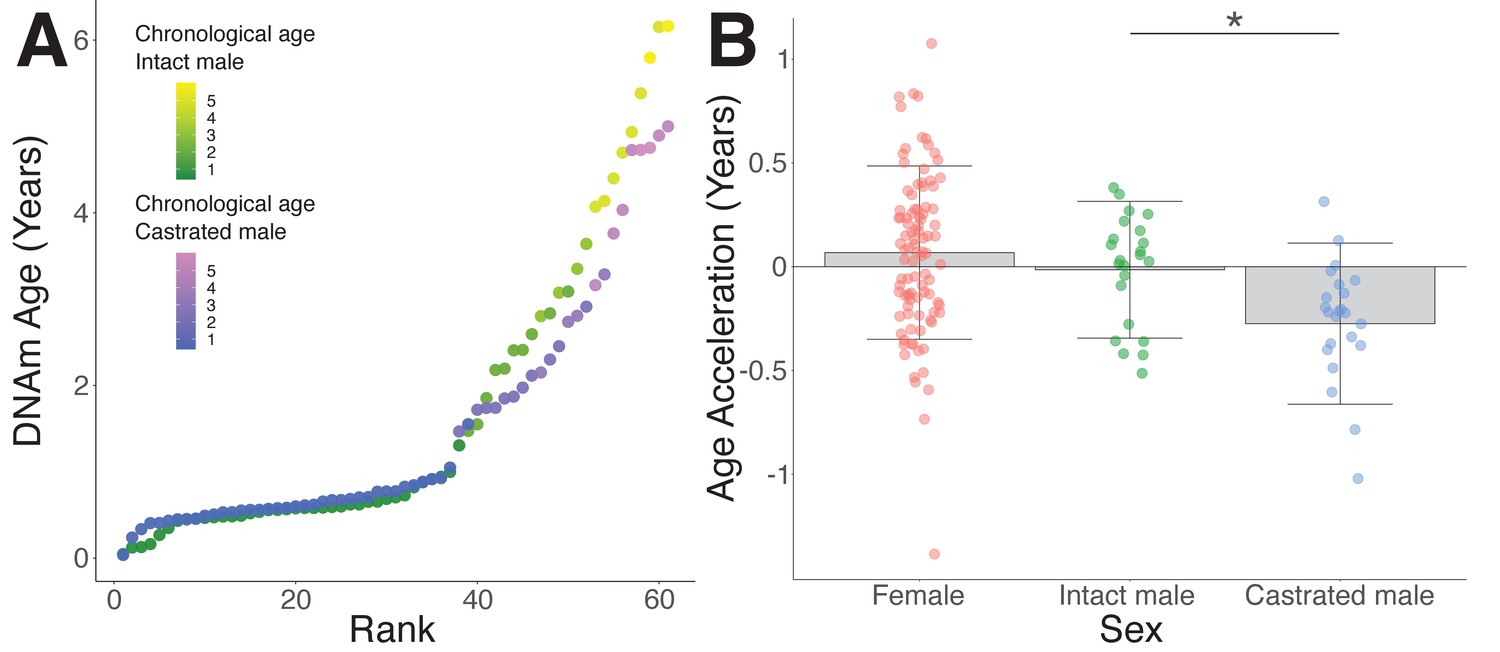
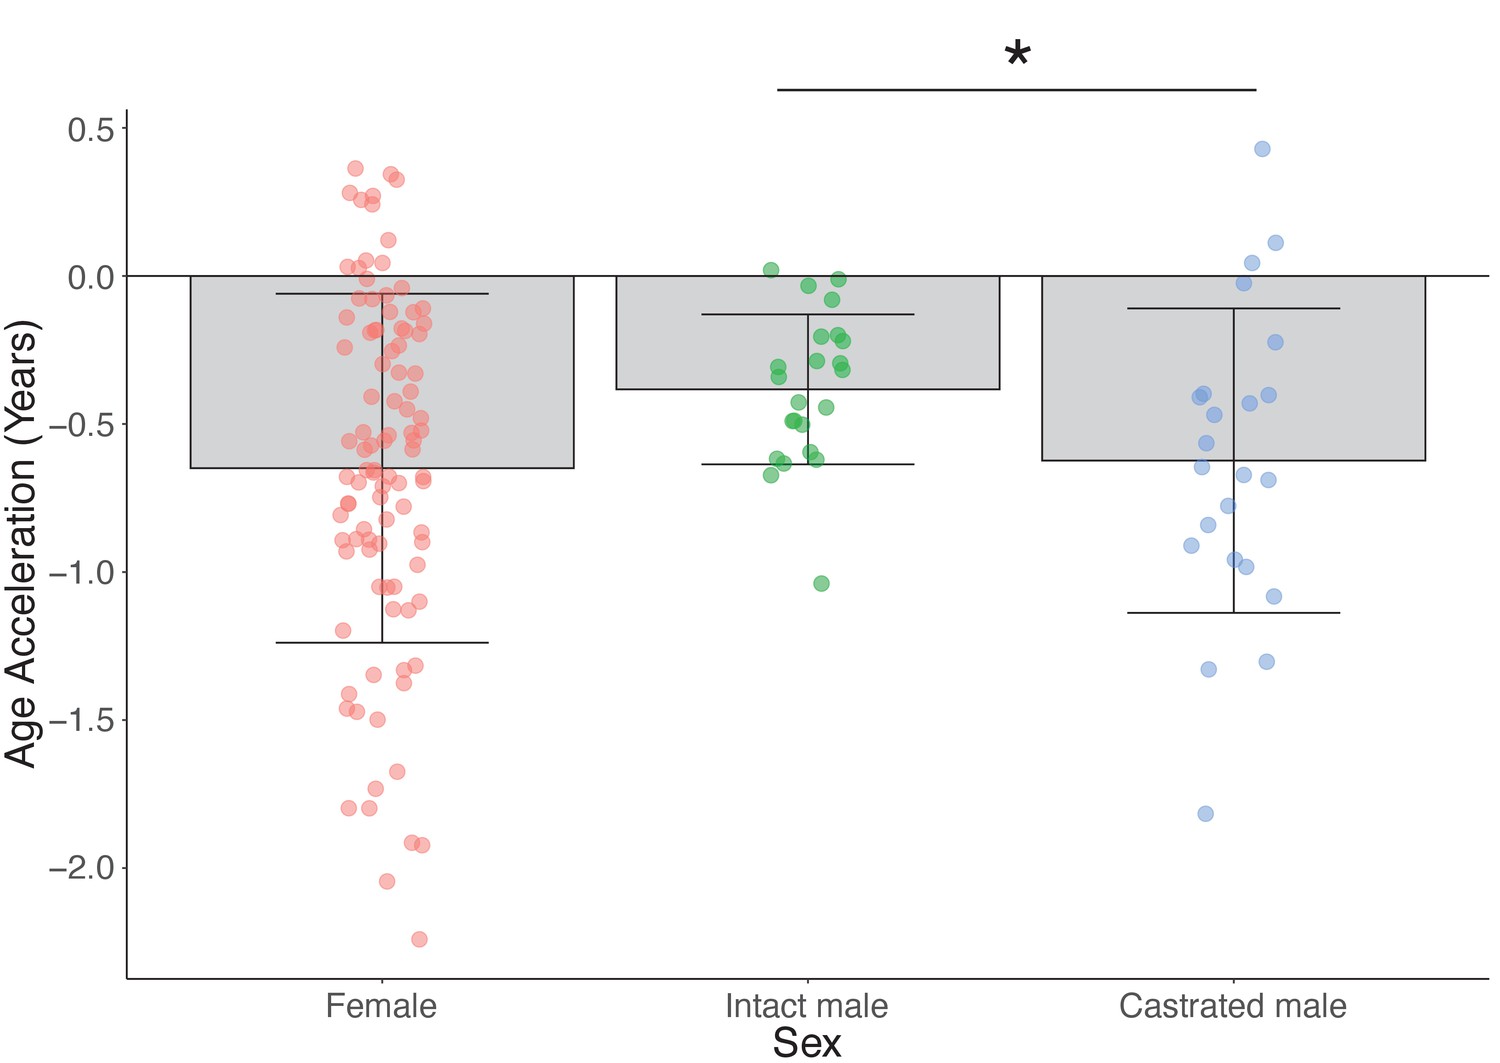
Epigenetic age deceleration in castrated sheep.
(A) Epigenetic age in age-matched castrated and intact males. To equate the cohort sizes for intact and castrated males, two age-matched castrates with DNAm age estimates closest to the group mean were excluded. (B) Age acceleration based on sex and castration status in sexually mature sheep only (ages 18 months+ only). Castrated males have decelerated DNAm age compared to intact males (*p=0.018, Mann–Whitney U test).
Figure 3—figure supplement 1
Age acceleration based on sex and castration status in sexually mature sheep only (age 18 months+ only) using the human and sheep dual-species clock.
Asterisk indicates the significant difference between age acceleration in castrated and intact males (p=0.04, Mann–Whitney U test).
Figure 4 with 2 supplements
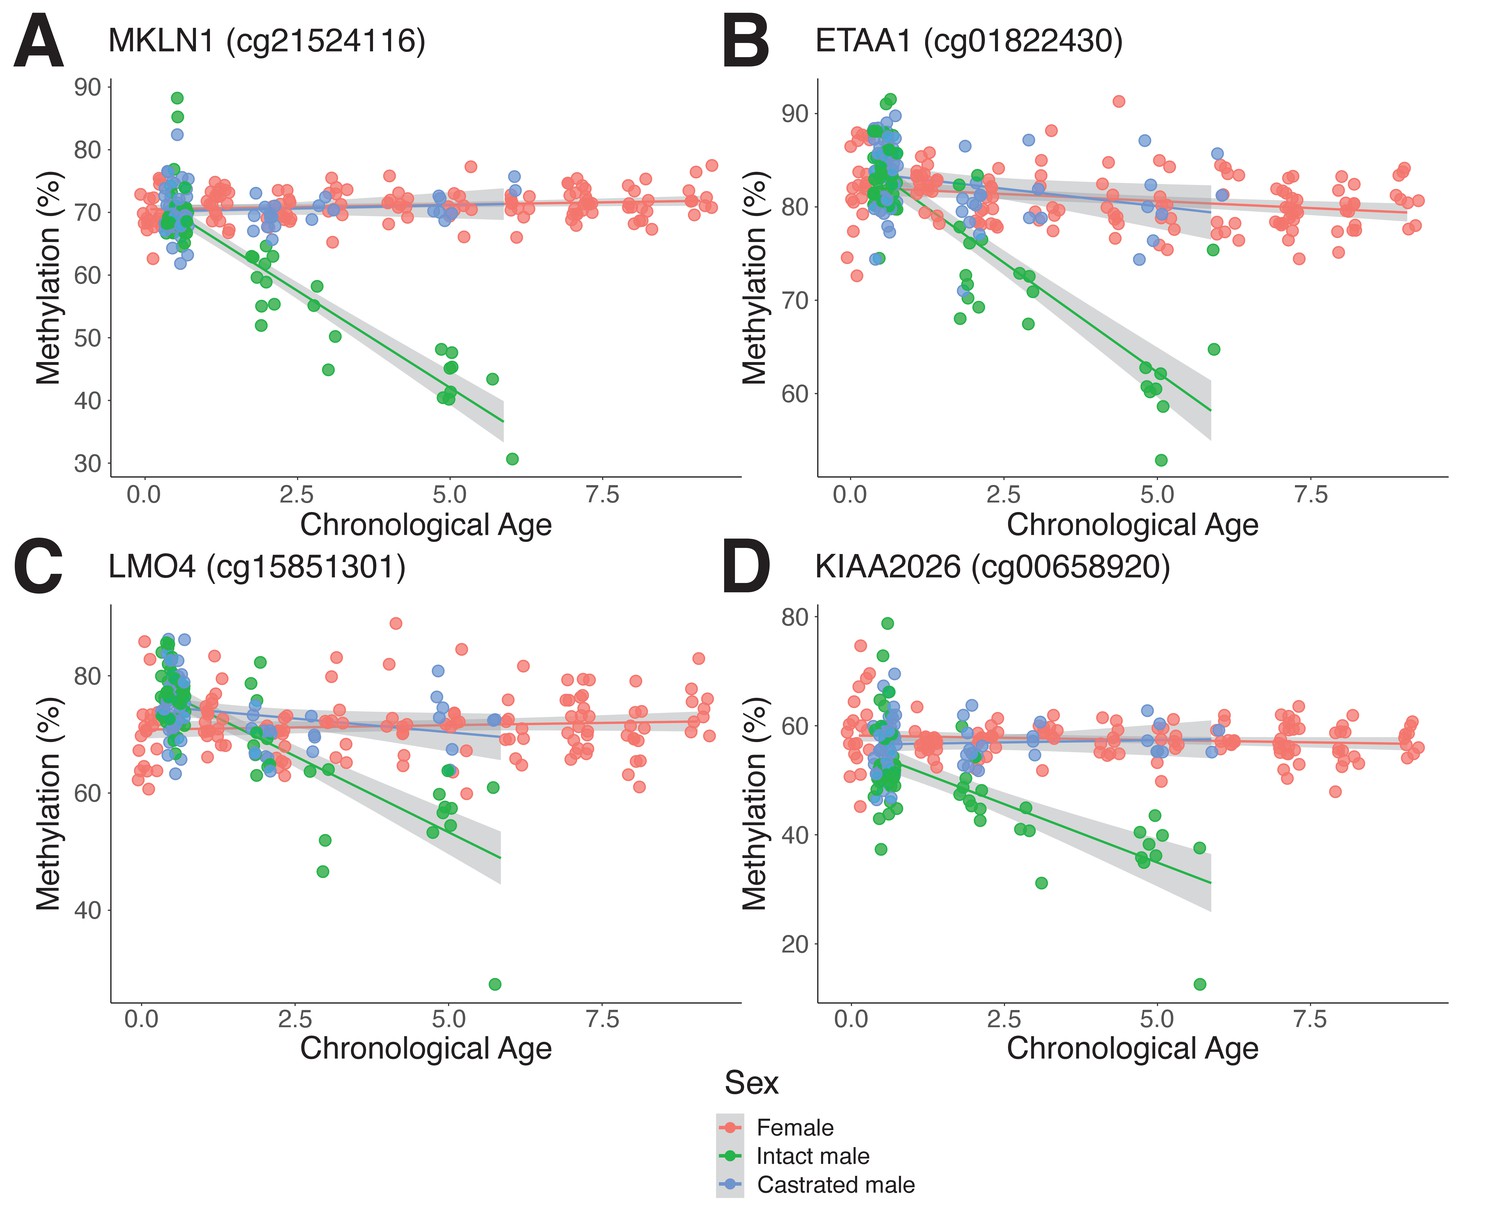
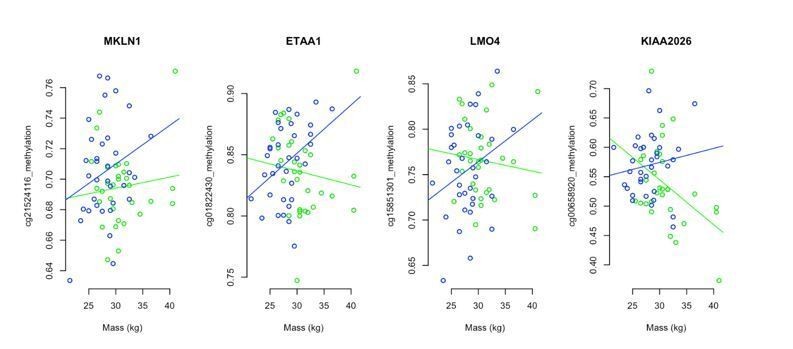
Androgen-sensitive differentially methylated probes (asDMPs) in sheep ear.
(A) MKLN1 (cg21524116, p=1.05E−27), (B) ETAA1 (cg01822430, p=1.31E−13), (C) LMO4 (cg15851301, p=1.62E−09), and (D) KIAA2026 (cg00658920, p=2.46E−09). The p-values were calculated using a t-test of the difference in linear regression slopes.
Figure 4—figure supplement 1
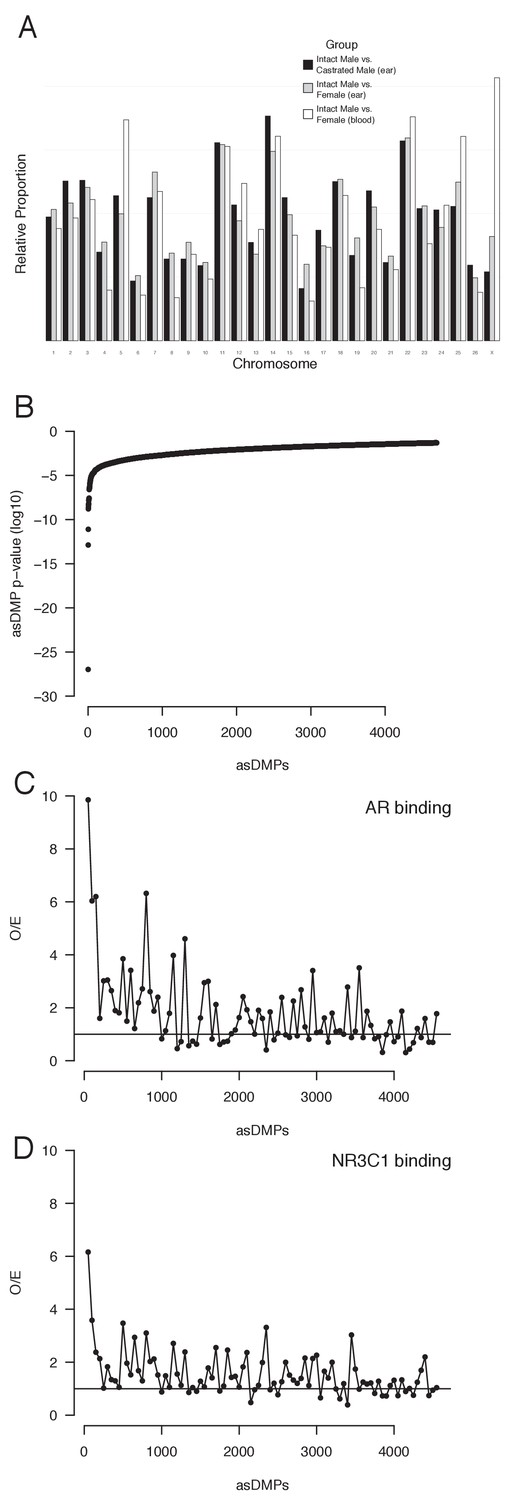
Androgen-sensitive differentially methylated probes (asDMPs).
(A) Chromosome location of all statistically significant asDMPs in all sheep groups. Y-axis shows the proportion of probes that map to each chromosome, normalized for chromosome size and percentage of significant probes within each comparison group. (B) All 4694 statistically significant (p<0.05) asDMPs ordered by p-value. (C, D) Observed overexpected (O/E) ratios for (C) androgen receptor (AR) and (D) the glucocorticoid receptor (NR3C1) binding to windows of 50 asDMPs, calculated from the Cistrome dataset (Figure 5).
Figure 4—figure supplement 2
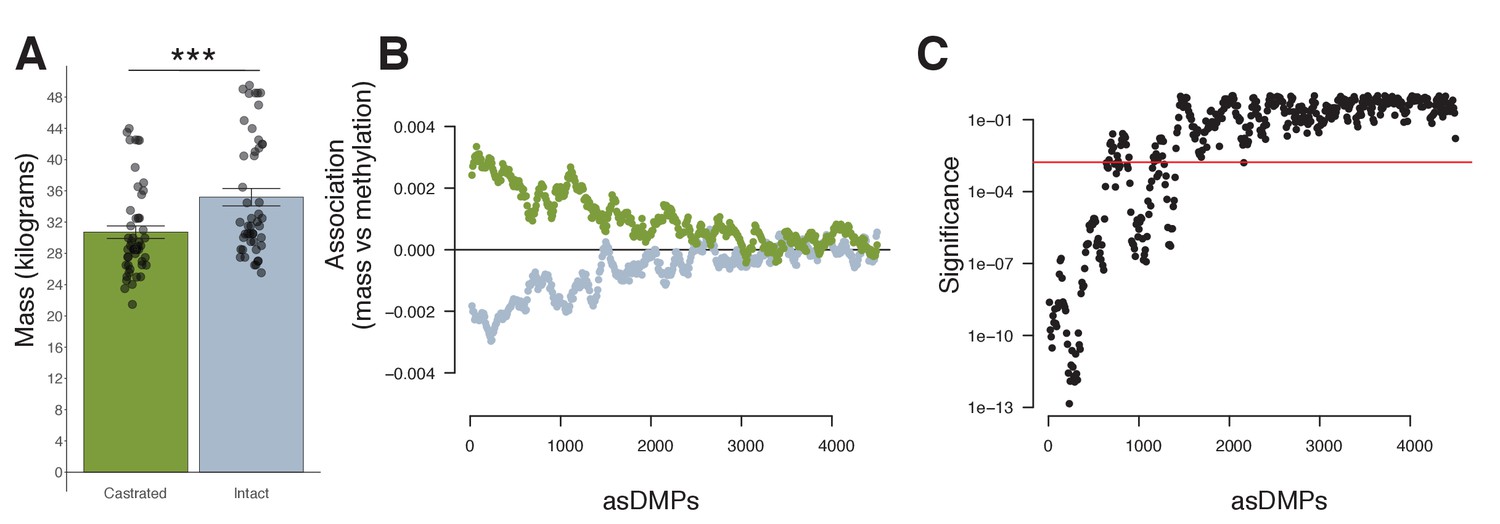
Mass and methylation in young male sheep.
(A) Mass (kg) of male lambs (<1 year) according to castration status (castrated males, green; intact males, gray; p=<0.001, error bars = SEM). p-Value was calculated using a standard t-test. (B) A positive relationship exists between castrated young males (green) and methylation at androgen-sensitive differentially methylated probes (asDMPs), but a negative correlation between intact males and methylation (gray). (C) Significance of this difference in association extends for approximately the top 1000 asDMPs. Red line indicates a significance threshold, that is, the 99th quantile for 1000 bootstrap replicates of 100 random probes.
Figure 5 with 1 supplement
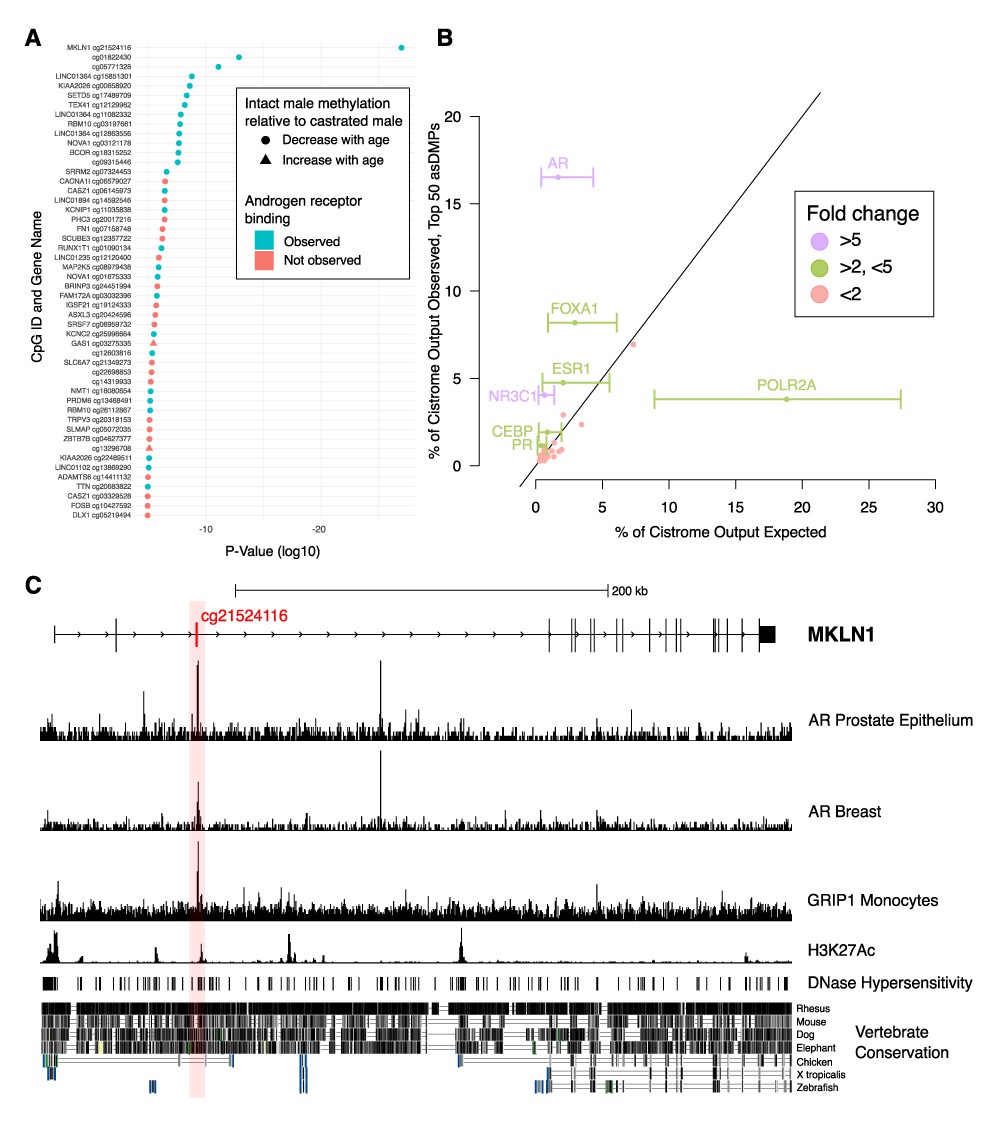
Analysis of chromatin immunoprecipitation and sequencing (ChIP-seq) data indicates functional links to sex-dependent epigenetic aging.
(A) Top 50 androgen-sensitive differentially methylated probes (asDMPs) between intact and castrated male sheep, and the human genes they map to (where applicable). The top 14 most significant asDMPs are all bound by androgen receptor (AR); and 48/50 of these sites exhibit hypomethylation with age in intact males relative to castrated males. (B) Observed transcription factor (TF) binding at the top 50 asDMPs compared to expected binding based upon empirical sampling at random CpGs (average of 1000 bootstrap replicates). TFs with greater than twofold variation and an absolute value of >1% are labeled with error bars showing the range of TF binding in bootstrap sampling. Colors indicate fold-change between observed and expected TF binding; <2 (red), 2–5 (green), and >5 (purple) (C) Genomic view of MKLN1 containing the most significant asDMP cg21524116 illustrating AR binding and indicators of active chromatin.
Figure 5—figure supplement 1
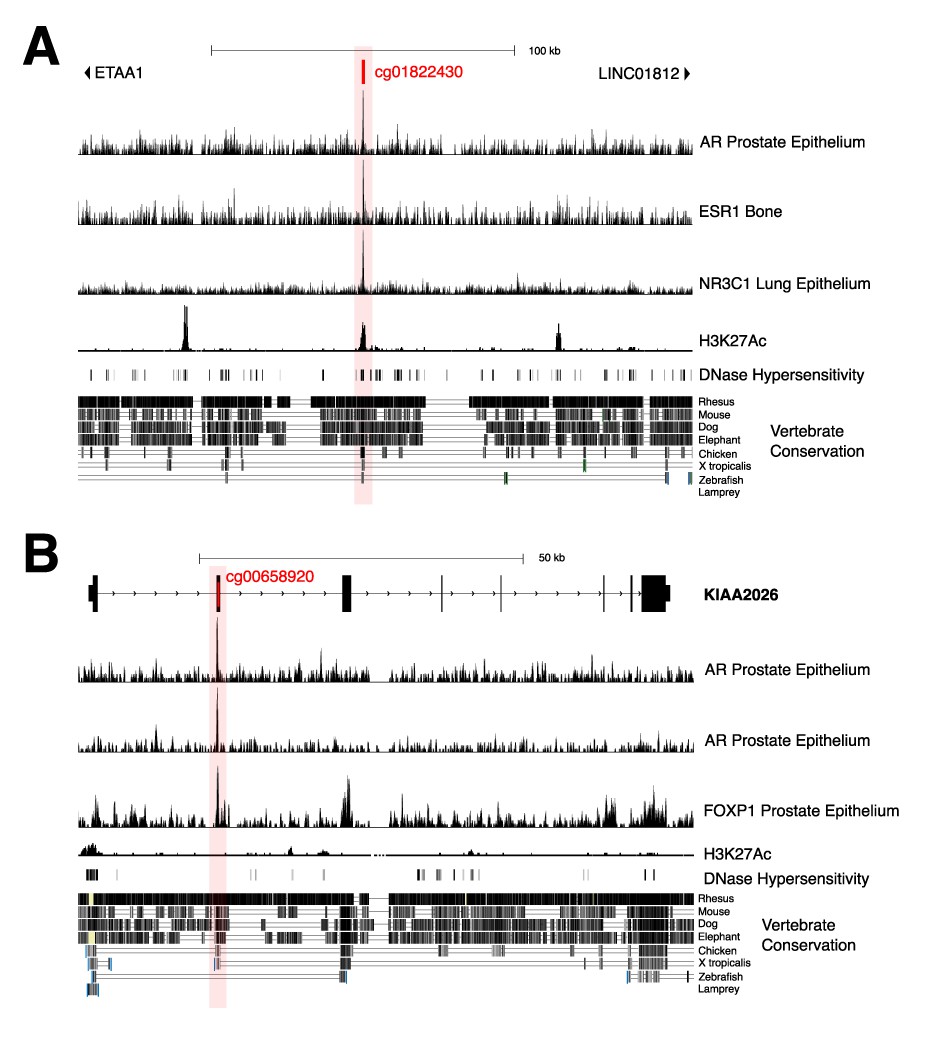
Gene views of key androgen-sensitive sites showing evidence for possible regulatory functions.
(A) ETAA1; cg01822430 (second most significant sheep androgen-sensitive differentially methylated probe [asDMP]). (B) KIAA2026 cg00658920.
Figure 6 with 1 supplement
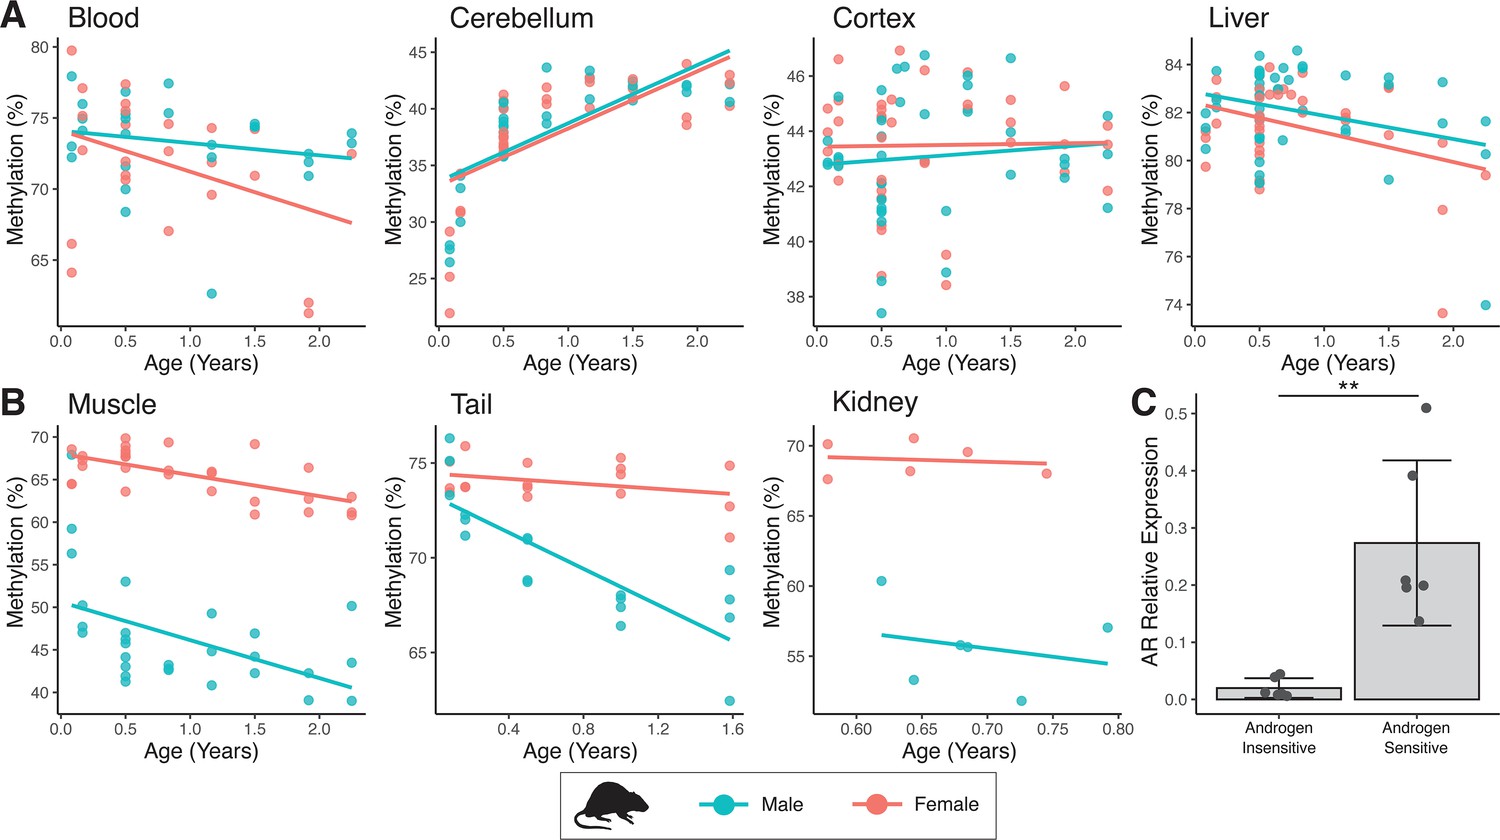
Sex-specific methylation patterns for cg21524116 (MKLN1) in mouse tissues are linked to androgen receptor (AR) expression.
In specific tissues of mouse, probe cg21524116 (MKLN1) exhibits either (A) no sex differences or (B) male exaggerated hypomethylation during aging. (C) AR mRNA expression is significantly higher in tissues showing male hypomethylation at MKLN1 (epidermis, kidney, skeletal muscle) compared to tissues where MKLN1 methylation is not different between sexes (cerebellum, cortex, liver) (p=0.007; t-test).
Figure 6—figure supplement 1
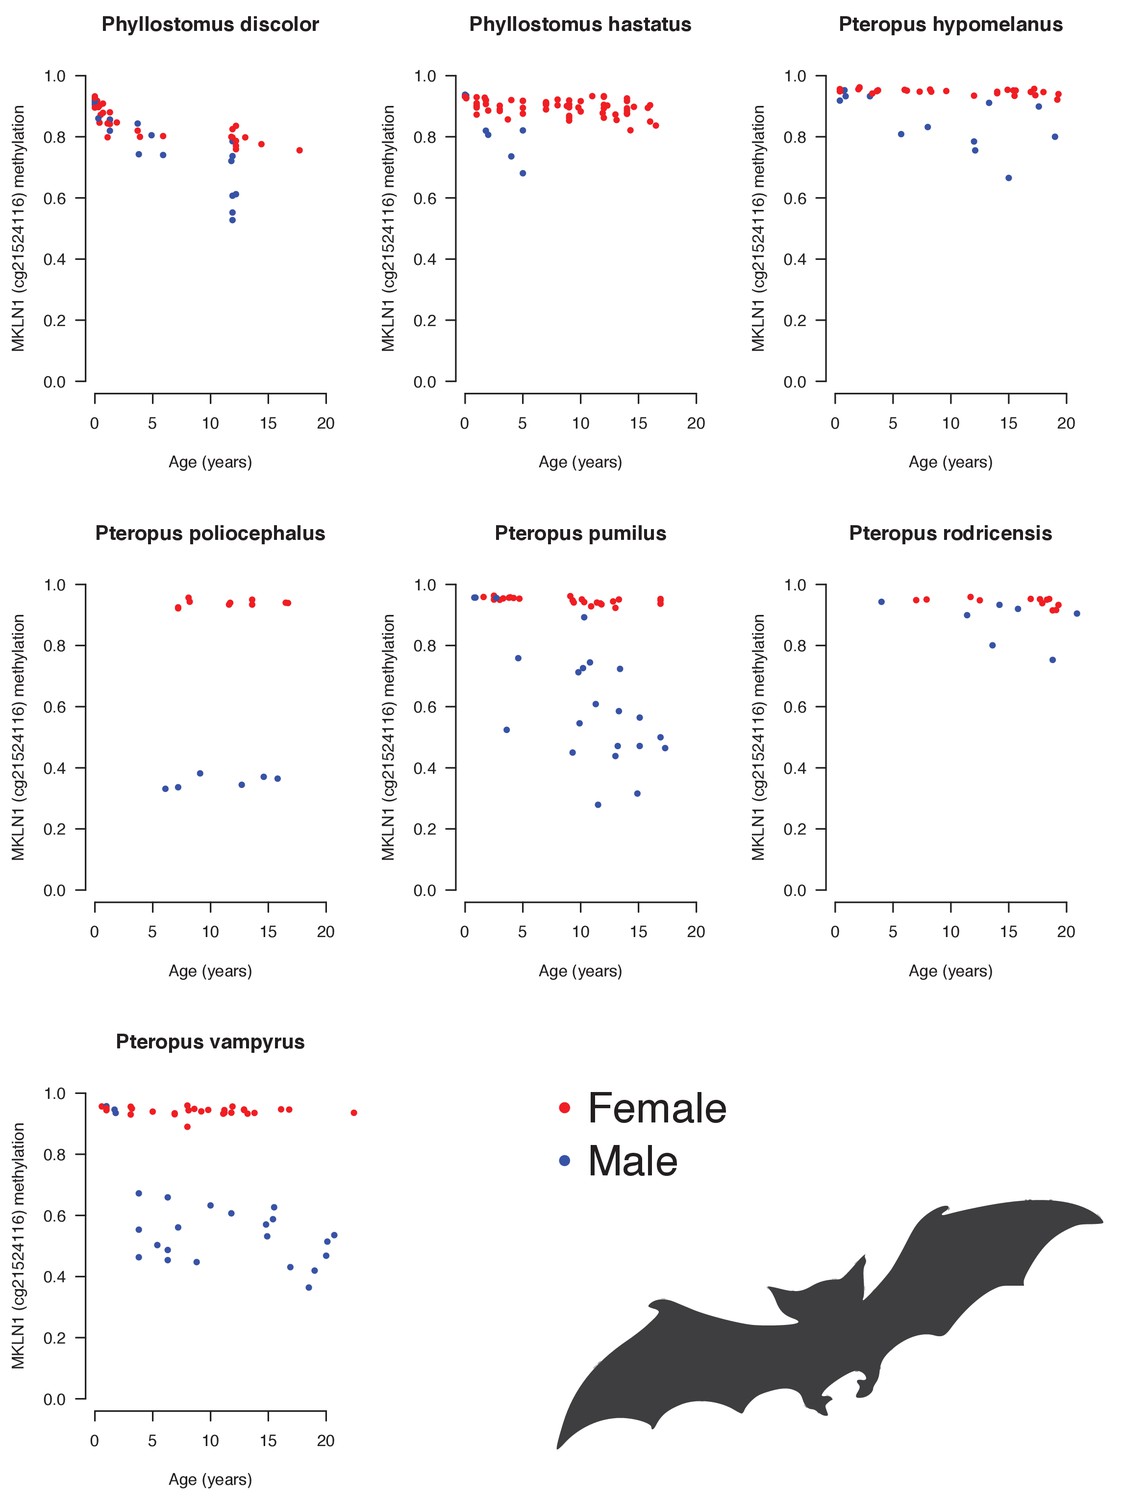
Androgen-sensitive methylation patterns at cg21524116 (MKLN1) in skin of several bat species.
Males (blue) generally show loss of methylation during aging, whereas females (red) do not.
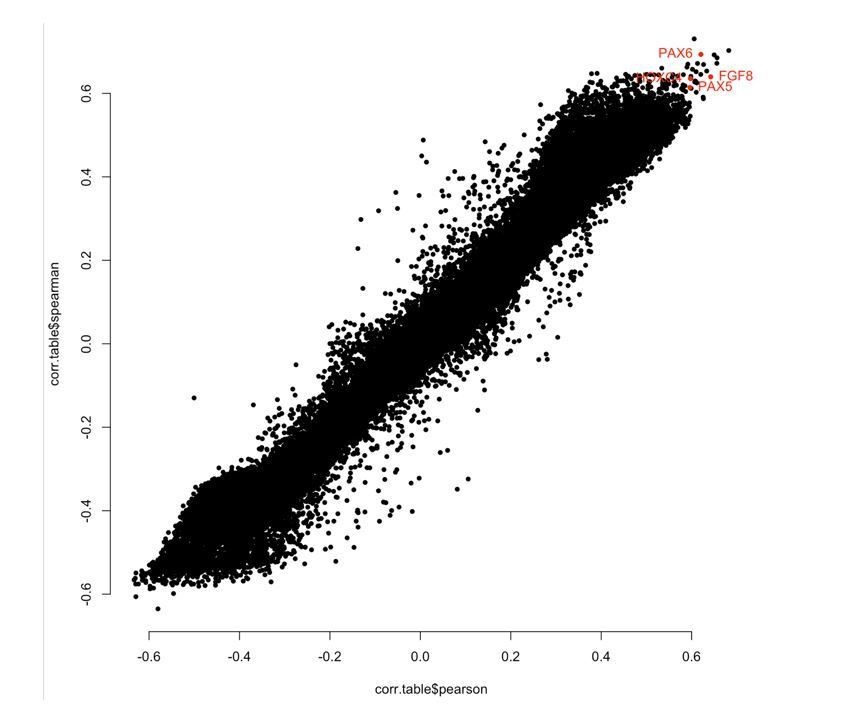
Author response image 1
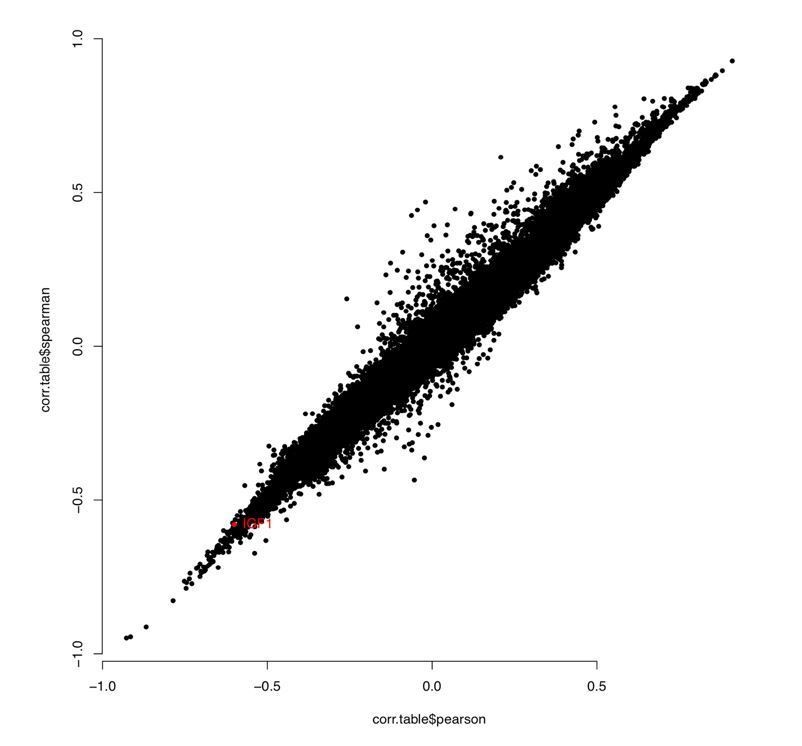
Author response image 2
Author response image 3
Additional files
-
Supplementary file 1
Pearson correlation between age and methylation for all sheep.
- https://cdn.elifesciences.org/articles/64932/elife-64932-supp1-v2.csv
-
Supplementary file 2
Gene Ontology output for the top 500 probes positively associated with age.
- https://cdn.elifesciences.org/articles/64932/elife-64932-supp2-v2.csv
-
Supplementary file 3
Androgen-sensitive differentially methylated probes.
- https://cdn.elifesciences.org/articles/64932/elife-64932-supp3-v2.csv
-
Transparent reporting form
- https://cdn.elifesciences.org/articles/64932/elife-64932-transrepform-v2.docx
Download links
A two-part list of links to download the article, or parts of the article, in various formats.
Downloads (link to download the article as PDF)
Open citations (links to open the citations from this article in various online reference manager services)
Cite this article (links to download the citations from this article in formats compatible with various reference manager tools)
Castration delays epigenetic aging and feminizes DNA methylation at androgen-regulated loci
eLife 10:e64932.
https://doi.org/10.7554/eLife.64932


