Non-canonical H3K79me2-dependent pathways promote the survival of MLL-rearranged leukemia
- Department of Molecular Genetics and Cell Biology, The University of Chicago, United States
- Pritzker School of Medicine, The University of Chicago, United States
- Department of Biochemistry and Molecular Biology, The University of Chicago, United States
Figures
Figure 1 with 1 supplement
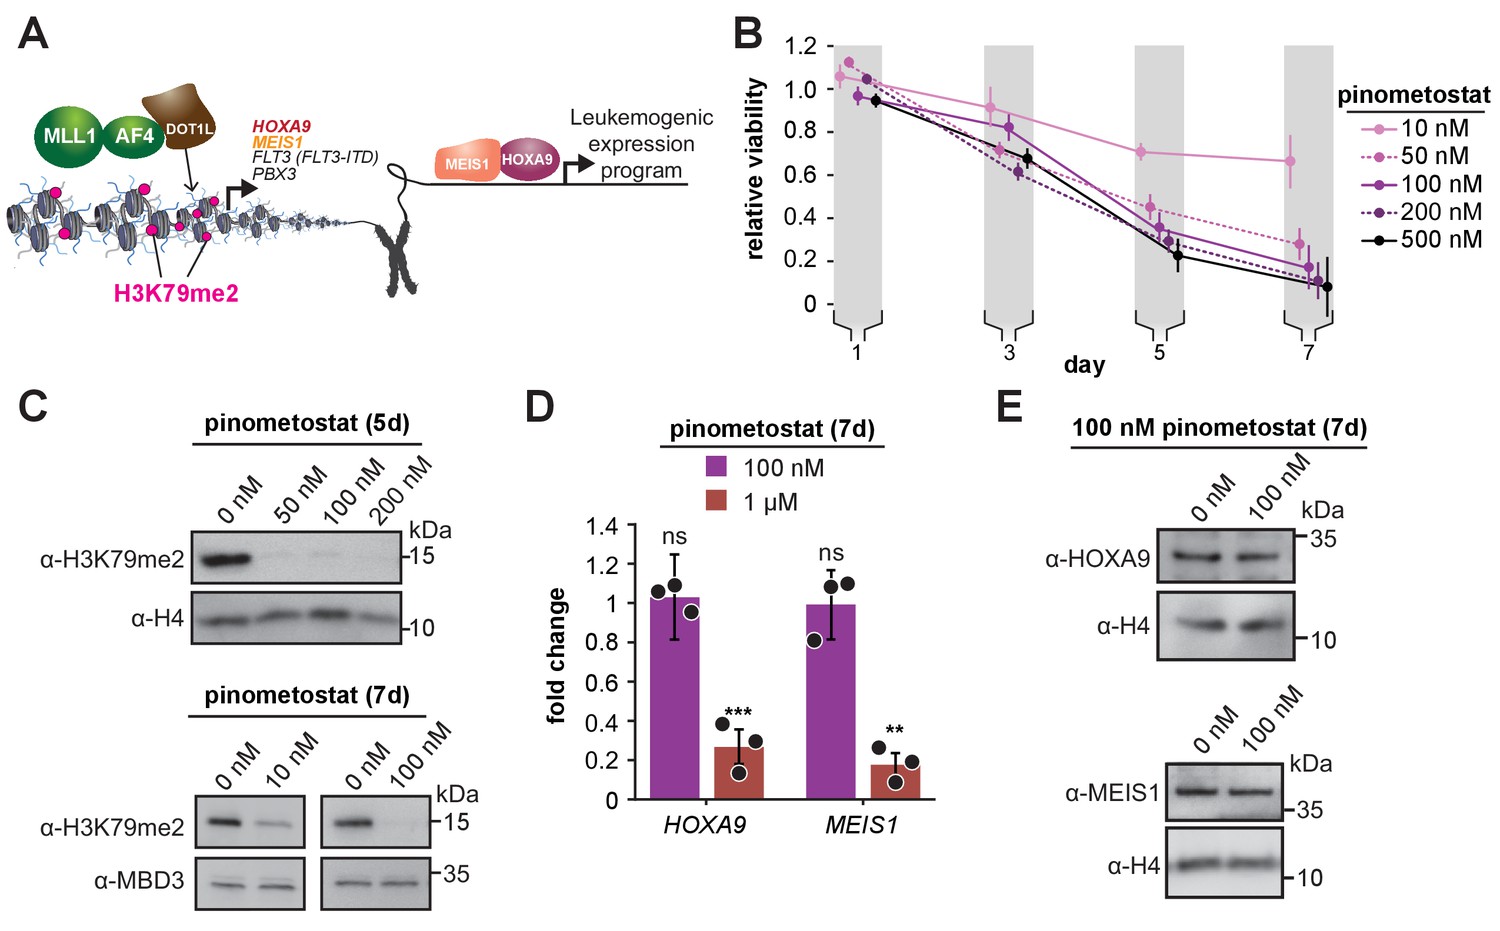
Low doses of DOT1L inhibitor ablate bulk H3K79me2 and curtail MV4;11 proliferation without impacting expression of canonical target genes.
(A) Conventional model depicting how DOT1L methyltransferase activity activates transcription of key proliferative oncogenic transcription factors (Okada et al., 2005; Bernt et al., 2011; Guenther et al., 2008; Armstrong et al., 2002; Zeisig et al., 2004; Kroon et al., 1998). (B) Proliferation assay of MV4;11 cells treated with the indicated concentrations of the DOT1L inhibitor pinometostat (EPZ5676). Cell viability was assayed every 2 days, starting 1 day after treatment commenced using the CellTiter Glo 2.0 reagent. Relative cell viability is presented as the mean fraction of pinometostat versus cells treated with the equivalent volume of DMSO from three independent experiments ± S.E.M. (C) Western blots for H3K79me2 with H4 or MBD3 loading controls in MV4;11 cells treated with 10–200 nM pinometostat for 5 or 7 days. (D) RT-qPCR analysis of HOXA9 and MEIS1 expression fold-change in MV4;11 cells treated with 100 nM or 1 µM pinometostat for 7 days. Results are shown as mean ± S.E.M. of three independent experiments. Student’s t-test (ns p > 0.05, ** p ≤ 0.01, *** p ≤ 0.001). (E) Western blot of HOXA9 and MEIS1 with H4 as a loading control from MV4;11 cells treated with 100 nM pinometostat for 7 days.
Figure 1—figure supplement 1

Low-dose DOT1L inhibition has little effect on Hox gene expression.
(A) Proliferation assay of MV4;11 cells treated with the DOT1L inhibitor SGC0946 using CellTiter-Glo 2.0 to measure viability represented as the luminescence fraction of treated over mock-treated cells. Data are represented as mean ± SE of three independent experiments. (B) RT-qPCR analysis of HOXA9 and MEIS1 expression in MV4;11 cells ± 50 nM SGC0946 DOT1L inhibitor for 7 days. Results are displayed as mean fold-change vs. DMSO-treated cells ± S.E.M. of three independent experiments. Student’s t-test (ns p > 0.05). (C) Bar graph of Cuffdiff (Trapnell et al., 2012) output for non-native RNA ‘spike-ins’ for ± 100 nM pinometostat cDNA libraries used for RNA-seq from MV4;11 cells. Bar graphs represent the average of three independent experiments ± S.E.M. Student’s t-test (ns p > 0.05). (D) Venn diagram displaying the overlap between genes upregulated in MV4;11 cells by 100 nM pinometostat treatment (7 days) and treatment with 3 µM of the pinometostat-related compound EPZ004777 for 6 days (Daigle et al., 2011). (E) Bar graph of Cuffdiff (Trapnell et al., 2012) output for the expression of HOXA cluster genes and HOX domain-containing oncogenes MEIS1, RUNX1, and PBX3 from RNA-seq in MV4;11 cells ± 100 nM pinometostat. Values are represented as log10 (FPKM + 1) for three independent experiments with standard deviation. Student’s t-test (ns p > 0.05, * p < 0.05, ** p < 0.01). (F) RT-qPCR analysis of SPI1 and CEBPA expression from three independent experiments of MV4;11 cells treated with 100 nM pinometostat for 7 days. Fold change over DMSO-treated cells is depicted ± S.E.M. Student’s t-test (ns p > 0.05, ** p < 0.01).
Figure 2 with 1 supplement
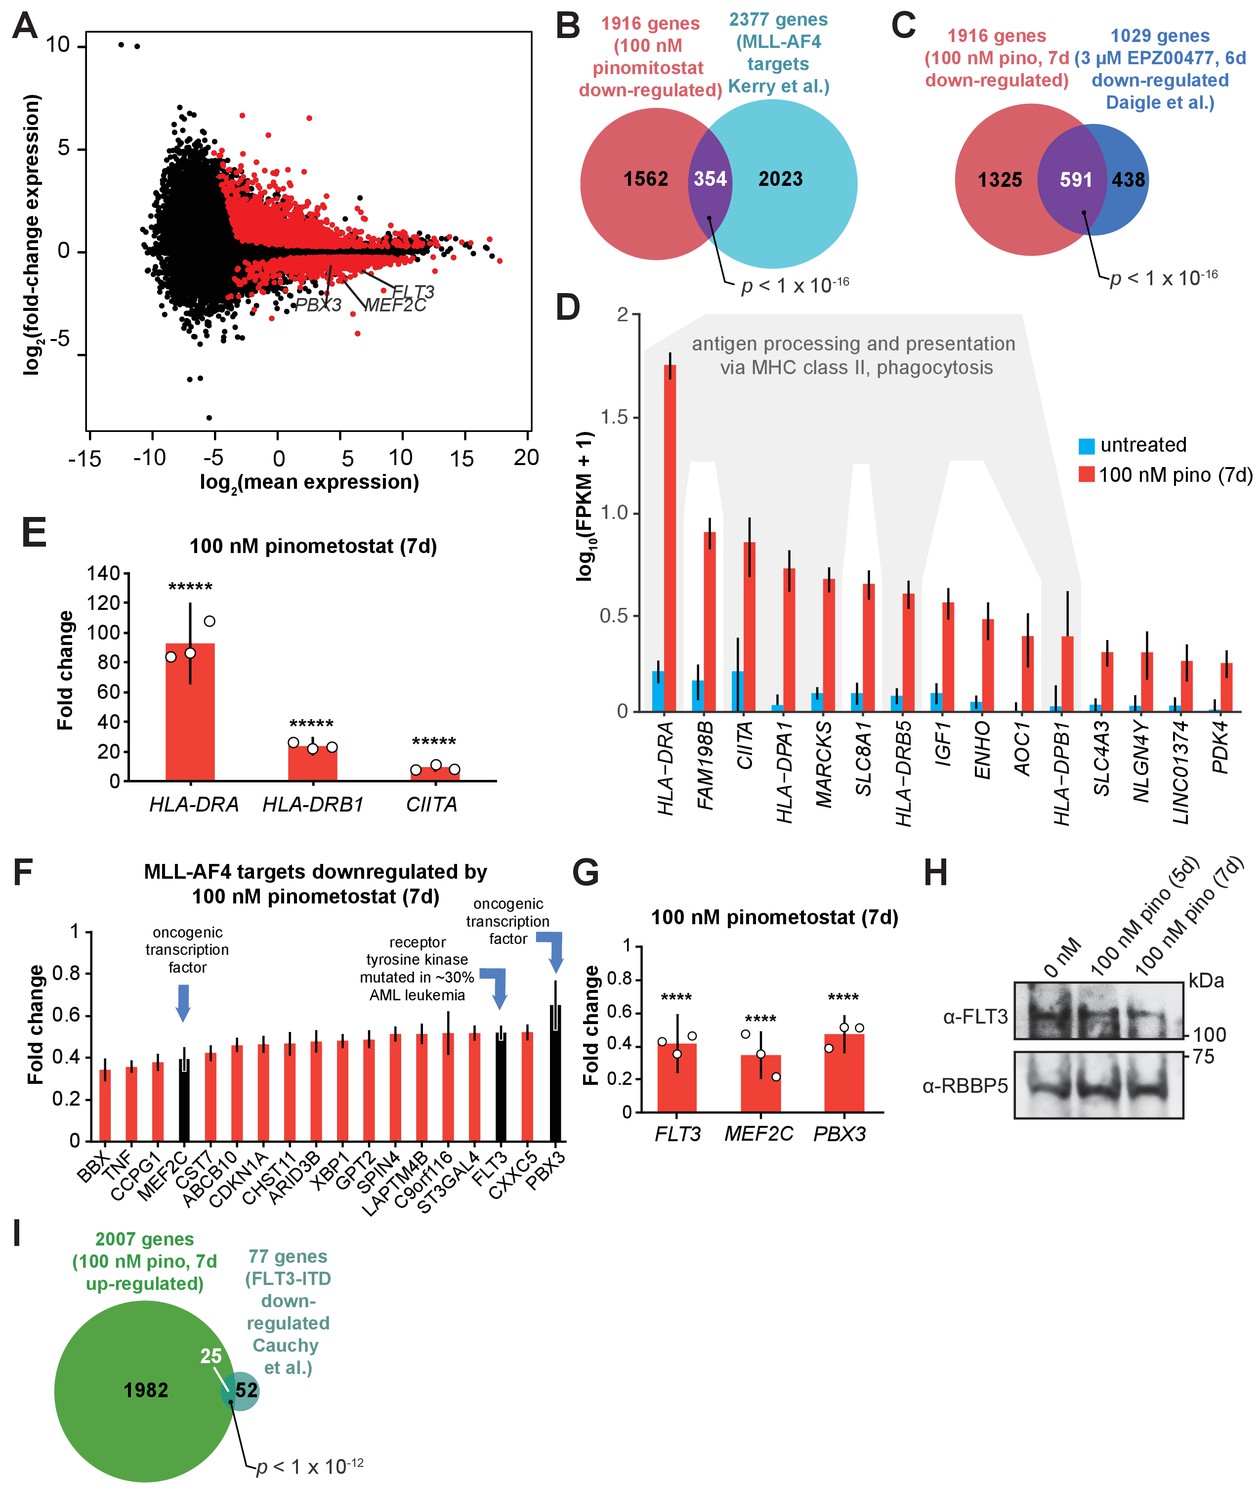
DOT1L inhibition downregulates a subset of MLL-AF4 targets including the leukemic oncogene FLT3.
(A) MA plot showing genes differentially expressed in MV4;11 cells treated with 100 nM pinometostat or DMSO 7 days as log2-mean of expression (FPKM) of the DMSO and pinometostat-treated samples versus the log2-fold change of the mean normalized pinometostat versus DMSO-treated FPKM for three independent replicates. Red represents genes that meet the significance threshold, with an FDR-adjusted p ≤ 0.5. (B) Venn diagram depicting overlapping genes between those downregulated by 100 nM pinometostat and MV4;11 MLL-AF4 targets identified by Kerry et al., 2017, p-value computed by two-tailed Fisher Exact test. (C) Venn diagram displaying the overlap between genes downregulated in MV4;11 cells by 100 nM pinometostat treatment (7 days) and treatment with 3 µM of the pinometostat-related compound EPZ004777 for 6 days (Daigle et al., 2011). p-Value computed by two-tailed Fisher Exact test. (D) Bar plot depicting upregulated genes with the highest fold changes from RNA-seq analysis of three independent experiments of DMSO- (blue) or pinometostat-treated (red) MV4;11 cells with uncertainty presented as the standard deviation computed by CuffDiff (Trapnell et al., 2012) with immune response genes outlined in gray. (E) RT-qPCR analysis showing the fold-change for HLA-DRA, HLA-DRB1, and CIITA gene expression in MV4;11 cells ± 100 nM pinometostat treatment for 7 days. Results are shown as mean ± S.E.M. of three independent experiments. Student’s t-test (*****p ≤ 0.00001). (F) Bar plot depicting the top pinometostat-downregulated genes from the RNA-seq analysis that are previously described MLL-AF4 targets (Guenther et al., 2008) including the oncogenes MEF2C, FLT3, and PBX3. (G) RT-qPCR analysis of MEF2C, FLT3, and PBX3 expression in MV4;11 cells ± with 100 nM pinometostat for 7 days. Results are displayed as mean fold-change ± S.E.M. of three independent experiments; Student’s t-test (**** p ≤ 0.0001). (H) Western blot for FLT3 with RBBP5 as loading control in MV4;11 cells treated with 100 nM pinometostat for 5 or 7 days. (I) Venn diagram displaying the overlap between genes upregulated in MV4;11 cells by 100 nM pinometostat treatment (7 days) and genes downregulated in leukemic cells from patients with FLT3-ITD vs normal FLT3 karyotypically normal AML (Cauchy et al., 2015). p-Value computed by two-tailed Fisher Exact test.
Figure 2—figure supplement 1
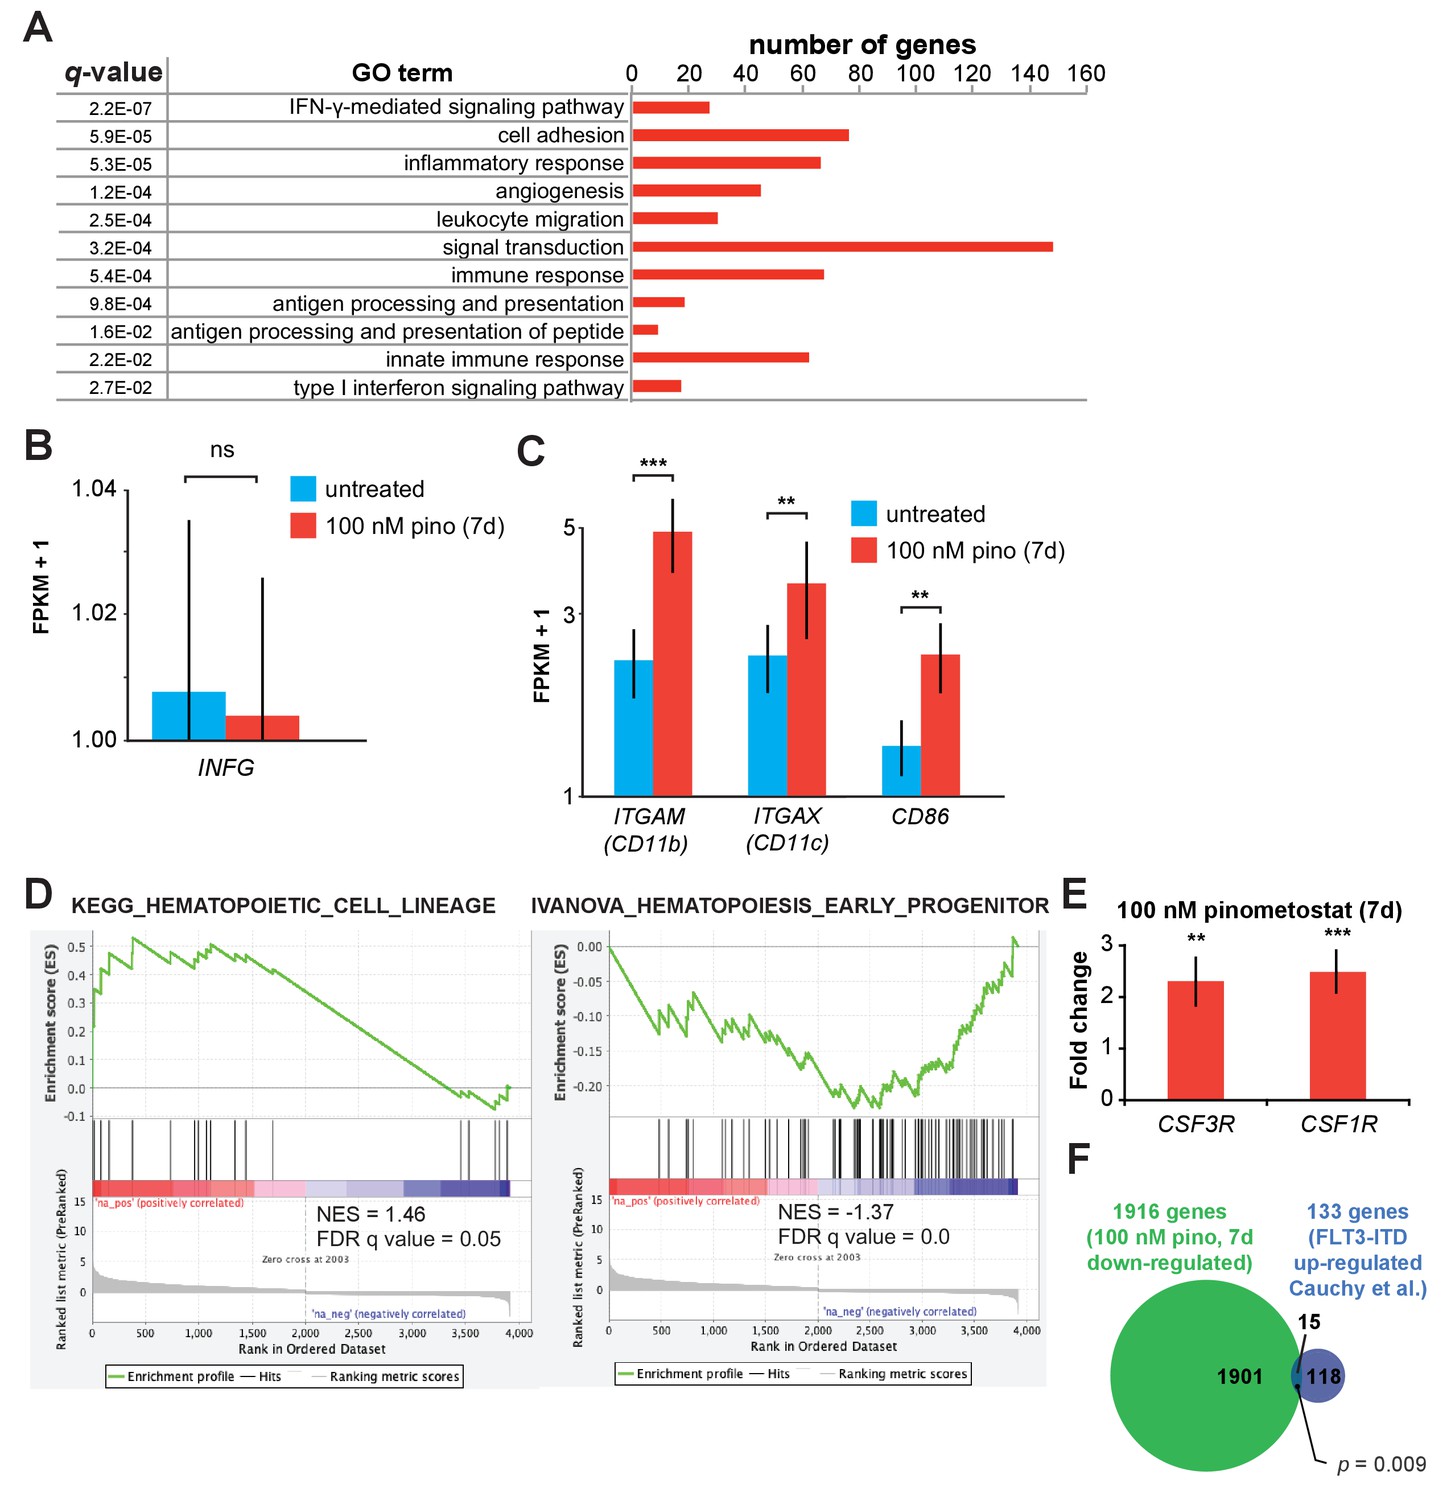
DOT1L inhibition upregulates components of the interferon gamma pathway and markers of differentiation.
(A) Gene Ontology analysis (DAVID) (Huang et al., 2009a; Huang et al., 2009b) of pinometostat-upregulated genes showing top functional classification categories and the number of genes in each category that are significantly upregulated. (B) Bar graph of Cuffdiff (Trapnell et al., 2012) output for the expression of INFG (IFN-γ) from RNA-seq in MV4;11 cells ± 100 nM pinometostat. Values are represented as FPKM + 1 for three independent experiments with standard deviation. Student’s t-test (ns p > 0.05). (C) Bar graph of Cuffdiff (Trapnell et al., 2012) output for the expression of ITGAM (CD11b), ITGAX (CD11c), and CD86 macrophage cell surface marker expression in MV4;11 cells ± 100 nM pinometostat for 7 days. Values are represented as FPKM + 1 for three independent experiments with standard deviation. Student’s t-test (** p < 0.01, *** p ≤ 0.001). (D) GSEA (Subramanian et al., 2005; Mootha et al., 2003) of the set of differentially expressed genes in MV4;11 cells ± 100 nM pinometostat compared to KEGG_HEMATOPOIETIC_CELL_LINEAGE and IVANOVA_HEMATOPOIESIS_CELL_LINEAGE gene sets from the MSigDB data base. NES - normalized enrichment score. (E) RT-qPCR analysis of CSF3R and CSF1R expression in MV4;11 cells ± 100 nM pinometostat for 7 days. Results are displayed as mean fold-change vs. DMSO-treated cells ± S.E.M. of three independent experiments. Student’s t-test (** p < 0.01, *** p ≤ 0.001). (F) Venn diagram displaying the overlap between genes downregulated in MV4;11 cells by 100 nM pinometostat treatment (7 days) and genes upregulated in leukemic cells from patients with FLT3-ITD vs normal FLT3 karyotypically normal AML (Cauchy et al., 2015). p-Value computed by two-tailed Fisher Exact test.
Figure 3 with 1 supplement
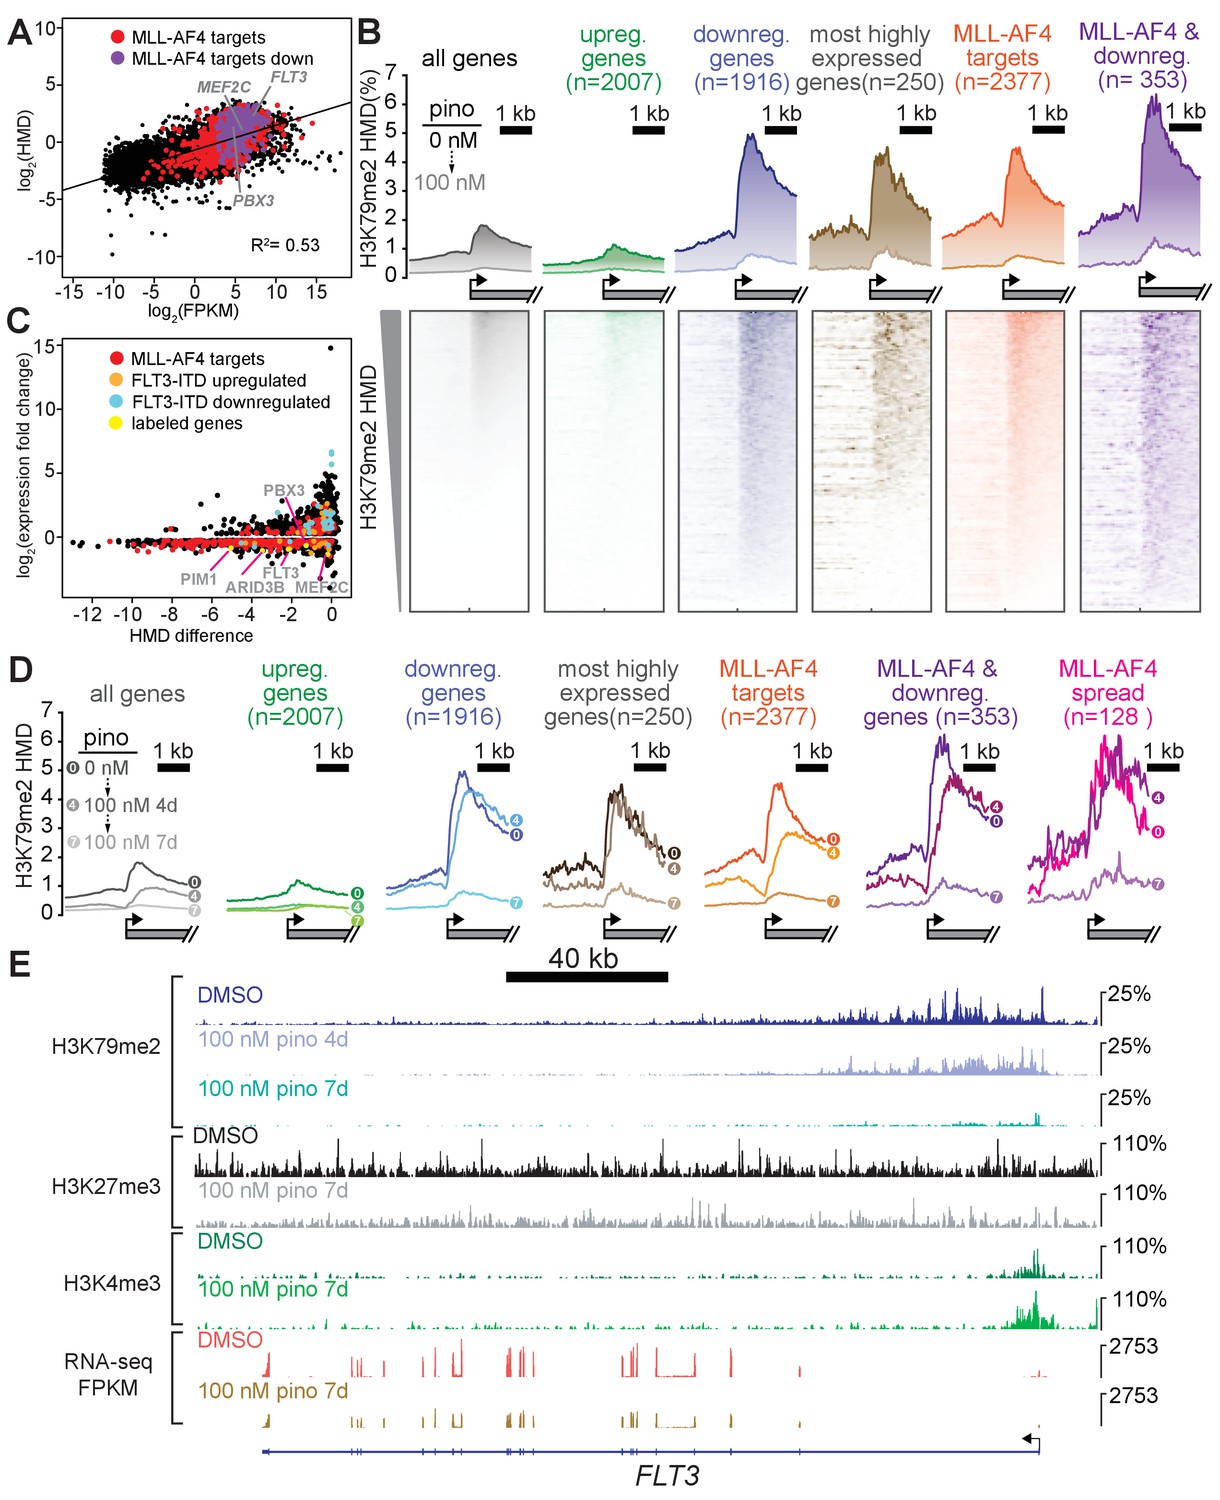
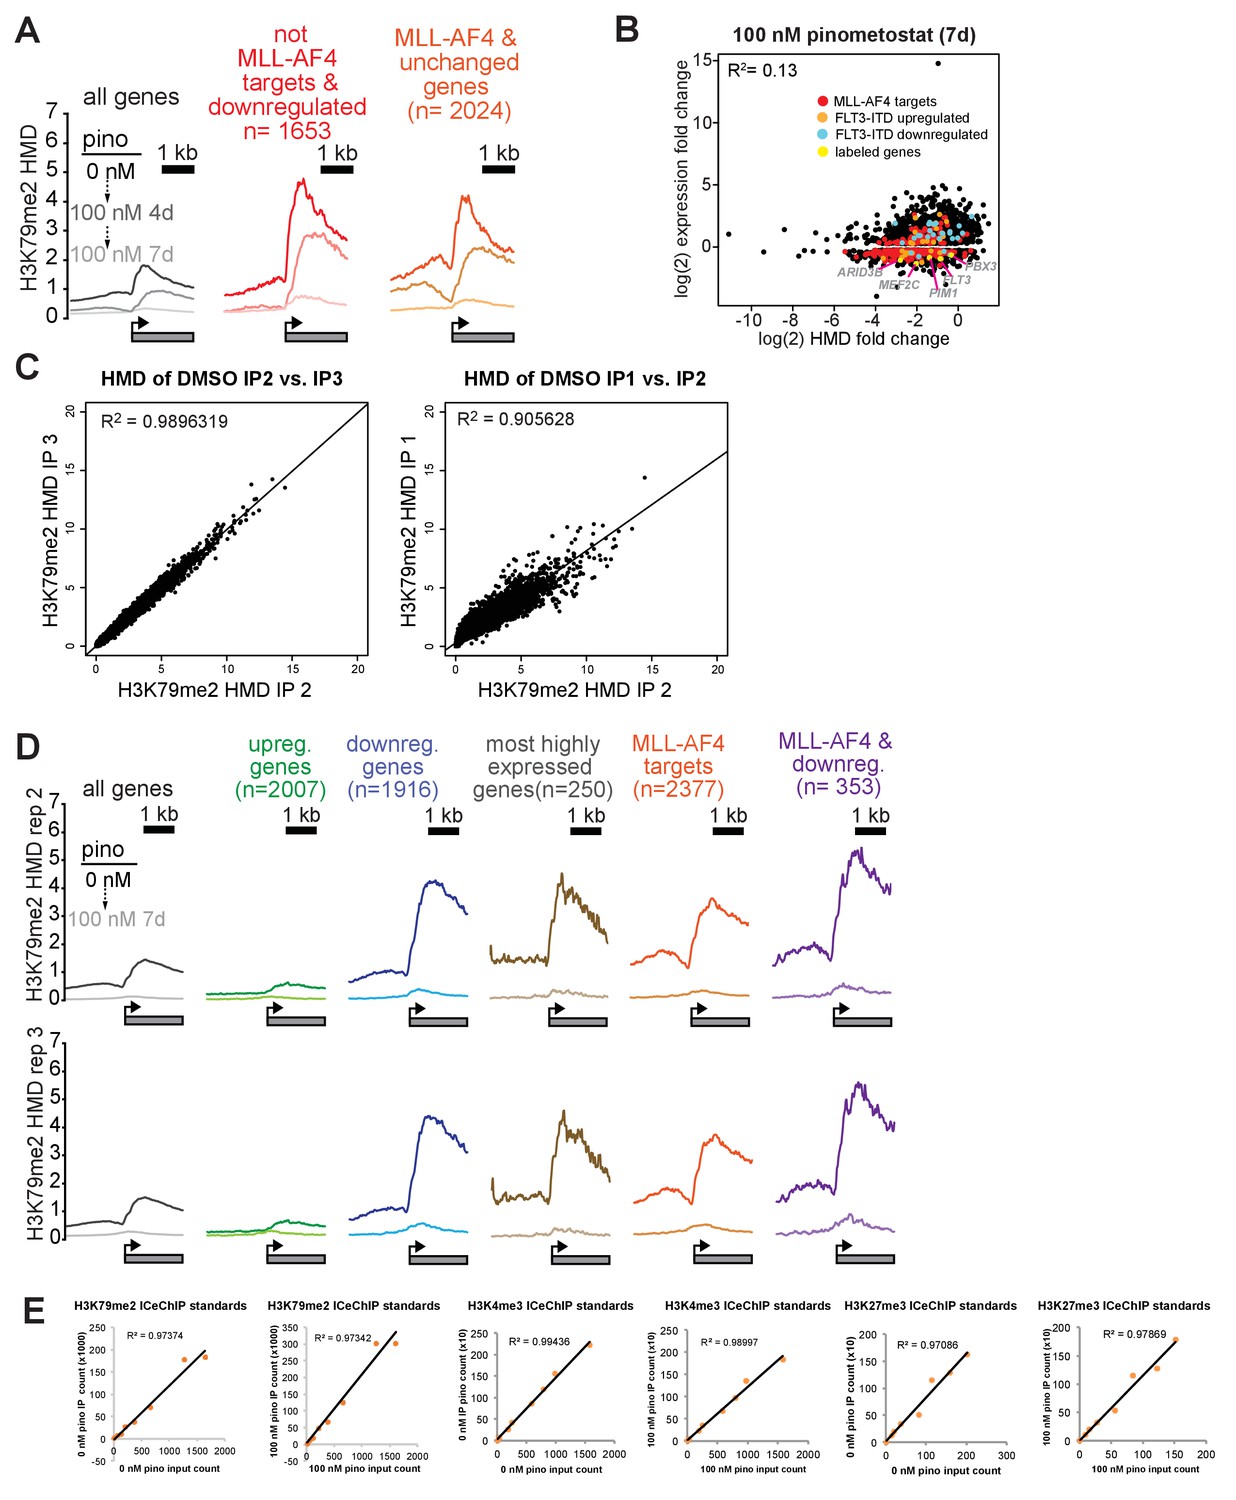
Low-dose DOT1L inhibition disrupts H3K79me2 with more pronounced effects on downregulated MLL-AF4 targets.
(A) Scatterplot of the mean normalized log2-FPKM (three independent replicates) of genes expressed in DMSO-treated MV4;11 cells plotted versus the log2-HMD (H3K79me2) for +1000 bp from the TSS. Colors signify: red, MLL-AF4 targets (Kerry et al., 2017); purple, MLL-AF4 targets downregulated by 100 nM pinometostat. (B) (top) Quantitative measurement of H3K79me2 modification density from ICeChIP-seq of MV4;11 cells treated with 100 nM pinometostat for 7 days contoured over the promoters (−2 to +two kp from the TSS) of indicated gene sets, including genes up- or down-regulated by 100 nM pinometostat, the most highly-expressed genes, MLL-AF4 target genes (Kerry et al., 2017) as well as those MLL-AF4 targets downregulated by 100 nM pinometostat. (bottom) Heatmaps depicting H3K79me2 density (HMD) for the gene promoter regions shown above ranked by HMD. (C) Scatterplot of genes in MV4;11 cells downregulated by 100 nM pinometostat depicting log2-fold change H3K79me2 HMD (+1000 bp from TSS) versus the log2-fold change of the mean normalized FPKM (three independent replicates) for 100 nM pinometostat or DMSO treated cells. Colors signify: red, MLL-AF4 targets (Kerry et al., 2017); orange, FLT3-ITD upregulated genes (Cauchy et al., 2015); blue, FLT3-ITD downregulated genes (Cauchy et al., 2015); yellow, labeled genes in gray font. (D) H3K79me2 meta promoter profiles as in B, but including curves for 100 nM pinometostat treatment at 4 days, and the promoter set where this complex spreads (Kerry et al., 2017). (E) The FLT3 locus as representative of an MLL-AF4 target (Kerry et al., 2017; Guenther et al., 2008) downregulated by 100 nM pinometostat, displaying MV4;11 ICeChIP-seq tracks for H3K79me2 100 nM pinometostat 4- and 7-day treatment and H3K27me3 and H3K4me3 tracks from 100 nM pinometostat 7-day treatment as well as DMSO control-treated cells and an RNA-seq track (FPKM) from a single replicate of 100 nM pinometostat 7-day treatment and DMSO-treated cells.
Figure 3—figure supplement 1
H3K79me2 loss is poorly correlated with reductions in gene expression.
(A) Plots of H3K79me2 density from ICeChIP-seq in MV4;11 cells treated with 100 nM pinometostat for 4 or 7 days. H3K79me2 modification density (HMD) is displayed from ± 2000 bp of the TSS of all genes expressed, non-MLL-AF4 targets (Kerry et al., 2017) downregulated by 100 nM pinometostat and MLL-AF4 targets not downregulated by 100 nM pinometostat. (B) Scatterplot of genes downregulated by 100 nM pinometostat plotted as the log2 fold-change in gene expression vs the log2 fold-change in HMD with MLL-AF4 targets in red, FLT3-ITD upregulated genes (Cauchy et al., 2015) in orange, FLT3-ITD downregulated genes (Cauchy et al., 2015) in cyan and labeled genes highlighted in yellow. Regression analysis of all genes (R2 = 0.13) or the MLL-AF4 target subset (R2 = 0.20) reveals poor correlation between the fold changes of H3K79me2 and RNA expression. (C) Scatterplot showing the reproducibility of H3K79me2 HMD from 0 to +2000 bp from the TSS from ICeChIP of (left) immunoprecipitation replicates performed simultaneously in MV4;11 cells treated with DMSO for 4 days; (Right) immunoprecipitation performed by different individuals on separate occasions from MV4;11 cells treated with DMSO for 4 or 7 days. (D) H3K79me2 HMD of ICeChIP replicates from MV4;11 cells ± 100 nM pinometostat from ± 2000 bp of the TSS of the gene groups identified, for comparison to replicate one presented in Figure 3D. (E) Scatterplots demonstrating the linearity of H3K79me2 calibrant immunoprecipitation from denaturative ICeChIP-seq from MV4;11 cells treated with 0 or 100 nM pinometostat for 7 days for replicate 1. Similar scatter plots for treated and untreated 7 day points for native ICeChIP of H3K4me3 and H3K27me3 ICeChIP are displayed.
Figure 4 with 1 supplement
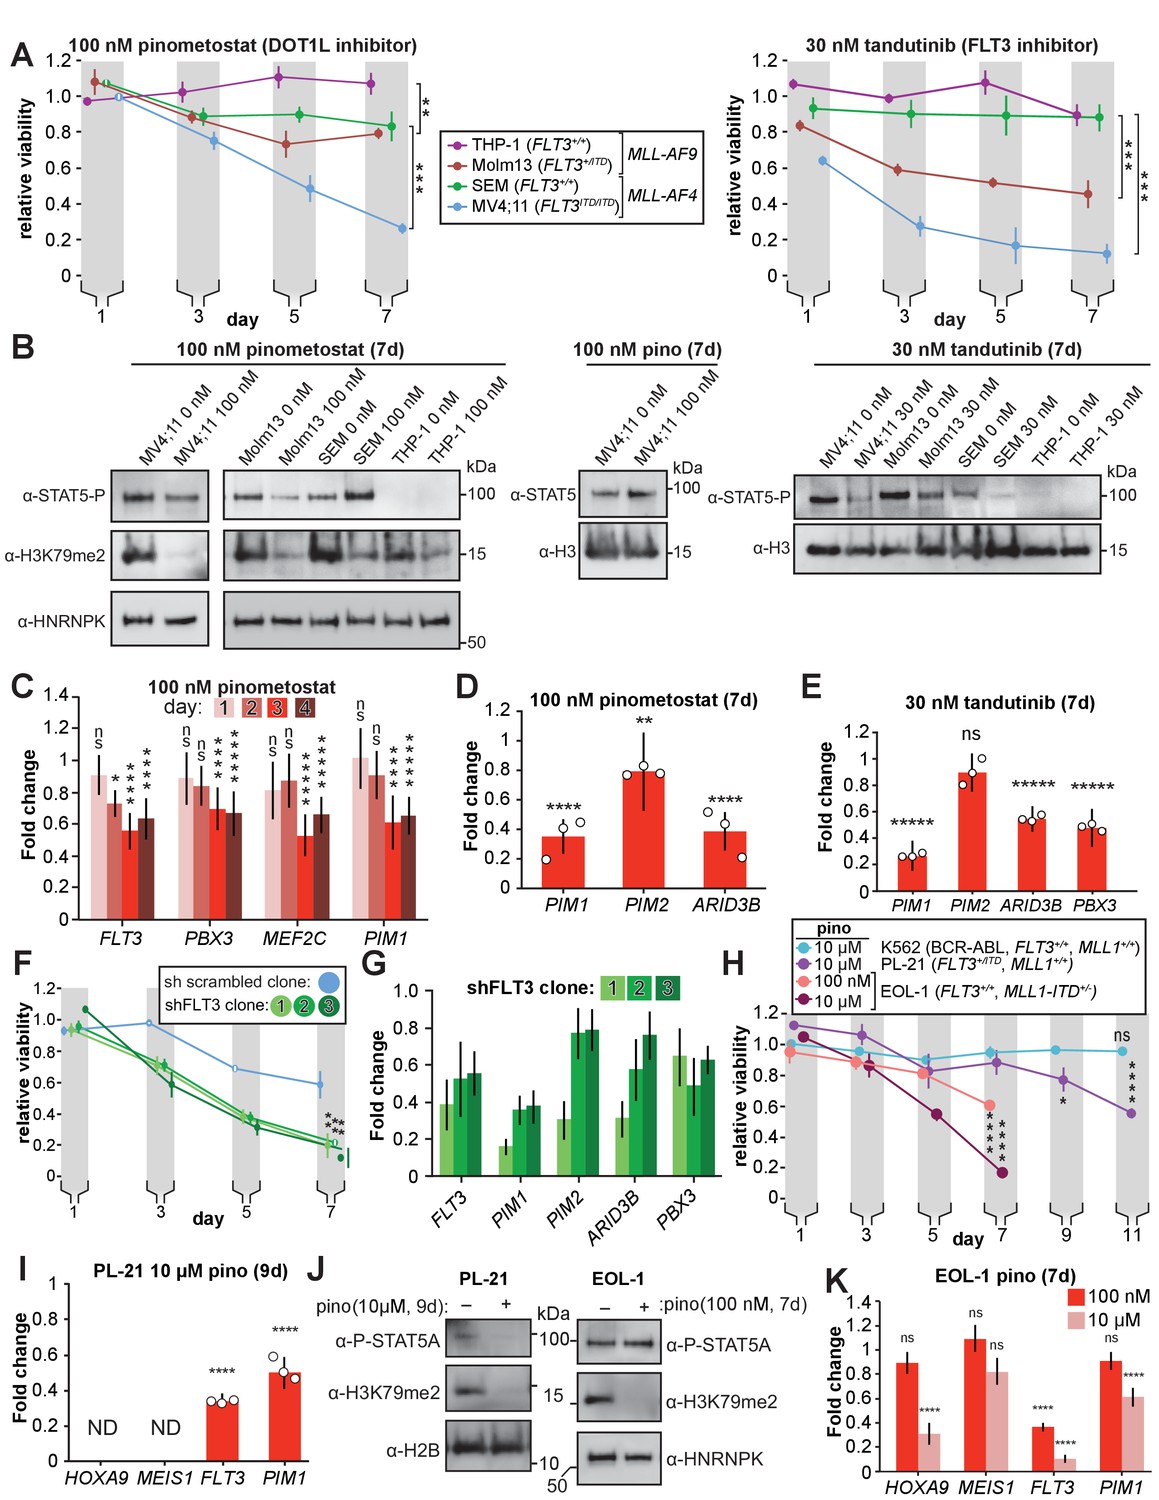
DOT1L inhibition reduces STAT5A activation and downregulates STAT5A targets in FLT3-ITD leukemia lines.
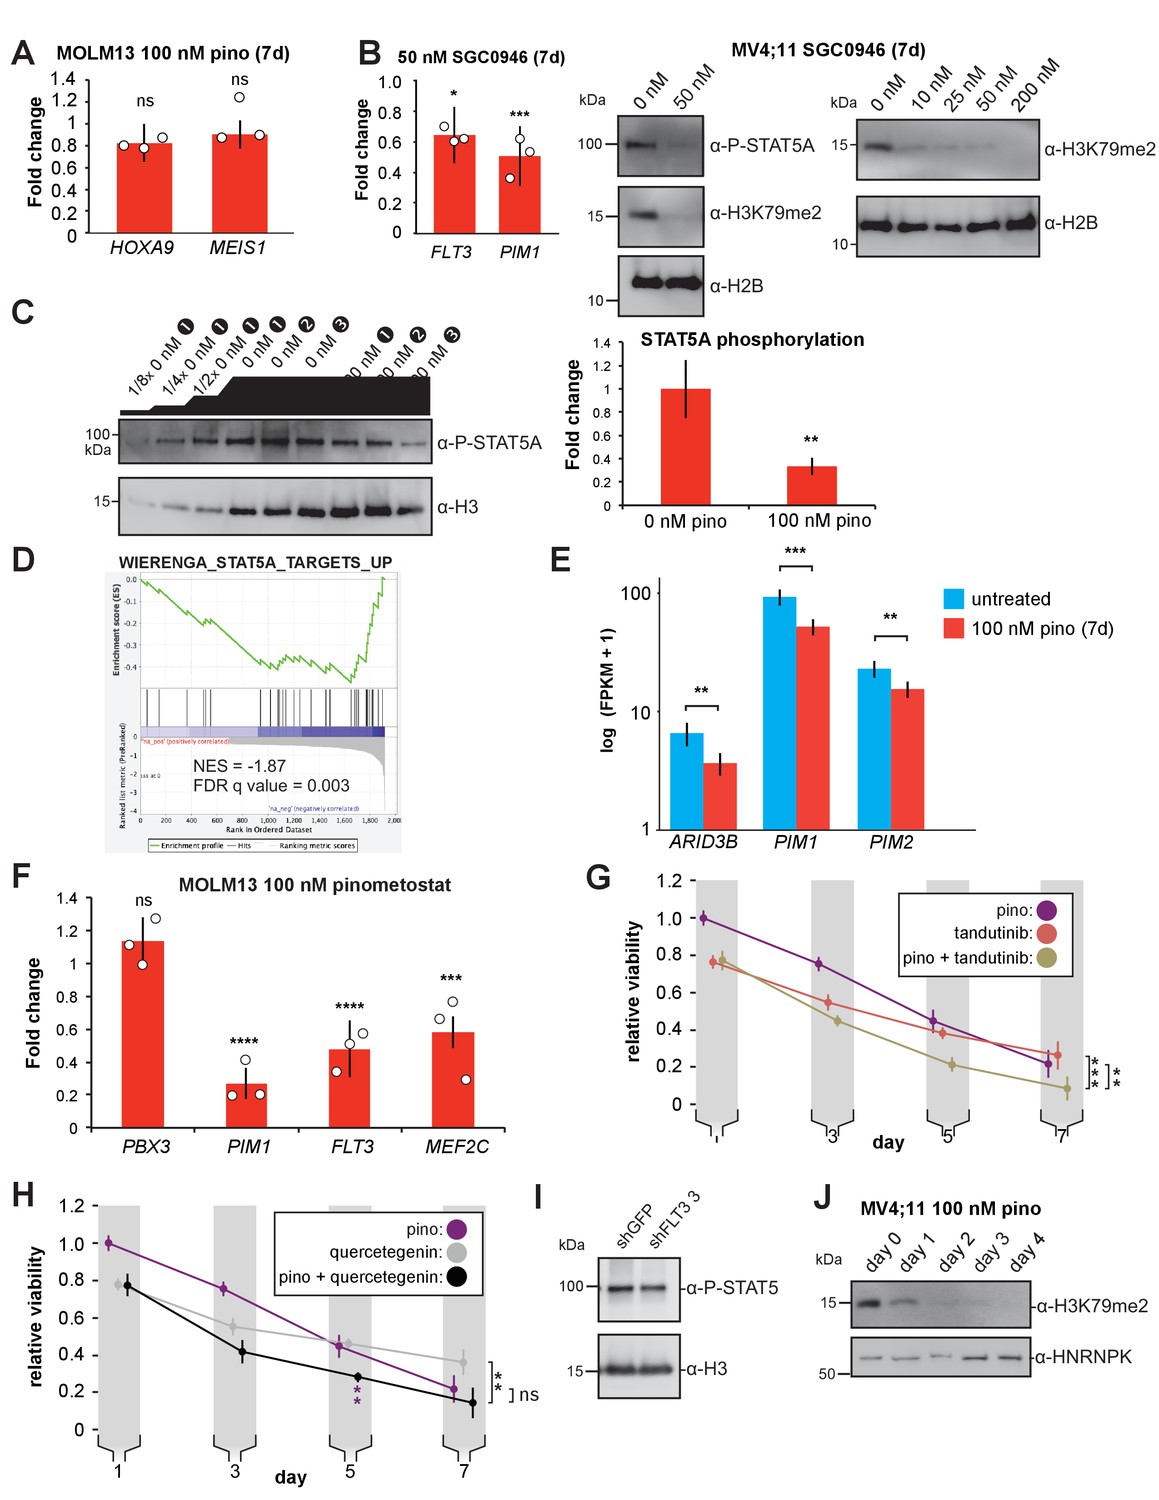
(A) MLL-rearranged leukemia lines with genotypes indicated were treated with 100 nM pinometostat (left panel, DOT1L inhibitor) or 30 nM tandutinib (right panel, FLT3 inhibitor MLN518), and relative growth monitored by CellTiter Glo 2.0 assay on the indicated days. Relative viability presented is the mean fraction of luminescence of treated versus side-by-side mock treated cultures (same volume of DMSO) for three independent replicates ± S.E.M. Student’s t-test (** p ≤ 0.01, *** p ≤ 0.001). (B) Western blots of phosphorylated STAT5 (active) or total STAT5A with H3 or HNRNPK as loading controls across the cell lines from panel A treated as indicated; H3K79me2 is monitored in pinometostat-treated lines to confirm inhibition. (C) Time course of gene expression by RT-qPCR, presented as mean fold-change of FLT3, PBX3, PIM1, and MEF2C in MV4;11 cells ± 100 nM pinometostat at each time point indicated ± S.E.M.; n = 3; Student’s t-test (ns p > 0.05, * p ≤ 0.05, **** p ≤ 0.0001, ***** p < 0.00001). (D-E) DOT1L and FLT3 inhibition downregulate STAT5A targets in FLT3-ITD. RT-qPCR expression analysis presented as mean fold-change ± S.E.M. for the indicated transcript in MV4;11 cells treated with indicated inhibitor versus mock-treatment for 7 days. Student’s t-test (** p < 0.01, **** p < 0.0001, ***** p < 0.00001). (F) Proliferation assay as in panel A, with three clonal populations of MV4;11 cells virally transduced, selected, then induced to express shRNA to FLT3 (Green et al., 2015) or a scrambled shRNA (Yuan et al., 2009) control by 1 µg/mL doxycycline. Means of fractional viability relative to uninduced cells ± S.E.M. are shown for three independent experiments; Student’s t-test (** p < 0.01). (G) RT-qPCR analysis of PIM1, PIM2, and ARID3B expression in MV4;11 cells expressing an inducible shRNA targeting FLT3 (Green et al., 2015) for 7 days. Results are depicted as fold-change expression of control cells expressing shRNA to GFP (Scheeren et al., 2005). (H) Proliferation assay of K562, PL-21, and EOL-1 cells treated with 10 µM or 100 nM pinometostat using CellTiter Glo 2.0 to measure viability, showing the luminescence fraction of inhibited over DMSO-treated cells. Means ± SE are shown for three independent experiments. Student’s t-test of day 7 (EOL-1 cells), day 9 (PL-21), or days 9 and 11 (K562 and PL-21) values: ns p > 0.05, * p < 0.05, **** p < 0.0001. (I) Gene expression analysis by RT-qPCR in PL-21 cells treated for 9 days with 10 µM pinometostat. Results are displayed as fold-change over DMSO-treated cells with means ± SE for three independent experiments (ND = not detected). Student’s t-test (**** p < 0.0001). (J) Western blots of (left) cell extract from PL-21 cells treated with 10 µM pinometostat for 9 days and (right) EOL-1 cells treated with 100 nM pinometostat for 7 days and then blotted for H3K79me2 and p-STAT5 with H2B or HNRNPK as a loading controls. (K) Gene expression analysis by RT-qPCR in EOL-1 cells treated for 7 days with 100 nM or 10 µM pinometostat. Results are displayed as fold-change over DMSO-treated cells with means ± SE for three independent experiments. Student’s t-test (ns p > 0.05, **** p < 0.0001).
Figure 4—figure supplement 1
FLT3 knockdown reduces STA5A activation.
(A) RT-qPCR analysis of HOXA9 and MEIS1 expression from three independent experiments of MOLM13 cells treated with 100 nM pinometostat for 7 days. Fold change over DMSO-treated cells is depicted ± S.E.M. Student’s t-test (ns p > 0.05). (B) (left) RT-qPCR analysis of FLT3 and PIM1 expression in MV4;11 cells ± 50 nM SGC0946 for 7 days. Results are displayed as mean fold-change vs. DMSO-treated cells ± S.E.M. of three independent experiments. Student’s t-test (* p < 0.05, *** p ≤ 0.001). (right) Western blots from MV4;11 cells (left) treated with 50 nM SGC0946 for 7 days blotted for phosphorylated STAT5, H3K79me2, or histone H2B as a loading control. (right) MV4;11 cells treated with increasing concentrations of SGC0946 for 7 days blotted for H3K79me2 or H2B as a loading control. (C) Quantitative western blot of whole cell extracts from 3 experiments of MV4;11 cells ± 100 nM pinometostat for 7 days, stained with antibodies for phosphorylated STAT5 or histone H3 as a loading control. The blot includes a dilution series of the extract from the DMSO-treated sample one that encompasses the range of signal observed in each of the replicates and is used to calibrate a relative quantification of phosphorylated STAT5A signal integrated in ImageJ and shown in the bar graph at right as a 65 ± 8% reduction of the DMSO treated samples ± SD. Student’s t-test (** p < 0.01). (D) Gene Set Enrichment Analysis (GSEA) (Subramanian et al., 2005; Mootha et al., 2003) of the set of downregulated genes in MV4;11 cells ± 100 nM pinometostat compared to genes upregulated by exogenous expression of constitutively active STAT5A in the WIERENGA_STAT5A_TARGETS GROUP1 gene set (Wierenga et al., 2008) from the MSigDB database. (E) Bar graph of Cuffdiff (Trapnell et al., 2012) output for the expression of STAT5A targets ARID3B, PIM1, and PIM2 from RNA-seq in MV4;11 cells ± 100 nM pinometostat. Values are represented as log(10) FPKM + 1 for three independent experiments with standard deviation. Student’s t-test (** p < 0.01, *** p < 0.001). (F) RT-qPCR analysis of PBX3, PIM1, FLT3, and MEF2C expression from three independent experiments of MOLM13 cells treated with 100 nM pinometostat for 7 days. Fold change over DMSO-treated cells is depicted ± S.E.M. Student’s t-test (ns p > 0.05, *** p < 0.001, **** p < 0.0001). (G) Proliferation assay of MV4;11 cells treated with DOT1L or FLT3 inhibitors alone or in combination using CellTiter Glo 2.0 to measure viability, showing the luminescence fraction of inhibited over uninhibited cells. Data are represented as mean ± SE of three independent experiments. Student’s t-test for significance of day 7 values: 100 nM pinometostat vs. combined ** p < 0.01, 30 nM tandutinib vs combined *** p < 0.001. (H) Same as G but cells were treated with DOT1L and PIM1 inhibitors alone or in combination. Student’s t-test of day 7 values: 100 nM pinometostat vs. combined * p < 0.05, 10 µM quercetagenin vs combined ** p < 0.01. Purple asterisks indicate Student’s t-test for significance of day 5 for 100 nM pinometostat vs. combination treatment ** p < 0.01. (I) Western blots of MV4;11 cell extract from clonal cell lines expressing shRNA to FLT3 (clone 3) or GFP blotted for phosphorylated STAT5 or histone H3 as a loading control. (J) Western blots of cell extract from MV4;11 cells treated with 100 nM pinometostat for the indicated number of days and then blotted for H3K79me2 and HNRNPK as a loading control.
Figure 5 with 1 supplement

Exogenous expression of constitutively active STAT5A partially rescues proliferation and gene expression effects of DOT1L inhibition.
(A) RT-qPCR analysis of STAT5A expression from three monoclonal isolates of MV4;11 cells virally transduced with a tet-inducible constitutively active STAT5A (STAT5A-CA) depicted as fold-change over untransduced cells with standard error of the mean. Student’s t-test (* p < 0.05, *** p < 0.001). (B) Proliferation assay of MV4;11 clonal isolates from panel A. induced to express STAT5A-CA or eGFP with 1 µg/mL doxycycline and treated concomitantly with 100 nM pinometostat. We determined the fractional viability of each clone as the luminescence from a CellTiter Glo 2.0 assay with pinometostat-treatment normalized to DMSO-treated cells, both induced to express STAT5A-CA or eGFP, to accommodate for any potential increases in viability. Means ± SE are shown for three independent experiments with Student’s t-test for day 7 values (**** p ≤ 0.0001). (C) Gene expression analysis by RT-qPCR of STAT5A target genes in WT MV4;11 cells or MV4;11 STAT5A-CA clones from A. induced with 1 µg/mL doxycycline and treated with 100 nM pinometostat for 7 days. Results are displayed as fold-change over DMSO-treated WT cells. (D) Quantitative measurement by flow cytometry of live, apoptotic (Annexin V-FITC) and necrotic cells (propidium iodide) of WT MV4;11 cells or cells exogenously expressing STAT5A-CA (clone 1) and treated with increasing concentrations of pinometostat. Images of gated FITC vs. PI signal are shown for one of three independent experiments, with all replicates quantified in the bar plot in E.
Figure 5—figure supplement 1

STAT5A-CA overexpression partially rescues proliferation and gene expression effects caused by FLT3 inhibition.
(A) Western blots of whole cell extracts from WT MV4;11 cells or three clonal lines isolated from MV4;11 cells virally transduced with constitutively active STAT5A (STAT5A-CA). Membranes were blotted for STAT5 or GAPDH as a loading control.(B) Proliferation assay of MV4;11 clonal isolates overexpressing STAT5A-CA or GFP through induction with 1 µg/mL doxycycline and treated with 30 nM tandutinib using CellTiter Glo 2.0 to measure viability, showing the luminescence fraction of inhibited over uninhibited cells, both with induced transgene (either STAT5A-CA or eGFP). Means ± SE are shown for three independent experiments. Student’s t-test of day 7 values: ** p < 0.01. (C) Proliferation assay done as in B. with MV4;11 WT or virally transduced with GFP or MEF2C-GFP and induced to express either construct with 1 µg/mL doxycycline and treated with 100 nM pinometostat. Means ± SE are shown for three independent experiments. Student’s t-test of day 7 values: ns p > 0.05. (D) Gene expression analysis by RT-qPCR of STAT5A target genes in WT MV4;11 cells or MV4;11 STAT5A-CA clones from A induced with 1 µg/mL doxycycline to express STAT5A-CA and treated with 30 nM tandutinib for 7 days. Results are displayed as fold-change over DMSO-treated WT cells. (E) Proliferation assay of MV4;11 STAT5A-CA clones or GFP as in B, treated with 50 nM SGC0946. Means ± SE are shown for three independent experiments. Student’s t-test of day 7 values: ** p < 0.01, * p < 0.05.
Figure 6 with 1 supplement
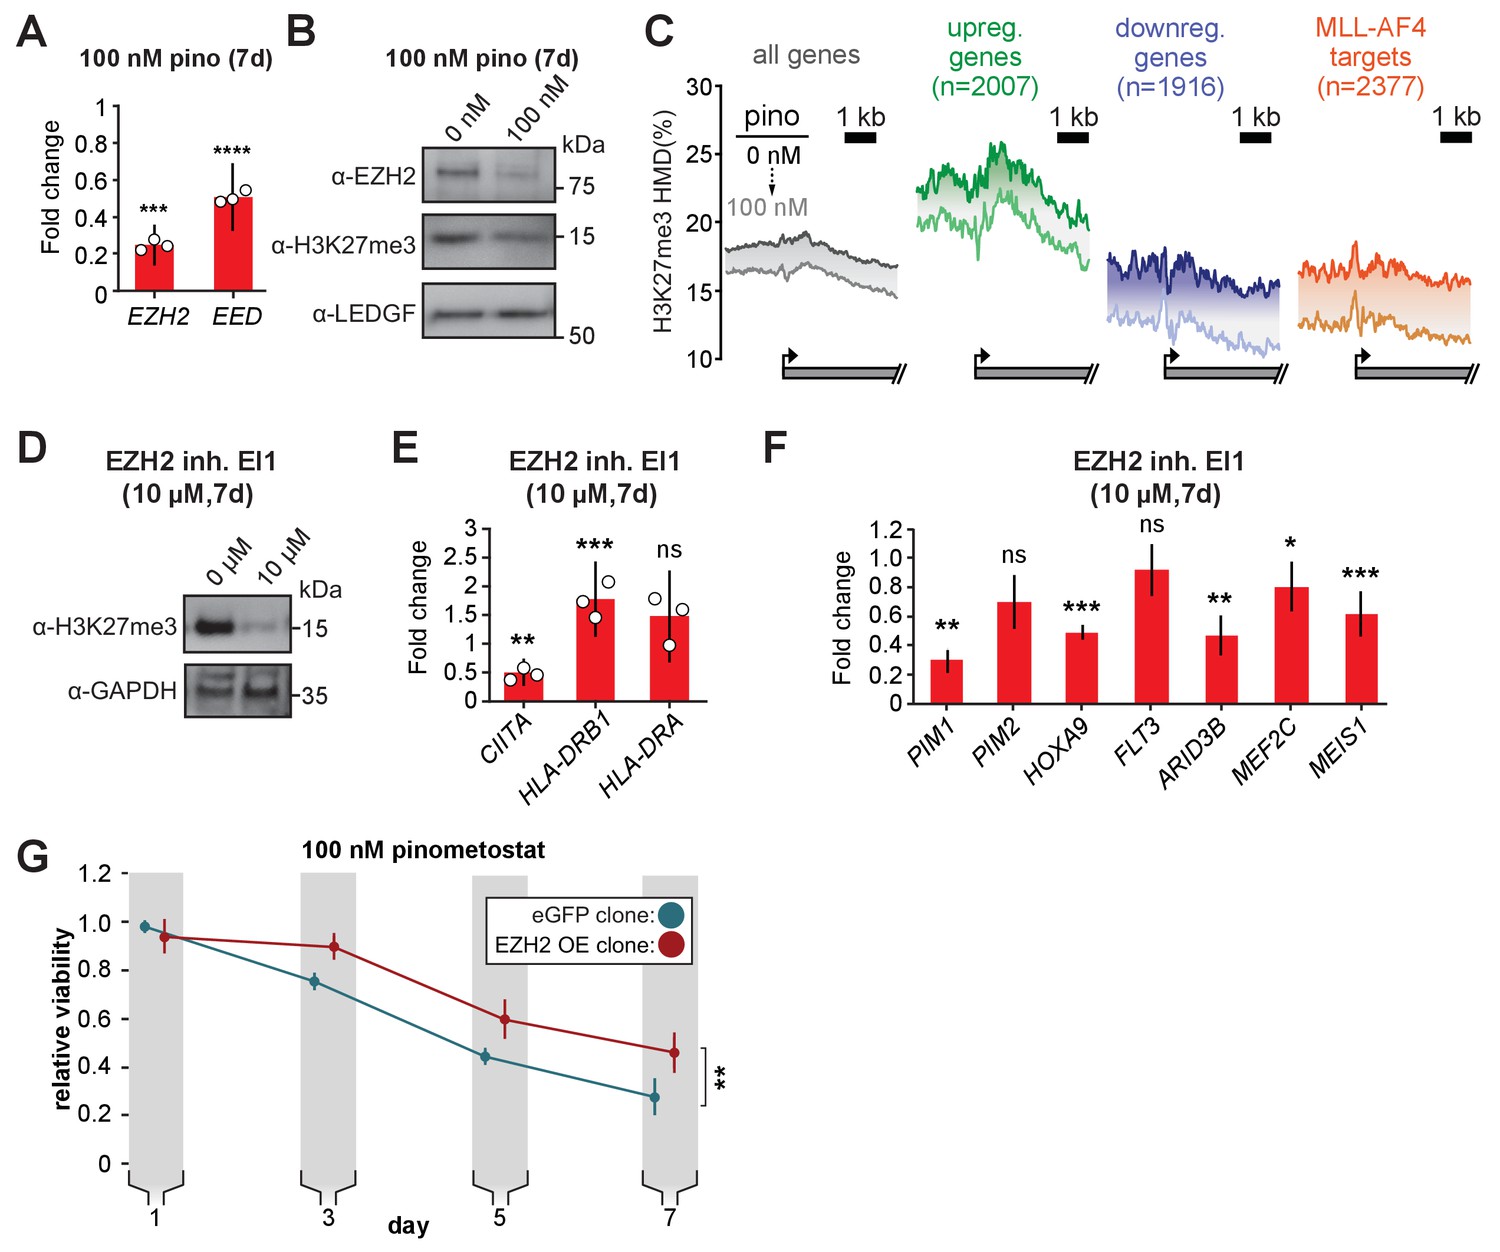
PRC2 function is an ancillary pathway dependent on DOT1L and necessary for leukemia proliferation.
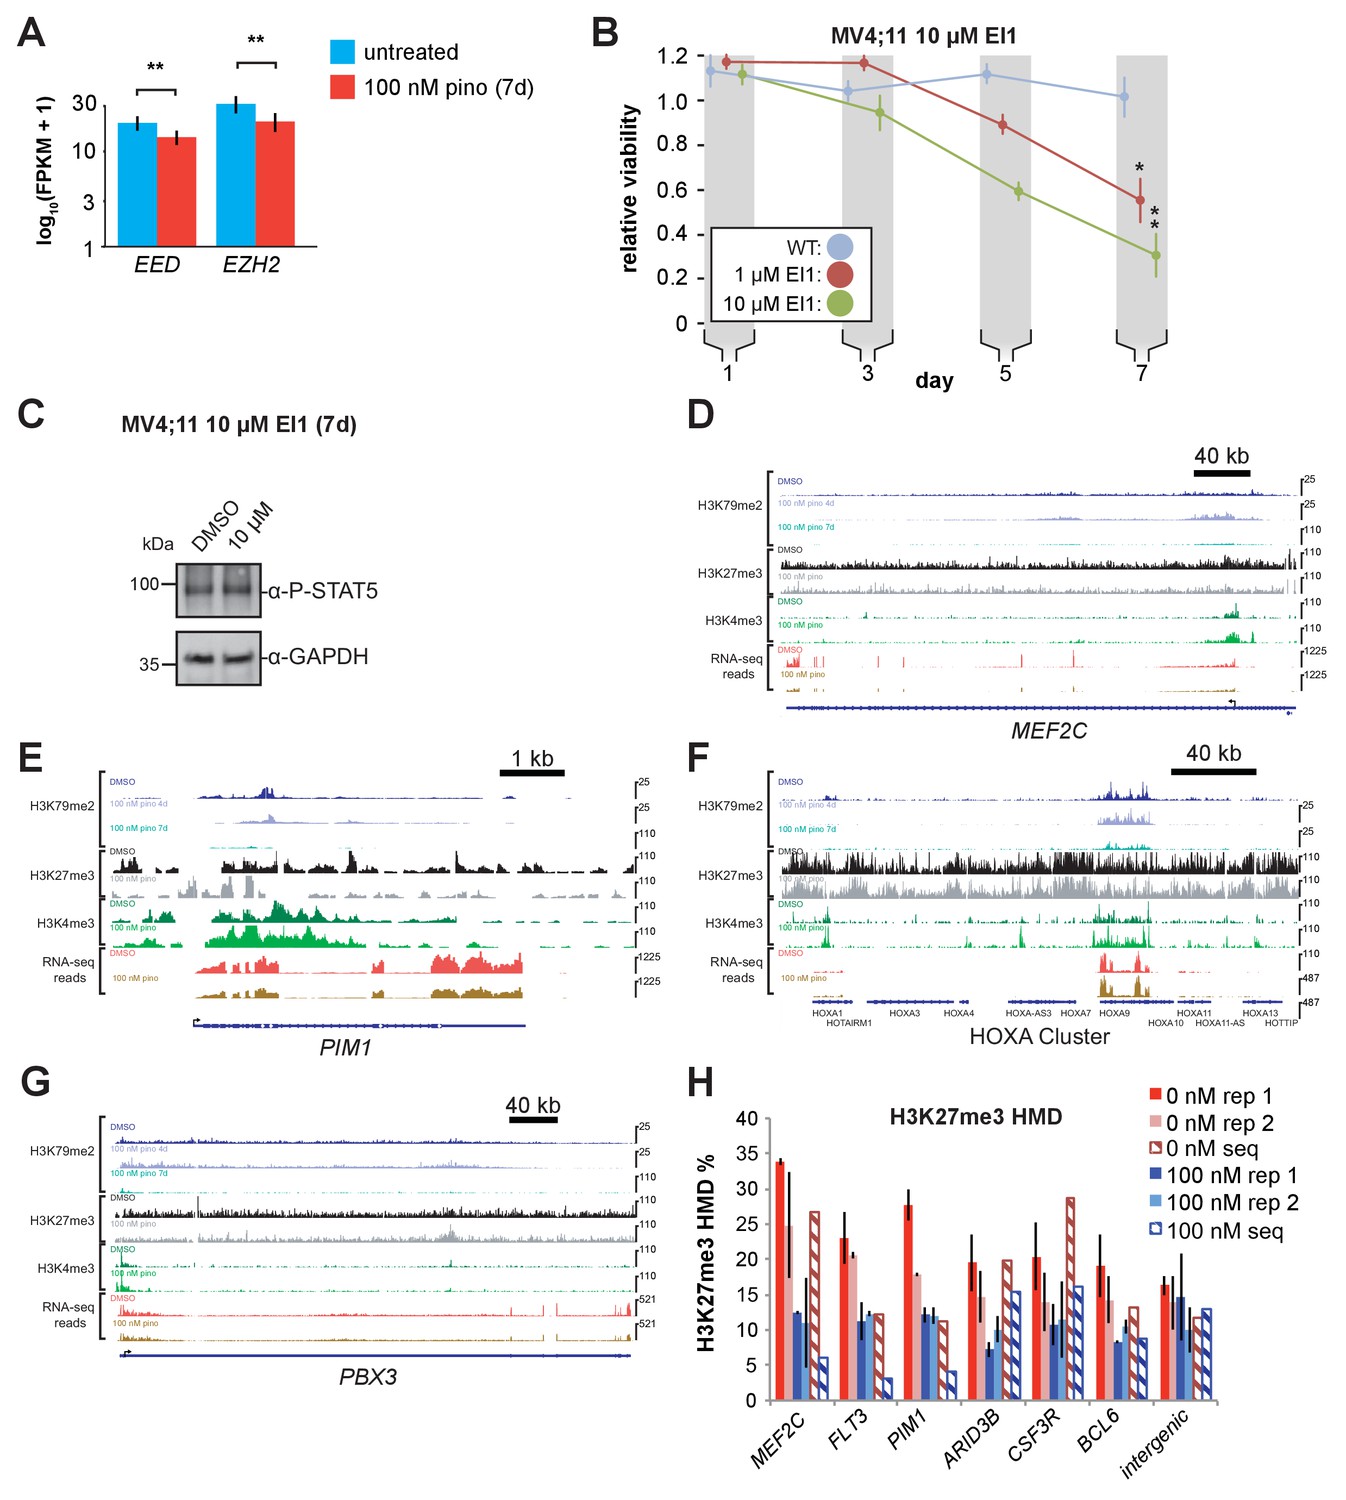
(A) RT-qPCR analysis of the components of the polycomb complex EZH2 and EED expression in MV4;11 cells ± 100 nM pinometostat for 7 days. Results are displayed as mean fold-change vs. DMSO-treated cells ± S.E.M. of three independent experiments. Student’s t-test (*** p < 0.001, **** p < 0.0001). (B) Western blot of EZH2, H3K27me3 and LEDGF as loading control in MV4;11 cells treated ± 100 nM pinometostat for 7 days. (C) Quantitative ICe-ChIP-seq from MV4;11 cells treated with 100 nM pinometostat for 7 days displaying H3K27me3 histone methylation density contoured over promoters from −2000 to +4000 of the TSS of either all expressed genes, genes up- or downregulated by 100 nM pinometostat or MLL-AF4 target genes (Kerry et al., 2017). (D) Western blot for H3K27me3 with GAPDH as a loading control in MV4;11 cells treated with EI1 for 7 days. (E) RT-qPCR analysis of MHC class II genes and master regulator CIITA expression from MV4;11 cells ± 10 µM EZH2 inhibitor EI1. Results are displayed as mean fold-change vs. DMSO-treated cells ± S.E.M. of three independent experiments. Student’s t-test (** p = 0.01, *** p = 0.001). (F) Fold change of RT-qPCR analysis of gene expression MV4;11 cells ± 10 µM EZH2 inhibitor EI1. Results are the average three independent experiments ± S.E.M. Student’s t-test (* p < 0.05, ** p < 0.01, *** p = 0.001). (G) Proliferation assay of MV4;11 cells virally transduced with tet-inducible EZH2 or eGFP treated with 100 nM pinometostat and induced with 1 µg/mL doxycycline to express EZH2 or eGFP for 7 days showing the luminescence fraction of inhibited over uninhibited from a CellTiter Glo 2.0 assay. Means ± SE are shown for three independent experiments. Student’s t-test of day 7 values (** p = 0.01).
Figure 6—figure supplement 1
PRC2 inhibition reduces leukemia survival without affecting STAT5A actiation.
(A) Bar graph of Cuffdiff (Trapnell et al., 2012) output for the expression of polycomb complex members. EED and EZH2 from RNA-seq in MV4;11 cells ± 100 nM pinometostat for 7 days. Values are represented as log(10) FPKM + 1 for three independent experiments with standard deviation. Student’s t-test (** p < 0.01). (B) Proliferation assay of MV4;11 cells treated with 10 µM EI1 EZH2 inhibitor using CellTiter Glo 2.0 to measure viability, showing the luminescence fraction of inhibited over DMSO-treated cells. Means ± SE are shown for three independent experiments. Student’s t-test of day 7 values: * p < 0.05, ** p < 0.01. (C) Western blot of extract from MV4;11 cells ± 10 µM EI1 for 7 days and blotted for phosphorylated STAT5 or GAPDH as a loading control. (D-G) ICeChIP-seq tracks of H3K79me2, H3K27me3, and H3K4me3 HMD and an RNA-seq track (FPKM) from a single replicate for MV4;11 cells treated with 100 nM pinometostat or DMSO for 7 days for MLL-AF4 (Kerry et al., 2017) and STAT5A (Moore et al., 2007) target genes: (D) MEF2C; (E) PIM1; (F) the HOXA gene cluster and G. PBX3. H. Validation by two additional independent H3K27me3 ICeChIP experiments, quantified by qPCR at the TSS compared to average HMD of a 500 bp region at the TSS from the ICe-ChIP-seq experiment (hash marked) at a number of loci where there was a detectable loss of H3K27me3 upon pinometostat treatment observed in the ICeChIP-seq experiment (the intergenic region displayed little change in the seq experiment).
Figure 7 with 1 supplement
STAT5A-CA overexpression rescues the viability of MV4;11 cells treated with MLL1 inhibitors.
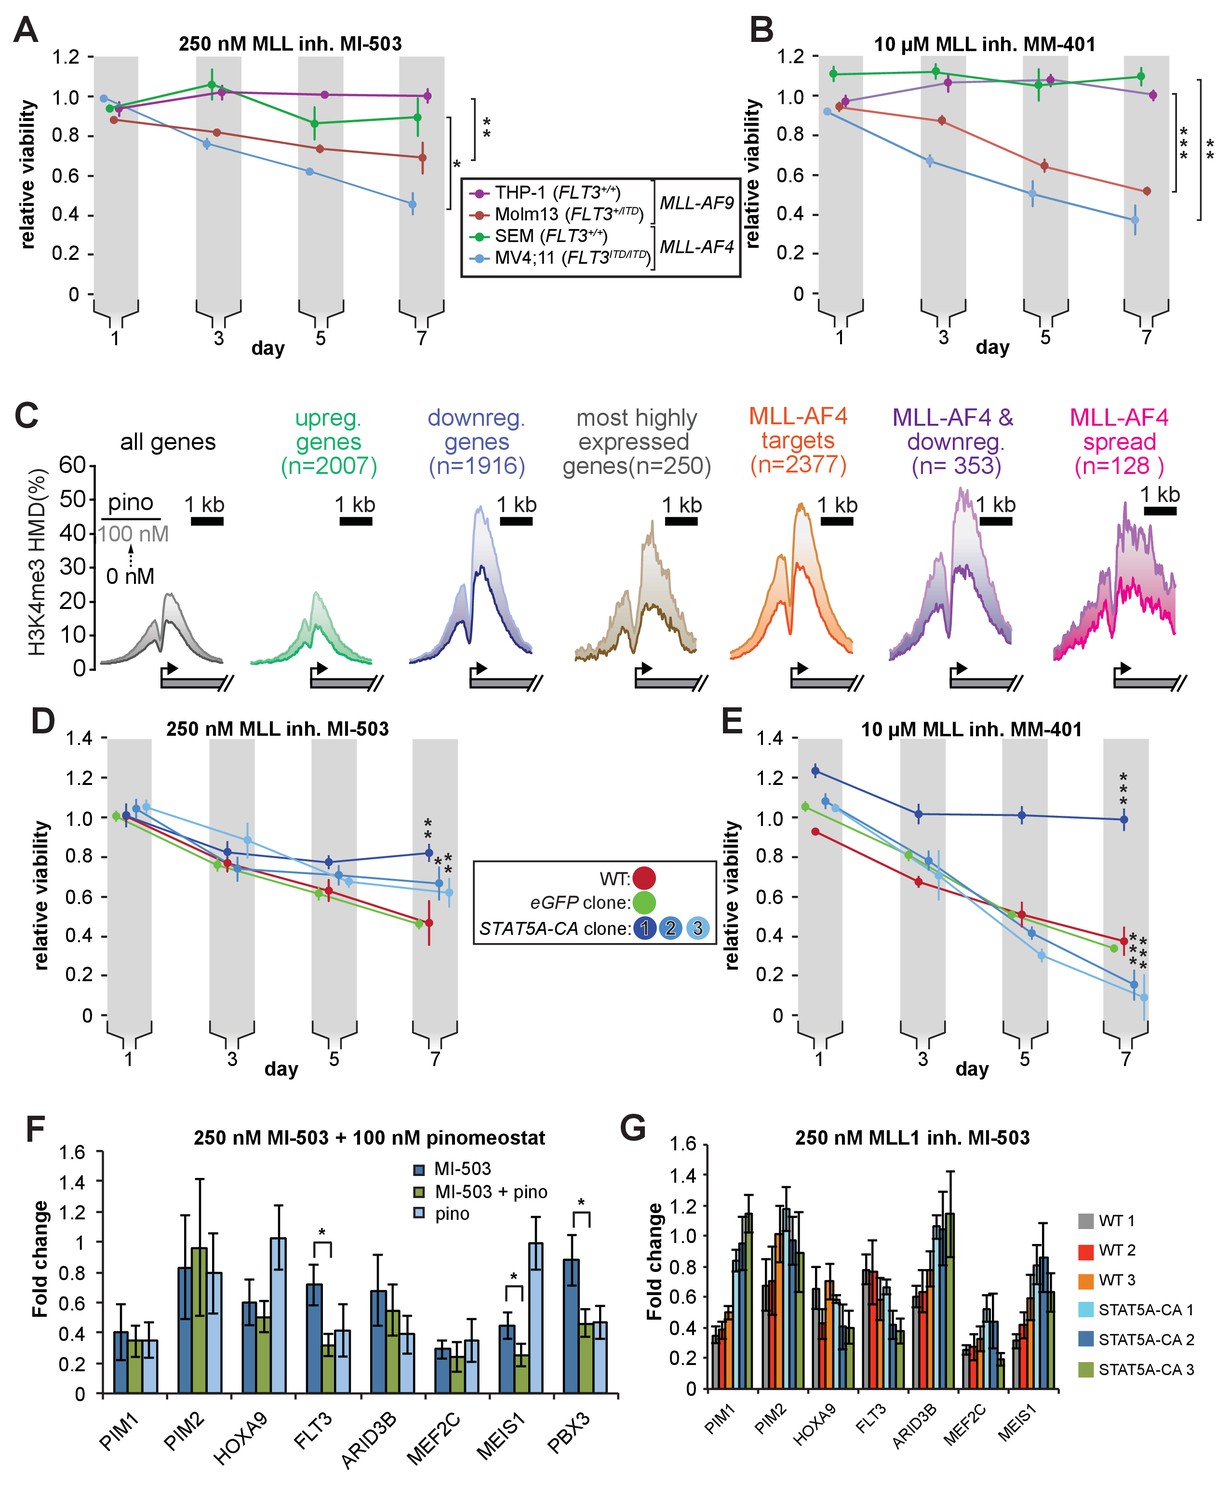
Proliferation assay of MLL-r cell lines treated with (A) 250 nM MI-503 (MLL1-Menin interaction inhibitor) or (B) 10 µM MM-401 (MLL1 histone methyltransferase inhibitor) for 7 days. Viability was measured by CellTiter Glo 2.0 assay and results are displayed as the fraction of luminescence of inhibitor-treated over DMSO-treated cells. Means ± SE are shown for three independent experiments. Student’s t-test (* p < 0.05, ** p < 0.01, *** p < 0.001). (C) H3K4me3 histone methylation density from −2000 to +2000 of the TSS from quantitative ICeChIP-seq from MV4;11 cells treated with 100 nM pinometostat for 7 days for genes up- or downregulated by 100 nM pinometostat, the most highly expressed genes, MLL-AF4 target genes (Kerry et al., 2017) as well as those MLL-AF4 targets downregulated by 100 nM pinometostat. (D and E) Proliferation assay of MV4;11 STAT5A-CA clonal isolates induced to express STAT5A-CA or eGFP with 1 µg/mL doxycycline and treated with D. 250 nM MI-503 or (E) 10 µM MM-401. Viability was measured and results displayed as in A and B. Means ± SE are shown for three independent experiments. Student’s t-test (* p < 0.05, ** p < 0.01, *** p < 0.001). (F) Gene expression analysis by RT-qPCR of MLL-fusion and STAT5a targets in MV4;11 cells treated with 250 nM MI-503 MLL1 inhibitor, 100 nM pinometostat DOT1L inhibitor or a combination for 7 days. Means ± S.E.M. are shown for three independent experiments (* p < 0.05). (G) Gene expression analysis by RT-qPCR of MLL-fusion and STAT5A targets in WT and STAT5A-CA MV4;11 cells treated with 250 nM MI-503 MLL1 inhibitor for 7 days. Means ± S.E.M. are shown for technical replicates of individual experiments.
Figure 7—figure supplement 1
MLL1 inhibitors reduce STAT5A phosphorylation.
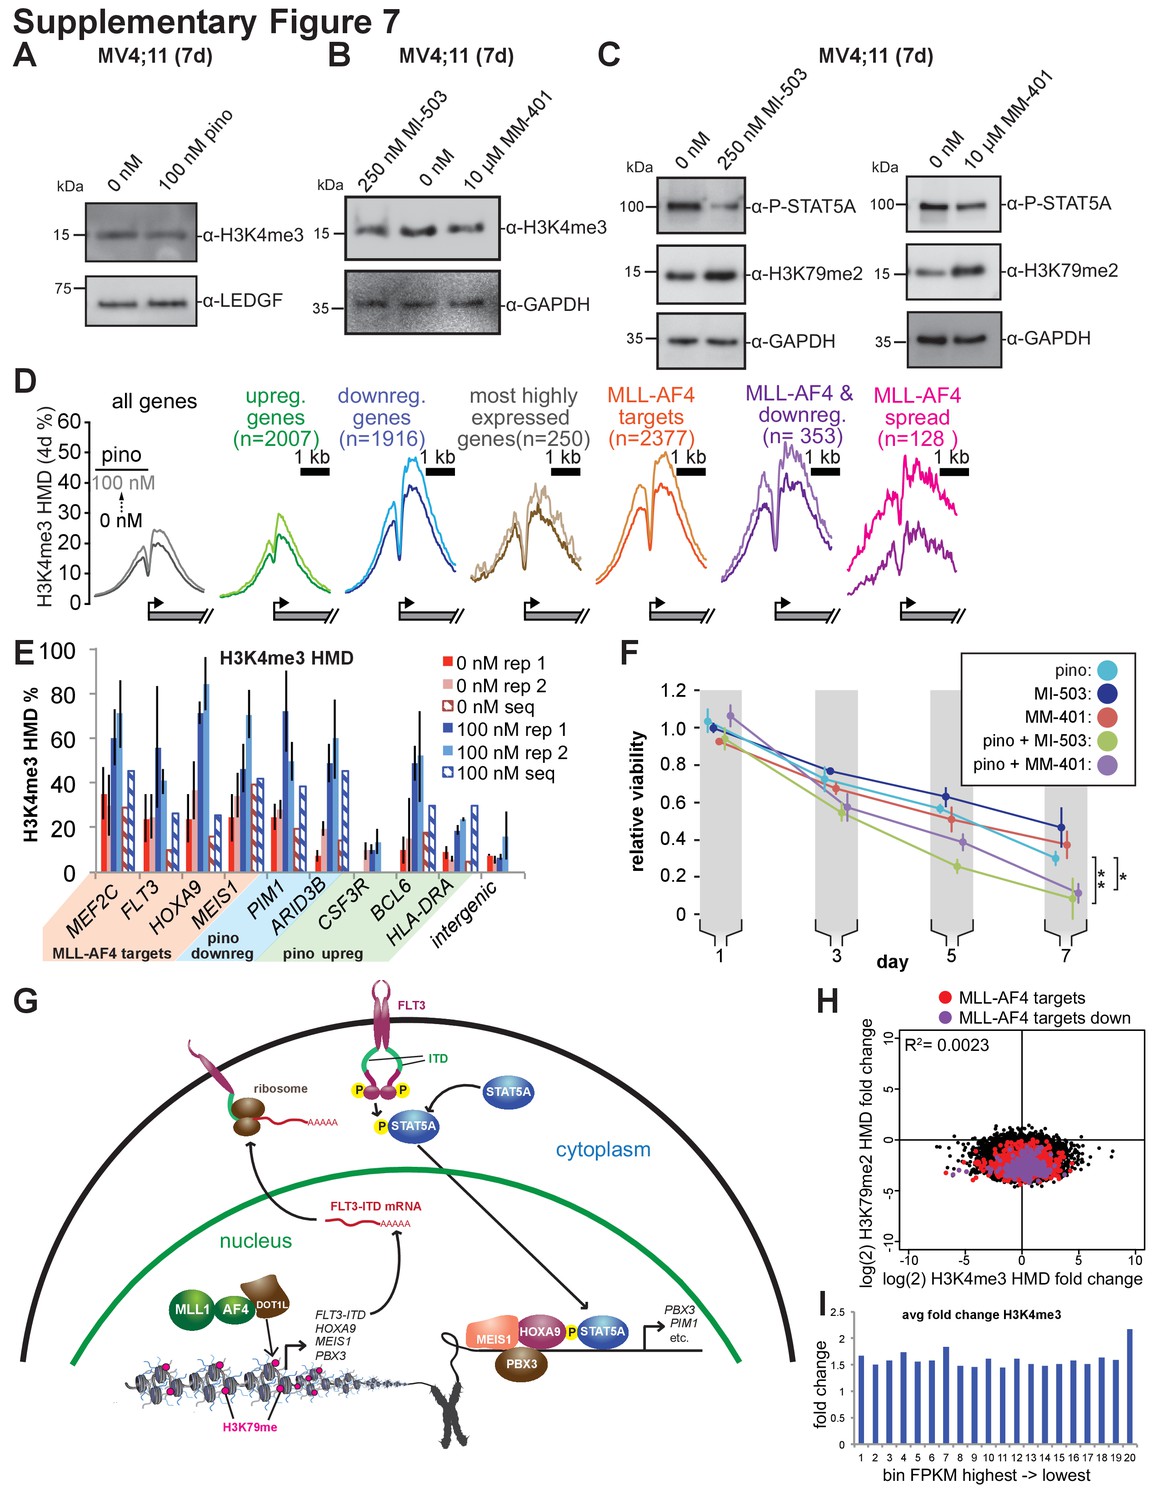
(A) Western blots of whole cell extract from MV4;11 cells treated with 100 nM pinometostat for 7 days and blotted for H3K4me3 or LEDGF as a loading control. (B) Western blots of whole cell extract from MV4;11 cells treated with MLL1 inhibitors MI-503 (250 nM) or MM-401 (10 µM) or DMSO for 7 days and blotted for histone H3 lysine four trimethylation (H3K4me3) or GAPDH as a loading control. (C) Western blots of MV4;11 cell extract treated with MLL1 inhibitors MI-503 (250 nM) or MM-401 (10 µM) for 7 days and blotted for phosphorylated STAT5, histone H3 lysine 79 dimethylation (H3K79me2) or GAPDH as a loading control. (D) H3K79me2 meta promoter profiles ± 2000 bp of the TSS as in Figure 7C, representing 4 days, rather than seven days of 100 nM pinometostat treatment versus DMSO control. (E) ICe-ChIP-qPCR analysis of the percent H3K4me3 at the promoters of several genes both upregulated (BCL6, CSF3R, HLA-DRA) and downregulated (MEF2C, PIM1, ARID3B, and FLT3) by pinometostat as well as MLL-AF4 targets (HOXA9 and MEIS1) and an intergenic region (with little change) from two experiments as well as ICe-ChIP-seq (hashed lines) in MV4;11 cells ± 100 nM pinometostat for 7 days. Note that ICeChIP qPCR values are often slightly inflated as due to the capture of dinucleosomes that are over-represented due to avidity bias that are normally filtered out in ICeChIP. (F) MV4;11 cells were treated with DOT1L or MLL1 inhibitors alone or in combination for 7 days. Viability was analyzed using CellTiter Glo 2.0, showing the luminescence fraction of inhibited over DMSO-treated cells. Means ± SE are shown for three independent experiments. Student’s t-test of day 7 values: 100 nM pinometostat vs. 100 nM pinometostat + 250 nM MI-503 ** p < 0.01 100 nM pinometostat vs. 100 nM pinometostat + 10 µM MM-401 * p < 0.05. (G) Model of MLL-fusion-mediated activation of HOXA9/MEIS1 and STAT5A co-targets in MLL-r, FLT3-ITD+ leukemia. MLL-AF4 activates HOXA9, MEIS1, and FLT3-ITD gene expression through recruitment of DOT1L and H3K79me2 hypermethylation (fuchsia). FLT3-ITD phosphorylates STAT5A allowing it to translocate to the nucleus to cooperatively bind HOXA9/MEIS1 targets with PBX3 and facilitate gene activation. (H) Scatterplot from ICeChIP-seq of MV4;11 cells ± 100 nM pinometostat of the log2 (fold-change HMD of H3K79me2 vs. H3K4me3) of all expressed genes showing MLL-AF4 targets (red) and MLL-AF4 targets downregulated by pinometostat (purple). (I) The average fold-change in H3K4me3 HMD from ICeChIP-seq of MV4;11 cells ± 100 nM pinometostat at expressed genes in 20 bins grouped by decreasing expression (bin 1–20 sorted by highest to lowest FPKM of DMSO-treated cells).
Author response image 1
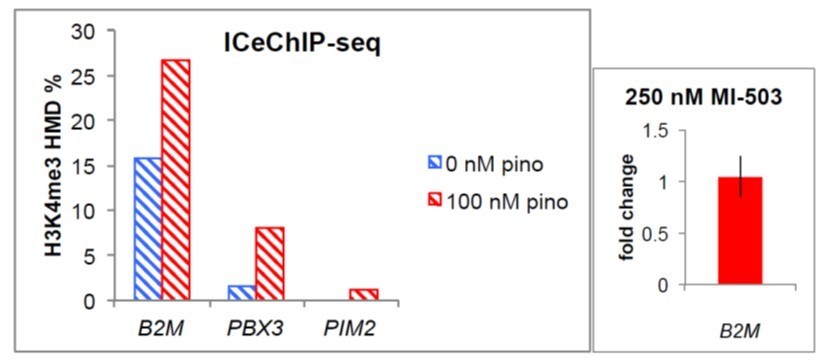
(left) H3K4me3 HMD percent enrichment from ICeChIP-seq at the promoter regions of the indicated genes.
(right) B2M expression fold-change ± 250 nM MI-503.
Tables
Appendix 1—key resources table
| Reagent type (species) or resource | Designation | Source or reference | Identifiers | Additional information |
|---|---|---|---|---|
| cell line (Homo-sapiens) | SEM | DSMZ | ACC546 | |
| cell line (Homo-sapiens) | MOLM13 | Duo laboratory University of Michigan | Verified by STR profiling ATCC | |
| cell line (Homo-sapiens) | THP-1 | ATCC | TIB-202 | Verified by STR profiling ATCC |
| cell line (Homo- sapiens) | MV4;11 | Duo laboratory University of Michigan | Verified by STR profiling ATCC | |
| Gene (Homo- sapiens) | STAT5A-CA | This paper | Constitutively active human STAT5A. | |
| recombinant DNA reagent | pTRIPZ-STAT5A-CA (plasmid) | This paper | Lentiviral construct to transfect and express the gene. | |
| recombinant DNA reagent | pTRIPZ-EZH2 (plasmid) | This paper | Lentiviral construct to transfect and express the gene. | |
| recombinant DNA reagent | Tet-pLKO-puro | Addgene | Cat # 21915 | |
| recombinant DNA reagent | PLKO-shFLT3 (plasmid) | This paper | Lentiviral construct to transfect and knock down gene. | |
| recombinant DNA reagent | PLKO-shscrambled (plasmid) | This paper | Lentiviral construct to transfect and knock down gene. | |
| recombinant DNA reagent | pTRIPZ-GFP (plasmid) | This paper | Lentiviral construct to transfect and express the gene. | |
| antibody | anti-MEIS1 (Rabbit polyclonal) | EMD Millipore | Cat# ABE2864 | WB (1:1000) |
| antibody | anti-H3 (Rabbit polyclonal) | Active Motif | Cat#: 61277 | WB (1:5000) |
| antibody | anti-H3K79me2 (Rabbit polyclonal) | Abcam | Cat# ab3594 | WB (1:2000) |
| antibody | anti-H3K27me3 (Rabbit polyclonal) | Cell Signaling | Cat# 9733S | WB (1:1000) |
| antibody | anti-H3K4me3 (mouse monoclonal) | Cell Signaling | Cat# 9751S | WB (1:1000) |
| antibody | anti-H4 (Rabbit polyclonal) | Active Motif | Cat# 61299 | WB (1:1000) |
| antibody | anti-H2B (Rabbit polyclonal) | Proteintech | Cat# 2S2899-2 | WB (1:5000) |
| antibody | anti-FLT3 (Rabbit polyclonal) | Cell Signaling | Cat. #: 33462S | WB (1:500) |
| antibody | anti-GAPDH (Rabbit polyclonal) | Cell Signaling | Cat# 5174S | WB (1:5000) |
| antibody | anti-STAT5A (Rabbit polyclonal) | Cell Signaling | Cat# 94205T | WB (1:1000) |
| antibody | anti-p- STAT5 (Rabbit polyclonal) | Cell Signaling | Cat# 9359S | WB (1:1000) |
| antibody | anti-EZH2 (Rabbit polyclonal) | Cell Signaling | Cat. #: 5246S | WB (1:1000) |
| antibody | anti-LEDGF (Rabbit polyclonal) | Bethyl | Cat# A300-848A | WB (1:2000) |
| antibody | anti-RBBP5 (Rabbit polyclonal) | Bethyl | Cat# A300-109A | WB (1:1000) |
| antibody | anti-HNRNPK (Rabbit polyclonal) | Abcam | Cat# ab70492 | WB (1:5000) |
| antibody | anti-MBD3 (Rabbit polyclonal) | Bethyl | Cat. #: A302-529A | WB (1:1000) |
| antibody | anti-rabbit (secondary HRP-conjugated) | Cell Signaling | Cat# 7074S | WB (1:10000) |
| antibody | anti-mouse (secondary HRP-conjugated) | Bethyl | Cat# 31432 | WB (1:10000) |
| chemical compound, drug | Pinometostat (EPZ5676) | Cayman Chemical | Cat# a16175 | |
| chemical compound, drug | Tandutinib (MLN518) | Selleckchem | Cat. #: S1043 | |
| chemical compound, drug | EI1 | Cayman Chemical | Cat# 19146–1 | |
| chemical compound, drug | MI-503 | Selleckchem | Cat. #: S7817 | |
| chemical compound, drug | PIM1 inhibitor | MedChemExpress | Cat# HY-15604 | |
| chemical compound, drug | MM-401 | Duo laboratory University of Michigan | ||
| chemical compound, drug | Propidium iodide | Alfa Aesar | Cat # J66584 | |
| recombinant DNA reagent | pCMV-Gag-Pol (plasmid) | Manicassamy lab | Lentiviral construct to transfect for viral particle assembly. | |
| recombinant DNA reagent | pCMV-vsvg (plasmid) | Manicassamy lab | Lentiviral construct to transfect for viral particle assembly. | |
| recombinant DNA reagent | pTRIPZ-FLT3-ITD | This paper | Lentiviral construct to transfect and express the gene. | |
| recombinant DNA reagent | RiboZero Gold | Illumina | Cat # MRZ11124C | Ribosomal rRNA removal from total RNA. |
| commercial assay or kit | NEBNext Ultra Directional RNA Library prep kit | NEB | Cat # E7420S | cDNA library kit. |
| commercial assay or kit | Trizol reagent | Life Technologies | Cat # 15596018 | RNA extraction. |
| commercial assay or kit | Zymo Research RNA Clean and Concentrator | Zymo Research | Cat # 11-353B | |
| commercial assay or kit | NEBNext Ultra II DNA Library prep kit | NEB | Cat # E7645 | DNA library kit. |
| commercial assay or kit | PowerUP SYBR Green master mix | Applied Biosystems | Cat # A25742 | qPCR reagent |
| commercial assay or kit | MMLV HP reverse transcriptase | Lucigen | Cat # RT80125K | |
| commercial assay or kit | Cell TiterGlo 2 | Promega | Cat # G924A | Cell proliferation assay. |
| software, algorithm | HISAT2 | Kim et al., 2015 | ||
| software, algorithm | Cufflinks | Trapnell et al., 2012 | ||
| peptide, recombinant protein | FITC-conjugated Annexin V | BD Biosciences | Cat # 556420 | Apoptosis detection reagent. |
| sequence-based reagent | HLD-DRA qPCR F | This paper | PCR primers | CTCAGGAATCATGGGCTATCAA |
| sequence-based reagent | HLA-DRA qPCR R | This paper | PCR primers | CTCATCACCATCAAAGTCAAACAT |
| sequence-based reagent | HLA-DRB1 qPCR F | This paper | PCR primers | GTGACACTGATGGTGCTGAG |
| sequence-based reagent | HLA-DRB1 qPCR R | This paper | PCR primers | GCTCCGTCCCATTGAAGAAA |
| sequence-based reagent | MEF2C qPCR F | This paper | PCR primers | GTCTGAGGACAAGTACAGGAAAA |
| sequence-based reagent | MEF2C qPCR R | This paper | PCR primers | GAGACTGGCATCTCGAAGTT |
| sequence-based reagent | FLT3 qPCR F | This paper | PCR primers | ATCATATCCCATGGTATCAGAATCC |
| sequence-based reagent | FLT3 qPCR R | This paper | PCR primers | GAAGCAGATACATCCACTTCCA |
| sequence-based reagent | ARID3B qPCR F | This paper | PCR primers | AGACCATACCAAAGATGCTTCC |
| sequence-based reagent | ARID3B qPCR R | This paper | PCR primers | ATCATCACTCCAGGCCAAAC |
| sequence-based reagent | STAT5A qPCR F | This paper | PCR primers | CAGATGCAGGTGCTGTACG |
| sequence-based reagent | STAT5A qPCR R | This paper | PCR primers | TGTCCAAGTCAATGGCATCC |
| sequence-based reagent | PIM2 qPCR F | This paper | PCR primers | ATGTTGACCAAGCCTCTACA |
| sequence-based reagent | PIM2 qPCR R | This paper | PCR primers | TCGATACTCGGCCTCGAA |
| sequence-based reagent | MEIS1 qPCR F | This paper | PCR primers | AGACGATAGAGAAGGAGGATCAA |
| sequence-based reagent | MEIS1 qPCR R | This paper | PCR primers | CCGTGTCATCATGATCTCTGTT |
| sequence-based reagent | HOXA9 qPCR F | This paper | PCR primers | AGGCGCCTTCTCTGAAA |
| sequence-based reagent | HOXA9 qPCR R | This paper | PCR primers | GTTGGCTGCTGGGTTATTG |
| sequence-based reagent | PBX3 qPCR F | This paper | PCR primers | CCACCAGATCATGACCATCAC |
| sequence-based reagent | PBX3 qPCR R | This paper | PCR primers | AAGAGCGCTGGTTTCATTCT |
| sequence-based reagent | CEBPA qPCR F | This paper | PCR primers | CCTTCAACGACGAGTTCCT |
| sequence-based reagent | CEBPA qPCR R | This paper | PCR primers | GCCCGGGTAGTCAAAGTC |
| sequence-based reagent | CSF1R qPCR F | This paper | PCR primers | GCCATCCACCTCTATGTCAAA |
| sequence-based reagent | CSF1R qPCR R | This paper | PCR primers | AGCAGACAGGGCAGTAGT |
| sequence-based reagent | B2M qPCR F | This paper | PCR primers | CTCTCTCTTTCTGGCCTGGAG |
| sequence-based reagent | B2M qPCR R | This paper | PCR primers | TCTGCTGGATGACGTGAGTA |
| sequence-based reagent | SPI1 qPCR F | This paper | PCR primers | TGCCCTATGACACGGATCTA |
| sequence-based reagent | SPI1 qPCR R | This paper | PCR primers | GTCCCAGTAATGGTCGCTATG |
| sequence-based reagent | CSF3R qPCR F | This paper | PCR primers | CTATGGCAAGGCTGGGAAA |
| sequence-based reagent | CSF3R qPCR R | This paper | PCR primers | GGGCTGAGACACTGATGTG |
| sequence-based reagent | PIM1 qPCR F | This paper | PCR primers | GTGGAGAAGGACCGGATTTC |
| sequence-based reagent | PIM1 qPCR R | This paper | PCR primers | TTCTTCAGCAGGACCACTTC |
| sequence-based reagent | PBX3 qPCR F | This paper | PCR primers | CAAAGAAACATGCCCTGAACTG |
| sequence-based reagent | PBX3 qPCR R | This paper | PCR primers | CTCTGATGCTGAGACCTGTTT |
| sequence-based reagent | 18S (RNA18S5) F | This paper | PCR primers | CGCAGCTAGGAATAATGGAATAGG |
| sequence-based reagent | 18S (RNA18S5) R | This paper | PCR primers | GCCTCAGTTCCGAAAACCAA |
| sequence-based reagent | CIITA qPCR F | This paper | PCR primers | CTGTGCCTCTACCACTTCTATG |
| sequence-based reagent | CIITA qPCR R | This paper | PCR primers | GTCGCAGTTGATGGTGTCT |
| sequence-based reagent | EZH2 qPCR F | This paper | PCR primers | GGAGGATCACCGAGATGATAAAG |
| sequence-based reagent | EZH2 qPCR R | This paper | PCR primers | TTCTGCTGTGCCCTTATCTG |
| sequence-based reagent | EED qPCR F | This paper | PCR primers | CTGGCACAGTAAAGAAGGAGAT |
| sequence-based reagent | EED qPCR R | This paper | PCR primers | GCATCAGCATCCACGTAAGA |
| sequence-based reagent | MEF2C promoter qPCR F | This paper | PCR primers | TCTGGACGAGTCTGGTTACTT |
| sequence-based reagent | MEF2C promoter qPCR R | This paper | PCR primers | AGGAAGAAGGAGGAGGAAGAG |
| sequence-based reagent | PIM1 promoter qPCR F | This paper | PCR primers | ctcagcgaaacggagagc |
| sequence-based reagent | PIM1 promoter qPCR R | This paper | PCR primers | cgtatcgattcaaacccaaacaa |
| sequence-based reagent | FLT3 promoter qPCR F | This paper | PCR primers | ctttctcagggcctcaaagat |
| sequence-based reagent | FLT3 promoter qPCR R | This paper | PCR primers | ccgaactctgtcgtttggat |
| sequence-based reagent | ARID3B promoter qPCR F | This paper | PCR primers | acgagaacctctgaggaaga |
| sequence-based reagent | ARID3B promoter qPCR R | This paper | PCR primers | gctgggaggaaagtaactaaaga |
| sequence-based reagent | CSF3R promoter qPCR F | This paper | PCR primers | GCAGAACCATTGTGGGTAAAC |
| sequence-based reagent | CSF3R promoter qPCR R | This paper | PCR primers | ggcagatggagaaacaggaa |
| sequence-based reagent | BCL6 promoter qPCR F | This paper | PCR primers | agctcgatctgctgagtttatg |
| sequence-based reagent | BCL6 promoter qPCR R | This paper | PCR primers | gcctctggaattctgagaactaat |
| sequence-based reagent | HOXA9 promoter qPCR F | This paper | PCR primers | GCCTTATGGCATTAAACCTGAAC |
| sequence-based reagent | HOXA9 promoter qPCR R | This paper | PCR primers | GAGGAGAACCACAAGCATAGTC |
| sequence-based reagent | MEIS1 promoter qPCR F | This paper | PCR primers | GGAGAGAGAGGGAGAGAAAGAA |
| sequence-based reagent | MEIS1 promoter qPCR R | This paper | PCR primers | CAAATGCACAAAGCCCTAGC |
| sequence-based reagent | HLA-DRA promoter qPCR F | This paper | PCR primers | CAGAGCGCCCAAGAAGAA |
| sequence-based reagent | HLA-DRA promoter qPCR R | This paper | PCR primers | cctcagcacctacCTTTGATAG |
| sequence-based reagent | intergenic qPCR F | This paper | PCR primers | TACACGACAGAGGACTGGAA |
| sequence-based reagent | intergenic qPCR R | This paper | PCR primers | CCTTCATGGGTGAGGGTAATG |
| sequence-based reagent | scrambled shRNA F | Yuan et al., 2009 | shRNA construct for gene knockdown | CCGG TTCTCCGAACGTGTCACGTTT CTCGAG AAACGTGACACGTTCGGAGAA TTTTT |
| sequence-based reagent | scrambled shRNA R | Yuan et al., 2009 | shRNA construct for gene knockdown | AATTAAAAA TTCTCCGAACGTGTCACGTTT CTCGAG AAACGTGACACGTTCGGAGAA |
| sequence-based reagent | FLT3 shRNA F | Green et al., 2015 | shRNA construct for gene knockdown | CCGG GCATCCCAGTCAATCAGCTTT CTCGAG AAAGCTGATTGACTGGGATGC TTTTT |
| sequence-based reagent | FLT3 shRNA R | Green et al., 2015 | shRNA construct for gene knockdown | AATTAAAAA GCATCCCAGTCAATCAGCTTT CTCGAG AAAGCTGATTGACTGGGATGC |
| sequence-based reagent | GFP shRNA F | Scheeren et al., 2005 | shRNA construct for gene knockdown | CCGG GCAAGCTGACCCTGAAGTTCAT CTCGAG ATGAACTTCAGGGTCAGCTTGC TTTTT |
| sequence-based reagent | GFP shRNA R | Scheeren et al., 2005 | shRNA construct for gene knockdown | AATTAAAAA GCAAGCTGACCCTGAAGTTCAT CTCGAG ATGAACTTCAGGGTCAGCTTGC |
Additional files
-
Source data 1
Blotting source files.
- https://cdn.elifesciences.org/articles/64960/elife-64960-data1-v2.zip
-
Source data 2
Blotting source files.
- https://cdn.elifesciences.org/articles/64960/elife-64960-data2-v2.zip
-
Source data 3
Blotting source files.
- https://cdn.elifesciences.org/articles/64960/elife-64960-data3-v2.zip
-
Supplementary file 1
Oligonucleotide sequences.
- https://cdn.elifesciences.org/articles/64960/elife-64960-supp1-v2.xlsx
-
Supplementary file 2
Antibody information.
- https://cdn.elifesciences.org/articles/64960/elife-64960-supp2-v2.xlsx
-
Transparent reporting form
- https://cdn.elifesciences.org/articles/64960/elife-64960-transrepform-v2.docx
Download links
A two-part list of links to download the article, or parts of the article, in various formats.
Downloads (link to download the article as PDF)
Open citations (links to open the citations from this article in various online reference manager services)
Cite this article (links to download the citations from this article in formats compatible with various reference manager tools)
Non-canonical H3K79me2-dependent pathways promote the survival of MLL-rearranged leukemia
eLife 10:e64960.
https://doi.org/10.7554/eLife.64960


