Structure of HIV-1 gp41 with its membrane anchors targeted by neutralizing antibodies
- Univ. Grenoble Alpes, CEA, CNRS, Institut de Biologie Structurale (IBS), France
- Instituto Biofisika (CSIC, UPV/EHU) and Department of Biochemistry and Molecular Biology, University of the Basque Country (UPV/EHU), Spain
- Institute of Medical Virology, University of Zurich, Switzerland
- Laboratoire de Physique et Chimie Théoriques (LPCT), University of Lorraine, France
- Laboratoire International Associé, CNRS and University of Illinois at Urbana-Champaign, France
- Department of Physics, University of Illinois at Urbana-Champaign, United States
Figures
Figure 1 with 7 supplements
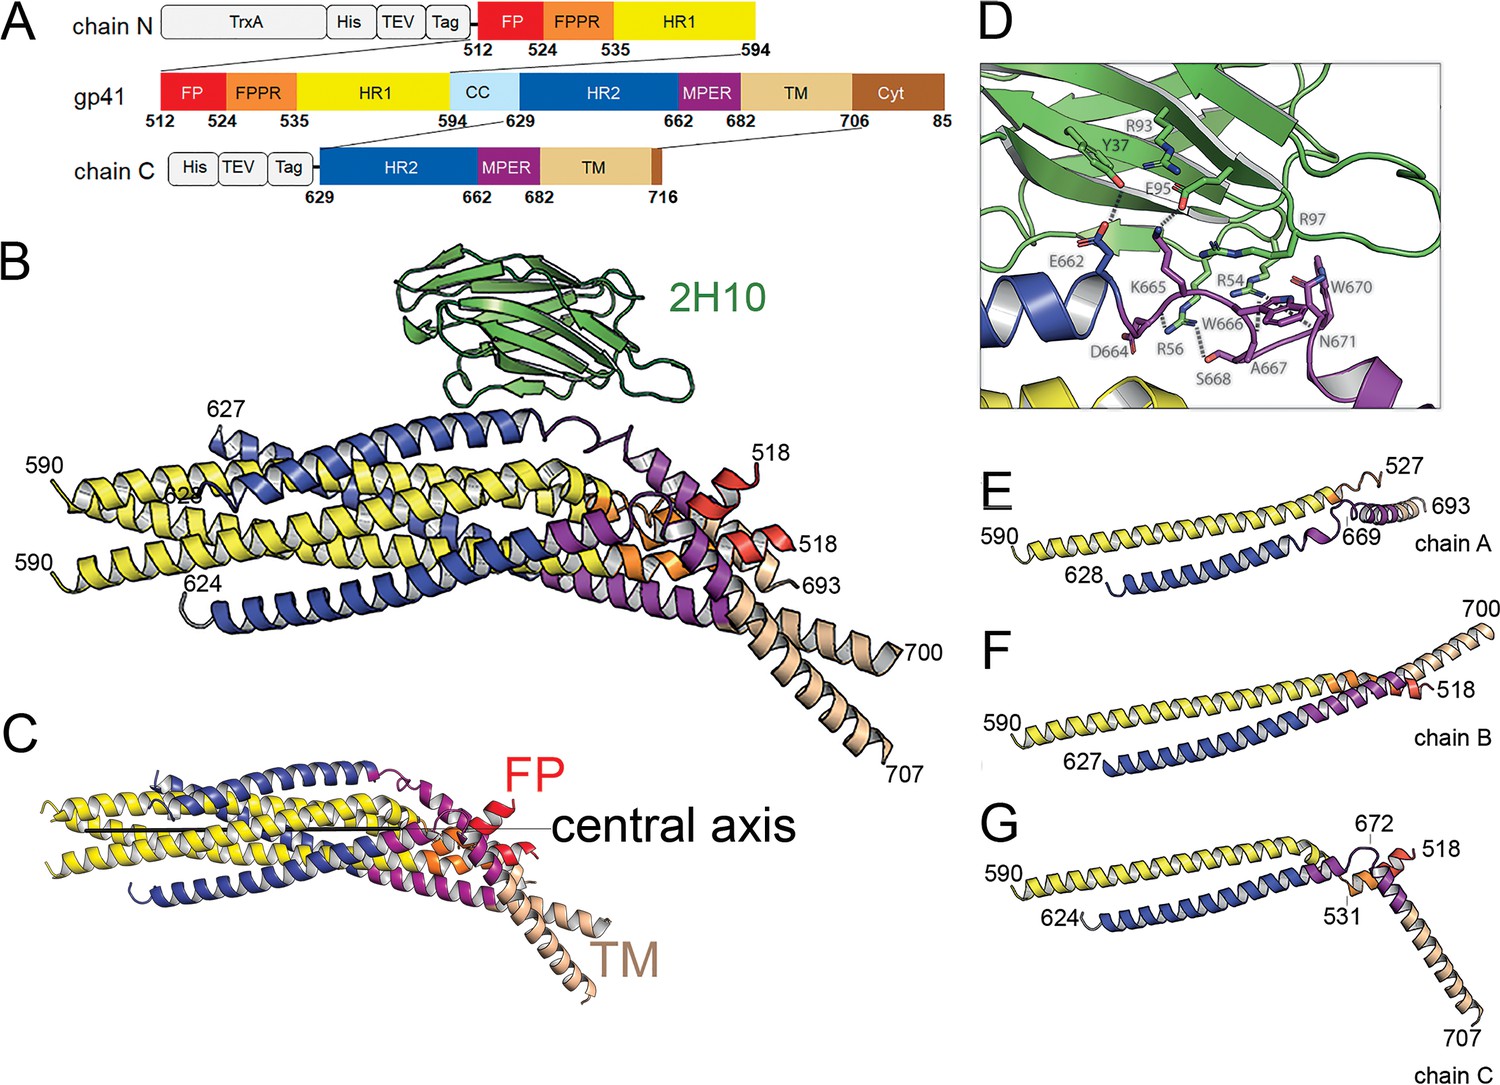
Crystal structure of gp41FP-TM in complex with 2H10.
(A) Schematic drawing of gp41 and expression constructs of gp41 chains N and C. Sequence numbering is based on the HIV-1-HBX2 envelope gp160 sequence. Color coding is as follows: FP, fusion peptide, red; FPPR, fusion peptide proximal region, orange; HR1, heptad repeat region 1, yellow; HR2, heptad repeat region 2, blue; MPER, membrane proximal external region, violet; TM, transmembrane region, beige; CC, cys loop region, light blue and cyt, cytoplasmic domain brown. Expression tags used are TrxA, thioredoxin fusion protein, His, His-tag, TEV, TEV protease cleavage sequence, Tag, chain N contains a Flag-tag (DYKDDDDK sequence) and chain C an N-terminal enterokinase cleavage site (DDDDK). (B) Ribbon presentation of gp41TM-FP in complex with 2H10. Color-coding of the different segments is as indicated in the gp41 scheme (A), the 2H10 nanobody is colored in green. (C) Ribbon presentation of gp41TM-FP including the core six-helical bundle trimer axis (black line) revealing the different orientations of FP and TM. (D) Close-up of the interaction of gp41FP-TM with 2H10. Residues in close enough contact to make polar interactions are shown as sticks. (E, F, G) Ribbon diagram of the individual protomers named chain A, B, and C. Residues within the FPPR and MPER hinge regions are indicated.
Figure 1—figure supplement 1
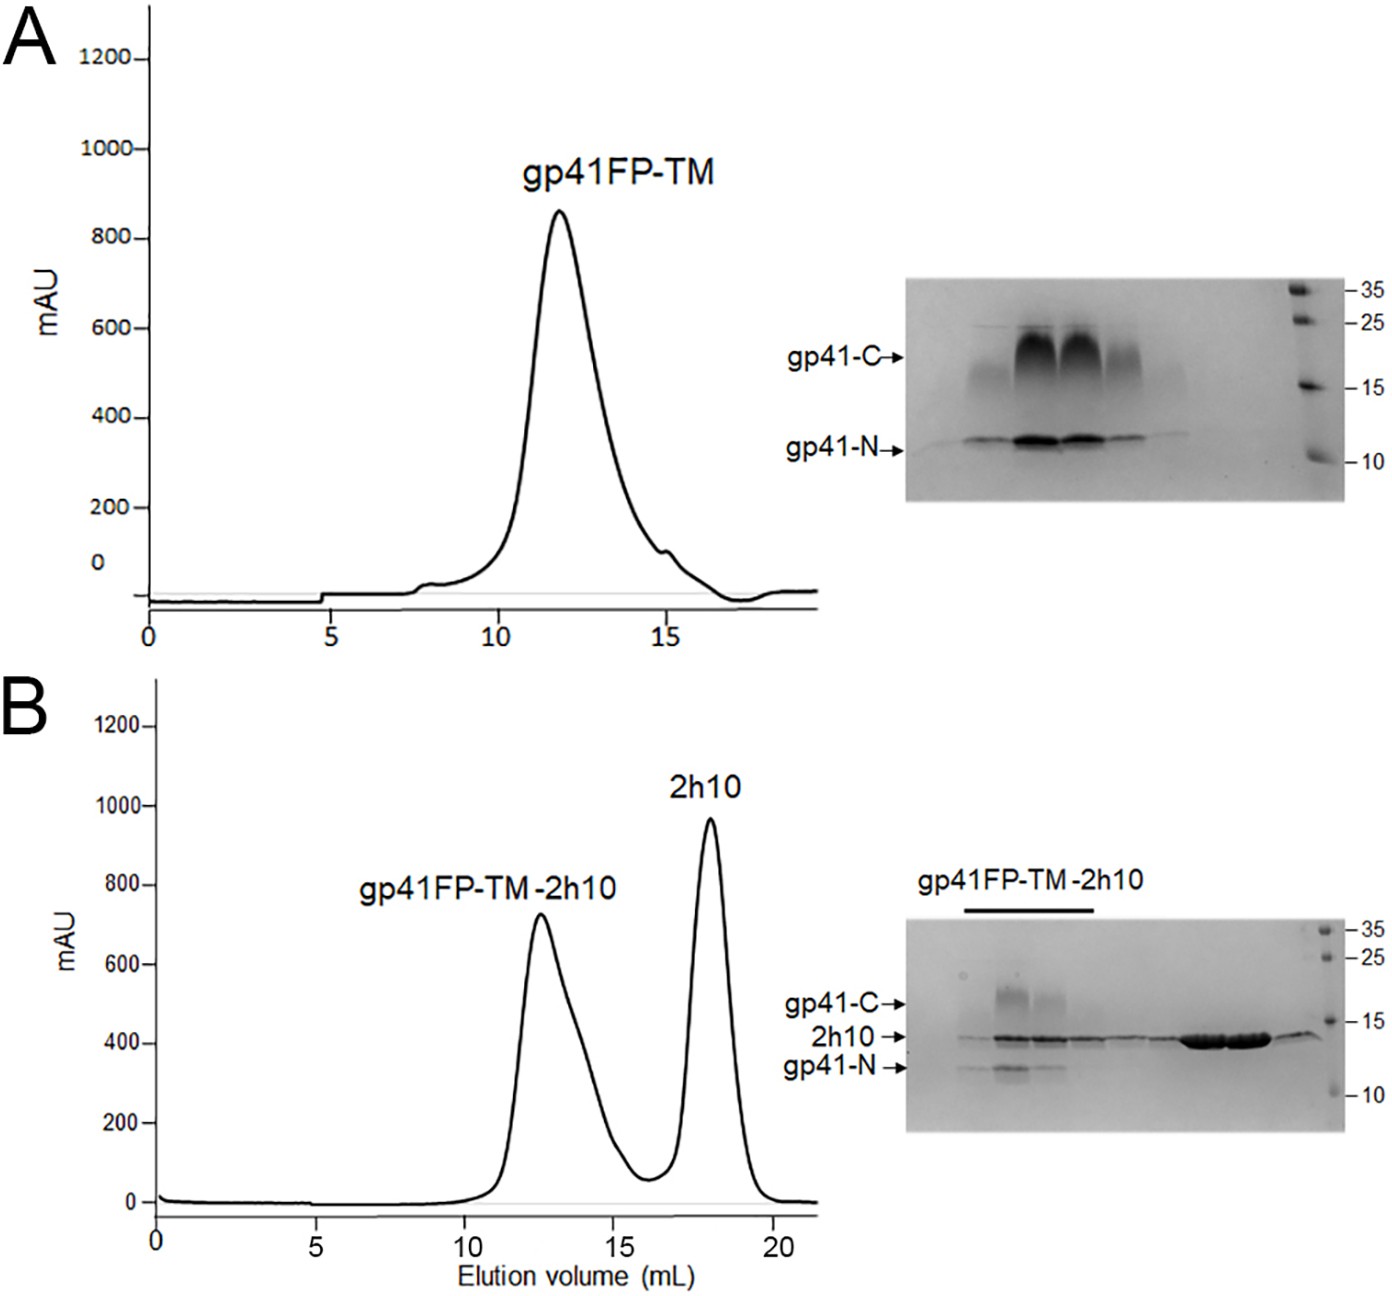
Characterization of gp41 containing FP and TM.
(A) Size exclusion chromatography of the gp41FP-TM complex composed of chains N and C and SDS-PAGE showing the two bands corresponding to gp41 chains N and C. (B) SEC of gp41FP-TM in complex with the llama nanobody 2H10 and corresponding SDS PAGE showing the three bands corresponding to gp41 chains N and C and 2H10.
Figure 1—figure supplement 2
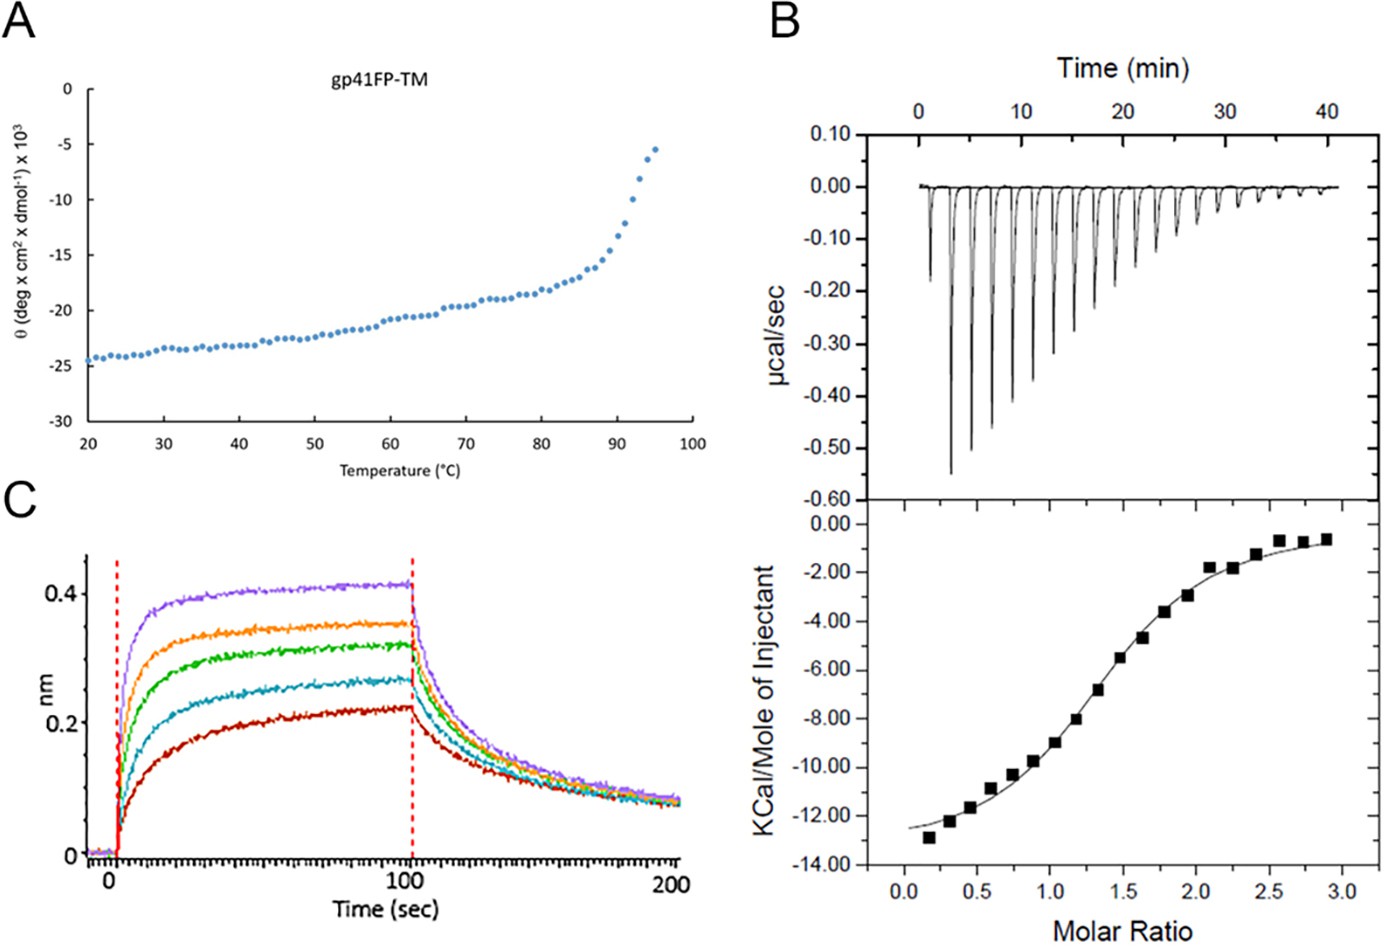
Biophysical characterization of gp41FP-TM and MPER Ab interaction.
(A) Circular dichroism of gp41FP-TM shows that FP and TM increase the melting temperature of gp41. Temperature-dependent unfolding of gp41FP-TM monitored by circular dichroism spectroscopy recorded at 222 nm in a buffer containing 1% β-OG. Gp41FP-TM has an estimated Tm of ~93°C. (B) Gp41FP-TM complex formation with 2H10. ITC data were recorded on successive injections of 2H10 at a concentration of 267 µM into the cell containing gp41FP-TM at a concentration of 19,5 µM. Three experiments were performed, with an average stoichiometry N = 1.1 +/- 0.2, which suggests that on average only one 2H10 binds to trimeric gp41FP-TM under these conditions. The calculated KD is 2.1 µM ± 0.9. (C) Gp41FP-TM complex formation with 2H10. Bio-layer interferometry (BLI) binding of gp41FP-TM to 2H10. GP41FP-TM concentrations analyzed are dilutions between 156 and 2500 nM. The estimated KD based on the steady state binding model is 170 ± 17 nM. Note that the calculated Kds of the ITC and BLI experiments are only estimates since 2H10 needs to optimally stabilize the gp41FP-TM-binding conformation. Therefore only a fraction of gp41FP-TM may adopt the required conformation during the injection time used to record binding.
Figure 1—figure supplement 3
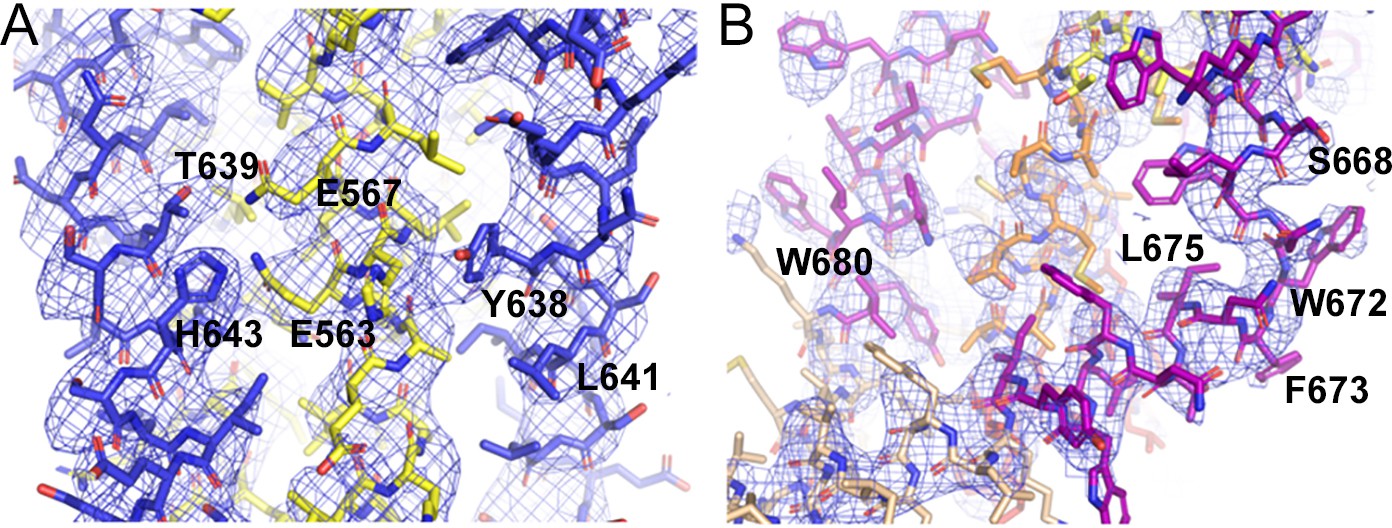
Close-ups of the model and its corresponding electron density.
2Fo-Fc composite omit maps contoured at 1 σ of a central 6HB core region (A and B) of the kinked MPER conformation of protomer C.
Figure 1—figure supplement 4
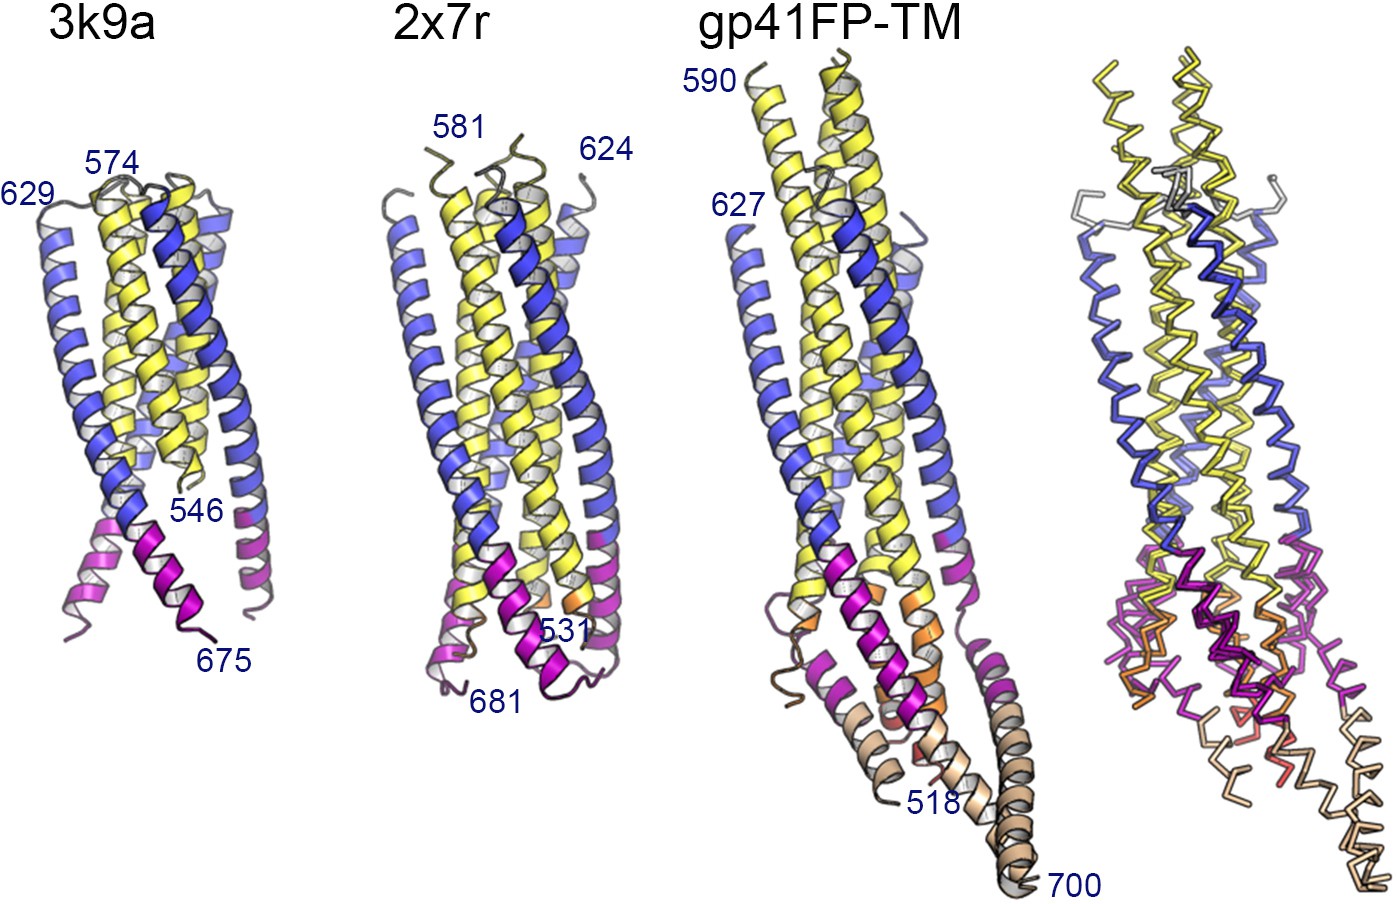
Comparison of the gp41FP-TM structure with gp41 core structures.
Ribbon presentation of gp41-MPER (pdb 3k9a), gp41FPPR-MPER (pdb 2x7r) and gp41FP-TM (numbering is shown for chain B). Cα super positioning of all three structures onto chains N-B (residues 546–574) and C-B (residues 628–662) of gp41FP-TM, revealing an r.m.s.d of 0.55 Å between pdb 3k9a and gp41FP-TM and an r.m.s.d. of 0.29 Å between pdb 2x7r and gp41FP-TM for the straight helices of chain B.
Figure 1—figure supplement 5
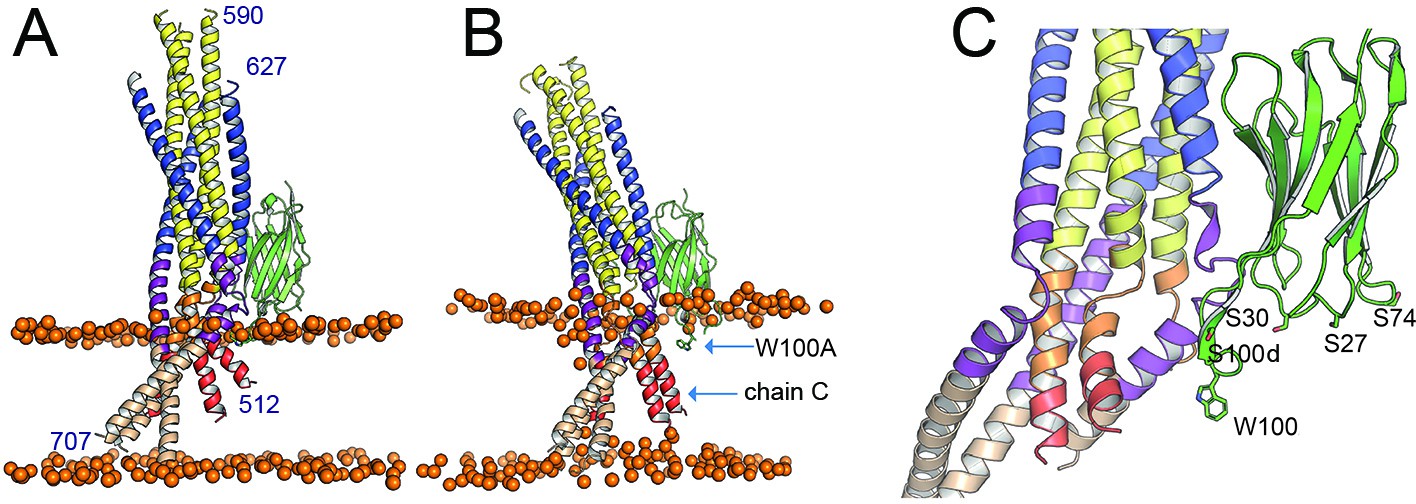
Positioning of gp41FP-TM-2H10 in a bilayer by MD simulation.
(A) Model of gp41FP-TM-2H10 before simulation and (B) after 1 µs simulation, which repositions the 2H10 CDR3 in the membrane and reveals movement of FP of chain C. The orange spheres represent the phosphate atoms of the phospholipids and mark the membrane boundaries. Residues 512–517 and 701–707 have been modeled in a helical conformation to provide complete models of FP and TM. (C) Close-up of the proposed membrane interaction of the 2H10 interface. CDR3 W100 and S100d mutated to F could as well insert into the membrane. Furthermore, basic residues at positions S30K, S27R, and S74R (shown as sticks) are positioned to make polar interactions with lipid head groups.
Figure 1—figure supplement 6
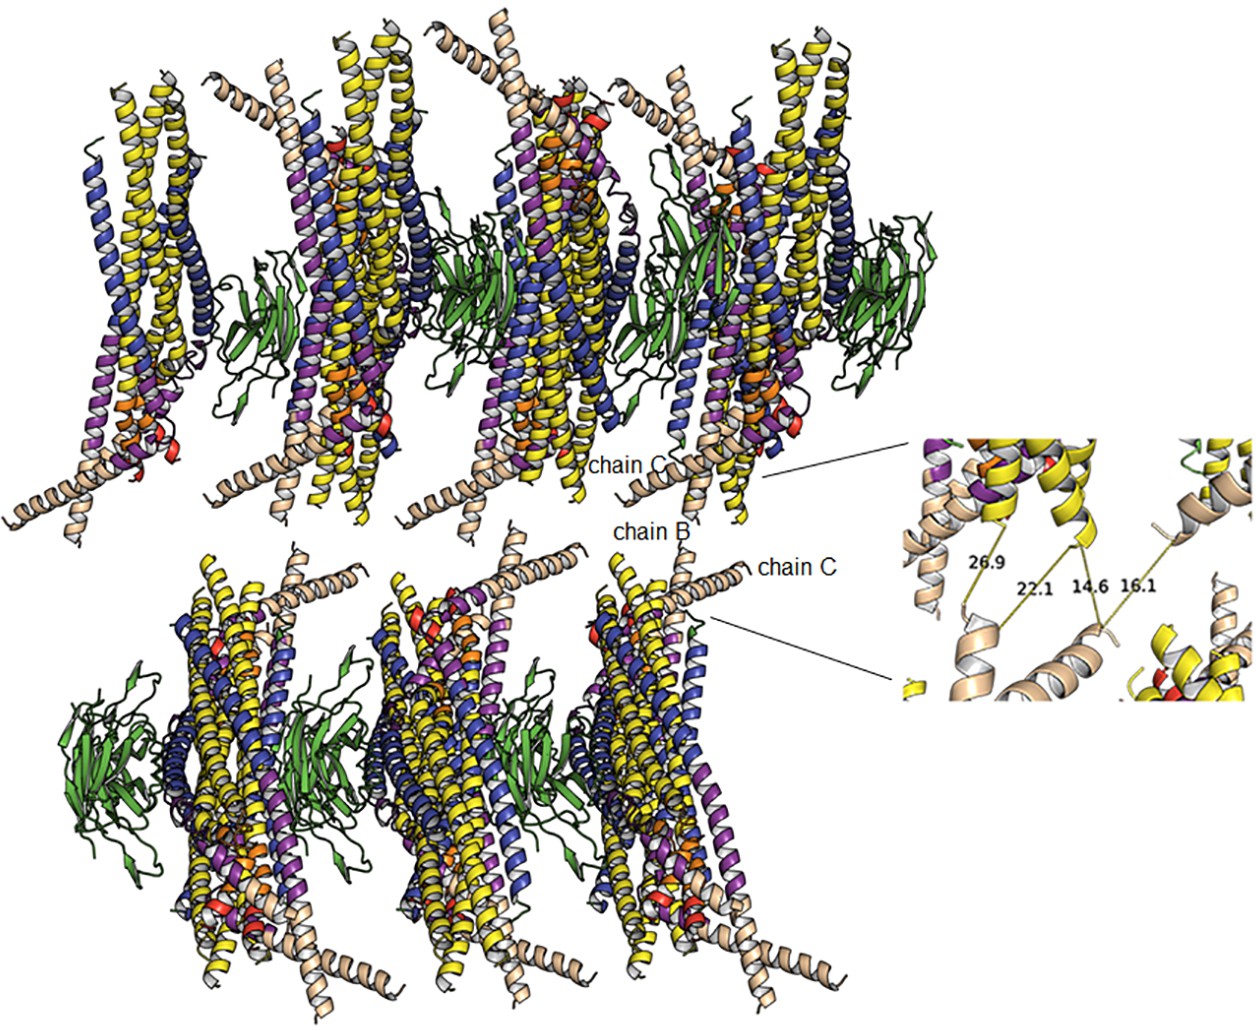
Crystal lattice packing.
Crystal packing of protein 2-D layers arranged in the c direction of the crystal unit cell do not show defined crystal contacts. The inset shows the distances between the protein layers indicating that the defined C-terminus of chain C is close (14 Å) to the N-terminus of an HR1 helix (yellow). Thus crystal lattice stabilization is likely unregular and poorly defined at the resolution of the crystal diffraction data. We hypothesize that weak crystal contacts are formed by the C-terminal extensions of TM, which may be able to adopt different orientations and are therefore not present in the structure.
Figure 1—figure supplement 7
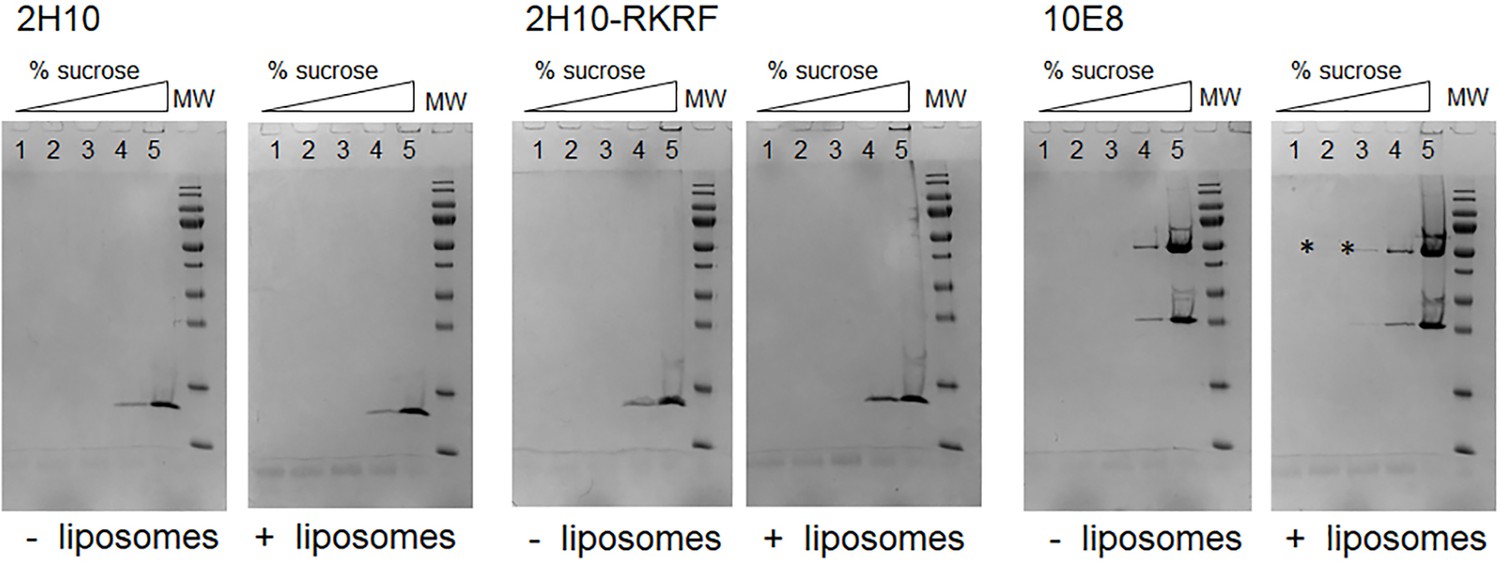
Membrane interaction of 2H10.
Membrane interaction of nanobodies 2H10, 2H10-RKRF, and bnAb 10E8 was tested using liposomes containing the lipid composition of the HIV-1 envelope. Nanobodies 2H10 and 2H10-RKRF as well as bnAb10E8 were incubated alone and with liposomes and subsequently separated in a sucrose gradient flotation assay. Samples of each fraction of the gradient were analyzed by SDS-PAGE, which demonstrates that 2H10 and 2H10-RKRF do not float with liposomes in this assay indicating no or very low non-specific membrane interaction as reported previously for 2H10 (Lutje Hulsik et al., 2013) and some weak interaction (*) for 10E8 as reported previously (Chen et al., 2014). The figure supplement is also related to data presented in Table 2.
Figure 2 with 1 supplement
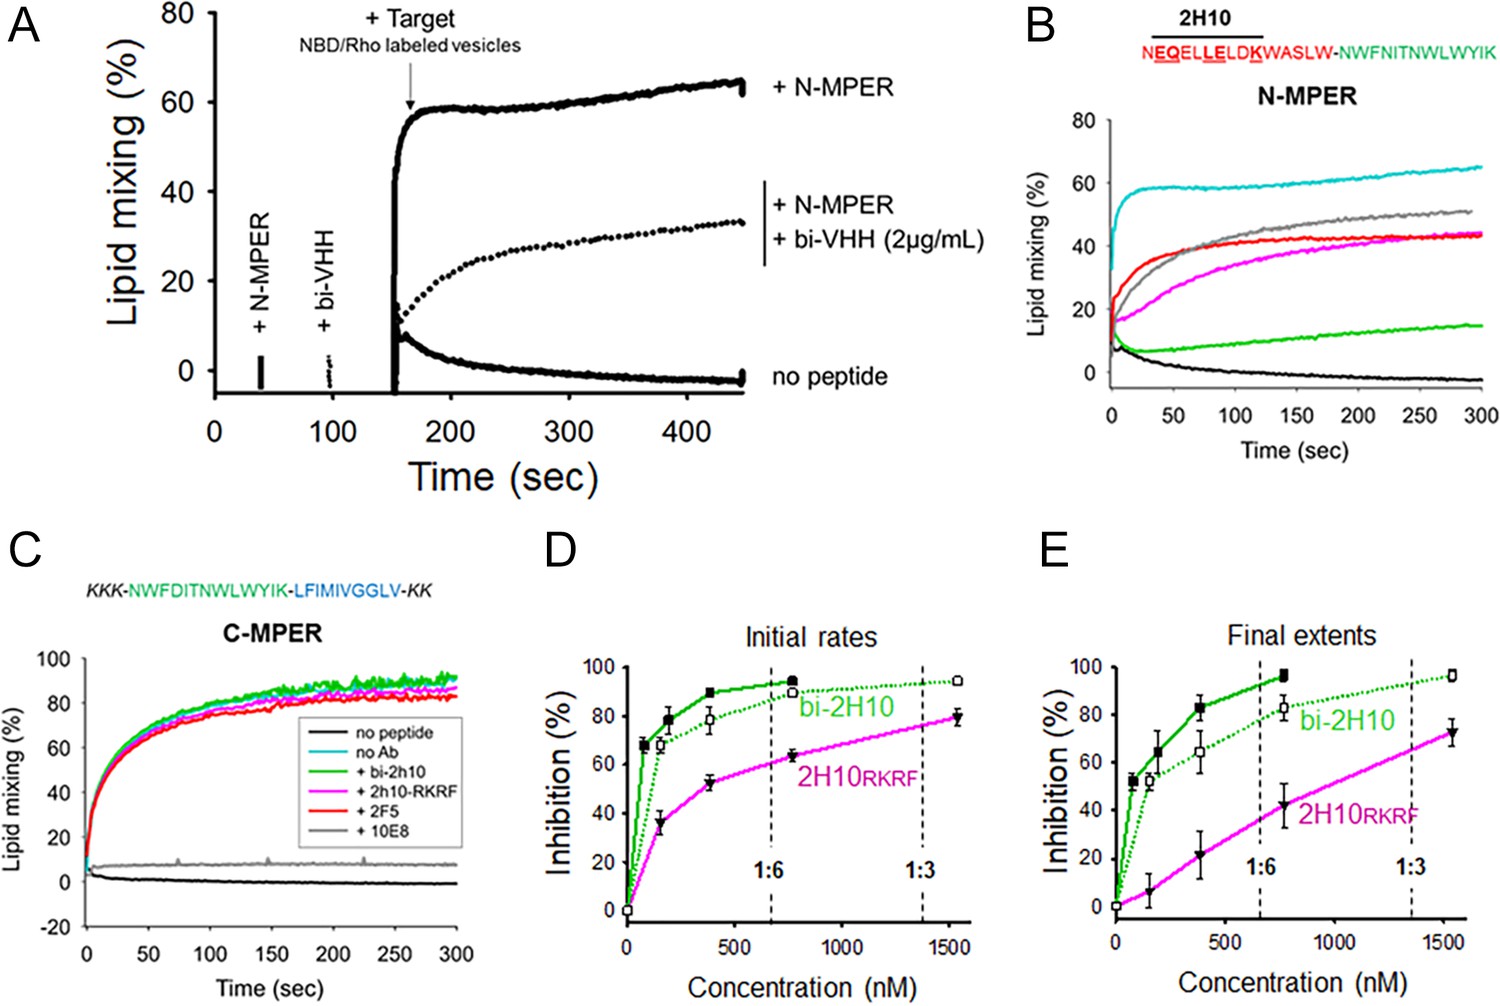
Vesicle-vesicle fusion inhibition by 2H10-RKRF, bi-2H10, 2F5, and 10E8.
(A) Time course of the lipid-mixing assay using fusion-committed vesicles. At time 30 s (‘+N-MPER’), peptide (4 µM) was added to a stirring solution of unlabeled vesicles (90 µM lipid), and, after 120 s (indicated by the arrow), the mixture was supplemented with N-NBD-PE/N-Rh-PE-labeled vesicles (10 µM lipid). The increase in NBD fluorescence over time follows the dilution of the probes upon mixing of lipids of target and primed vesicles (+N MPER trace). NBD increase was substantially diminished in samples incubated with bi-2H10 (2 µg/ml) prior to the addition of the target vesicles (+bi-2H10, dotted trace), and totally absent if unlabeled vesicles were devoid of peptide (‘no peptide’ trace). (B) Kinetic traces of N-MPER-induced lipid-mixing comparing the blocking effects of 2H10-RKRF, bi-2H10, Fab 2F5 and Fab 10E8. (C) Absence of effects on lipid-mixing of 2H10-RKRF, bi-2H10 and Fab 2F5 when vesicles were primed for fusion with the C-MPER peptide, devoid of 2H10 and 2F5 epitope sequences. The positive control Fab 10E8 efficiently blocked the process. Antibody concentrations were 20 µg/ml in these assays. (D) Dose-response plots comparing the inhibitory capacities of 2H10-RKRF and bi-2H10 (purple and green traces, respectively). Levels of lipid-mixing 20 or 300 s after target vesicle injection were measured (initial rates D and final extents, E) and percentages of inhibition calculated as a function of the Ab concentration. The dotted line and empty symbols correspond to the effect of bi-2H10 when the concentration of the component 2H10 was plotted. The slashed vertical lines mark the 2H10-to-peptide ratios of 1:6 and 1:3. Plotted values are means ± SD of three independent experiments.
Figure 2—figure supplement 1
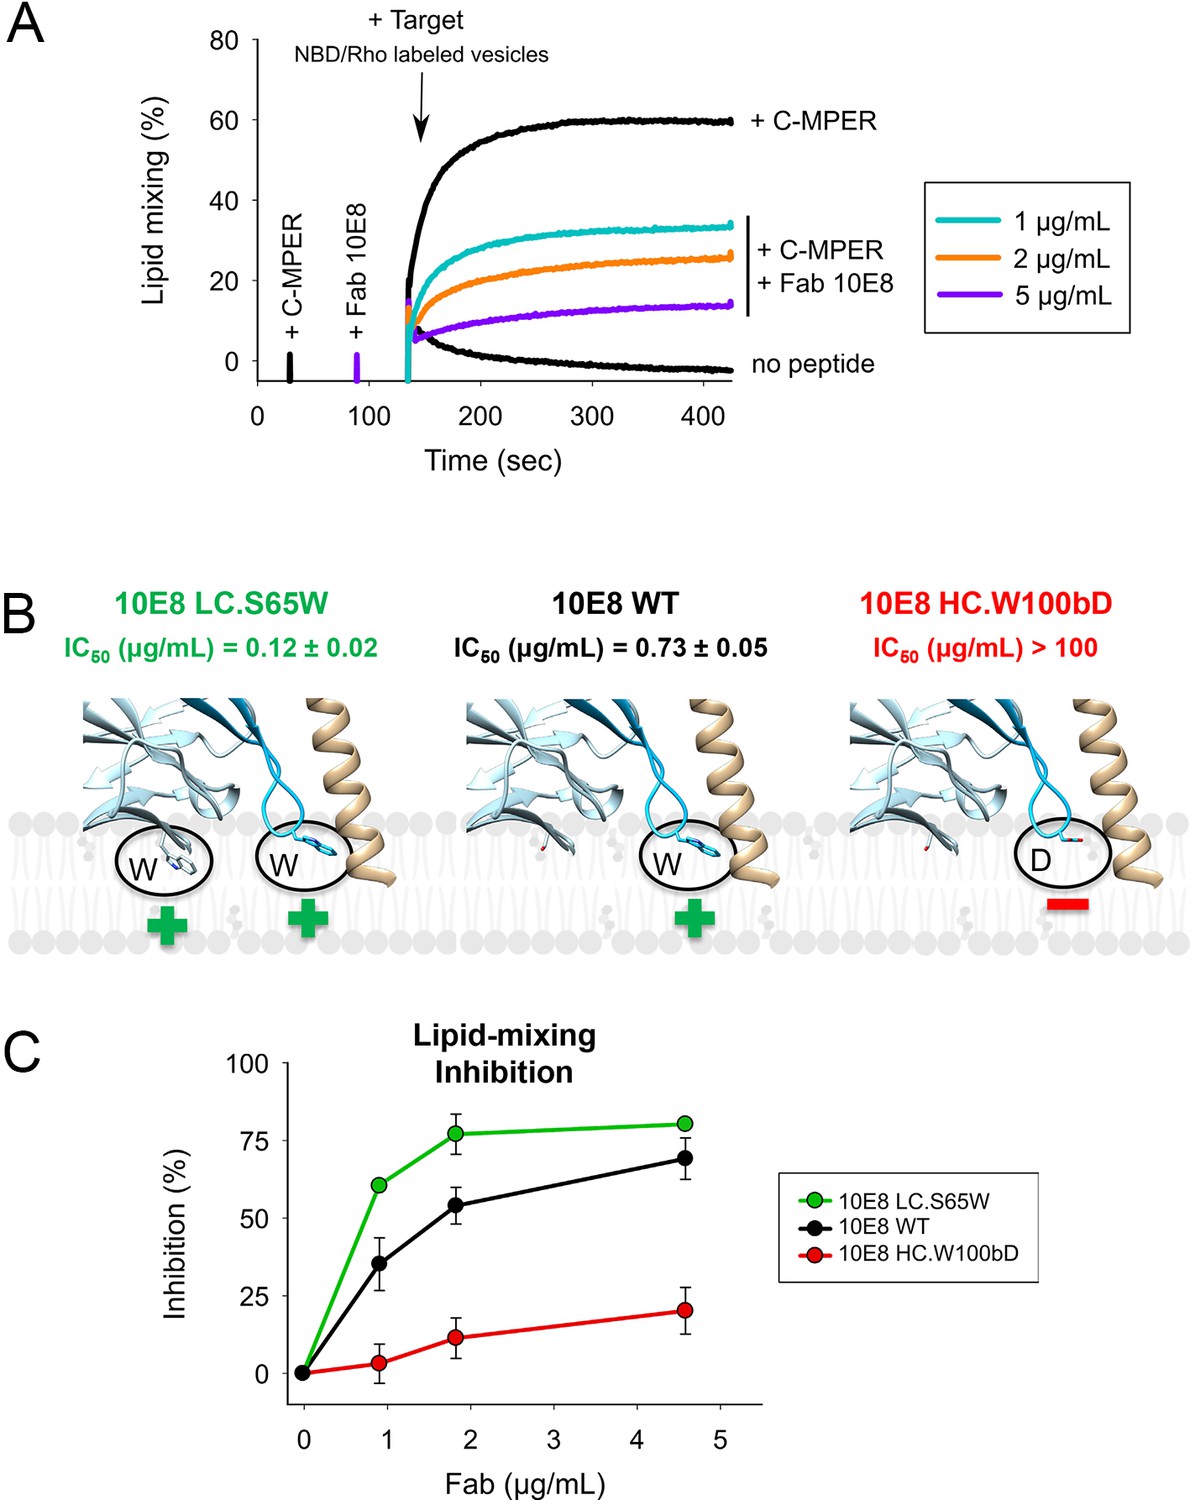
Vesicle-vesicle fusion inhibition by 10E8 Fabs.
(A) Time course of the lipid-mixing assay using fusion-committed vesicles. At time 30 s (‘+C-MPER’), peptide (4 µM) was added to a stirring solution of unlabeled vesicles (90 µM lipid), and, after 120 s (indicated by the arrow), the mixture was supplemented with N-NBD-PE/N-Rh-PE-labeled vesicles (10 µM lipid). The increase in NBD fluorescence over time follows the dilution of the probes upon mixing of lipids of target and primed vesicles (+N MPER trace). NBD increase was substantially reduced by 10E8 Fabs in a concentration-dependent manner. (B) Close-up of models of 10E8 Fab membrane interaction. Left panel, the 10E8 light chain S65W mutation increases membrane binding; middle panel, wild-type 10E8 showing the hCDR3 W100b and right panel, reduced membrane binding by the hCDR3 W100bD mutant. (C) Lipid mixing inhibition by the membrane interacting 10E8 Fab mutants demonstrates that lipid mixing inhibition correlates with membrane binding.
Figure 3 with 1 supplement
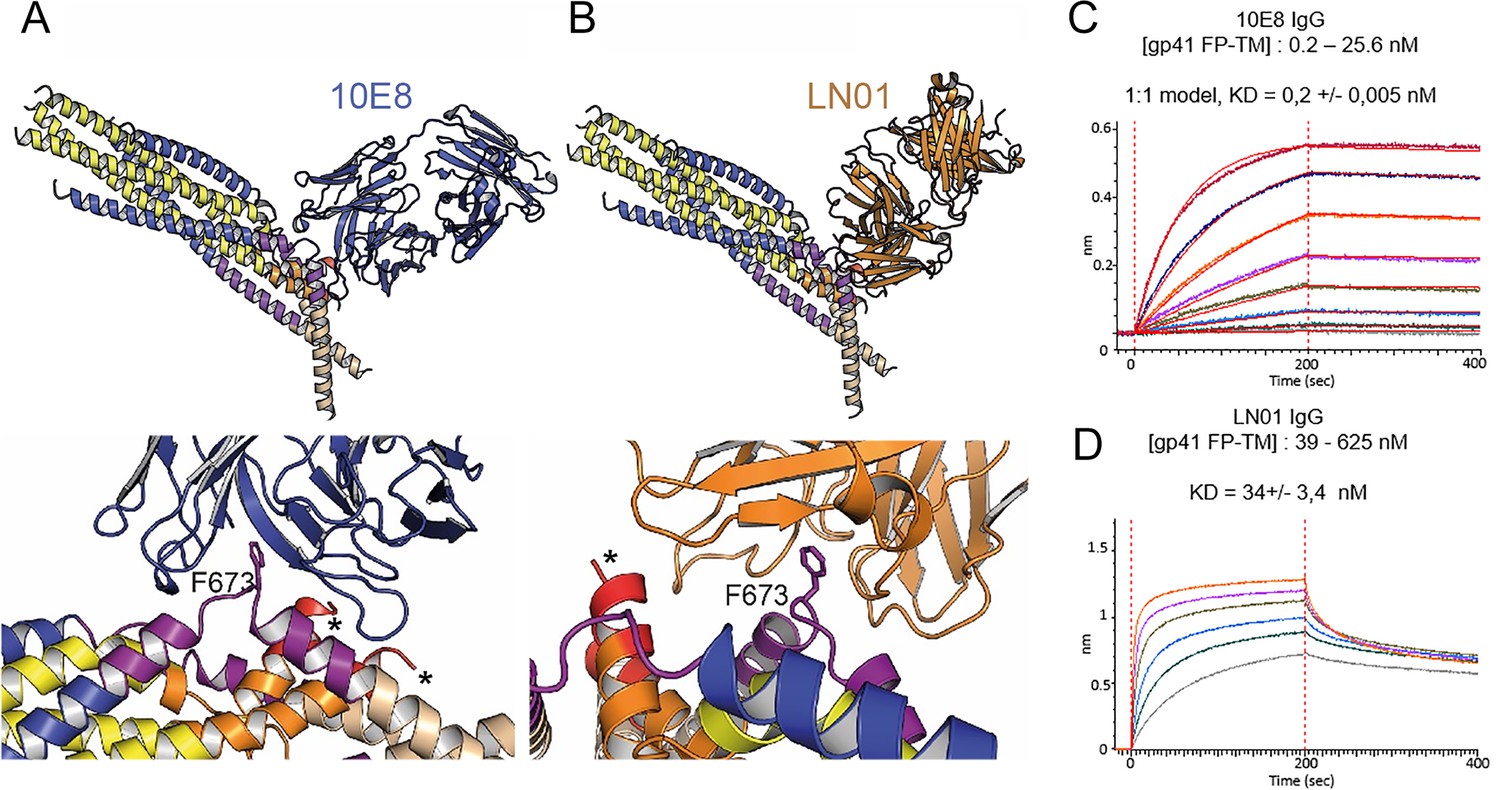
Gp41FP-TM interaction with bnAbs LN01 and 10E8.
(A) Cα superposition of the MPER peptide structure in complex with LN01 (pdb 6snd) onto chain C-C of the gp41FP-TM-2H10 structure. The lower panel shows a close-up of the interaction oriented with respect to gp41 F673. (B) Cα superposition of the MPER peptide structure in complex with 10E8 (pdb 5iq7) onto the corresponding chain C-C of gp41FP-TM. The lower panel shows a close-up of the interaction in the same orientation as in A. (C) Bio-layer interferometry (BLI) binding of gp41FP-TM to 10E8 and (D) to LN01. 10E8 binding was fit to 1:1 model and for LN01 a steady state model was employed for fitting the data. For 10E8 binding, gp41FP-TM was used at concentrations from 0.2 to 25.6 nM and for LN01 binding gp41FP-TM concentrations ranged from 39 to 625 nM.
Figure 3—figure supplement 1
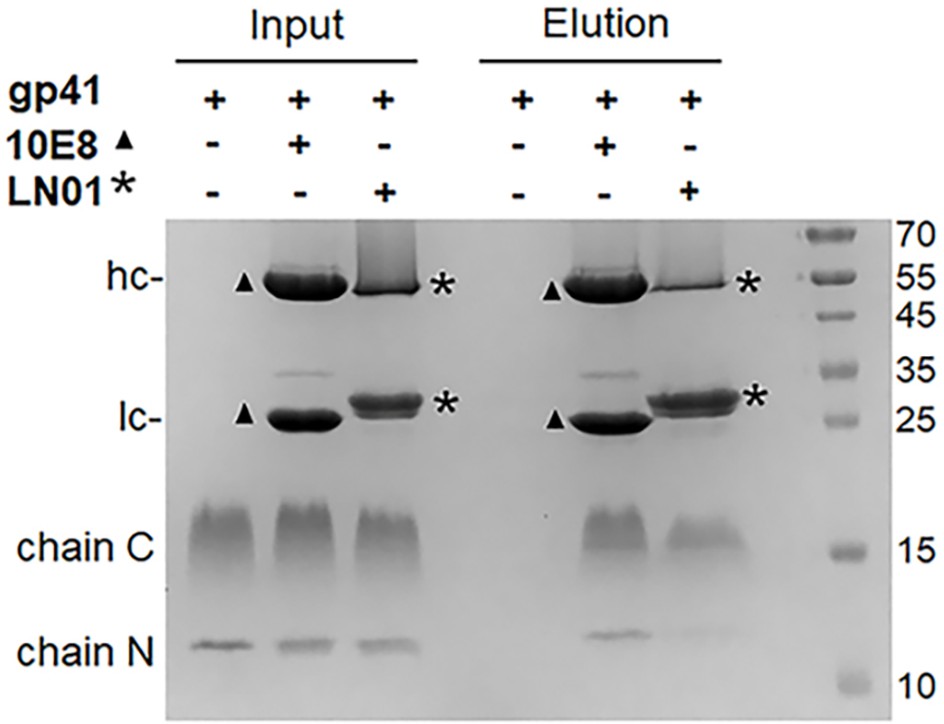
Pull down of gp41FP-TM by bnAb 10E8 and LN01.
Immunoprecipitation of gp41FP-TM by bNAbs 10E8 and LN01. Input and eluted fractions were analyzed on SDS-gel and stained with Coomassie brilliant blue. Input fractions correspond to gp41FP-TM alone (lane 1), with 10E8 (lane 2) and with LN01 (lane 3) before incubation with protein A sepharose resin. In absence of antibody, gp41FP-TM is not retained by protein A sepharose (lane 4) but complexes of gp41FP-TM-10E8 and gp41FP-TM-LN01 are eluted from protein A sepharose (lanes 5 and 6, respectively). Bands corresponding to the heavy (hc) and light (lc) chains of 10E8 chains are indicated by ▲ and those of LN01 by *. The N- and C-terminal chains of gp41FP-TM are indicated. Molecular weight markers are in kDa.
Figure 4 with 2 supplements
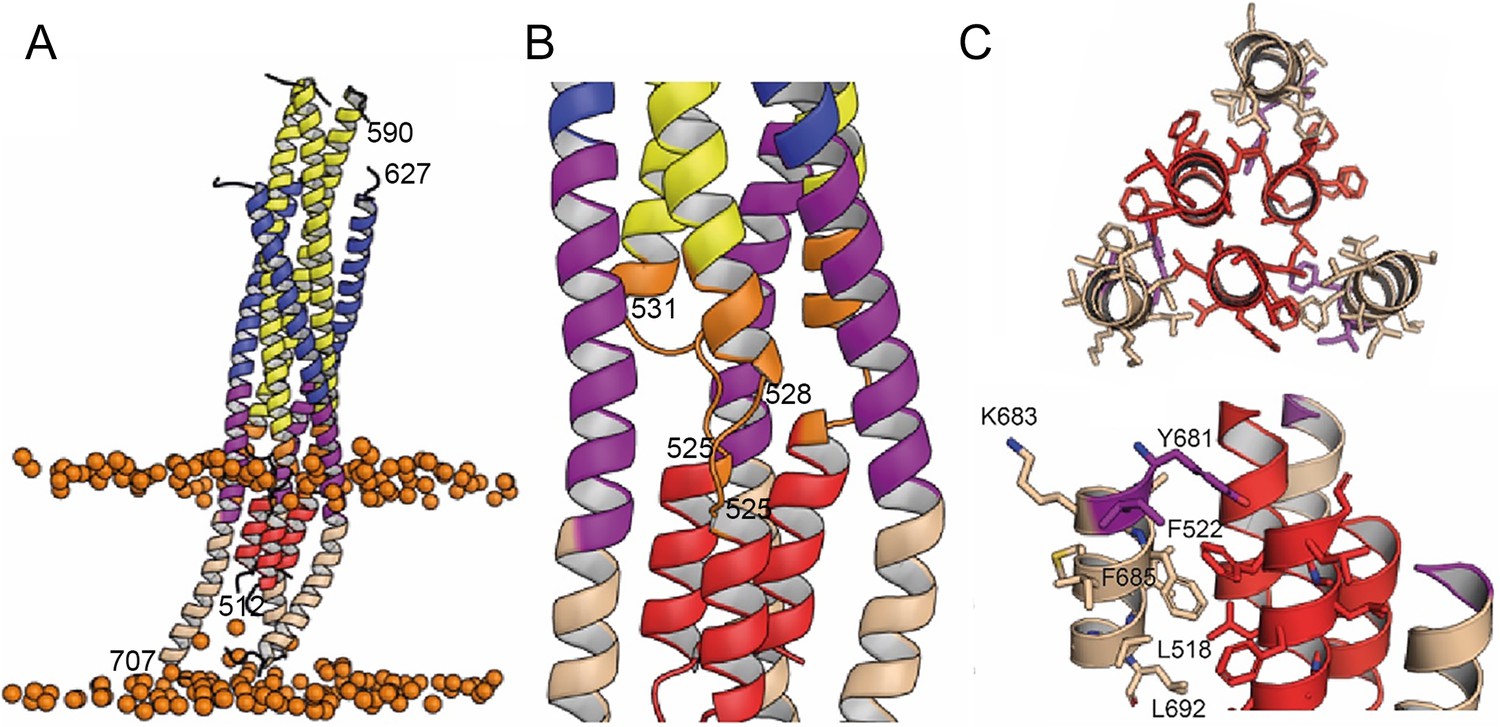
Interactions within the final post fusion conformation of gp41FP-TM modeled by MD.
(A) Model of gp41FP-TM (Figure 1—figure supplement 7C) after 1µs MD simulation in a bilayer. Phosphate groups of the phospholipids are shown as orange spheres to delineate the membrane boundaries. (B) Close-up on the MPER and FPPR flexible regions. (C) Close-up of the interaction of FP (residues 514–524) and TM (residues 681–692) viewed along the three-fold axis from the N-terminus indicating an intricate network of hydrophobic interactions (left panel) and from the side (right panel). Interacting side chains are labeled and shown as sticks.
Figure 4—figure supplement 1
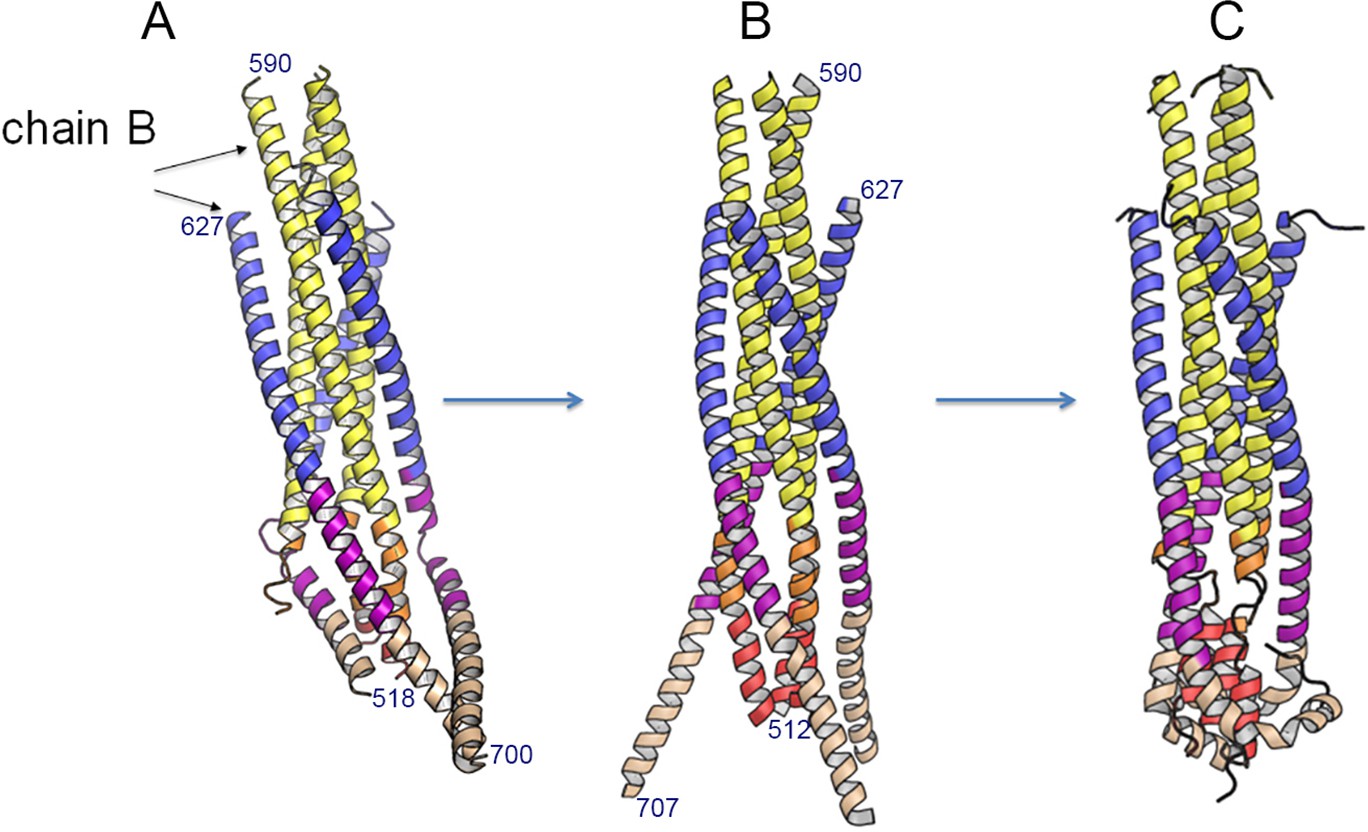
Modeling a post fusion conformation by MD simulation.
(A) Ribbon of the crystal structure of gp41FP-TM. Numbering of chain B is as shown in Figure 1F. (B) Ribbon of the symmetric trimer model built from chains N-B and C-B of the gp41FP-TM structure. Residues 512–517 and 701–707 have been modeled in a helical conformation to provide complete models of FP and TM. (C) 1 µs MD simulation of the model shown in B, which refolds FPPR-FP and MPER-TM. The kinks in the TM at conserved Gly positions have been observed before (Pinto et al., 2019).
Figure 4—figure supplement 2
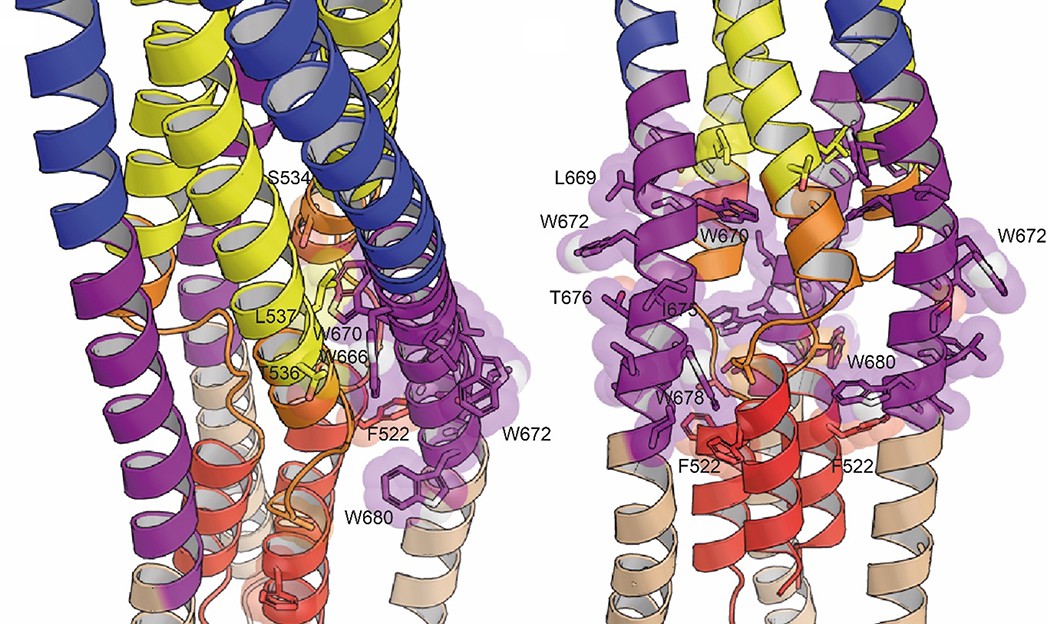
Positions of the conserved tryptophan residues of MPER in the post fusion model.
Tryptophan residues W666, W670, W672, W678, and W680 and their close-by potential contacts are shown as spheres.
Figure 5
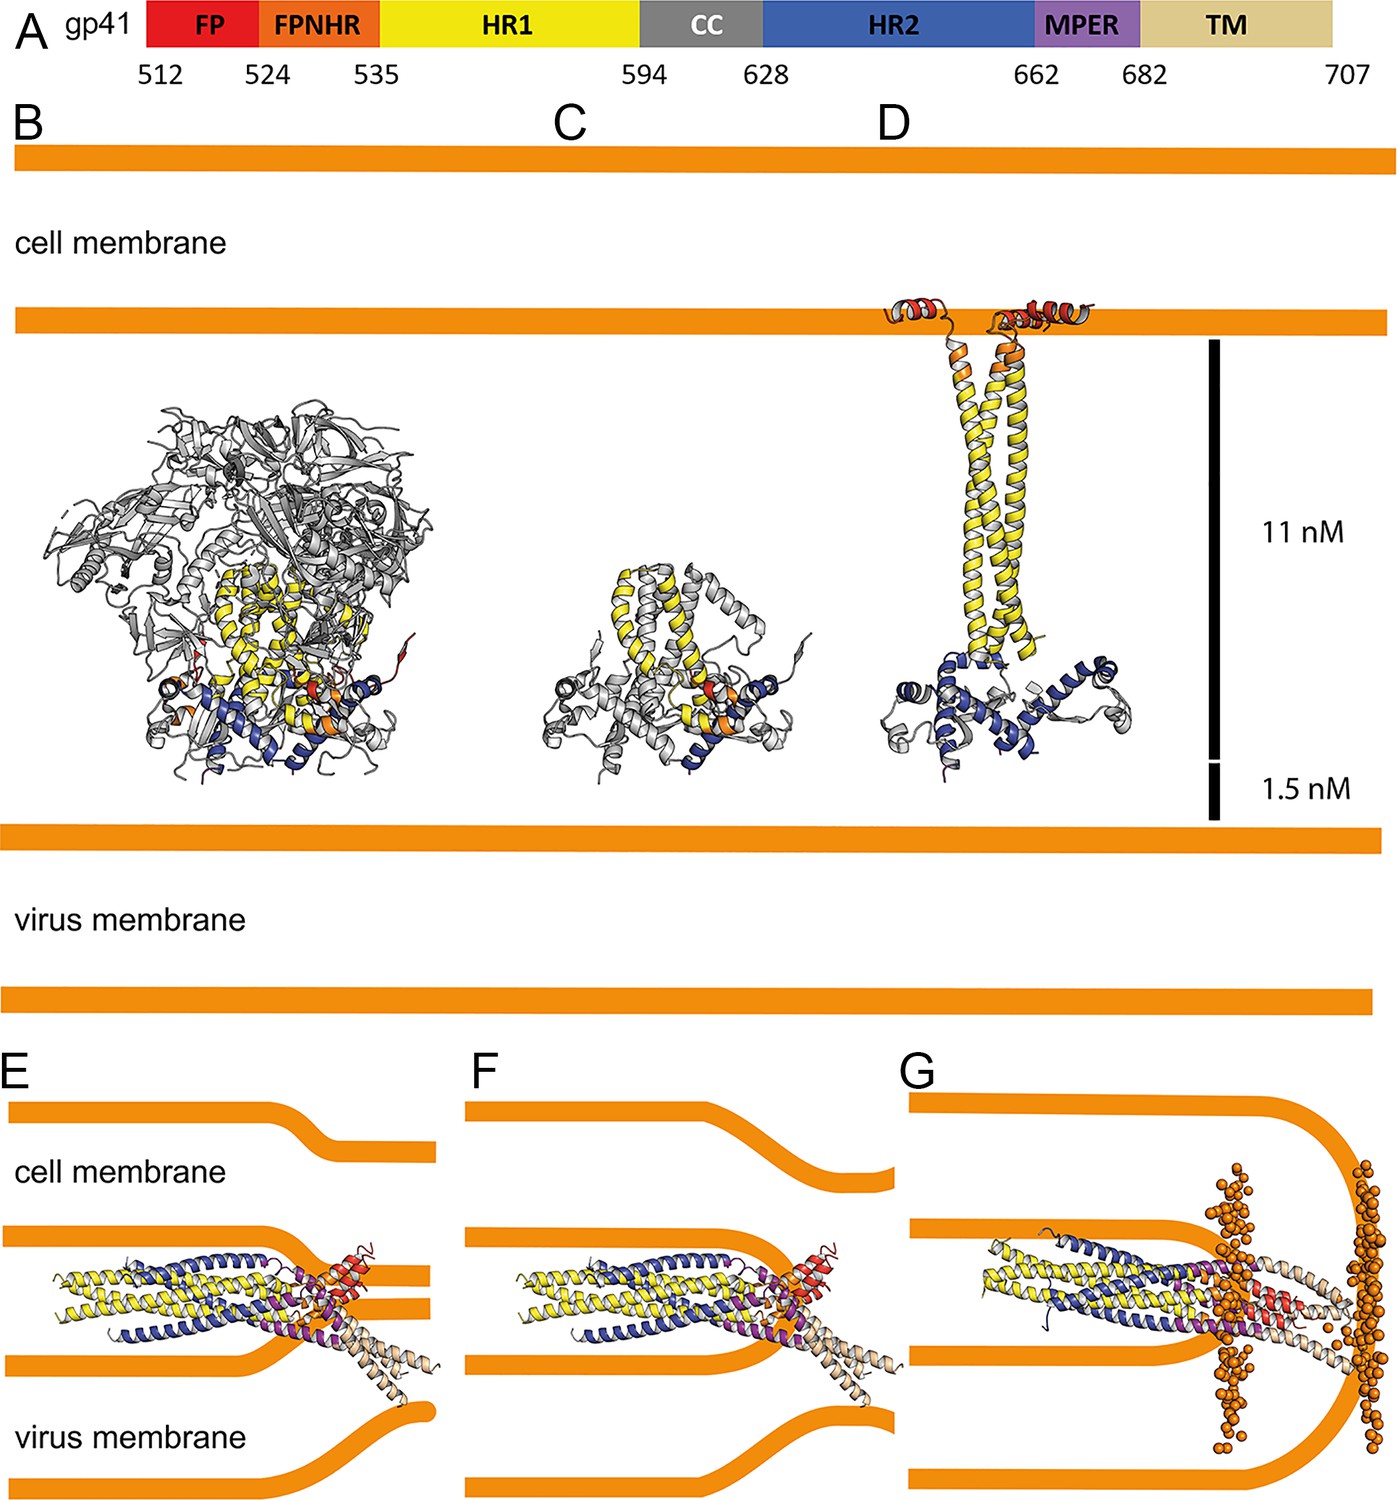
Conformational transitions of gp41 that lead to membrane apposition and membrane fusion.
(A) Representation of the different domains of gp41 with the residue numbers delimiting each domain as indicated. The same color code has been used in all the figures. (B) Ribbon presentation of the Env prefusion conformation (pdb 5fuu), gp41 is constrained by gp120 in its native conformation. The structure of native gp41 lacks the MPER and TM regions. MPER is spanning a distance of 1.5 nm (Li et al., 2020). (C) Ribbon of native gp41, one chain is colored according to the sheme in A and the other two chains are shown in gray. (D) Binding to cellular receptors CD4 and subsequently to CXCR4/CCR5 induces a series of conformational changes that eventually leads to the dissociation of gp120. During this process, HR1, FPPR and FP will form a long triple stranded coiled coil extending 11 nm toward the target cell membrane. In a first step, HR2 may keep its prefusion conformation in analogy to a similar intermediate, activated influenza virus HA structure (Benton et al., 2020). Alternatively, HR2 may dissociate and form a more extended conformation in agreement with locked gp41 structures bridging viral and cellular membranes that bridge distances of 11–15 nm (Ladinsky et al., 2020). (E) Bending of HR1 and HR2 will result in the six-helical bundle core structure bringing cellular and viral membranes into close apposition with the three FPs anchored in the cellular membrane and the three TMs anchored in the viral membrane, the gp41 conformation represented by the gp41FP-TM structure. This intermedaite gp41 conformation may have brought both membranes into close apposition or may have already induced hemifuison as indicated in F. (G) Further reolding of FPPR-FP and MPER-TM results in the final extremely stable post-fusion conformation. This suggests that rearrangment of the membrane anchors plays crucial roles in lipid mixing, breaking the hemifusion diaphragm to allow fusion pore opening. Boundaries of the lipid layers are shown with orange spheres representing the phosphate atomes of the lipids present in the MD simulation (snapshop taken after 1µs MD simuation).
Author response image 1

MALDI-TOF analysis of gp41FP-TM.
The raw spectrum shows the single and doubly charged ion of chains N and C.
Author response image 2
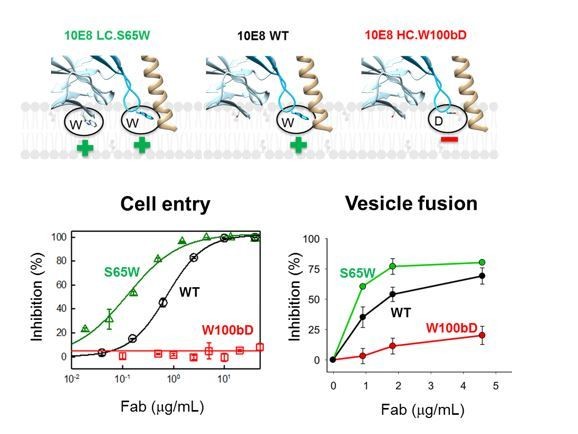
Neutralization potency of 10E8 Fab variants (cell entry inhibition measured against HIV-1 virions pseudotyped with JR-CSF Env) and their ability to block C-MPER-induced lipid-mixing.
The top diagram (Figure 2—figure supplement 1B) shows the mutated residues and their positions with respect to the putative membrane binding.
Author response image 3

Gp41(512-711) used in this experiment, composed of residues 512-581 and 628-711 (including FP-FPPR and MPER-TM), reveals a Tm of 90°C (green curve, buffer DDM) and gp41(528-683) (including FPPR and MPER) has a Tm of 88°C (black curve, no detergent).
Please note that gp41FP-TM used in the current study is composed of residues 512-594 with a 13 aa longer N-terminal coiled coil and a 5 residue C-terminal extension to residue 716. The two curves are shown in comparison to the gp41 core structure composed of residues 541-665 (blue curve, no detergent).
Tables
Table 1
Crystallographic data collection and refinement statistics.
| Data collection | Gp41FP-TM* |
|---|---|
| Space group | C 2 2 21 |
| Cell dimensions | |
| a, b, c (Å) | 96.75, 101.41, 234.42 |
| α, β, γ (°) | 90, 90, 90 |
| Resolution (Å) | 48.38–3.8 (3.94–3.8) * |
| Unique reflexions | 11179 (631)* |
| Rmerge† | 0.23 (1.508)* |
| Rp.i.m ‡ | 0.081 (0.548) |
| I / σI | 4.75 (1.74) * |
| Completeness (%) | 78.01 (54.69) * |
| Multiplicity | 9.1 (9.6) * |
| CC (1/2) | 0.992 (0.628) * |
| Refinement | |
| Resolution (Å) | 48.38–3.8 (3.936–3.8)* |
| No. reflections | 9154 (630)* |
| Reflections used for Rfree§ | 550 (51)* |
| Rwork§ / Rfree** | 0.265/0.308 |
| No. atoms | |
| Protein | 4440 |
| Ligand/ion | 0 |
| Water | 0 |
| Wilson B (Å2) | 75.8 |
| Average B-factors (Å2) | |
| Overall | 91.76 |
| Protein | 91.76 |
| Ligand/ion | |
| Water | |
| R.m.s deviations | |
| Bond lengths (Å) | 0.003 |
| Bond angles (°) | 0.66 |
| Ramachandran Plot (%) | |
| Favored | 96.65 |
| Outliers | 0.37 |
| PDB ID | 7AEJ |
-
*Data collected from two crystals were used for structure determination.
The statistics are for data that were truncated by STARANISO to remove poorly measured reflections affected by anisotropy. Rmerge, Rp.i.m and multiplicity are calculated on unmerged data prior to STARANISO truncation. For comparison, after STARANISO truncation, Rmerge in the resolution shell 3.97 Å - 3.85 Å is 0.787.
-
† Parentheses refer to outer shell statistics.
‡ Rmerge = Σhkl Σi | Ihkl,i- < Ihkl > | / Σhkl ΣiIhkl,i, where Ihkl,i is the scaled intensity of the ith measurement of reflection h, k, l, and <Ihkl > is the average intensity for that reflection.
-
§ R p.i.m. = Σhkl √1/(n-1) Σi | Ihkl,i- < Ihkl > | / Σhkl ΣiIhkl,i,.
¶ Rwork = Σhkl | Fo - Fc | / Σhkl | Fo | x 100, where Fo and Fc are the observed and calculated structures factors.
-
** Rfree was calculated as for Rwork, but on a test set of 5% of the data excluded from refinement.
-
Table 1—source data 1
Env pseudoviruses.
- https://cdn.elifesciences.org/articles/65005/elife-65005-table1-data1-v2.docx
Table 2
Pseudovirus neutralization by 2H10, 2H10-F, 2H10-RKRF, and bi-2H10 in comparison to 2F5 and VRC01.
IC50s are indicated in µg/ml.
| Tier | 2H10 wt | 2H10-F | 2H10-RKRF | Bi-2H10 | 2F5 | VRC01 | |
|---|---|---|---|---|---|---|---|
| NL4-3 | 1 | 25.20 | 18.68 | 9.15 | 1.84 | 0.16 | 0.20 |
| MN-3 | 1 | >50.00 | 30.38 | 9.36 | 1.39 | 0.03 | 0.06 |
| BaL.26 | 1 | >50.00 | 19.38 | 9.63 | 6.05 | 1.21 | 0.13 |
| SF162 | 1a | >50.00 | >50.00 | 25.19 | 6.14 | 1.22 | 0.39 |
| SF162P3 | 2 | 22.04 | 13.14 | 6.76 | 1.32 | 1.96 | 0.24 |
| SC422661.8 | 2 | >50.00 | >50.00 | 27.93 | 3.79 | 1.00 | 0.27 |
| JR-FL | 2 | 44.65 | 16.93 | 6.95 | 1.49 | 0.97 | 0.11 |
| JR-CSF | 2 | >50.00 | 21.66 | 10.85 | 2.85 | 1.24 | 0.37 |
| QH0692.42 | 2 | >50.00 | >50.00 | >50.00 | >50.00 | 1.20 | 1.21 |
| THRO4156.18 | 2 | >50.00 | >50.00 | >50.00 | >50.00 | >50.00 | 3.84 |
Key resources table
| Reagent type (species) or resource | Designation | Source or reference | Identifiers | Additional information |
|---|---|---|---|---|
| Recombinant DNA reagent | Chain N pETM20 (plasmid) | This study | pETM20, PEPcore facility-EMBL | |
| Recombinant DNA reagent | Chain C pETM11 (plasmid) | This study | pETM11, PEPcore facility-EMBL | |
| Recombinant DNA reagent | 2H10 pAX51 (plasmid) | Lutje Hulsik et al., 2013 | PMID:23505368 | |
| Recombinant DNA reagent | 2H10-F pAX51 (plasmid) | This study | S100d to F mutation | |
| Recombinant DNA reagent | 2H10-RKRF pAX51 (plasmid) | This study | S27R, S30K, S74R and S100d to F mutations | |
| Strain, strain background (Escherichia coli) | BL21(DE3) | ThermoFisher | Cat# EC0114 | |
| Strain, strain background (Escherichia coli) | C41(DE3) | Lucigen | Cat#60442 | |
| Cell line (Homo sapiens) | TZM-bl | NIH AIDS Reagent Program | Cat#ARP-8129 RRID:CVCL_B478 | |
| Cell line (Homo sapiens) | HEK293T | ATTC | Cat# CRL-11268 RRID:CVCL_1926 | |
| Antibody (human monoclonal) | α-gp41, LN01 | Pinto et al., 2019 | PMID:31653484 | See Materials and methods |
| Antibody (human monoclonal) | α-gp41, 10E8 | Huang et al., 2012 | PMID:23151583 RRID:AB_2491067 | See Materials and methods |
| Antibody (human monoclonal) | α-gp41, 2F5 | Muster et al., 1993 | PMID:7692082 | See Materials and methods |
| Antibody (human monoclonal) | α-gp140, VRC01 | Zhou et al., 2010 | PMID:20616231 RRID:AB_2491019 | See Materials and methods |
| Antibody (llama nanobody) | α-gp41, 2H10 | Lutje Hulsik et al., 2013 | PMID:23505368 | See Materials and methods |
| Antibody (llama nanobody) | α-gp41, bi-2H10 | Lutje Hulsik et al., 2013 | PMID:23505368 | See Materials and methods |
| Antibody (llama nanobody) | α-gp41, 2H10-F | This study | See Materials and methods | |
| Antibody (llama nanobody) | α-gp41, 2H10-RKRF | This study | See Materials and methods | |
| Chemical compound, drug | Chelating sepharose FF | GE Healthcare | Cat# 17057501 | |
| Chemical compound, drug | Q sepharose FF | GE Healthcare | Cat# 17051010 | |
| Chemical compound, drug | Q sepharose FF | GE Healthcare | Cat# 17051010 | |
| Chemical compound, drug | n-Octyl-β-D-glucosid n-Octyl-β-D-Glucopyranoside | Anatrace | Cat#O311 | |
| Chemical compound, drug | CHAPS (3-[(3-cholamidopropyl) diméthylammonio]−1-propanesulfonate) | Euromedex | Cat#1083E | |
| Chemical compound, drug | 1-palmitoyl-2-oleoylphosphatidylcholine (POPC) | Avanti Polar Lipids | Cat#850457P | |
| Chemical compound, drug | 1-palmitoyl-2-oleoyl-sn-glycero-3-phosphoethanolamine (POPE) | Avanti Polar Lipids | Cat#850757P | |
| Chemical compound, drug | 1-palmitoyl-2-oleoyl-sn-glycero-3-phospho-L -serine (POPS) | Avanti Polar Lipids | Cat#840034C | |
| Chemical compound, drug | sphingomyelin | Avanti Polar Lipids | Cat#860062C | |
| Chemical compound, drug | cholesterol | Avanti Polar Lipids | Cat#700000P | |
| Chemical compound, drug | N-(7-nitro-benz-2-oxa-1,3-diazol-4-yl)phosphatidylethanolamine (N-NBD-PE) | Molecular Probes | Cat#N360 | |
| Chemical compound, drug | N-(lissamine Rhodamine B sulfonyl) phosphatidylethanolamine (N-Rh-PE) | Molecular Probes | Cat#L1392 | |
| Chemical compound, drug | Biscinchoninic Acid microassay | Pierce | Cat# 23235 | |
| Chemical compound, drug | Bio-Rad Protein Assay Dye Reagent Concentrate | Biorad | Cat# 5000006 | |
| Software, algorithm | XDS | Kabsch, 2010 | PMID:20124693 | |
| Software, algorithm | Phaser | McCoy et al., 2007 | PMID:19461840 | |
| Software, algorithm | COOT | Emsley et al., 2010 | PMID:20383002 | |
| Software, algorithm | PHENIX | Adams et al., 2010 | PMID:20124702 | |
| Software, algorithm | SBGrid | Morin et al., 2013 | https://sbgrid.org/ | |
| Software, algorithm | Pymol | Warren DeLano | http://www.pymol.org | |
| Software, algorithm | Aimless | Evans and Murshudov, 2013 | PMID:23793146 | |
| Software, algorithm | STARANISO | Tickle et al., 2018 | http://staraniso.globalphasing.org/cgi-bin/staraniso.cgi | |
| Software, algorithm | CHARMM-GUI | Jo et al., 2008 | http://www.charmm-gui.org | |
| Software, algorithm | NAMD (Version 2.13) | Phillips et al., 2005 | https://www.ks.uiuc.edu/Research/namd/ | |
| Software, algorithm | Prism 8 | GraphPad | https://www.graphpad.com/scientific-software/prism/ | |
| Software, algorithm | ForteBio analysis software version 11.1.0.25 | ForteBio | https://www.fortebio.com | |
| Software, algorithm | MicroCal Origin software (origin 7) | Malvern Panalytical (MicroCal) | https://www.malvernpanalytical.com | |
| Peptide, recombinant protein | NEQELLELDKWASLW NWFNITNWLWYIK (N-MPER) | This study | See Materials and methods | |
| Peptide, recombinant protein | KKK-NWFDITNWLWYIKLFIMIVGGLV-KK (C-MPER), | This study | See Materials and methods | |
| Commercial assay or kit | Biscinchoninic Acid microassay | Pierce | Cat# A53225 | |
| Commercial assay or kit | Bright-Glo Luciferase Assay System Streptavidin (SA) biosensors | Promega | Cat# E2610 | |
| Commercial assay or kit | Streptavidin (SA) biosensors | ForteBio | Cat#18–5019 | |
| Commercial assay or kit | EZ-LinkNHS-PEG4-Biotinylation Kit | ThermoFisher | Cat#21455 |
Additional files
Download links
A two-part list of links to download the article, or parts of the article, in various formats.
Downloads (link to download the article as PDF)
Open citations (links to open the citations from this article in various online reference manager services)
Cite this article (links to download the citations from this article in formats compatible with various reference manager tools)
Structure of HIV-1 gp41 with its membrane anchors targeted by neutralizing antibodies
eLife 10:e65005.
https://doi.org/10.7554/eLife.65005


