Transcription-associated topoisomerase 2α (TOP2A) activity is a major effector of cytotoxicity induced by G-quadruplex ligands
- Institut de Pharmacologie et Biologie Structurale, IPBS, Université de Toulouse, CNRS, UPS, France
- Equipe Labellisée Ligue Contre le Cancer 2018, France
- Structure et Instabilité des Génomes, Muséum National d’Histoire Naturelle, CNRS, INSERM, France
- INRAE, UR 875, Unité de Mathématique et Informatique Appliquées, Genotoul Bioinfo, France
- INRAE, US 1426, GeT-PlaGe, Genotoul, France
- Département de Chimie Moléculaire, UMR CNRS 5250, Université Grenoble Alpes, France
Figures
Figure 1 with 1 supplement
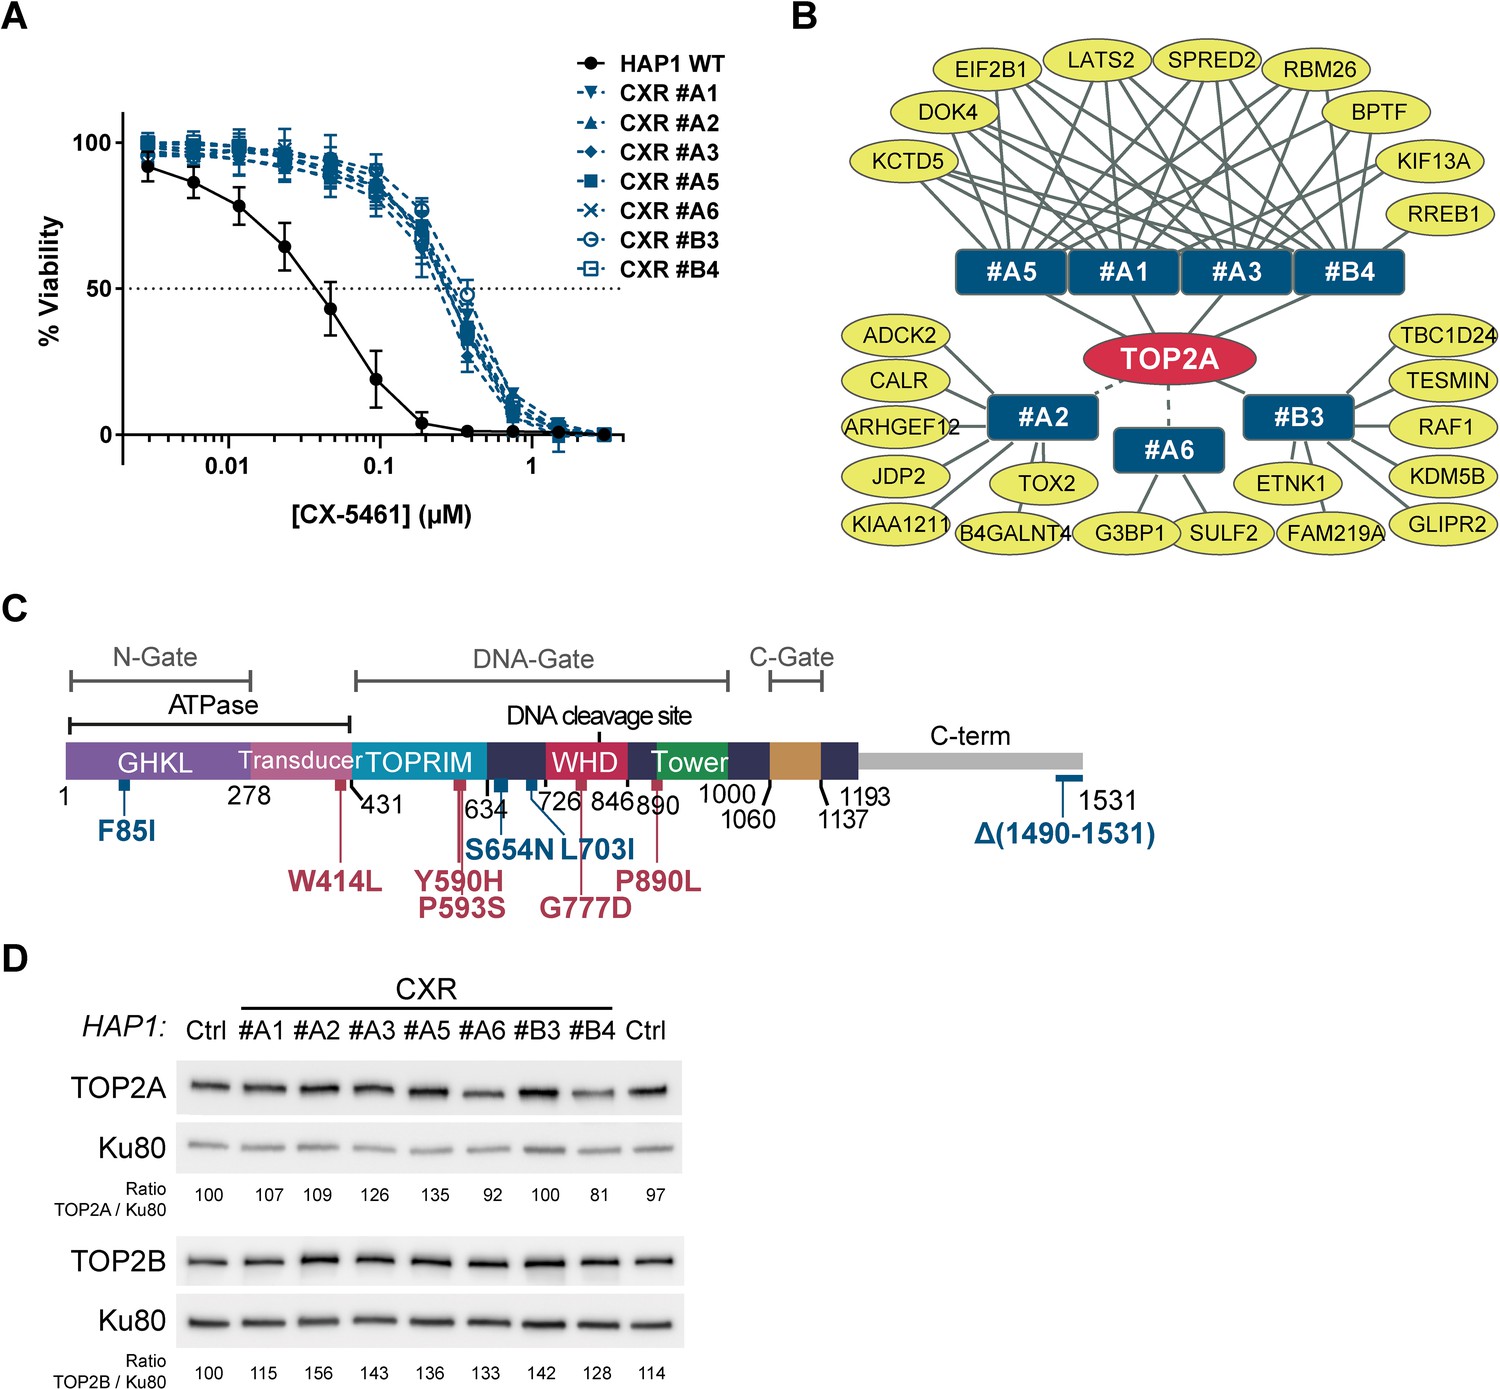
Role for topoisomerase 2α (TOP2A) in the cell toxicity of CX-5461.
(A) Viability assay on wild-type (WT) and seven CX-5461-resistant (CXR) HAP1 clones treated with CX-5461. Error bars represent SD from the means, n ≥ 3 independent experiments. (B) Representation of genes with non- and mis-sense mutations identified in CXR clones. Mutated genes identified in resistant clones (blue rectangles) are represented as yellow ovals. The presence of a TOP2A mutation in all resistant clones is schematized by the central position of TOP2A gene in the red oval. Solid and dashed lines represent respectively mutations characterized through an unbiased or manual analysis of RNA-seq data. (C) Linear schematic of TOP2A domains. Each domain is labeled and described by bordering residue numbers. TOP2A mutations present in CX-5461 or F14512-resistant clones are indicated in blue or red, respectively. (D) Immunoblotting analysis of whole-cell extracts from WT (Ctrl) and CXR HAP1 cells. Relative protein levels of TOP2A and TOP2B were quantified, normalized to KU80 level, and set to 100 in Ctrl cells.
-
Figure 1—source data 1
Raw unedited image and uncropped figure of the blot of the western blot from Figure 1.
Ponceau staining (left panels), membranes (center panels), and hybridization signals (right panels) are shown. Raw images were acquired using the ChemiDoc system (Bio-Rad). Asterisks indicate the edges of cut membranes before hybridization.
- https://cdn.elifesciences.org/articles/65184/elife-65184-fig1-data1-v2.pdf
Figure 1—figure supplement 1
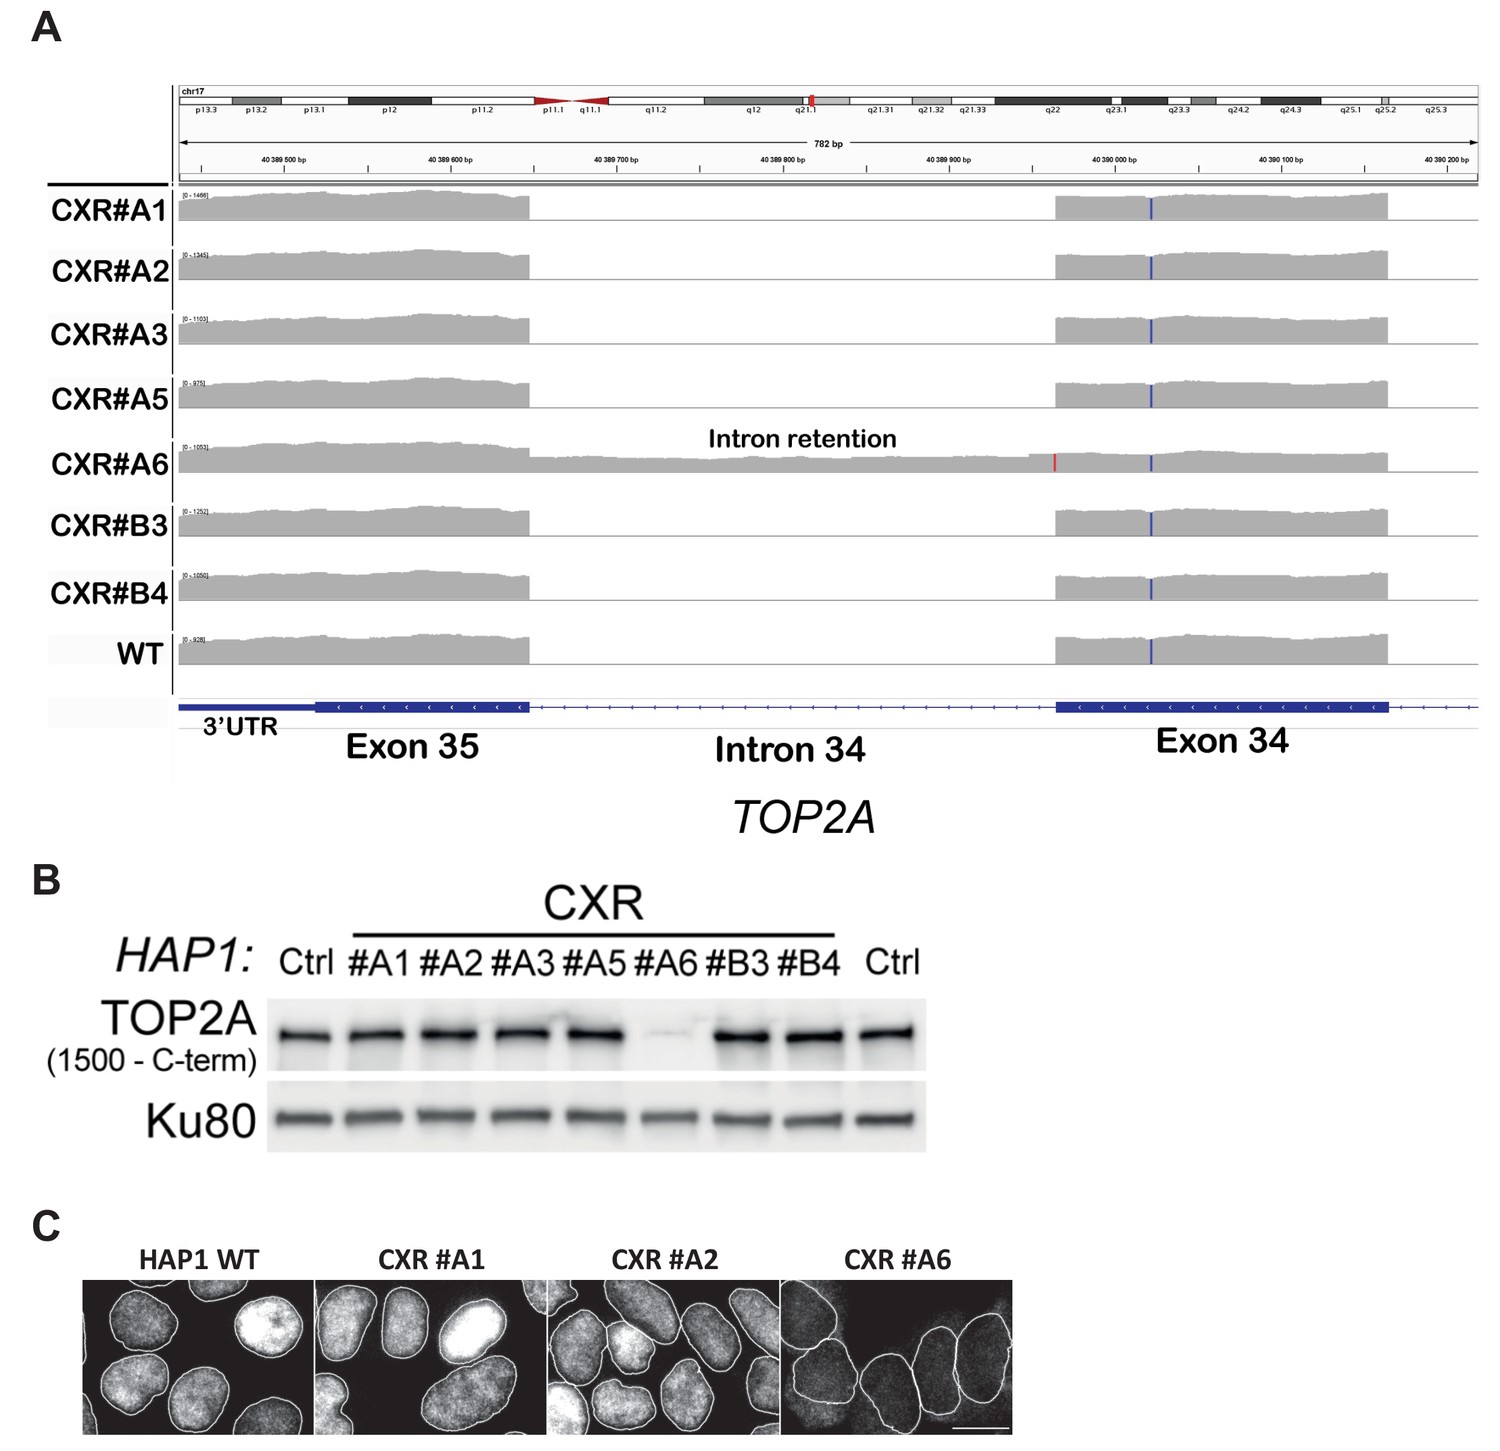
Molecular characterization of topoisomerase 2α (TOP2A) mutations in CXR cells.
(A) Graphic representation of topoisomerase 2α (TOP2A) intron retention in clone CXR #A6 carrying a homozygous mutation of the last nucleotide of the last intron, resulting in replacement of the 42 last TOP2A amino acids, carrying its nuclear localization signal (NLS), by 18 unrelated amino acids. (B) Immunoblotting analysis of whole-cell extracts from wild-type (WT) (Ctrl) and CX-5461-resistant (CXR) HAP1 cells showing the loss of TOP2A signal in CXR #A6 clone caused by the absence of C-terminal epitope recognized by the TOP2A antibody (Bethyl Laboratories antibody A300-054B). (C) Immunofluorescence analysis showing the delocalization of TOP2A protein in CXR #A6 compared to WT, CXR #A1 (TOP2A F85I), and CXR #A2 (TOP2A S654N) cells.
-
Figure 1—figure supplement 1—source data 1
Raw unedited image and uncropped figure of the blot of the western blot from Figure 1—figure supplement 1.
Ponceau staining (left panel), membrane (center panel), and hybridization signals (right panel) are shown. Raw images were acquired using the ChemiDoc system (Bio-Rad). Asterisks indicate the edges of cut membranes before hybridization.
- https://cdn.elifesciences.org/articles/65184/elife-65184-fig1-figsupp1-data1-v2.pdf
Figure 2 with 2 supplements
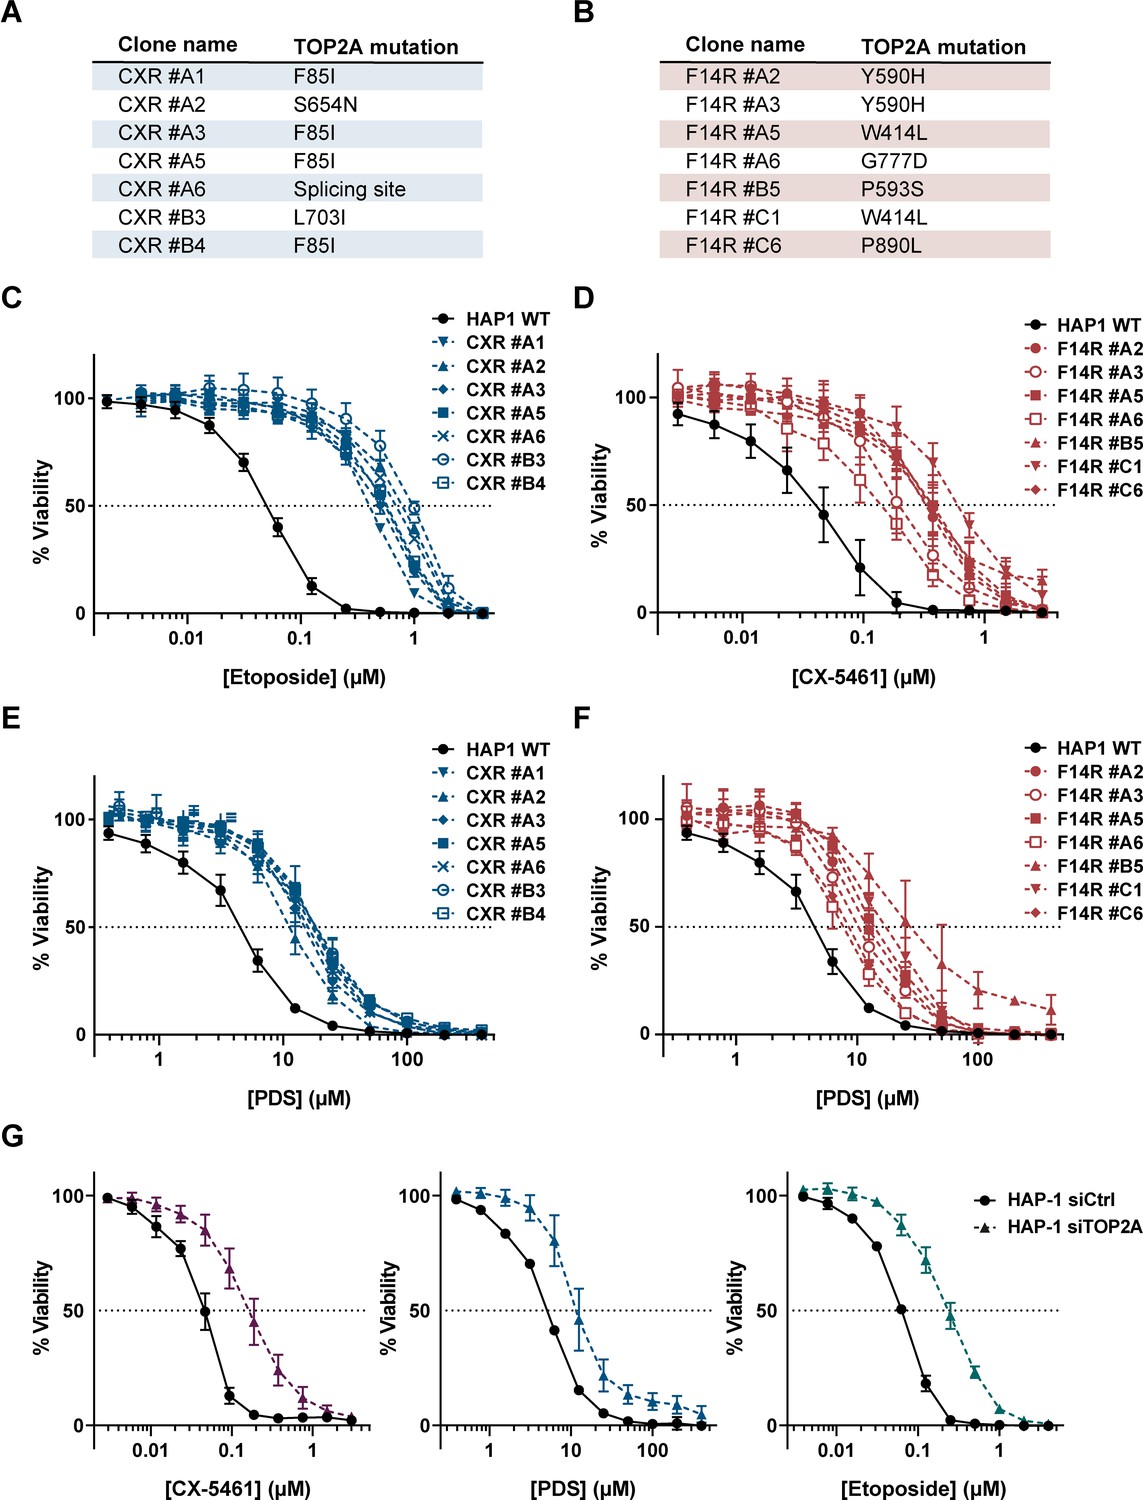
Impact of topoisomerase 2α (TOP2A) in the cell toxicity of topoisomerase poisons and G-quadruplex (G4) ligands.
(A, B) Summary of mutations found in CX-5461-resistant (CXR) (A) and F14R (B) clones. (C, E) Viability assay of CXR cells treated with etoposide (ETP) (C) and the G4 ligand pyridostatin (PDS) (E). (D, F) Viability assay of F14512-resistant cells (F14R) treated with the G4 ligands CX-5461 (D) and PDS (F). (G) Viability assay of TOP2A knock-down HAP1 cells treated with G4 ligand CX-5461 (left panel), PDS (central panel), and ETP (right panel). Error bars represent SD from the means, n ≥ 3 independent experiments.
-
Figure 2—source data 1
Raw unedited image and uncropped figure of the blot of the western blot from Figure 2.
Ponceau staining (left panel) and hybridization signals (center and right panel) are shown. Raw images correspond to the scanning of autoradiography films.
- https://cdn.elifesciences.org/articles/65184/elife-65184-fig2-data1-v2.pdf
Figure 2—figure supplement 1
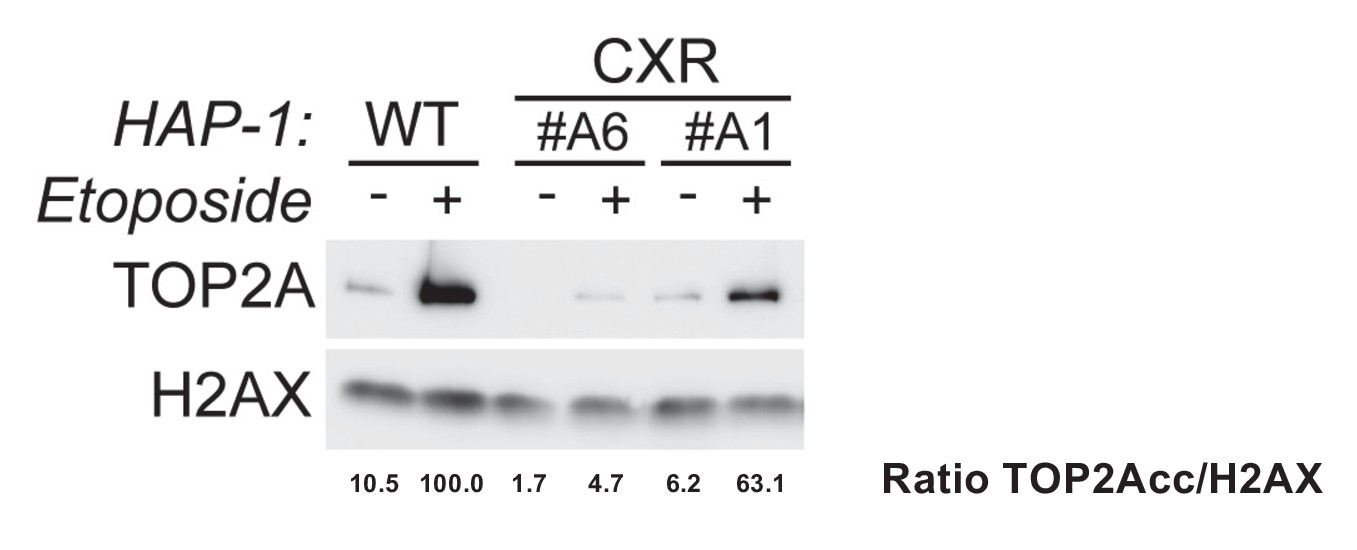
Analysis of etoposide-induced topoisomerase 2α (TOP2A) cleavage complexes in wild-type and CX-5461-resistant (CXR) HAP1.
In this assay, TOP2 proteins not covalently attached to DNA are extracted by heparin in the soluble fraction, while TOP2 cleavage complexes are resistant to this procedure and can be analyzed after centrifugation by immunoblotting of the pellet fraction. TOP2A point mutations in clones CXR #A6 (TOP2A with a different C-terminus) and CXR #A1 (TOP2A F85I) decreased the level of etoposide-induced TOP2Acc. Relative protein levels of TOP2A were quantified, normalized to H2AX level, and set to 100 in wild-type (WT) cells treated with etoposide.
-
Figure 2—figure supplement 1—source data 1
Raw unedited image and uncropped figure of the blot of the western blot from Figure 2—figure supplement 1.
Ponceau staining (left panel), membrane (center panel), and hybridization signals (right panel) are shown. Raw images were acquired using the ChemiDoc system (Bio-Rad). Asterisks indicate the edges of cut membranes before hybridization. The section of the blot used for the final figure is indicated by the dashed rectangle.
- https://cdn.elifesciences.org/articles/65184/elife-65184-fig2-figsupp1-data1-v2.pdf
Figure 2—figure supplement 2
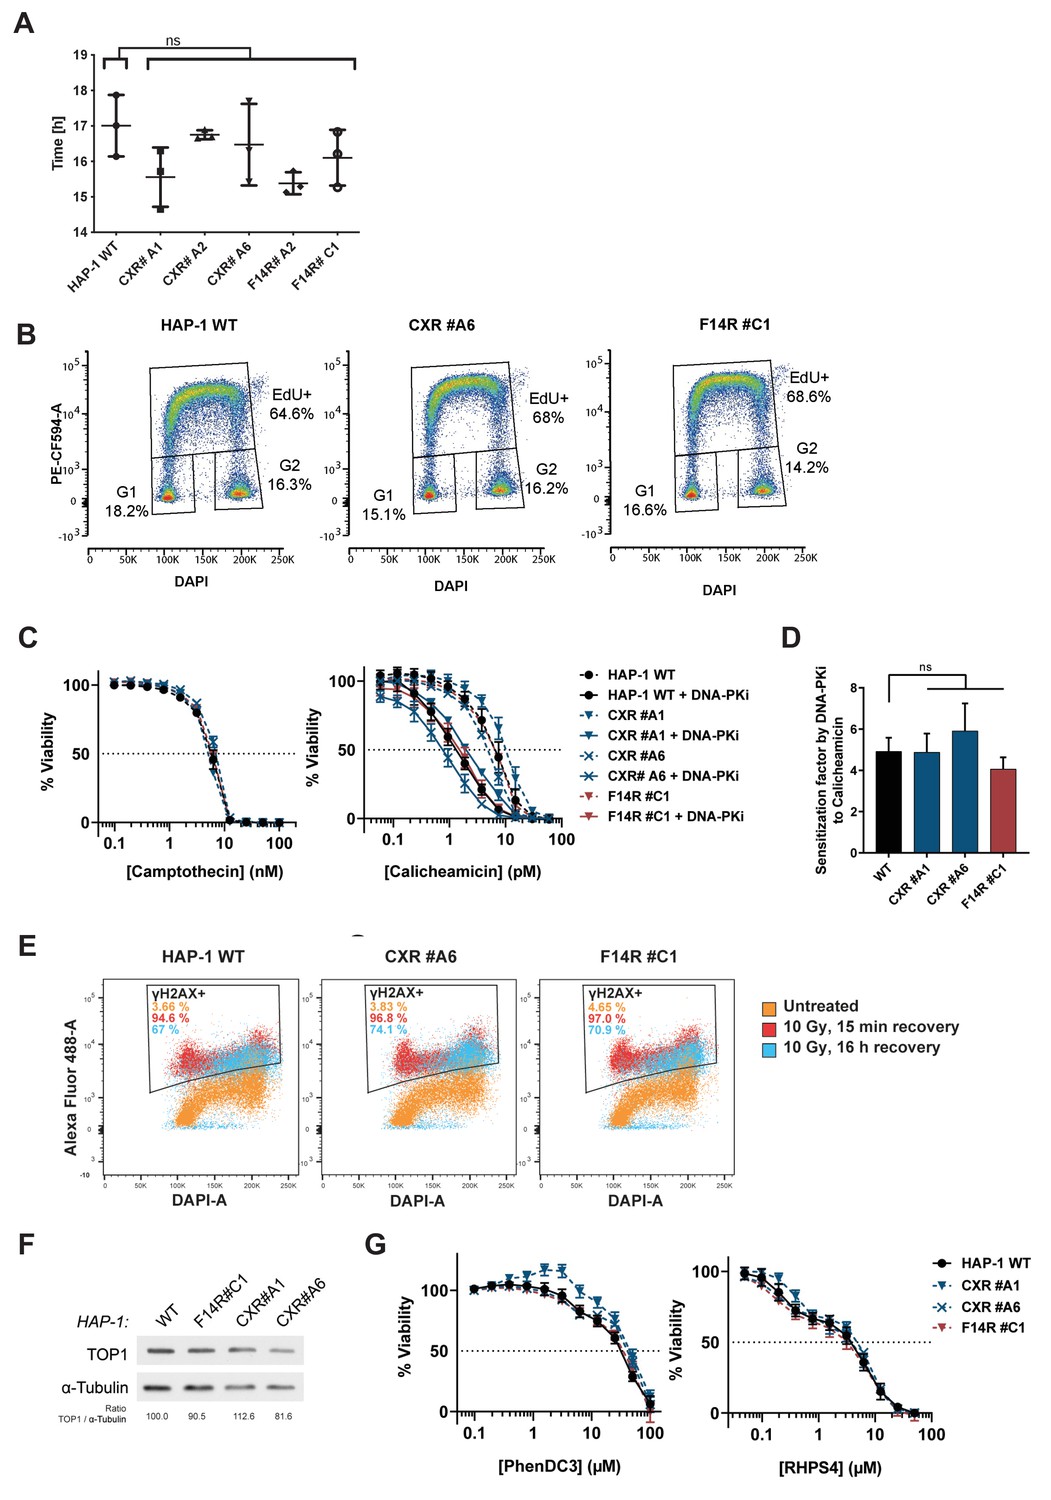
Cell proliferation and DNA repair studies in wild-type (WT) and CX-5461-resistant (CXR) HAP1 cells.
(A) Population doubling time of WT, CXR, and F14512-resistant (F14R) HAP1 cells. Error bars represent SD from the means, n ≥ 3 independent experiments. A one-way ANOVA test revealed no significant (ns) difference between the doubling time of resistant clones and the WT HAP. (B) Flow cytometry analysis of cell cycle repartition and rate of DNA synthesis in WT, CXR, and F14R HAP1 cells. (C) Viability assay of WT, CXR, and F14R HAP1 cells treated with camptothecin and calicheamicin in the presence of the DNA-Pk inhibitor (DNA-PKi) NU-7441 (2 µM). DNA-PKi was added 1 hr prior to addition of drugs. (D) Graphic representation of the sensitization effect induced by the DNA-PKi on camptothecin and calicheamicin treatments in WT, CXR, and F14R HAP1. (E) Flow cytometry analysis of γH2AX signals in WT, CXR, and F14R HAP1 following irradiation exposure (10 Gy X-ray). γH2AX signal was measured in untreated cells (orange), or 15 min (red) and 16 hr (blue) after irradiation. (F) Western blotting analysis and quantification of topoisomerase 1 level in WT, CXR, and F14R HAP1 cells. (G) Viability assay of WT, CXR, and F14R HAP1 cells treated with PhenDC3 and RHPS4. Error bars represent SD from the means, n ≥ 3 independent experiments.
-
Figure 2—figure supplement 2—source data 1
Raw unedited image and uncropped figure of the blot of the western blot from Figure 2—figure supplement 2.
Ponceau staining (left panel) and hybridization signals (right panel) are shown. Raw images correspond to the scanning of autoradiography films. The section of the blot used for the final figure is indicated by the dashed rectangle.
- https://cdn.elifesciences.org/articles/65184/elife-65184-fig2-figsupp2-data1-v2.pdf
Figure 3 with 2 supplements
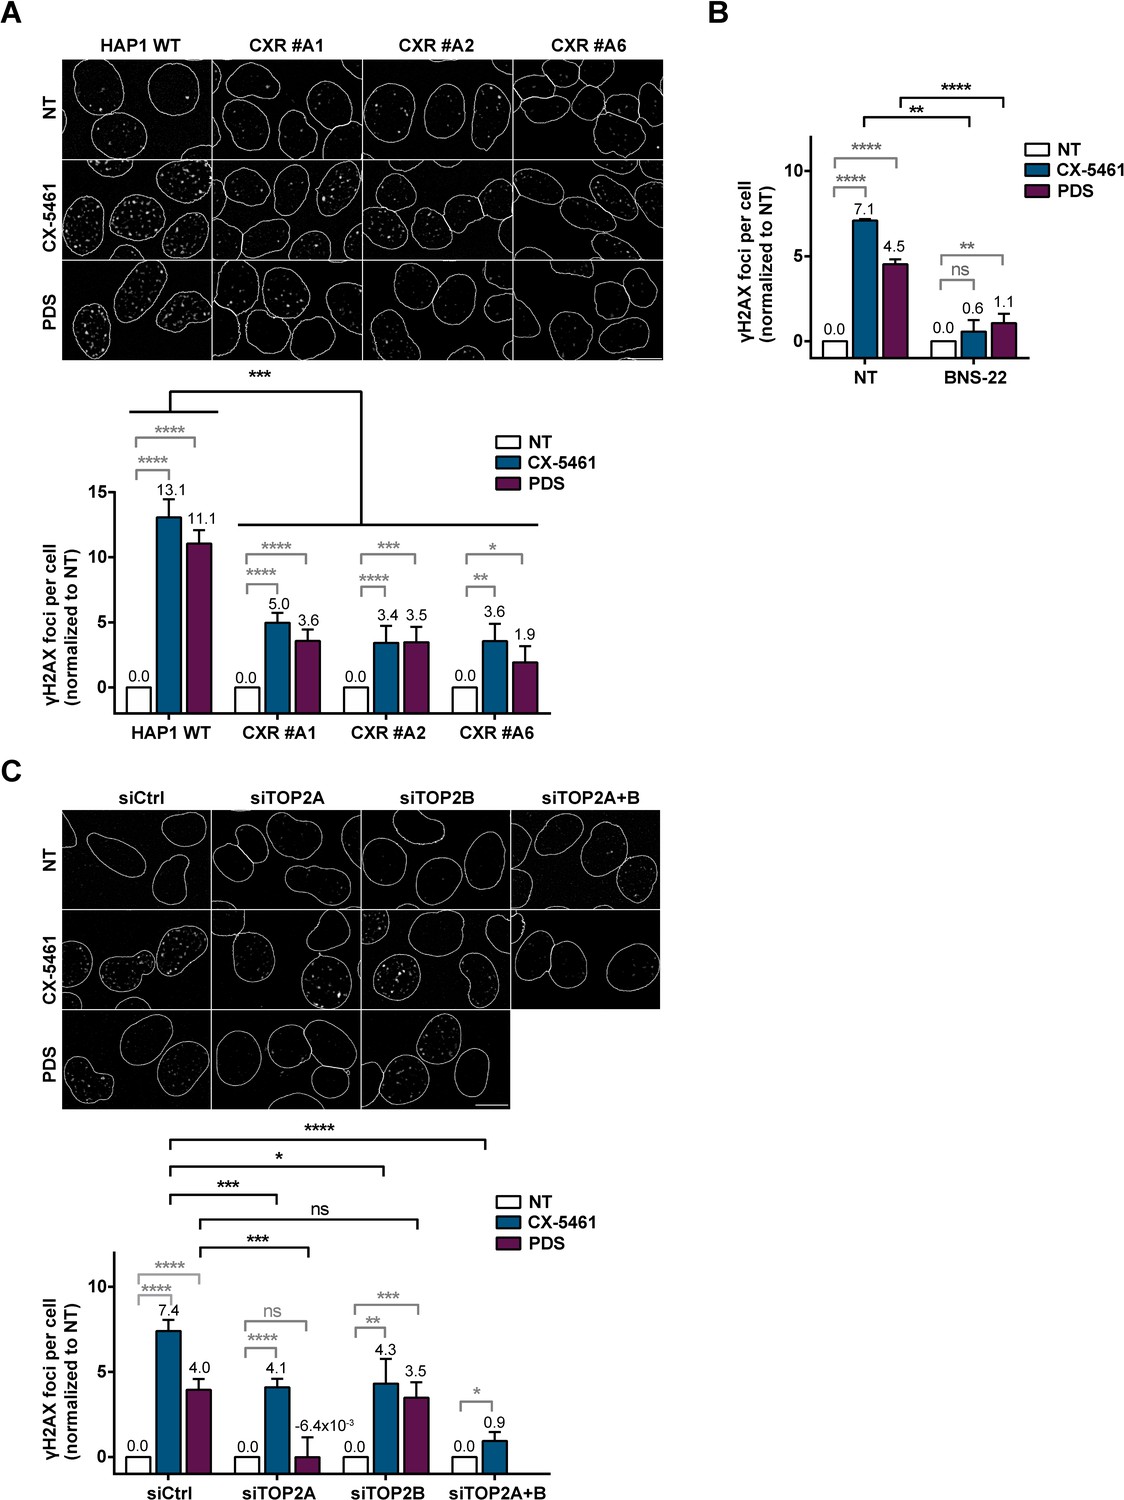
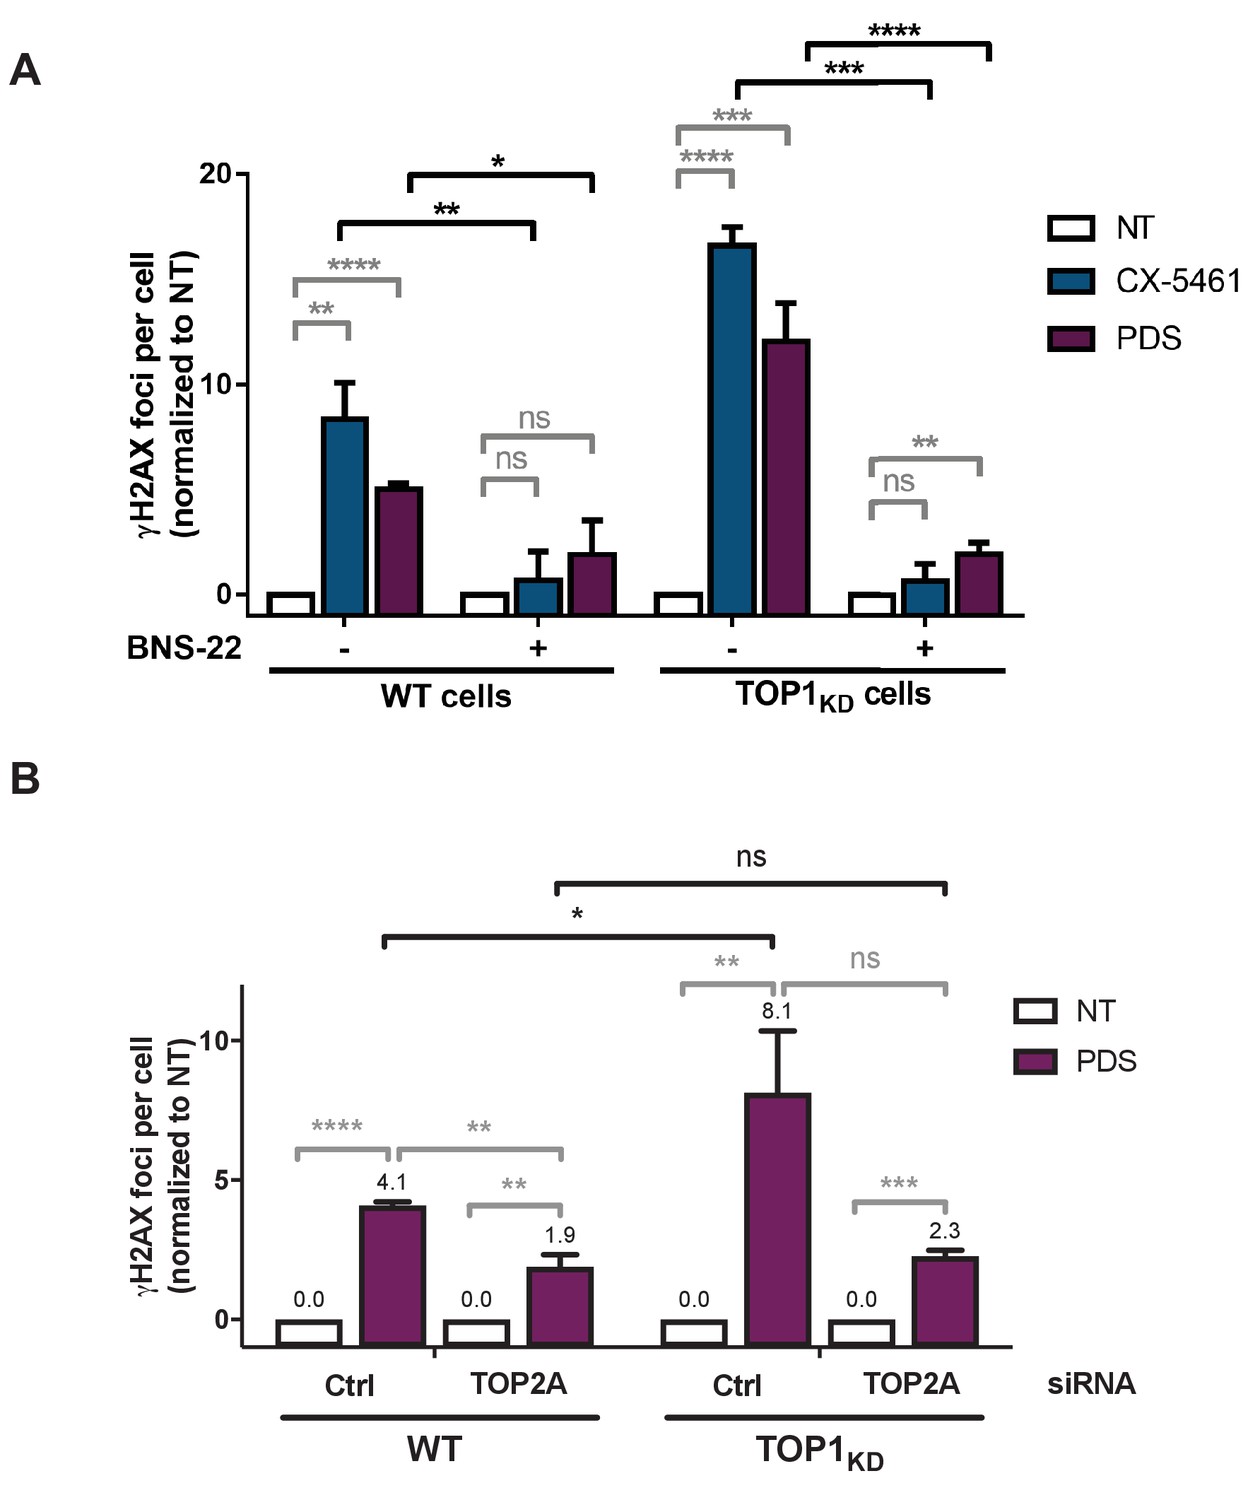
Role of topoisomerase 2 (TOP2) proteins in DNA breaks production by G-quadruplex (G4) ligands CX-5461 and pyridostatin (PDS).
(A) Representative images (upper panel) and quantification (bottom panel) of γH2AX foci detected in HAP1 wild-type (WT) and CX-5461-resistant (CXR) cells. (B) Quantification of γH2AX foci detected after PDS or CX-5461 treatment in HeLa cells pre-treated with the TOP2 catalytic inhibitor BNS-22. (C) Representative images (upper panel) and quantification (bottom panel) of γH2AX foci detected in HeLa cells transfected with control (Ctrl), topoisomerase 2α (TOP2A), and/or topoisomerase 2β (TOP2B) siRNAs and treated with PDS or CX-5461. For all the experiments, cells were incubated with 0.2 µM CX-5461 or 20 µM PDS for 4 hr. For experiments with BNS-22, a 5 µM pre-treatment was performed for 30 min prior to addition of PDS. Quantification of γH2AX foci per cell was performed on n > 165, n > 101, and n > 105 nuclei for each condition, respectively, in (A), (B), and (C). Error bars represent SD from the means, n ≥ 3 independent experiments. p values were calculated using an unpaired multiple Student’s t test. ns: p>0.05; *p<0.05; **p<0.01; ***p<0.001; ****p<0.0001.
Figure 3—figure supplement 1
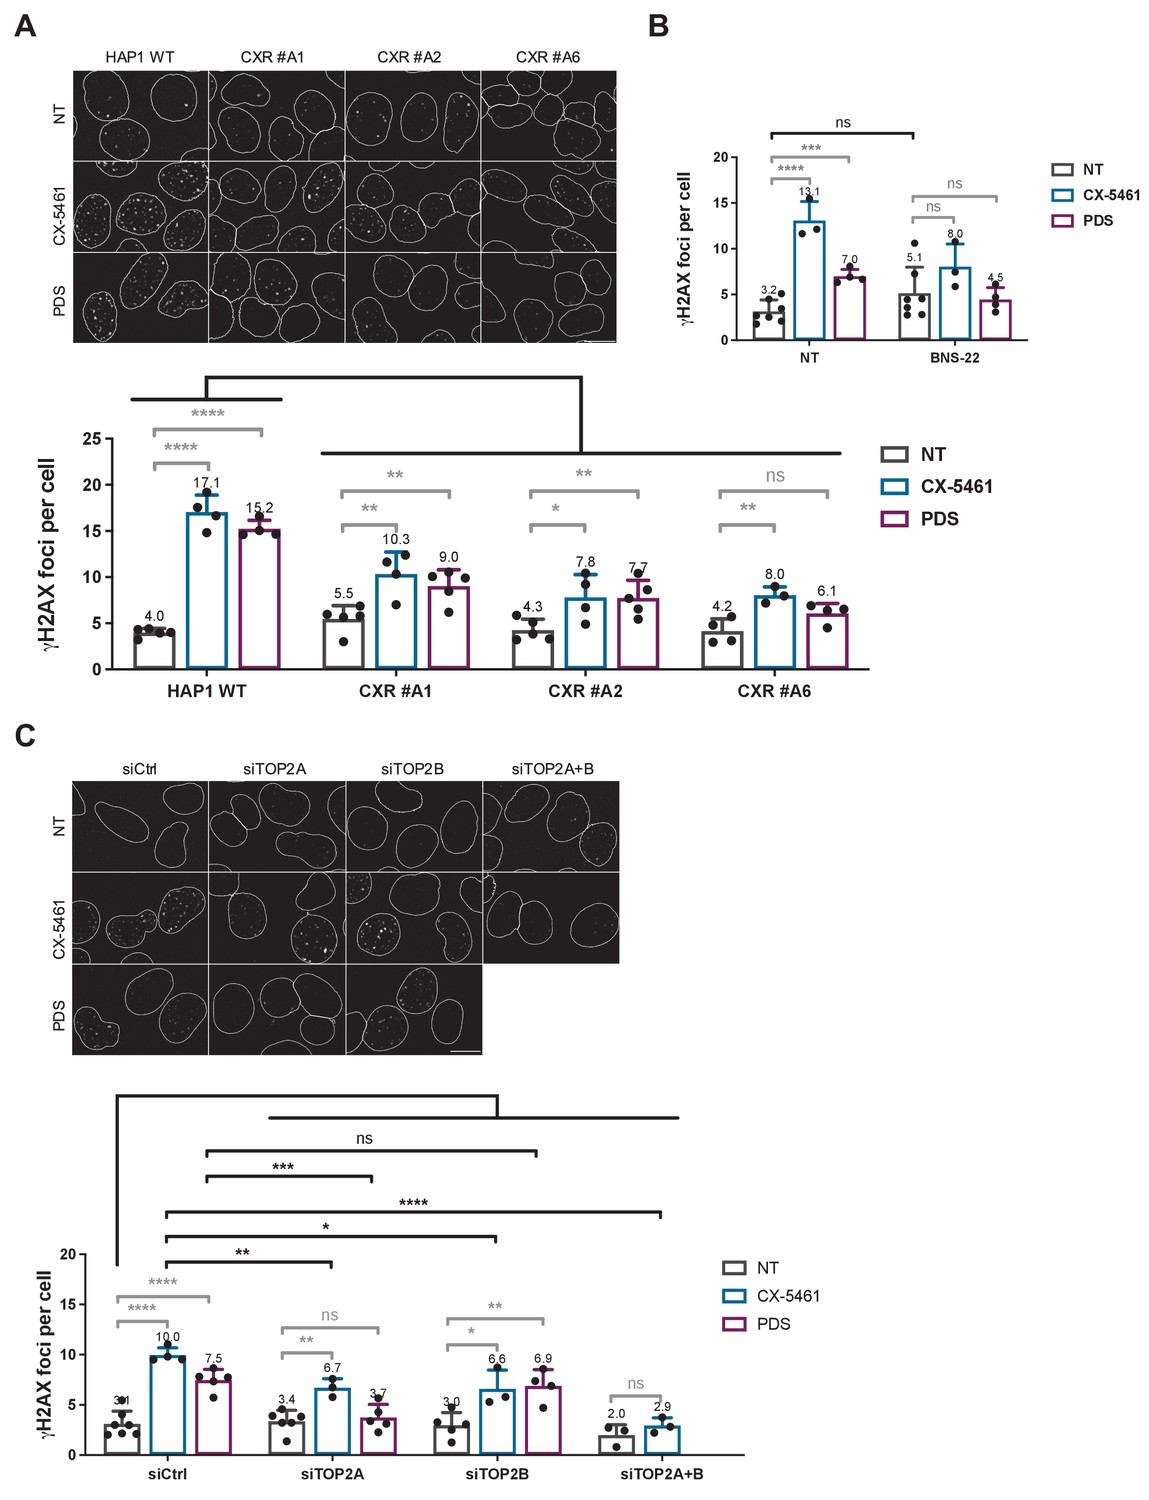
Not normalized data from Figure 3. Role of topoisomerase 2 (TOP2) proteins in DNA breaks production by G-quadruplex (G4) ligands CX-5461 and pyridostatin (PDS).
(A) Representative images (upper panel) and quantification (bottom panel) of γH2AX foci detected in HAP1 wild-type (WT) and CX-5461-resistant (CXR) cells. (B) Quantification of γH2AX foci detected after PDS or CX-5461 treatment in HeLa cells pre-treated with the TOP2 catalytic inhibitor BNS-22. (C) Representative images (upper panel) and quantification (bottom panel) of γH2AX foci detected in HeLa cells transfected with control (Ctrl), topoisomerase 2α (TOP2A), and/or topoisomerase 2β (TOP2B) siRNAs and treated with PDS or CX-5461. For all the experiments, cells were incubated with 0.2 µM CX-5461 or 20 µM PDS for 4 hr. For experiments with BNS-22, a 5 µM pre-treatment was performed for 30 min prior to addition of PDS. Quantification of γH2AX foci per cell was performed on n > 165, n > 101, and n > 105 nuclei for each condition, respectively, in (A), (B), and (C). Error bars represent SD from the means, n ≥ 3 independent experiments. p values were calculated using an unpaired multiple Student’s t test. ns: p>0.05; *p<0.05; **p<0.01; ***p<0.001; ****p<0.0001.
-
Figure 3—figure supplement 1—source data 1
Raw unedited image and uncropped figure of the blot of the western blot from Figure 3—figure supplement 1.
Membrane (left panel) and hybridization signals (right panel) are shown. Raw images were acquired using the ChemiDoc system (Bio-Rad). Asterisks indicate the edges of cut membranes before hybridization. The section of the blot used for the final figure is indicated by the dashed rectangle.
- https://cdn.elifesciences.org/articles/65184/elife-65184-fig3-figsupp1-data1-v2.pdf
Figure 3—figure supplement 2

Role of topoisomerase 2 (TOP2) proteins in DNA breaks production by G-quadruplex (G4) ligands CX-5461 and pyridostatin (PDS).
(A) Representative images (left panel)and quantification of γH2AX (central panel) and 53BP1 (right panel) foci fluorescence signal detected in HeLa cells and in RPE1 cells treated with 20 µM pyridostatin (PDS) for 4 hr. Quantification of γH2AX foci per cell was performed on n > 130 nuclei for each condition, and quantification of 53BP1 foci per cell was performed on n > 169 nuclei for each condition in HeLa cells and on n > 221 nuclei for each condition in RPE1-hTERT cells. (B) Quantification of γH2AX foci in HeLa cells treated with 20 µM PDS for 4 hr +/- the DNA-PK inhibitor NU7441 (DNA PKi). DNA-PKi was added 1 hr prior to PDS addition. Quantification of γH2AX foci per cell was performed on n > 147 nuclei for each condition. Error bars represent SD from the means, n ≥ 3 independent experiments. (C) Quantification of γH2AX foci detected after etoposide treatment in HeLa cells pre-treated with the topoisomerase 2 catalytic inhibitor BNS-22. For all the experiments, cells were incubated with 10 µM etoposide for 1 hr. For BNS-22 experiment, the inhibitor was added 30 min prior to addition of etoposide. (D) Quantification of γH2AX foci in HeLa cells transfected with control (Ctrl) or two different topoisomerase 2α (TOP2A) siRNAs and treated by 20 µM PDS for 4 hr. Quantification of γH2AX foci per cell was performed on n > 218 nuclei for each condition. Error bars represent SD from the means, n = 2 independent experiments. Quantification of γH2AX foci per cell was performed as described in Materials and methods. Error bars represent SD from the means, n ≥ 3 independent experiments. p values were calculated using unpaired Student’s t tests. ns: p>0.05; *p<0.05; **p<0.01; ***p<0.001; ****p<0.0001.
Figure 4 with 2 supplements
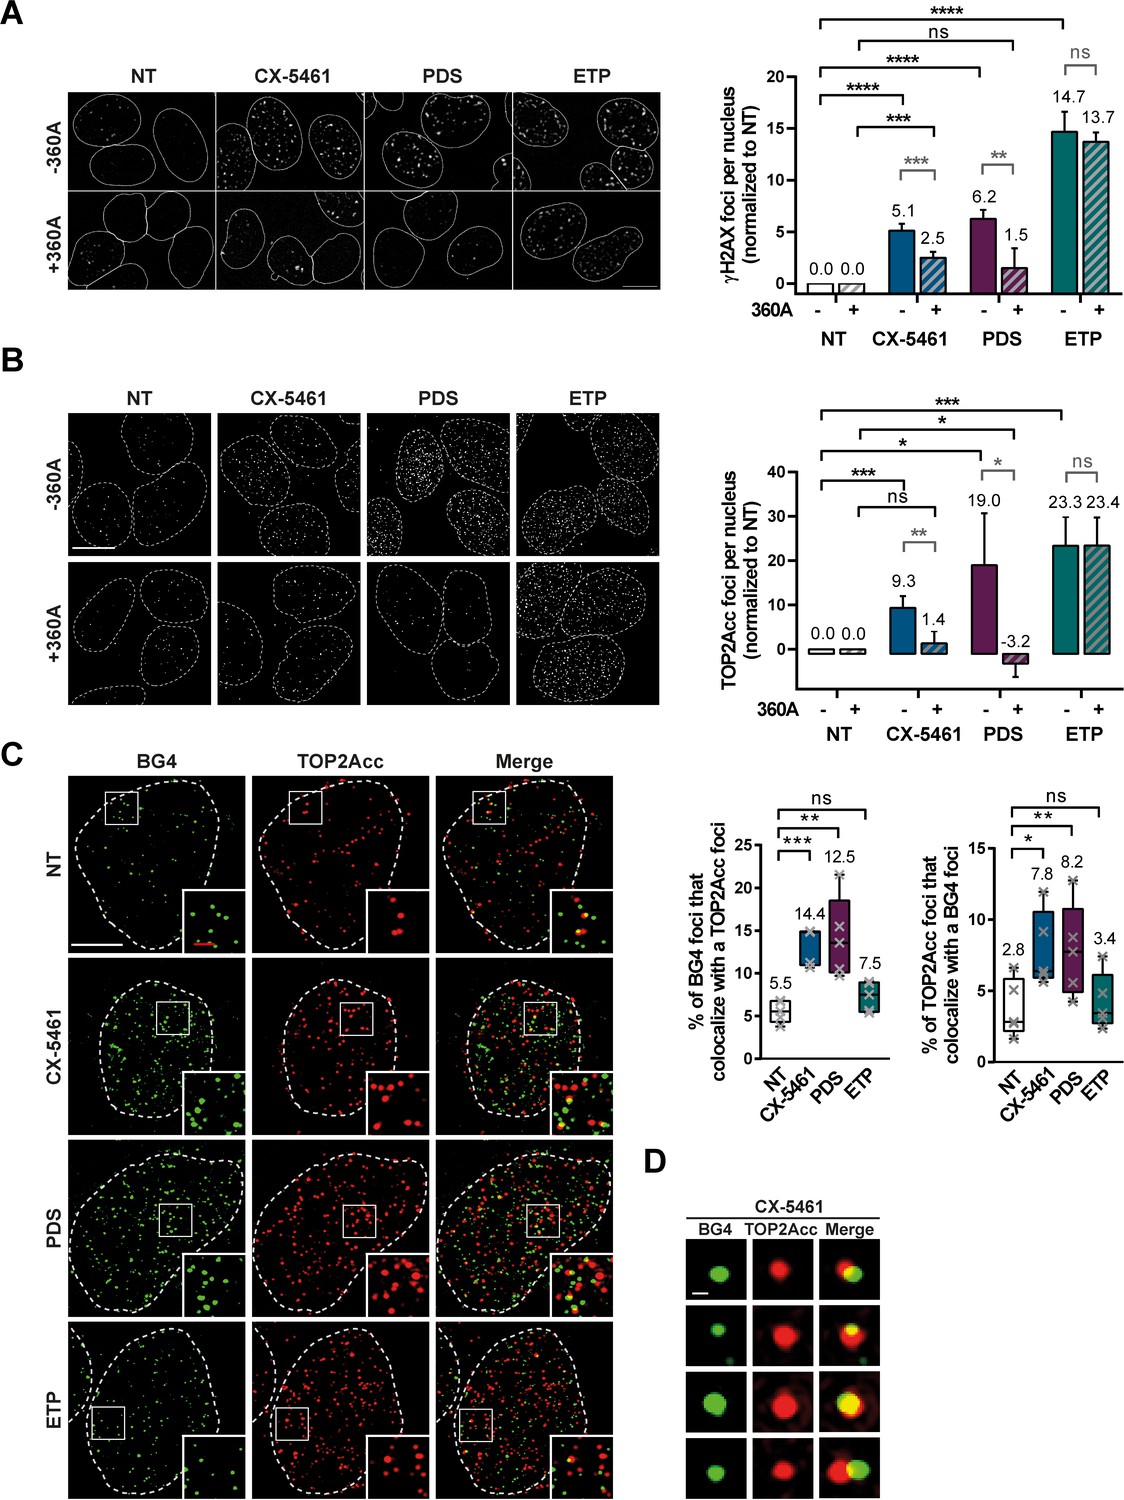
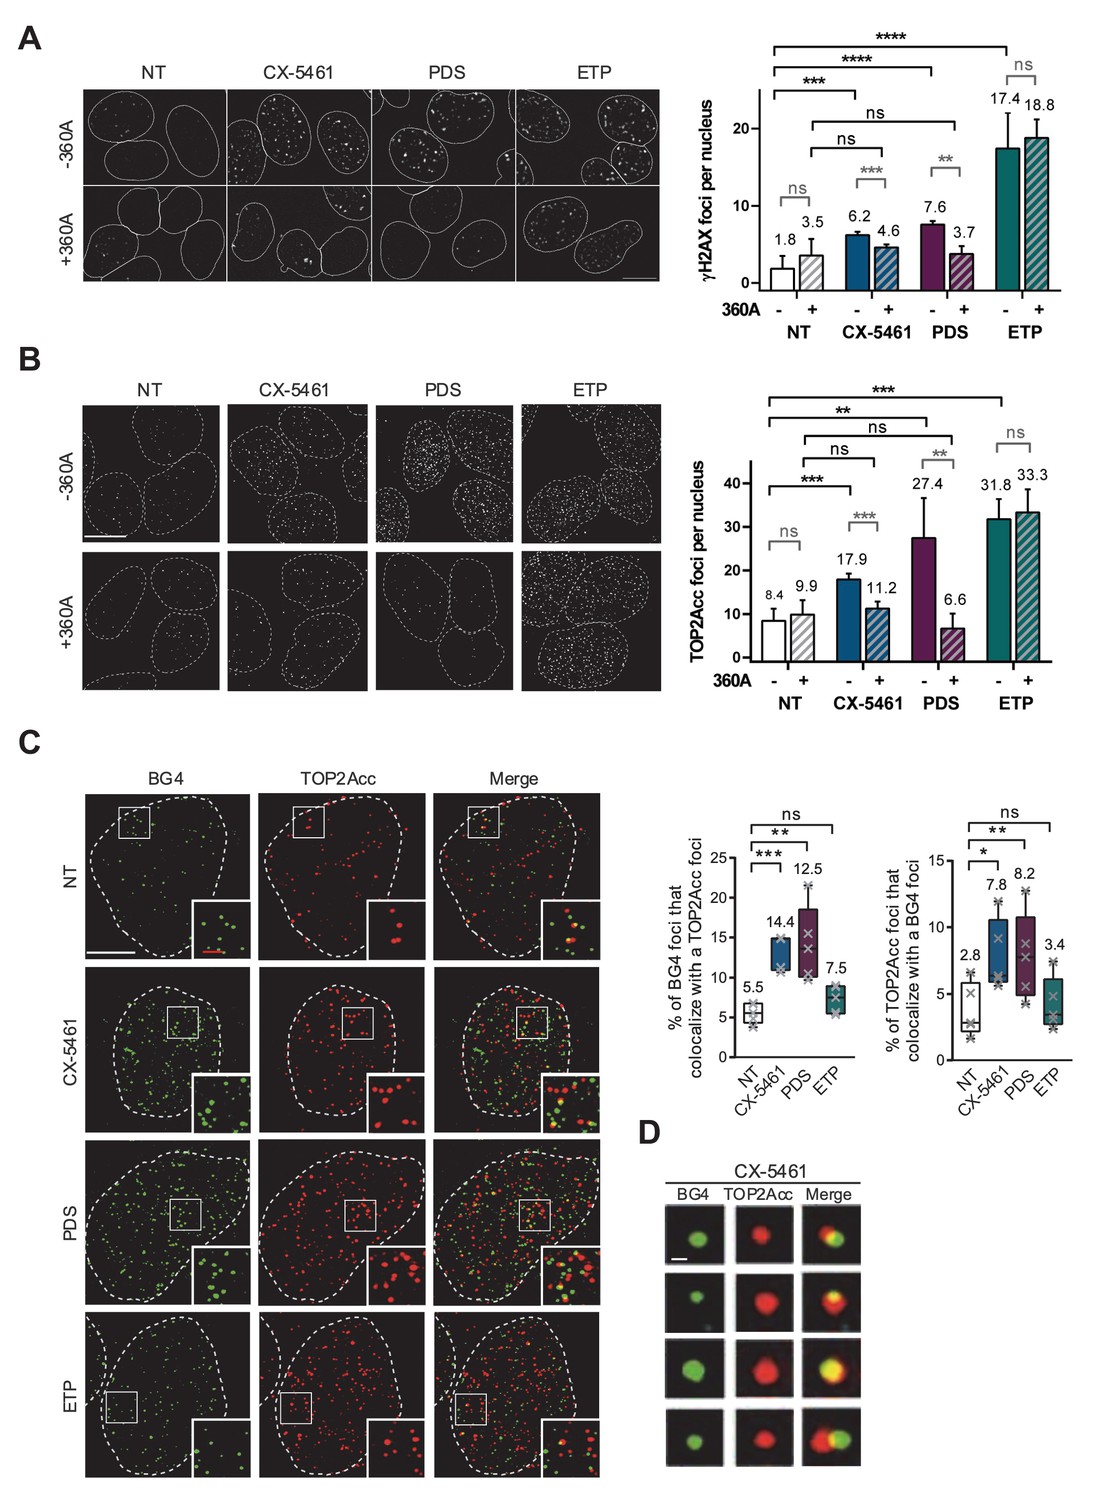
TOP2Acc induced by CX-5461 and pyridostatin (PDS) are associated with G-quadruplex (G4) structures in cells.
Representative images (left panel) and quantification (right panel) of γH2AX (A) and TOP2Acc (B) foci detected in HeLa cells treated for 4 hr with G4 ligands CX-5461 (0.2 µM) and PDS (20 µM) or the topoisomerase 2-poison etoposide (ETP) (3.75 µM). For the conditions with 360A compound, a 20 µM treatment was performed for 3 hr prior to PDS, CX-5461, and ETP treatment and renewed for the duration of the treatment. Quantification of γH2AX foci and TOP2Acc foci per cell in (A) and (B) was performed on n ≥ 219 and n ≥ 144, respectively, for each condition. Error bars represent SD from the means of n ≥ 3 independent experiments. Bar: 10 µm. (C) Colocalization of TOP2Acc and BG4 fluorescence signals in HeLa cells treated for 15 min with G4 ligands CX-5461 (0.2 µM) and PDS (20 µM) or the topoisomerase 2-poison ETP (3.75 µM). Representative pictures on the left panel correspond to maximum intensity projections of 20 3D-SIM Z-stacks (interval 0.091 µm) Quantifications are shown on the right panel. Error bars represent SD from the means of n = 5 independent experiments in which n ≥ 8 nucleus were quantified for each condition. Bars: white, 5 µm; red, 1 µm. (D) Representative pictures of BG4 foci that co-localize with TOP2Acc foci. Bar: 200 nm. p values in (A–C) were calculated using an unpaired multiple Student’s t test.
Figure 4—figure supplement 1
Not normalized data from Figure 4.
TOP2Acc induced by CX-5461 and pyridostatin (PDS) are associated with G-quadruplex (G4) structures in cells. Representative images (left panel) and quantification (right panel) of γH2AX (A) and TOP2Acc (B) foci detected in HeLa cells treated for 4 hr with G4 ligands CX-5461 (0.2 µM) and PDS (20 µM) or the topoisomerase 2-poison etoposide (ETP) (3.75 µM). For the conditions with 360A compound, a 20 µM treatment was performed for 3 hr prior to PDS, CX-5461, and ETP treatment and renewed for the duration of the treatment. Quantification of γH2AX foci and TOP2Acc foci per cell in (A) and (B) was performed on n ≥ 219 and n ≥ 144, respectively, for each condition. Error bars represent SD from the means of n ≥ 3 independent experiments. Bar: 10 µm. (C) Colocalization of TOP2Acc and BG4 fluorescence signals in HeLa cells treated for 15 min with G4 ligands CX-5461 (0.2 µM) and PDS (20 µM) or the topoisomerase 2-poison ETP (3.75 µM). Representative pictures on the left panel correspond to maximum intensity projections of 20 3D-SIM Z-stacks (interval 0.091 µm) Quantifications are shown on the right panel. Error bars represent SD from the means of n = 5 independent experiments in which n ≥ 8 nucleus were quantified for each condition. Bars: white, 5 µm; red, 1 µm. (D) Representative pictures of BG4 foci that co-localize with TOP2Acc foci. Bar: 200 nm. p values in (A–C) were calculated using an unpaired multiple Student’s t test.
Figure 4—figure supplement 2
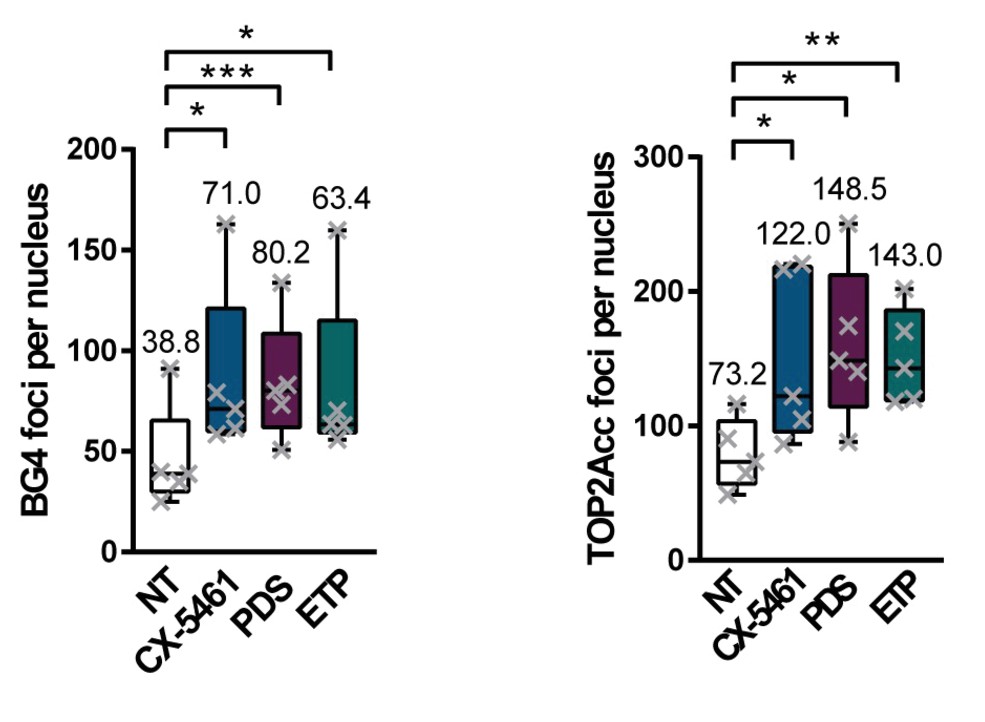
BG4 and TOP2Acc signals quantification in HeLa cells.
Quantification of BG4 (left panel) and TOP2Acc (right panel) foci in HeLa cells treated with G-quadruplex (G4) ligands CX-5461 and pyridostatin (PDS) or with the topoisomerase 2 (TOP2) poison, etoposide (ETP). Error bars represent SD from the means, n = 5 independent experiments. p values were calculated using unpaired Student’s t tests. ns: p>0.05; *p<0.05; **p<0.01; ***p<0.001.
Figure 5 with 2 supplements

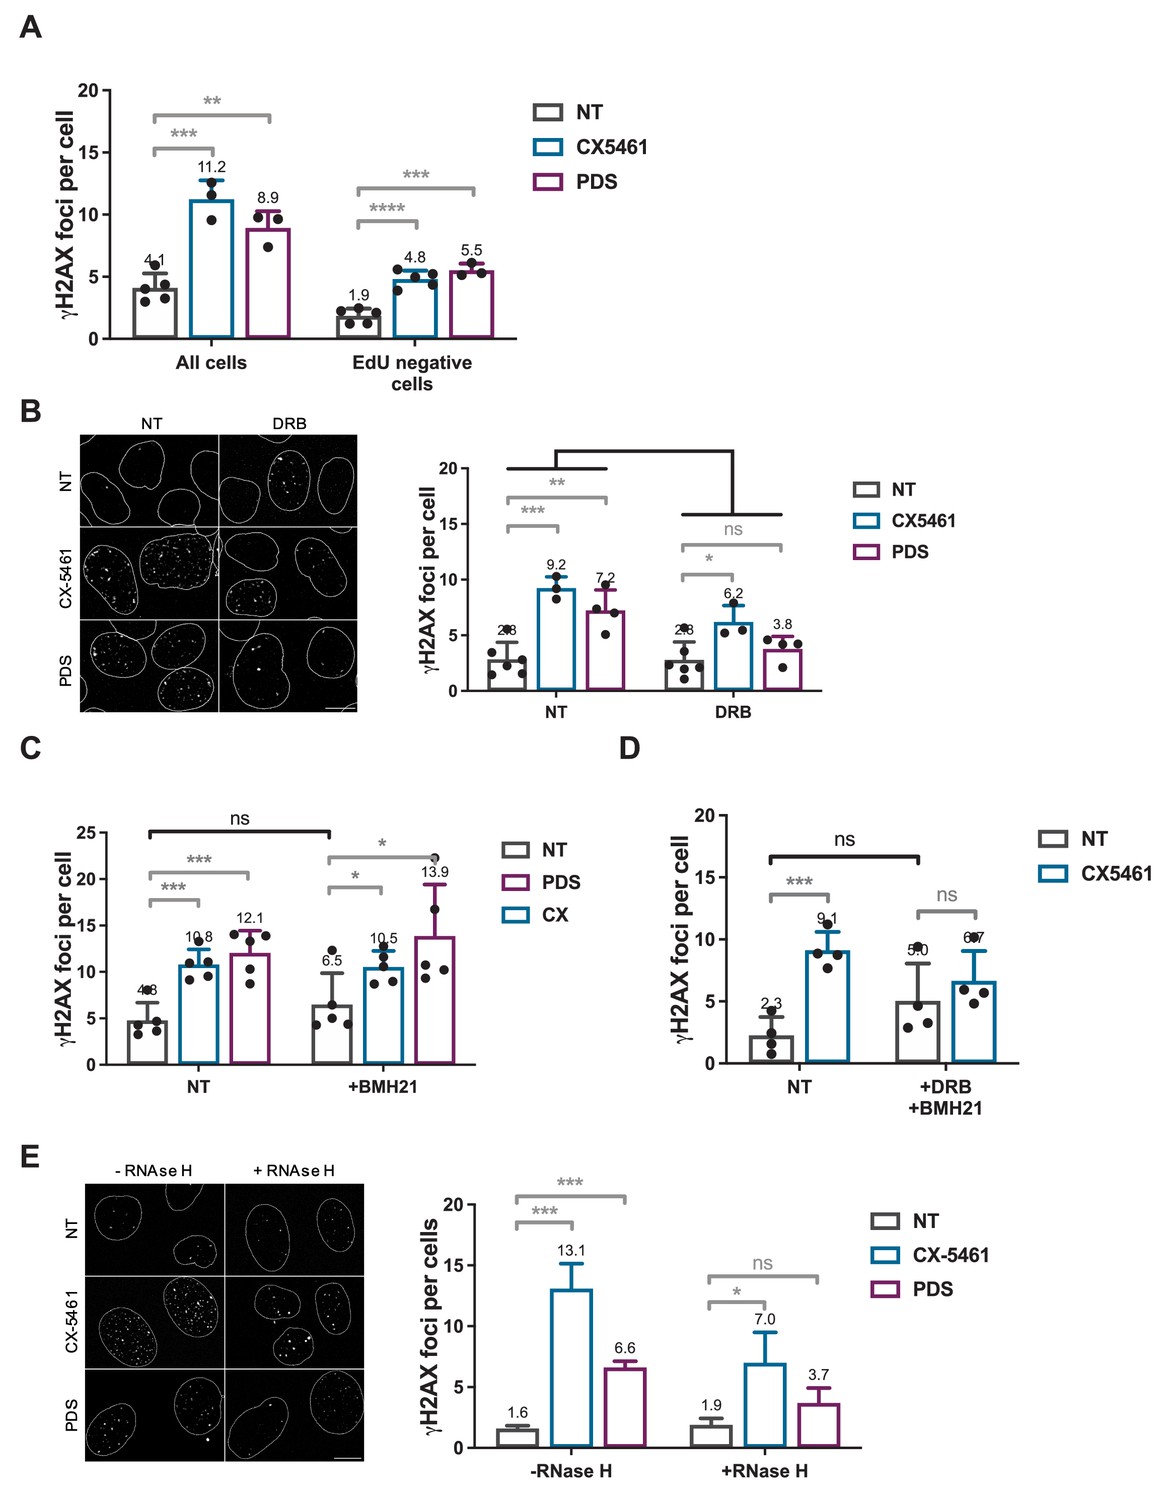
Role of RNA-Pol II-dependent transcription in DNA breaks production by G-quadruplex (G4) ligands CX-5461 and pyridostatin (PDS).
Quantification of γH2AX foci in HeLa cells treated with 0.2 µM CX-5461 or 20 µM PDS for 4 hr in the presence of 5-ethynyl-2′-deoxyuridine (EdU). (A). Representative images (left panel) and quantification (right panel) of γH2AX foci fluorescence signal detected in HeLa cells pre-treated with the RNA-Pol II inhibitor 5,6-dichloro-1-b-D-ribofuranosylbenzimidazole (DRB) (B), RNA-Pol I inhibitor BMH21 (C) or DRB plus BMH21 (D) prior to addition of 0.2 µM CX-5461 or 20 µM PDS for 4 hr. (E) Representative images (left panel) and quantification (right panel) of γH2AX foci upon PDS or CX-5461 treatment (8 hr) in RNaseH1-mCherry U2OS-expressing cells. DRB or BMH21 were added 1 hr before CX-5461 or PDS treatment. RNaseH1-mCherry expression in U2OS cells was induced 14 hr prior to PDS treatment. γH2AX foci per cell was performed on n > 165 nuclei for each condition in (A) and n > 42 nuclei for each condition in (B). Error bars represent SD from the means, n ≥ 3 independent experiments. p values were calculated using an unpaired multiple Student’s t test. ns: p>0.05; *p<0.05; **p<0.01; ***p<0.001; ****p<0.0001.
Figure 5—figure supplement 1
Not normalized data from Figure 5. Role of RNA-Pol II-dependent transcription in DNA breaks production by G-quadruplex (G4) ligands CX-5461 and pyridostatin (PDS).
Quantification of γH2AX foci in HeLa cells treated with 0.2 µM CX-5461 or 20 µM PDS for 4 hr in the presence of 5-ethynyl-2′-deoxyuridine (EdU). (A). Representative images (left panel) and quantification (right panel) of γH2AX foci fluorescence signal detected in HeLa cells pre-treated with the RNA-Pol II inhibitor 5,6-dichloro-1-b-D-ribofuranosylbenzimidazole (DRB) (B), RNA-Pol I inhibitor BMH21 (C), or DRB plus BMH21 (D) prior to addition of 0.2 µM CX-5461 or 20 µM PDS for 4 hr. (E) Representative images (left panel) and quantification (right panel) of γH2AX foci upon PDS or CX-5461 treatment (8 hr) in RNaseH1-mCherry U2OS-expressing cells. DRB or BMH21 were added 1 hr before CX-5461 or PDS treatment. RNaseH1-mCherry expression in U2OS cells was induced 14 hr prior to PDS treatment. γH2AX foci per cell was performed on n > 165 nuclei for each condition in (A) and n > 42 nuclei for each condition in (B). Error bars represent SD from the means, n ≥ 3 independent experiments. p values were calculated using an unpaired multiple Student’s t test. ns: p>0.05; *p<0.05; **p<0.01; ***p<0.001; ****p<0.0001.
Figure 5—figure supplement 2
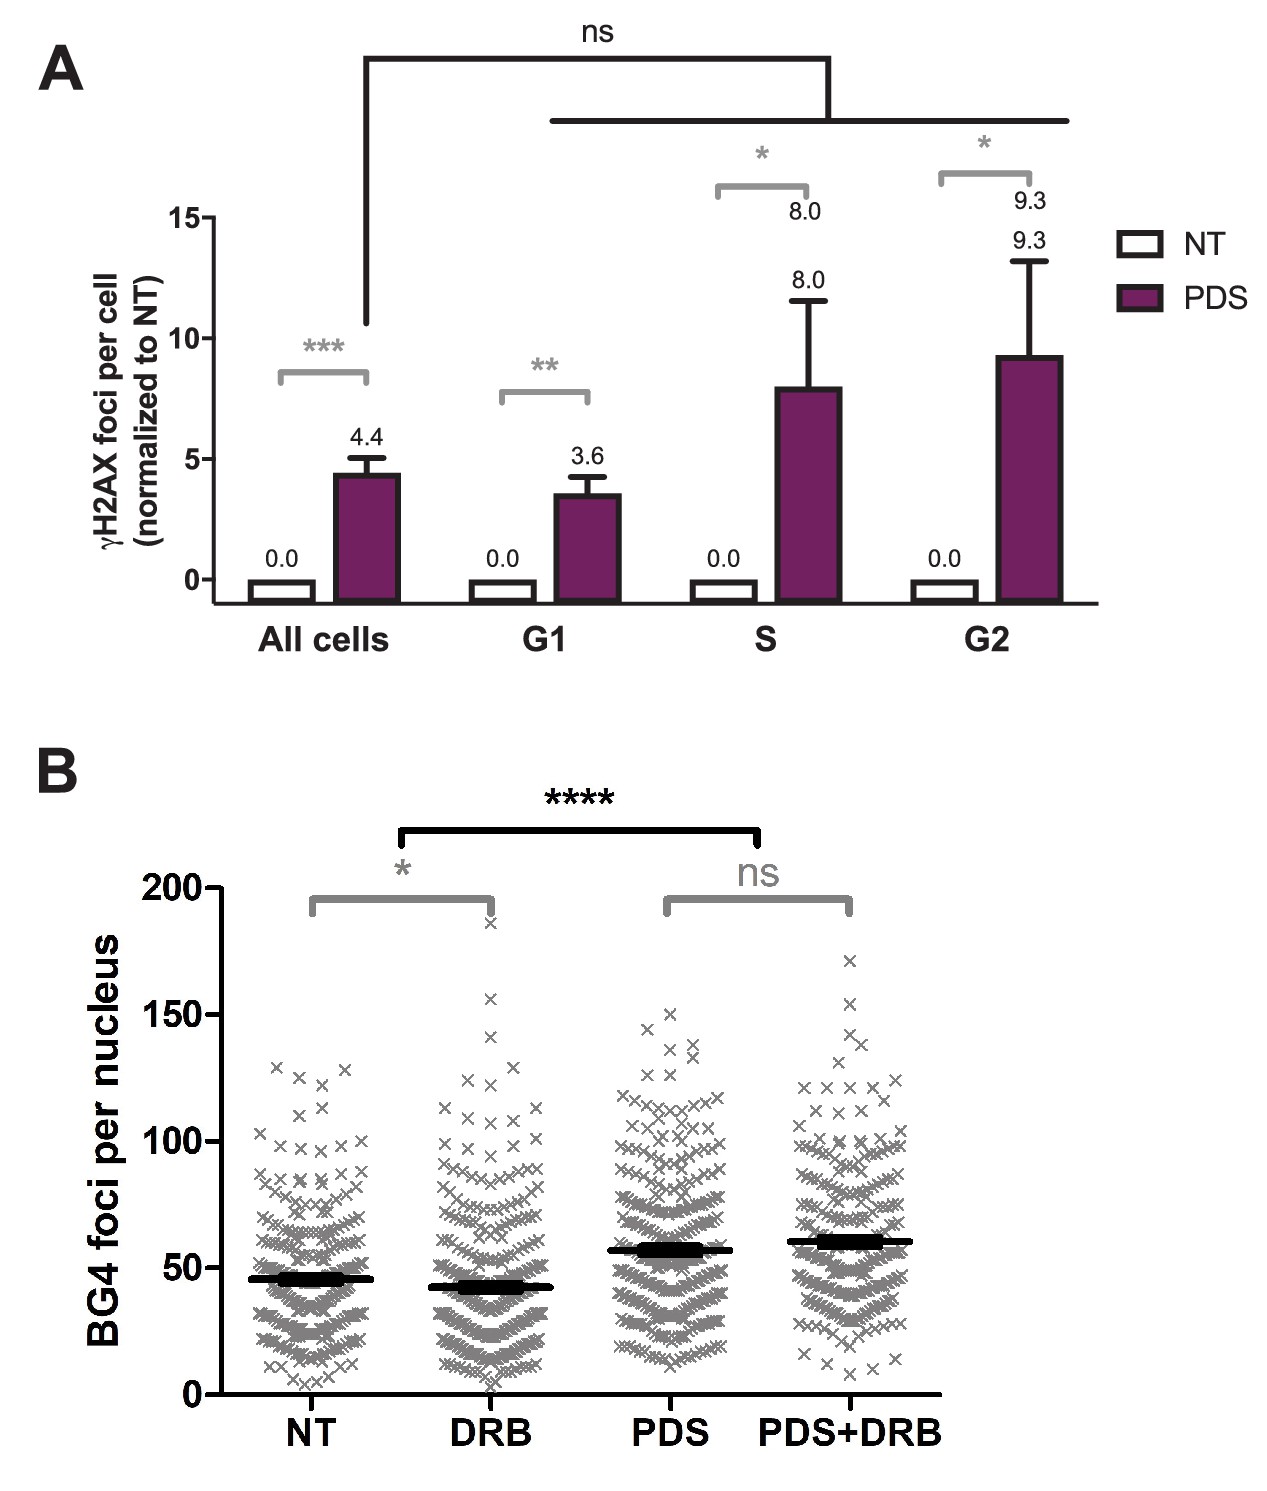
Role of RNA-Pol II-dependent transcription in DNA breaks production by G-quadruplex (G4) ligands CX-5461 and pyridostatin (PDS).
(A) Quantification of γH2AX foci throughout cell cycle in HeLa cells treated with 20 µM pyridostatin (PDS) for 4 hr. Determination of cell cycle staging of individual cells was performed by measuring their DNA content by fluorescence microscopy (Roukos et al., 2015). Quantification of γH2AX foci per cell was performed as described in Materials and methods on n > 130 nuclei for each condition. Error bars represent SD from the means, n = 3 independent experiments. (B) Quantification of ΒG4 foci fluorescence signal (gray) detected in HeLa cells treated with 20 µM PDS in the presence of RNA-Pol II inhibitor 5,6-dichloro-1-b-D-ribofuranosylbenzimidazole (DRB) for 4 hr. DRB was added 1 hr before PDS addition. Quantification of BG4 foci per cell was performed as described in Materials and methods on n > 70 nuclei for each condition. Error bars represent SEM, n = 3 independent experiments. p values were calculated using unpaired Welch’s t tests. ns: p>0.05; *p<0.05; **p<0.01; ***p<0.001; ****p<0.0001.
Figure 6 with 3 supplements

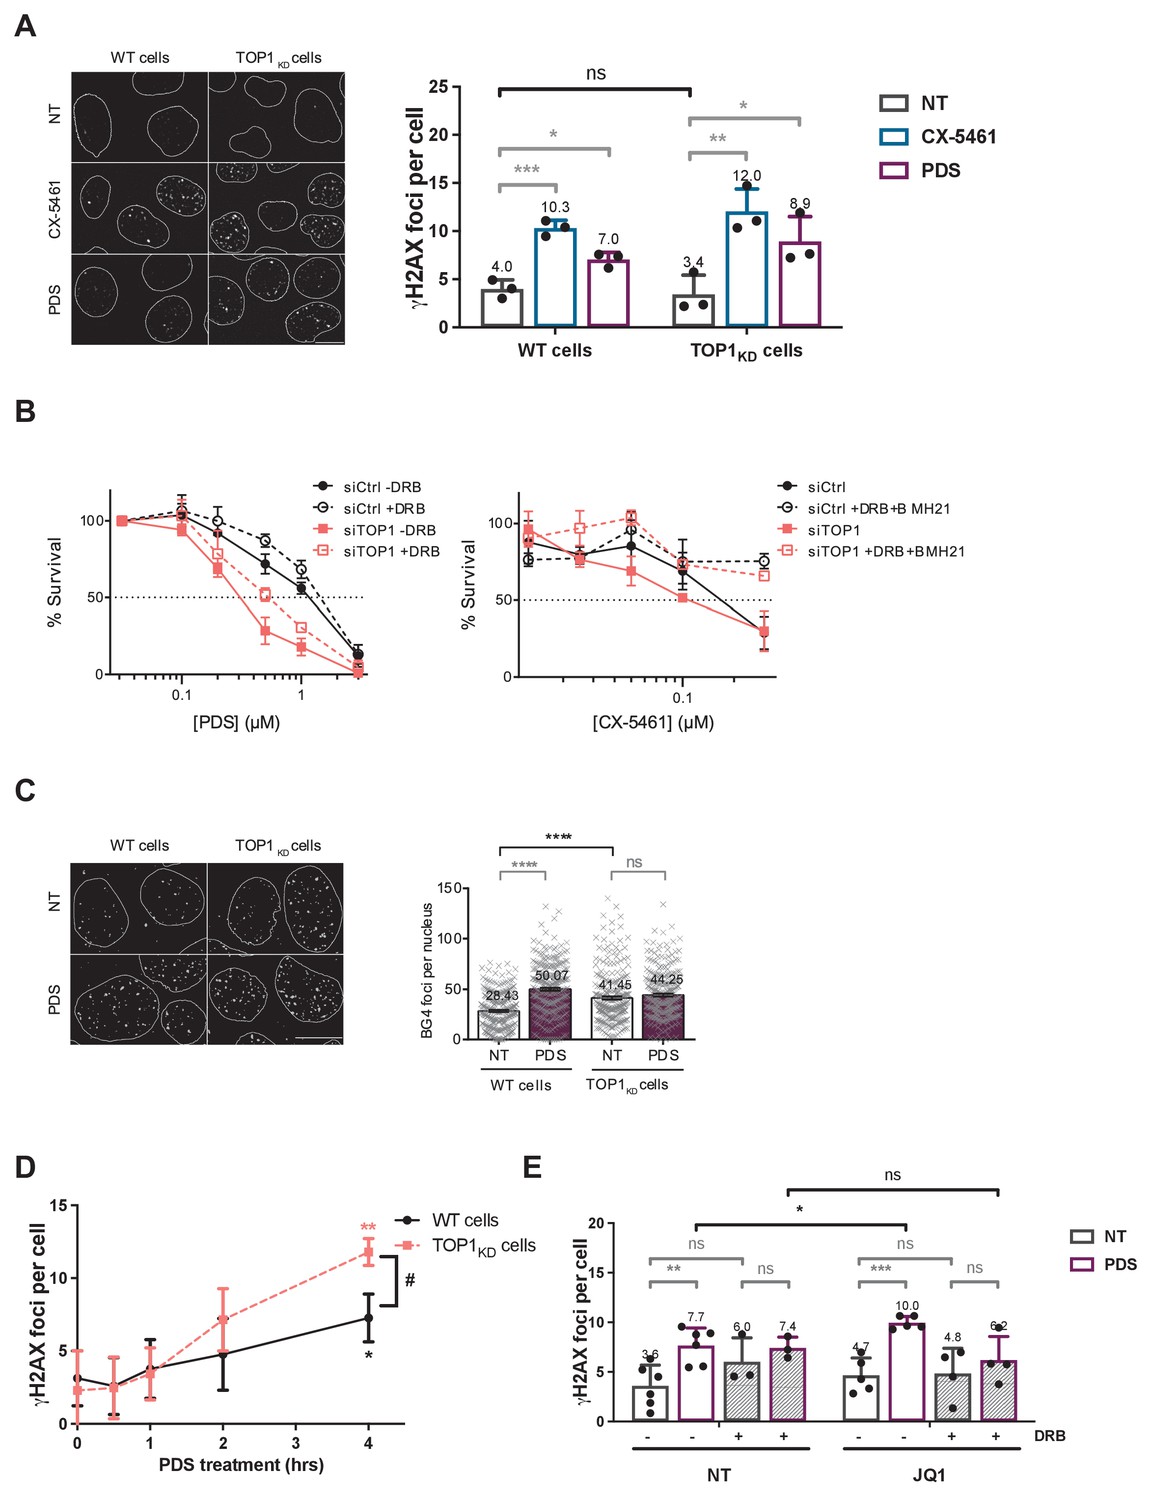
Topoisomerase 1 (TOP1) protein counteracts topoisomerase 2 (TOP2)-dependent double-stranded breaks (DSBs) induced by G-quadruplex (G4) stabilizers.
(A) Representative images (left panel) and quantification (right panel) of γH2AX foci detected in HeLa control cells (wild-type [WT] cells) or HeLa TOP1KD (TOP1 knock-down cells by inducible shRNA-mediated depletion) and treated with pyridostatin (PDS) or CX-5461 for 4 hr. (B) Cell survival assay as assessed by clonogenic assay on HeLa cells transfected with control (Ctrl) or TOP1 siRNAs and treated with PDS +/- 5,6-dichloro-1-b-D-ribofuranosylbenzimidazole (DRB) (upper panel) or CX-5461 +/- DRB and BMH21 (bottom panel). For clonogenic assays PDS, CX-5461, DRB, and BMH21 treatments were performed as described in Materials and methods. (C) Representative images (left panel) and quantification (right panel) of ΒG4 foci fluorescence signal (gray) detected in HeLa control cells (WT cells) or HeLa TOP1KD cells treated with 20 µM PDS for 4 hr. (D) Kinetic studies of γH2AX foci formation in in HeLa control cells (WT cells) or TOP1 knock-down cells following PDS (20 µM) treatments. (E) Quantification of γH2AX signals in HeLa cells treated with PDS and the BRD4 inhibitor JQ1 in the presence of the RNA-Pol II inhibitor DRB. JQ1 was added 1 hr prior to addition of PDS. Expression of shTOPI in HeLa cells was induced with 5 µg/mL doxycycline for 5 days before treatments. Quantification of γH2AX foci per cell was performed on n > 110, n > 181, n > 174, and n > 117 nuclei for each condition, respectively, in (A), (C), (D), and (E). Error bars represent SD from the means, n ≥ 3 independent experiments. p values were calculated using an unpaired multiple Student’s t test. ns: p>0.05; *p<0.05; **p<0.01; ***p<0.001; ****p<0.0001. Quantification of BG4 foci per cell was performed on n > 71 nuclei for each condition. Error bars represent SEM from the means, n = three independent experiments. p values were calculated using an unpaired Welch’s t test. ns: p>0.05; *p<0.05; **p<0.01; ***p<0.001; ****p<0.0001.
-
Figure 6—source data 1
Raw unedited image and uncropped figure of the blot of the western blot from Figure 6.
Total proteins (stain-free signal, left panel), membrane (center panel), and hybridization signals (two right panels) are shown. Raw images were acquired using the ChemiDoc system (Bio-Rad). Asterisks indicate the edges of cut membranes before hybridization. The section of the blot used for the final figure is indicated by the dashed rectangle.
- https://cdn.elifesciences.org/articles/65184/elife-65184-fig6-data1-v2.pdf
-
Figure 6—source data 2
Raw unedited image and uncropped figure of the blot of the western-blot from Figure 6.
Membrane (left panel) and hybridization signals (center and right panels) are shown. Raw images were acquired using the ChemiDoc system (Bio-Rad). Asterisks indicate the edges of cut membranes before hybridization. The section of the blot used for the final figure is indicated by the dashed rectangle.
- https://cdn.elifesciences.org/articles/65184/elife-65184-fig6-data2-v2.pdf
Figure 6—figure supplement 1
Not normalized data from Figure 6.Topoisomerase 1 (TOP1) protein counteracts topoisomerase 2 (TOP2)-dependent double-stranded breaks (DSBs) induced by G-quadruplex (G4) stabilizers.
(A) Representative images (left panel) and quantification (right panel) of γH2AX foci detected in HeLa control cells (wild-type [WT] cells) or HeLa TOP1KD (TOP1 knock-down cells by inducible shRNA-mediated depletion) and treated with pyridostatin (PDS) or CX-5461 for 4 hr. White bar = 10 µm. (B) Cell survival assay as assessed by clonogenic assay on HeLa cells transfected with control (Ctrl) or TOP1 siRNAs and treated with PDS +/- 5,6-dichloro-1-b-D-ribofuranosylbenzimidazole (DRB) (upper panel) or CX-5461 +/- DRB and BMH21 (bottom panel). For clonogenic assays, PDS, CX-5461, DRB, and BMH21 treatments were performed as described in Materials and methods. (C) Representative images (left panel) and quantification (right panel) of ΒG4 foci fluorescence signal (gray) detected in HeLa control cells (WT cells) or HeLa TOP1KD cells treated with 20 µM PDS for 4 hr. White bar = 10 µm. (D) Kinetic studies of γH2AX foci formation in in HeLa control cells (WT cells) or TOP1 knock-down cells following PDS (20 µM) treatments. (E) Quantification of γH2AX signals in HeLa cells treated with PDS and the BRD4 inhibitor JQ1 in the presence of the RNA-Pol II inhibitor DRB. JQ1 was added 1 hr prior to addition of PDS. Expression of shTOPI in HeLa cells was induced with 5 µg/mL doxycycline for 5 days before treatments. Quantification of γH2AX foci per cell was performed on n > 110, n > 181, n > 174, and n > 117 nuclei for each condition, respectively, in (A), (C), (D), and (E). Error bars represent SD from the means, n ≥ 3 independent experiments. p values were calculated using a unpaired multiple Student’s t test. ns: p>0.05; *p<0.05; **p<0.01; ***p<0.001; ****p<0.0001. Quantification of BG4 foci per cell was performed on n > 71 nuclei for each condition. Error bars represent SEM from the means, n = 3 independent experiments. p values were calculated using an unpaired Welch’s t test. ns: p>0.05; *p<0.05; **p<0.01; ***p<0.001; ****p<0.0001.
Figure 6—figure supplement 2
Topoisomerase 1 (TOP1) protein counteracts topoisomerase 2 (TOP2)-dependent double-stranded breaks (DSBs) induced by G-quadruplex (G4) stabilizers.
(A) Quantification of γH2AX foci fluorescence signal detected in HeLa wild-type (WT) or HeLa TOP1KD (topoisomerase 1 [TOP1] knock-down cells, inducible shRNA) in the presence of the topoisomerase 2 (TOP2) catalytic inhibitor BNS22. Expression of shTOPI in HeLa cells was induced with doxycycline 6 days prior to assays. (B) Quantification of γH2AX foci fluorescence signal detected in HeLa WT or HeLa TOP1KD (TOP1 knock-down cells, inducible shRNA) transfected with control (Ctrl) or TOP2A siRNAs. Expression of shTOPI in HeLa cells was induced with doxycycline 4 days prior to assays and maintained during transfections. Pyridostatin (PDS) treatment was performed 48 hr after the second round of siRNA transfection as described in Materials and methods. Quantification of γH2AX foci per cell was performed on n > 59 nuclei for each condition. Error bars represent SD from the means, n = 3 independent experiments. p values were calculated using unpaired Student’s t tests. ns: p>0.05; *p<0.05; **p<0.01; ***p<0.001; ****p<0.0001.
Figure 6—figure supplement 3
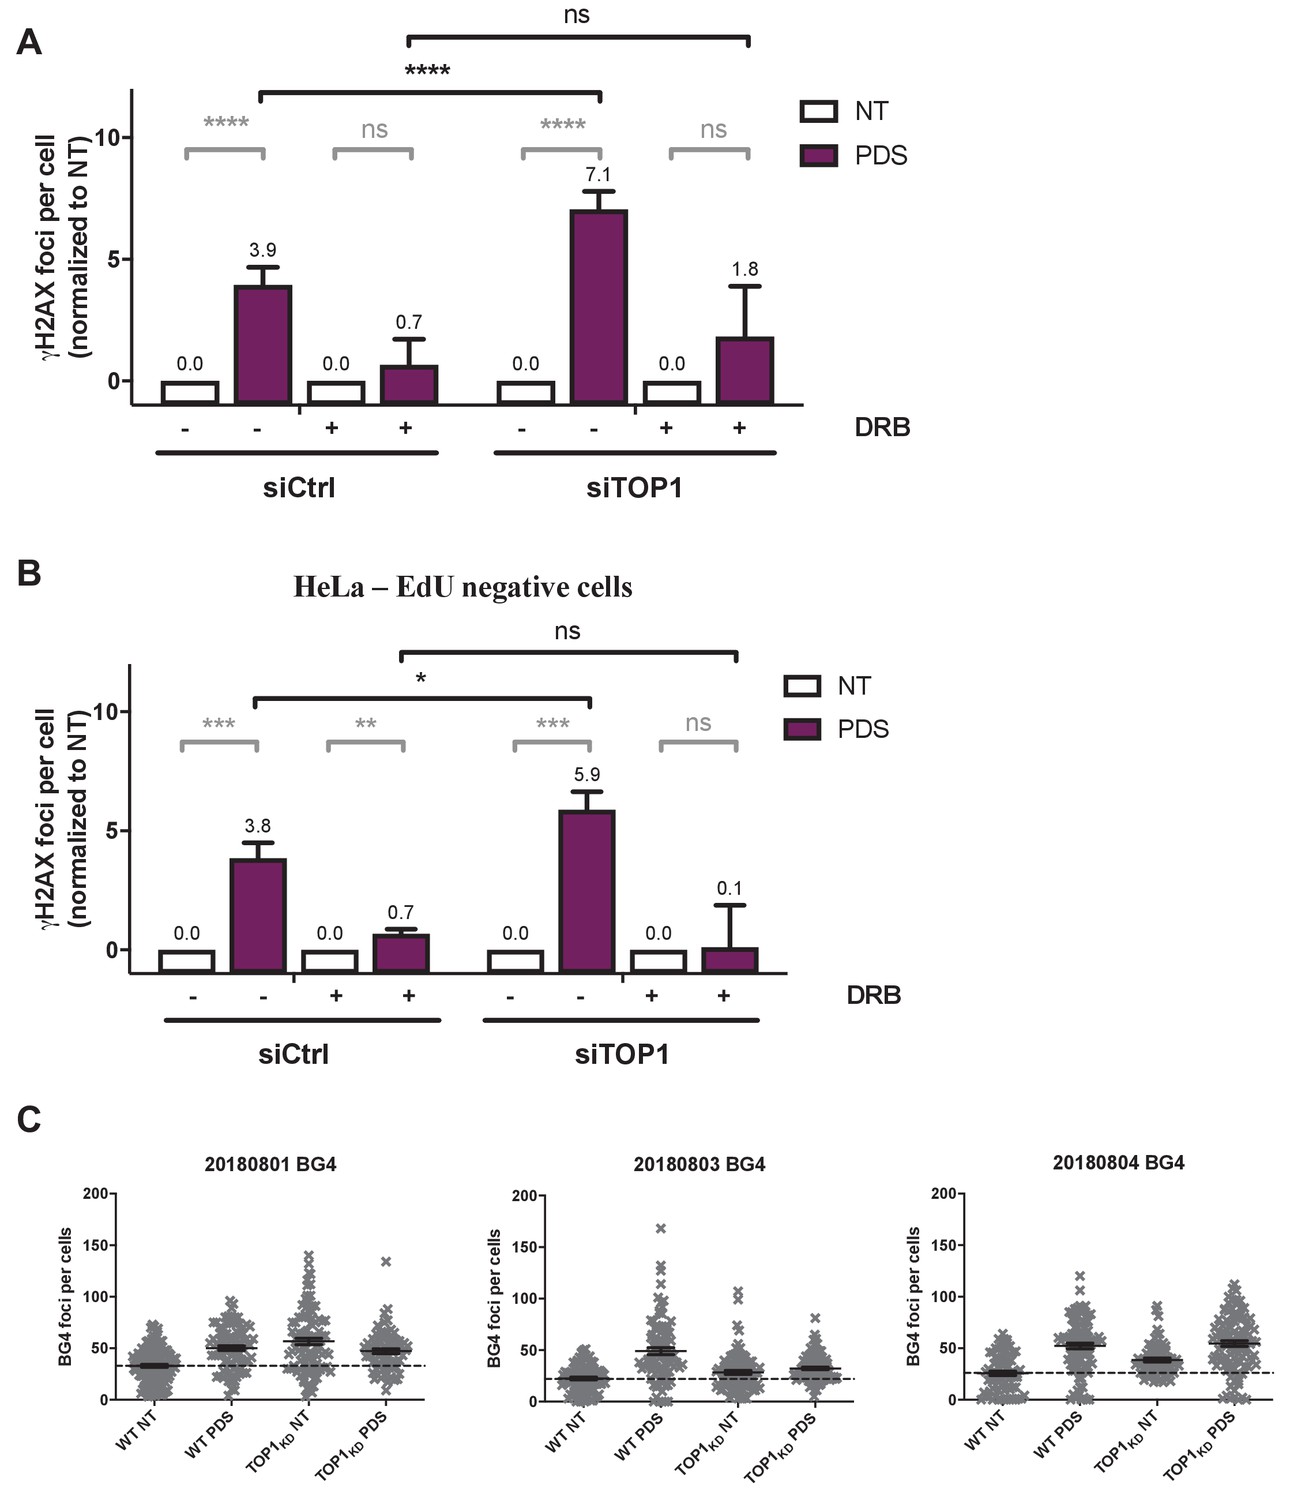
Topoisomerase 1 (TOP1) protein counteracts topoisomerase 2 (TOP2)-dependent double-stranded breaks (DSBs) induced by G-quadruplex (G4) stabilizers.
(A) Quantification of γH2AX foci fluorescence signal in HeLa cells transfected with control (Ctrl) or topoisomerase 1 (TOP1) siRNAs and treated by 20 µM pyridostatin (PDS) in the presence of RNA-Pol II inhibitor 5,6-dichloro-1-b-D-ribofuranosylbenzimidazole (DRB) (A). DRB was added 1 hr before PDS addition. (B) Quantification of γH2AX foci fluorescence signal in HeLa 5-ethynyl-2′-deoxyuridine (EdU)-negative cells transfected with control (Ctrl) or TOP1 siRNAs and treated by 20 µM PDS in the presence of RNA-Pol II inhibitor DRB. Quantification of γH2AX foci per cell was performed on n > 100 nuclei for each condition. Error bars represent SD from the means, n = 3 independent experiments. p values were calculated using unpaired Student’s t tests. ns: p>0.05; *p<0.05; **p<0.01; ***p<0.001; ****p<0.0001. (C) Quantification of BG4 signals in HeLa TOP1KD (TOP1 knock-down cells, inducible shRNA) treated by 20 µM PDS. Results are shown from three independent experiments.
Figure 7
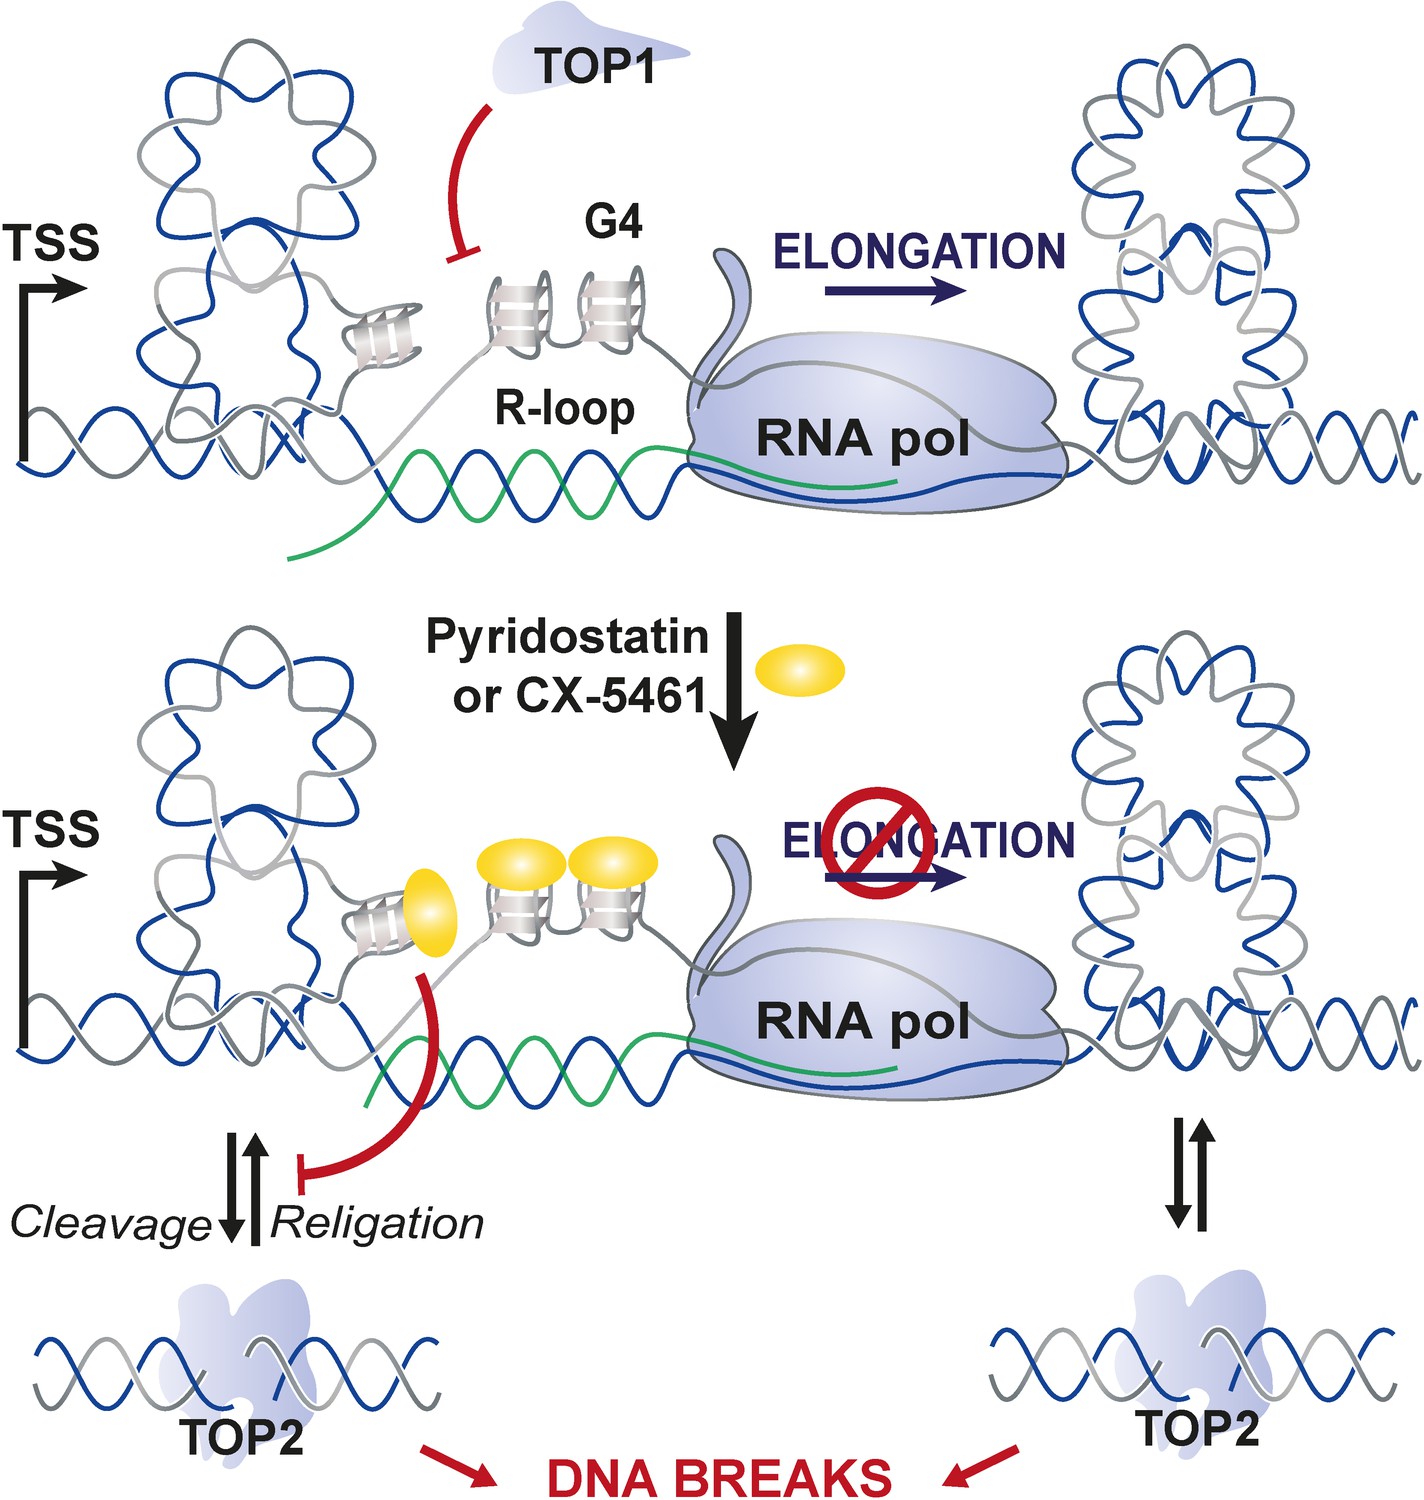
Proposed model for topoisomerase 2-mediated double-stranded breaks (DSBs) on transcriptionally active loci containing G-quadruplex (G4)-forming sequences.
In this model, the interaction of G4 ligands with DNA is facilitated by DNA topological stress provoked by RNA-Pol-dependent transcription that are counteracted by topoisomerase 1 (TOP1) activity. G4 stabilization by G4 ligands in transcriptional active loci would provoke sustained RNA-Pol arrest mobilizing topoisomerase enzymes to resolve topological stresses and that at some loci may be poisoned at the vicinity of G4.
Additional files
-
Source data 1
Raw unedited images and uncropped figures of western-blot analyses.
- https://cdn.elifesciences.org/articles/65184/elife-65184-data1-v2.zip
-
Supplementary file 1
IC50 values as assessed by cell survival assays to CX-5461, pyridostatin (PDS), etoposide, F14512, and nocodazole, of wild-type (WT), CX-5461-resistant (CXR), and F14512-resistant (F14R) HAP1 cells.
Topoisomerase 2α (TOP2A) mutation present in CXR and F14R clones are indicated in the first column.
- https://cdn.elifesciences.org/articles/65184/elife-65184-supp1-v2.docx
-
Supplementary file 2
Non- or mis-sense mutations found in CX-5461-resistant (CXR) clones.
Nucleotide changes and resulting amino acid modifications are indicated for each mutated gene. 1Topoisomerase 2α (TOP2A) mutations found by a manual analysis of RNA-seq data.
- https://cdn.elifesciences.org/articles/65184/elife-65184-supp2-v2.docx
-
Transparent reporting form
- https://cdn.elifesciences.org/articles/65184/elife-65184-transrepform-v2.pdf
Download links
A two-part list of links to download the article, or parts of the article, in various formats.
Downloads (link to download the article as PDF)
Open citations (links to open the citations from this article in various online reference manager services)
Cite this article (links to download the citations from this article in formats compatible with various reference manager tools)
Transcription-associated topoisomerase 2α (TOP2A) activity is a major effector of cytotoxicity induced by G-quadruplex ligands
eLife 10:e65184.
https://doi.org/10.7554/eLife.65184


