A non-genetic, cell cycle-dependent mechanism of platinum resistance in lung adenocarcinoma
- ANZAC Research Institute, Concord Hospital, Australia
- Garvan Institute of Medical Research, Australia
- St Vincent's Hospital Clinical School, University of New South Wales, Australia
- The Kinghorn Cancer Centre, Garvan Institute of Medical Research, Australia
- St Vincent’s Hospital Sydney, Australia
- The University of Sydney Concord Clinical School, Faculty of Medicine and Health, Australia
- Children’s Medical Research Institute, The University of Sydney, Australia
- Hudson Institute of Medical Research, Australia
- Department of Molecular and Translational Medicine, School of Medicine, Nursing and Health Sciences, Monash University, Australia
- Research Institute in Oncology and Hematology, CancerCare Manitoba, Canada
- Department of Internal Medicine, Rady Faculty of Health Science, University of Manitoba, Canada
Figures
Figure 1 with 1 supplement
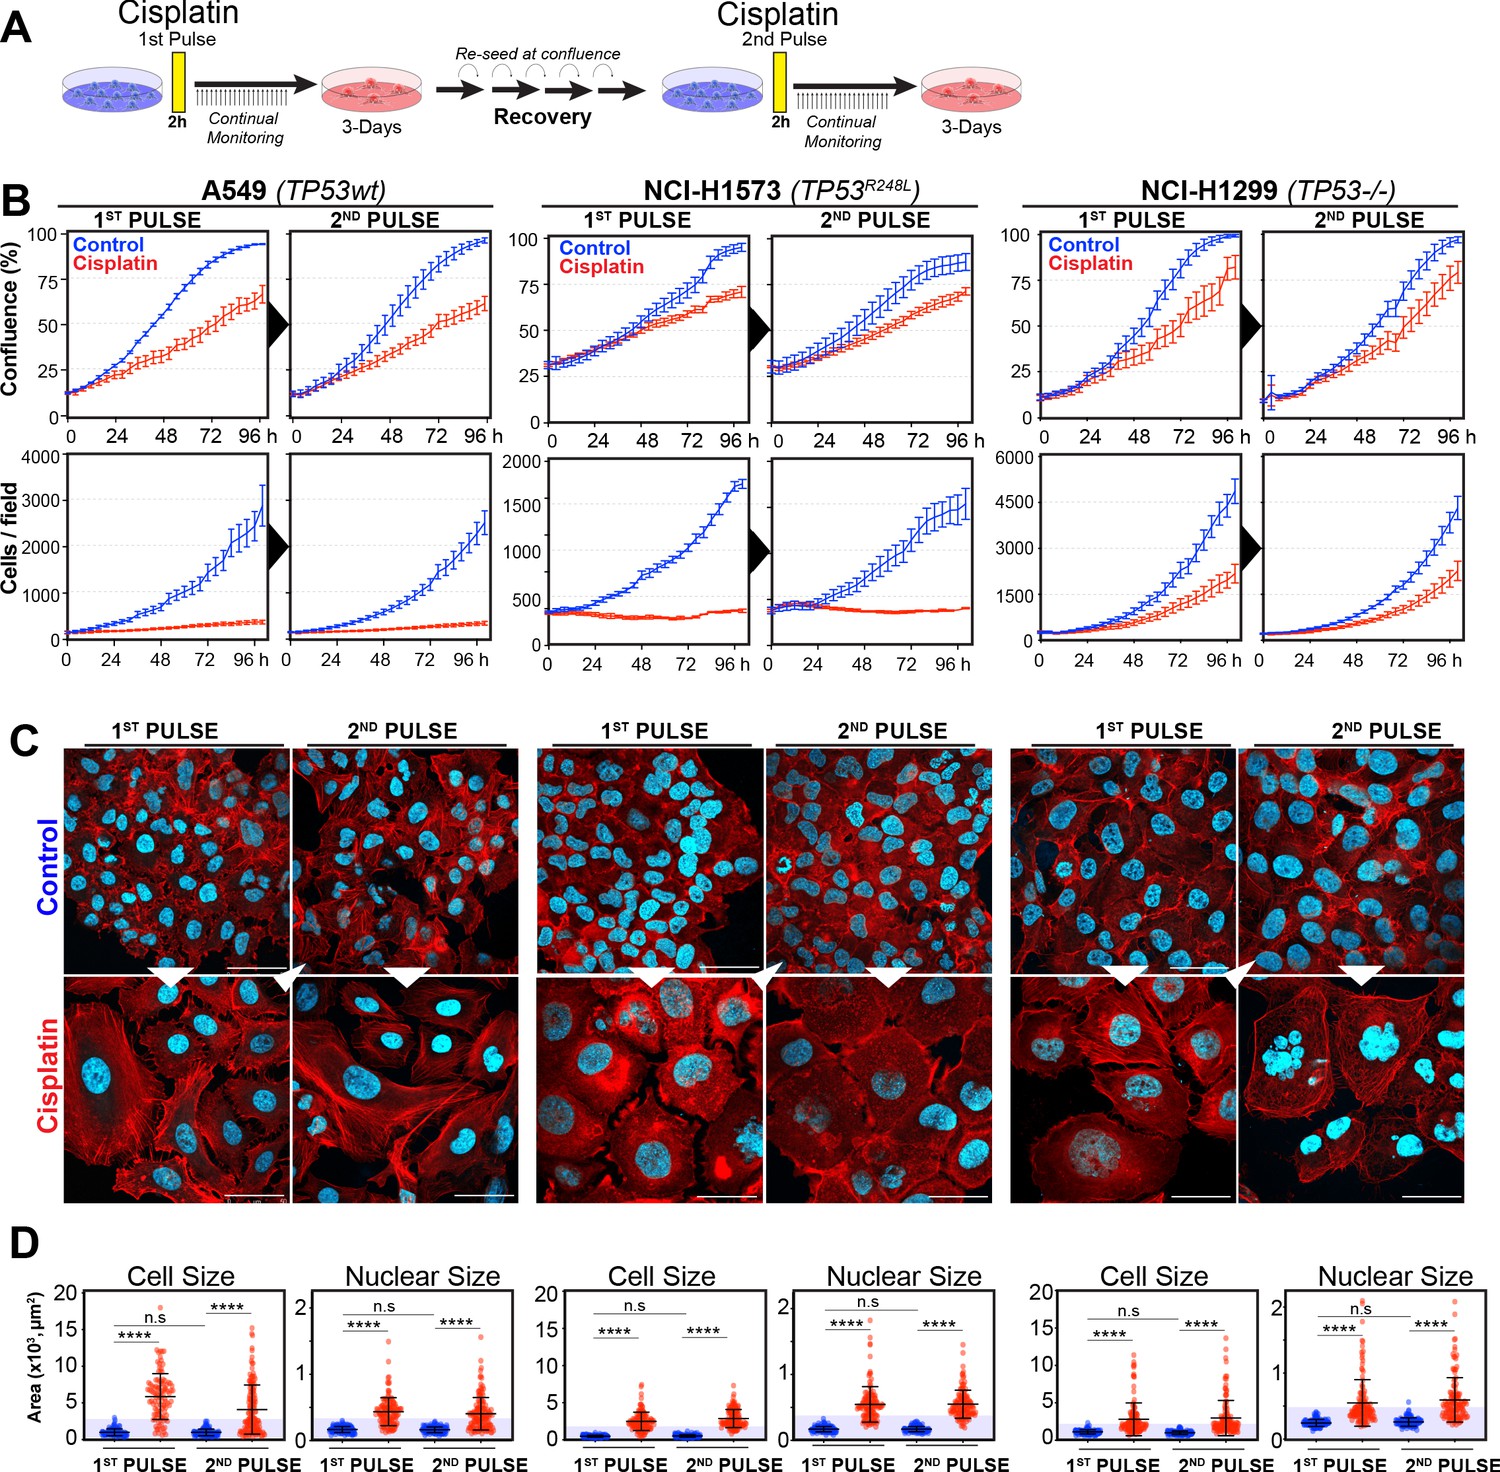
Rechallenging lung adenocarcinoma (LUAD) cells with cisplatin results in similar response profiles.
(A) Schematic of rechallenging experiments. Briefly, cells stably expressing H2B-mCherry were pulsed with 5 µg/ml cisplatin for 2 hr. Cell proliferation (nuclear number and cell size) was then tracked for up to 4 days. Cells were then allowed to recover for 21 (A549 and NCI-H1299) or 42 days (NCI-H1573), re-culturing once confluent, before being re-pulsed with cisplatin. (B) Cell confluence and cell number were tracked for up to 4 days using IncuCyte based time-lapse imaging. Shown are the mean ± SD of n = 3 biological repeats. (C) Immunofluorescence of cells at 72 hr post-cisplatin treatment. Nuclei: cyan; Phalloidin-Alexa 647: red, scale bar = 10 µm. (D) Quantification of cell size and nuclear size from (A), with a minimum of n = 200 cells analysed per condition. Shown are the mean ± SD. Statistical significance was determined by one-way ANOVA (****p<0.0001, n.s = not significant).
Figure 1—figure supplement 1
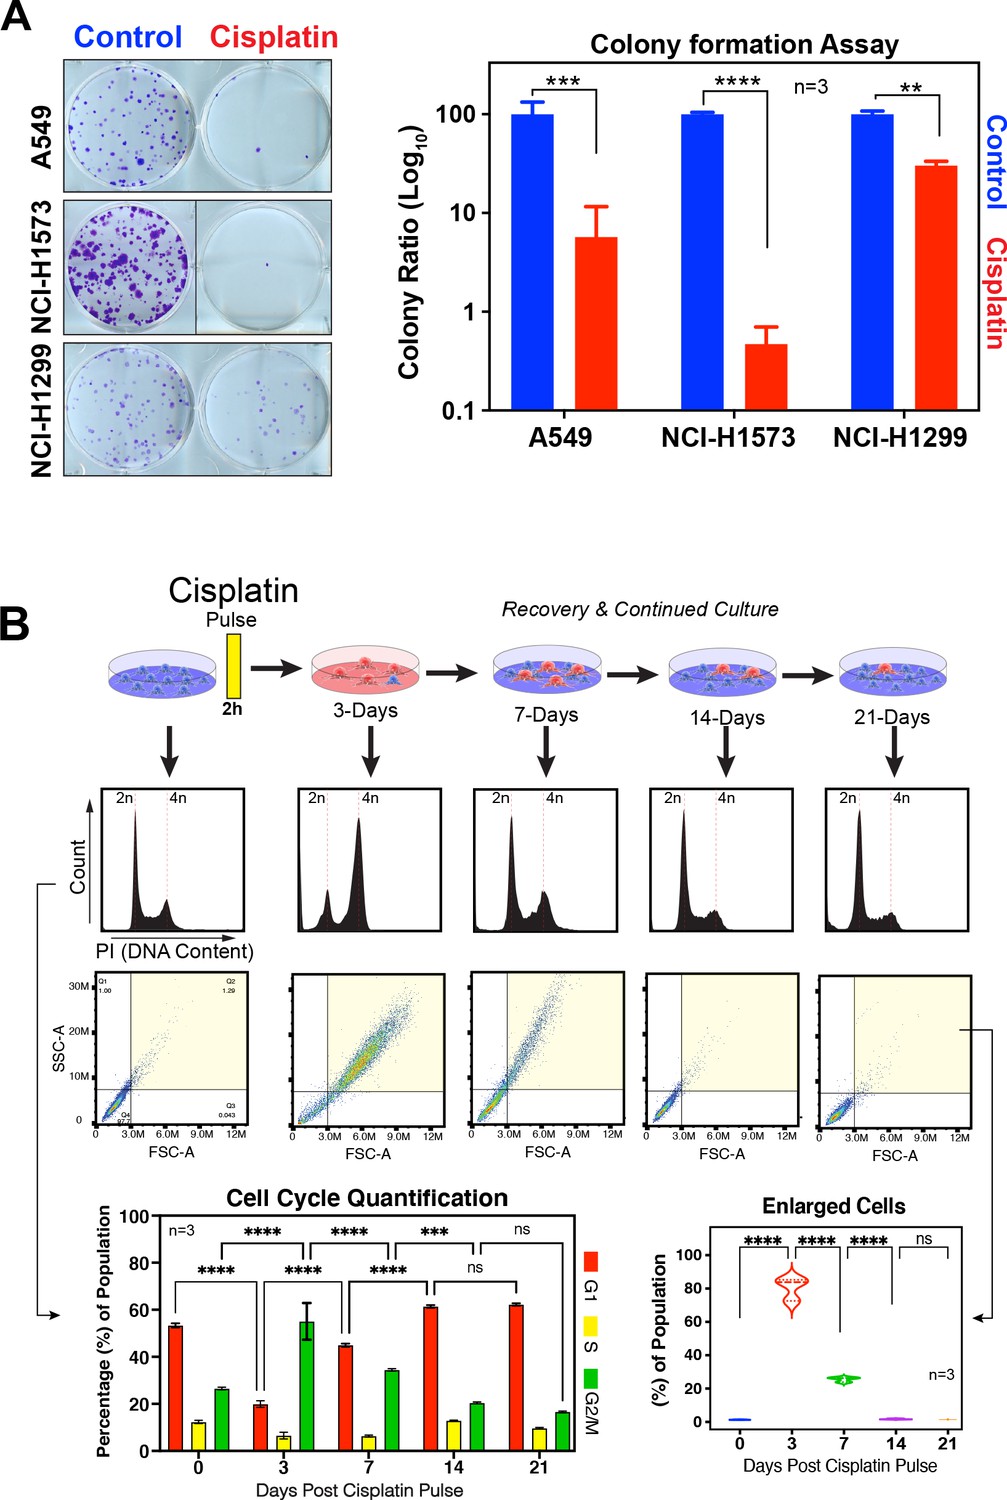
Recovery of LUAD cells following cisplatin pulse.
(A) Representative images and quantification of colony formation assays for A549, NCI-H1573, and NCI-H1299 cells treated with or without cisplatin. Colonies were fixed, stained, and counted at 10 (A549 and NCI-H1299) or 14 days (NCI-H1573) after cisplatin exposure. Scale bar = 100 µm. Shown are the mean ± SD of three biological repeats. Statistical significance was determined by Student’s t-test (****p<0.0001, ***p<0.001, **p<0.01). (B) Long-term recovery of A549 cells treated with a single pulse of 5 µg/ml was analysed by flow cytometry for cell cycle by DNA content and cell size using forward scatter (FSC) and side scatter (SSC) parameters. Shown are the mean ± SD of n = 3 biological repeats. Statistical significance was determined by two-way (cell cycle) or one-way (cell size) ANOVA with Tukey’s multiple comparisons test (****p<0.0001, ***p=0.0006, ns = not significant).
Figure 2 with 1 supplement
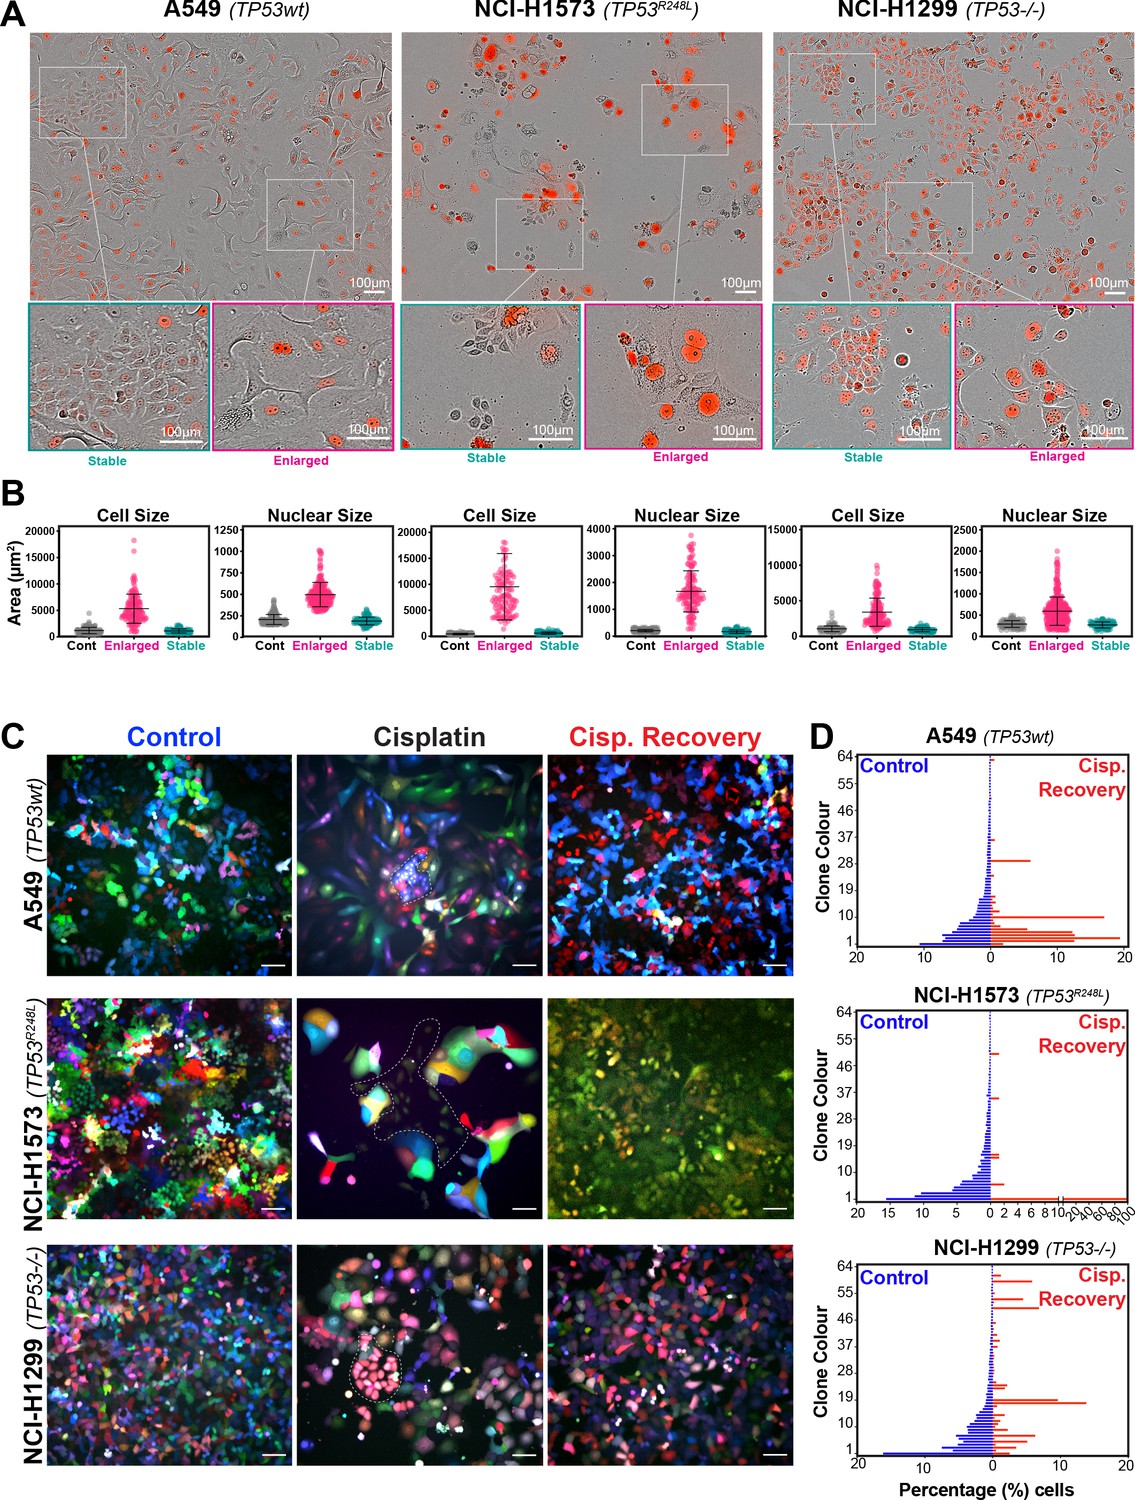
Variable cell size and clonal outgrowth in post-cisplatin-treated cells.
(A) Representative images from cells treated as per Figure 1A showing control (Cont.), proliferative (Prolif.), and arrested (Arrest) cells. Scale bars = 100 µm. (B) Cell and nuclear size were calculated on sub-populations of cells that appeared to form clonal outgrowths. Quantification of cell size and nuclear size from (A), with a minimum of n = 100 cells analysed per condition. Shown are the mean ± SD. Statistical significance was determined by one-way ANOVA (****p<0.0001, n.s = not significant). (C) LeGO RGB colour-guided clonal cell tracking system was used to track clonal dynamics after cisplatin pulse treatment. Cells were treated as per Figure 1A, with clonal identification and quantification (D), measured at 3 and 21 days post-cisplatin exposure using Image J/Fiji (42 days post-cisplatin exposure for NCI-H1573).
Figure 2—figure supplement 1
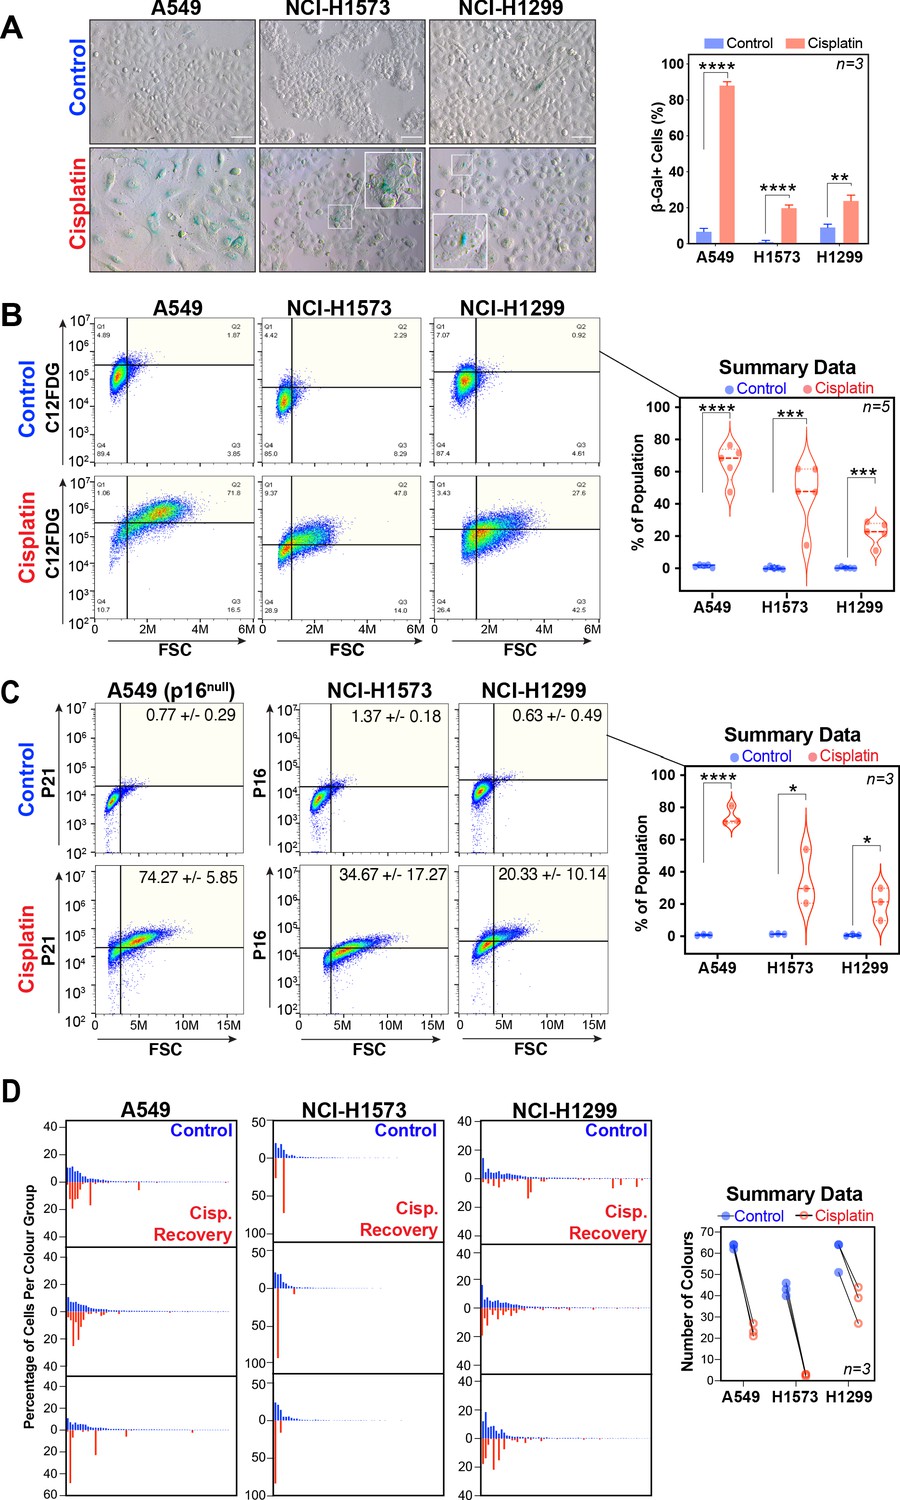
Senescence and LeGo Clonal Recovery of LUAD cells following cisplatin pulse.
(A) Representative images and quantification of A549, NCI-H1573, and CI-H1299 cells 3 days after cisplatin exposure stained for beta-galactosidase. Scale bar = 100 µm. Shown are the mean ± SD of three biological repeats. Statistical significance was determined by unpaired two-tailed Student’s t-test (****p<0.0001, ***p<0.001, **p<0.01). (B) FACS analysis of beta-galactosidase activity levels (C12FDG) versus ‘cell size’ (forward scatter [FSC]) and (C) p21, p16 and at 3 days after cisplatin exposure. Shown are the mean ± SD of three biological repeats. Statistical significance was determined by unpaired two-tailed Student’s t-test (****p<0.0001, ***p<0.001, *p<0.05). (D) Three biological repeat experiments of LeGO RGB colour-guided clonal cell tracking system were used to track clonal dynamics after cisplatin pulse treatment in each cell line. Cells were treated as per Figure 1A, with clonal identification and quantification measured at 3 and 21 days post-cisplatin exposure using Image J/Fiji (42 days post-cisplatin exposure for NCI-H1573). For summary data, only colours that represented >0.1% of total population were scored.
Figure 3 with 1 supplement
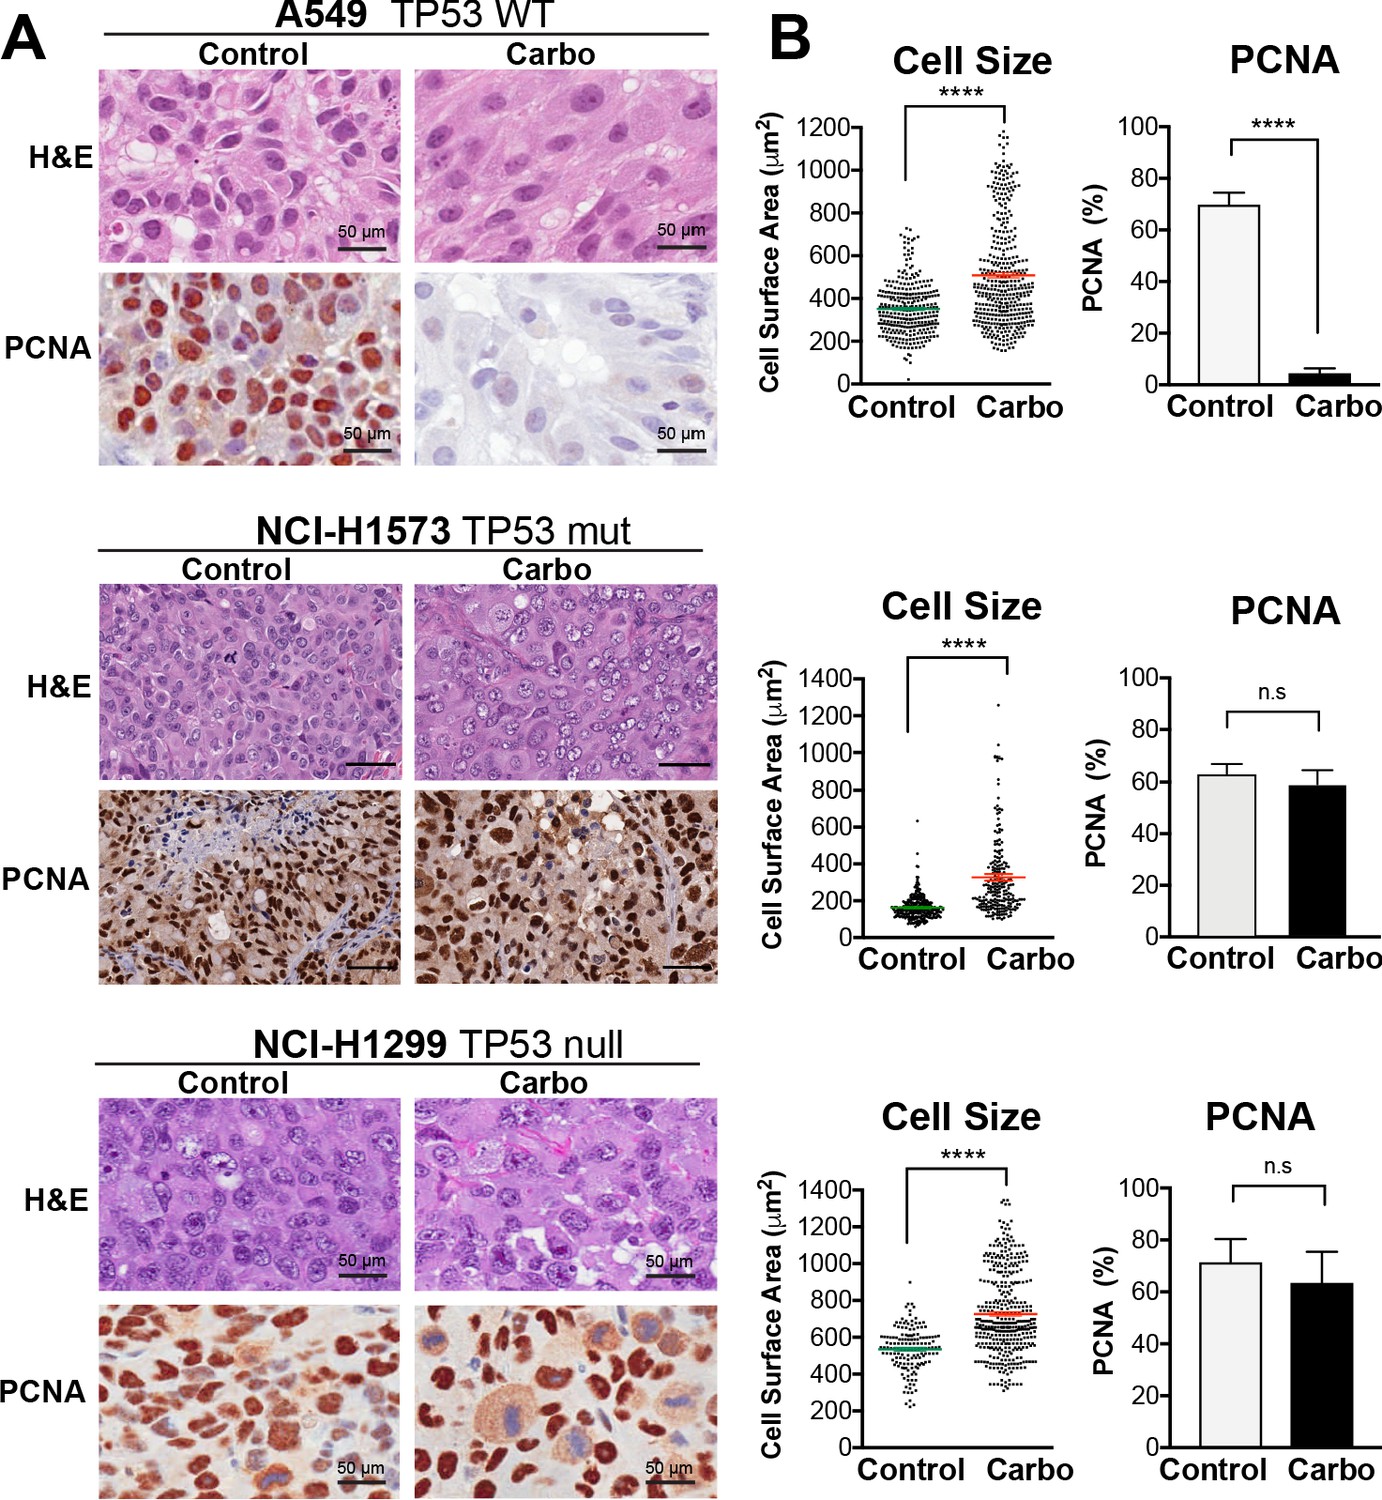
In vivo validation of cisplatin effects on cell size and proliferation.
(A) A549 and NCI-H1299 cells were injected subcutaneously with 2 × 10⁶ cells into the flanks of nude mice (n = 5). Carboplatin (60 mg/kg) was delivered by a single tail-vein injection, and tumours were harvested at 3 days post treatment and analysed by IHC for cell size and PCNA-positive staining. Scale bar = 50 µm. (B) Quantification of IHC images from (A) (control n = 300, carbo n = 400). Shown are the mean ± SD. Statistical significance was determined by unpaired two-tailed Students t-test (****p<0.0001, n.s = not significant).
Figure 3—figure supplement 1
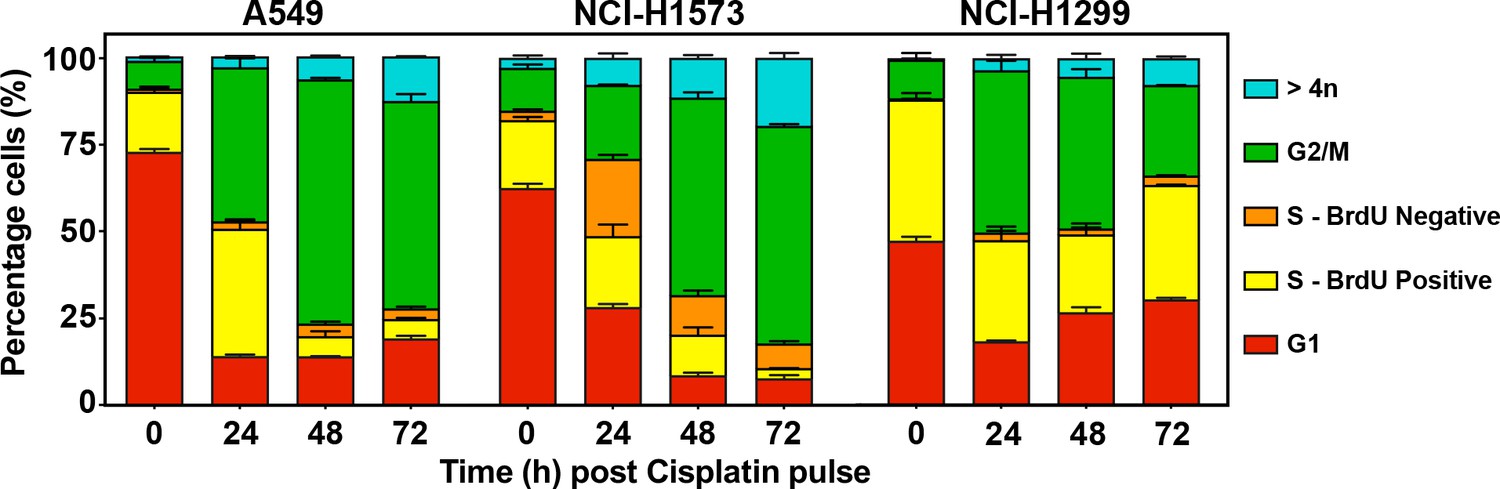
Cells were pulsed cisplatin or not (0 hr) for 2 hr and then with BrdU for 2 hr prior to harvesting at the indicated timepoints.
Cells were counter-stained with PI with DNA content and BrdU staining analysed by flow cytometry to identify cells in G1 (BrdU negative, 2 n DNA content; active S phase = between 2n and 4n) DNA and positive for BrdU, inactive S phase = 2n–4n DNA content and negative for BrdU; G2/M = 4n DNA content. The percentage of cells ± standard deviation for each population from (n = 3) independent repeats is shown.
Figure 4 with 1 supplement

Comparative RNAseq analysis of FACS-sorted cisplatin-treated cells.
(A) Schematic (created with BioRender.com) describing treatment, sorting, and analysis pipeline. (B) Representative example of pre- and post-sorted control and cisplatin-treated cells. (C) Hierarchical clustering of three independent biological repeat experiments of all altered genes identified by RNAseq. (D–F) Volcano plots displaying significantly downregulated (blue) or upregulated (orange) genes and subsequent Ingenuity Pathway Analysis (IPA) canonical pathway analysis. Predictions of inhibition (blue) or activation (orange) or no change (white) states are based on the IngenuityKnowledge Base, which compares the expected change with experimental observation to all known upstream canonical regulatory pathways. Variable stringent p-value (>1.3) and z-score (>0.5) cut-offs were used to limit pathways to top 7–8 most significant hits. (G) Hierarchical clustering of IPA comparative canonical pathway analysis.
Figure 4—figure supplement 1
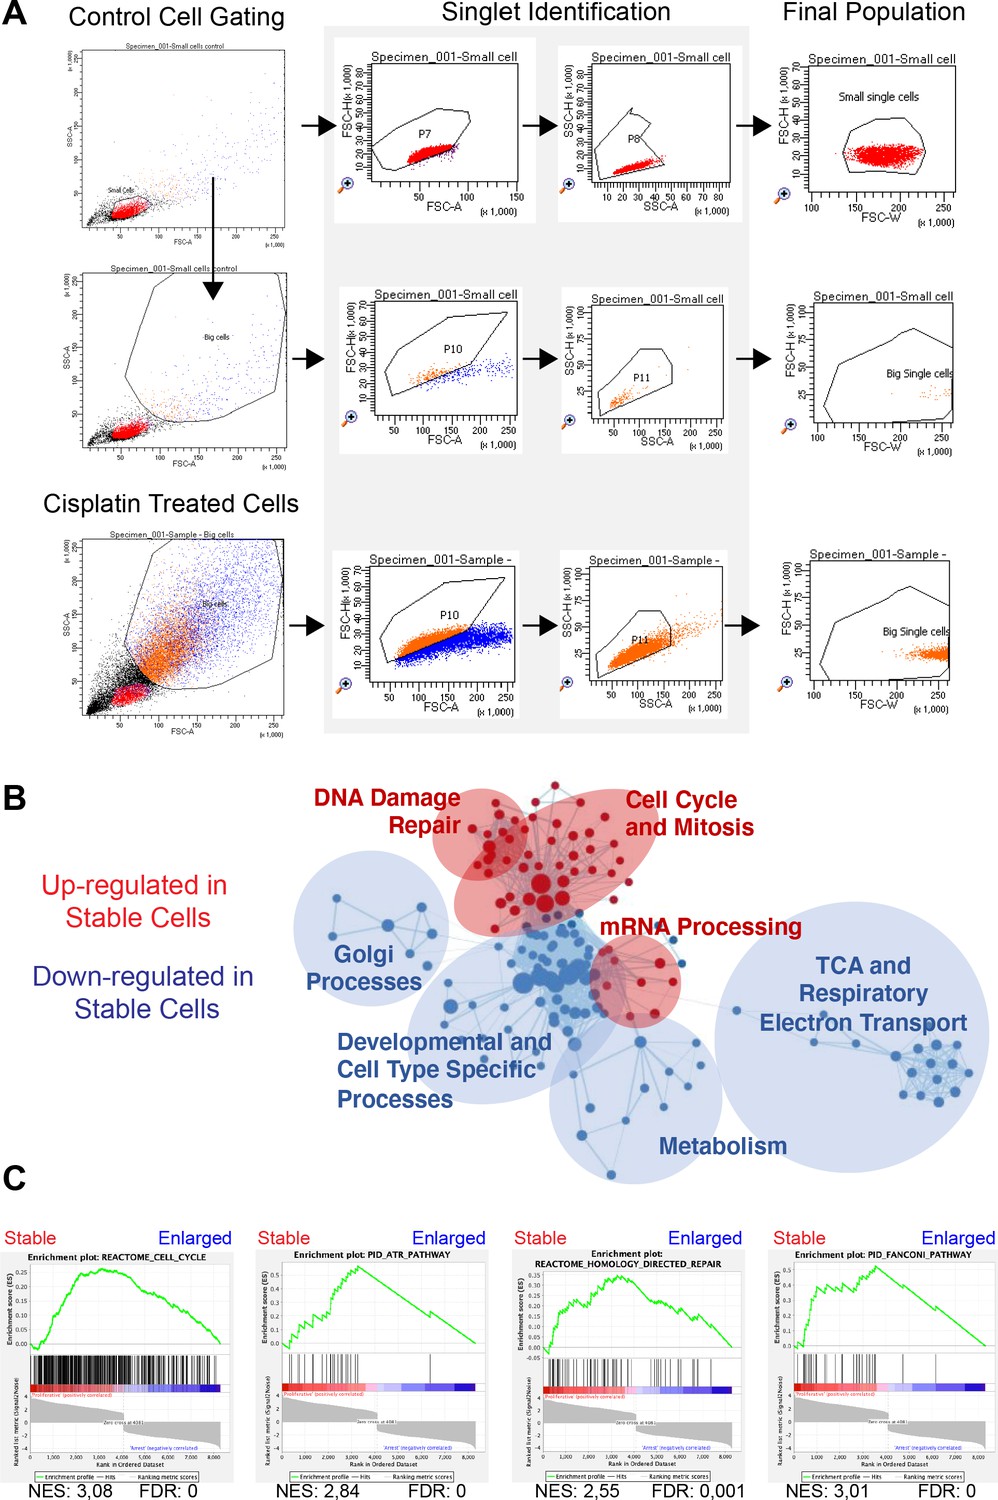
FACS sorting and RNAseq analysis of A549 cells pulsed with cisplatin.
(A) Gating strategy used for sorting control and cisplatin-treated cells based on cell size and the exclusion of doublets. (B) Cytoscape enrichment map of curated gene sets of canonical pathways for proliferative versus arrested cells. Each node represents a gene set and each line connecting nodes a gene ‘common’ to both nodes. Shown are gene sets enriched in proliferative (red) and arrested (blue) cells. The size of the node represents the normalised enrichment score (NES) score of that particular gene set. (C) Gene Set Enrichment Analysis (GSEA) plots for proliferative versus arrest cells (curated gene sets for canonical pathways). From left to right and top to bottom: cell cycle, homology-directed repair, Fanconi pathway, and ATR pathway. The green curve corresponds to the enrichment score (ES) curve, which is the running sum of the weighted enrichment score obtained from GSEA software, while the NES and the corresponding false discovery rate (FDR) value are reported within each graph.
Figure 5 with 4 supplements
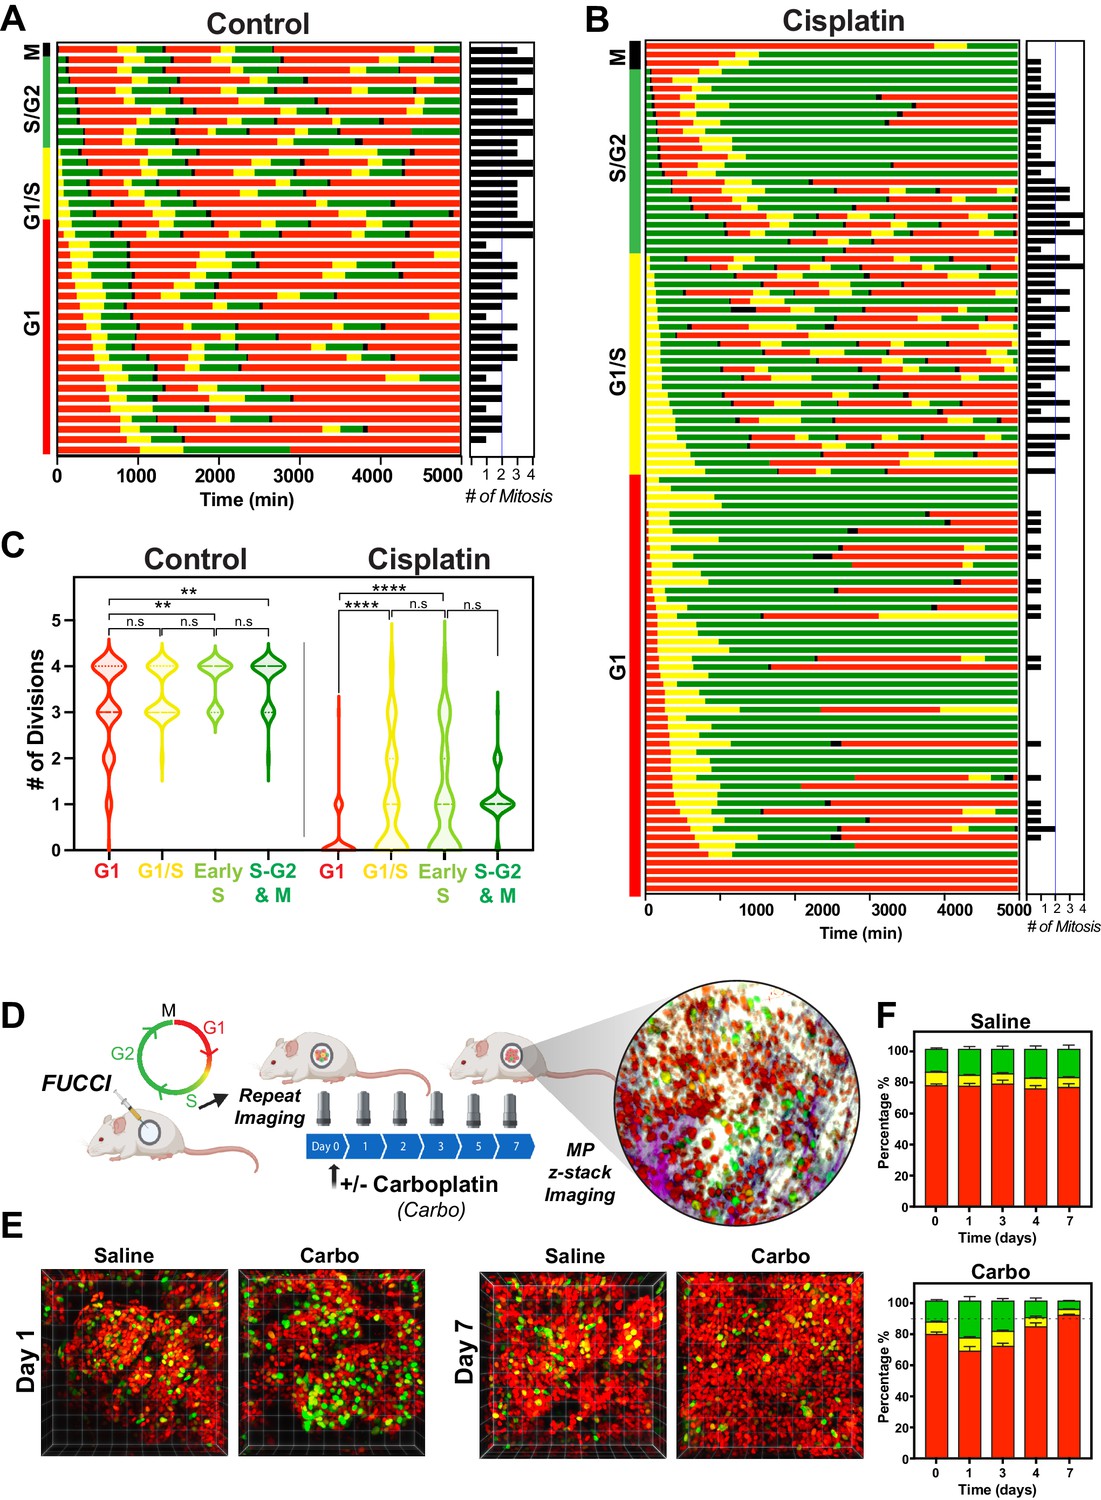
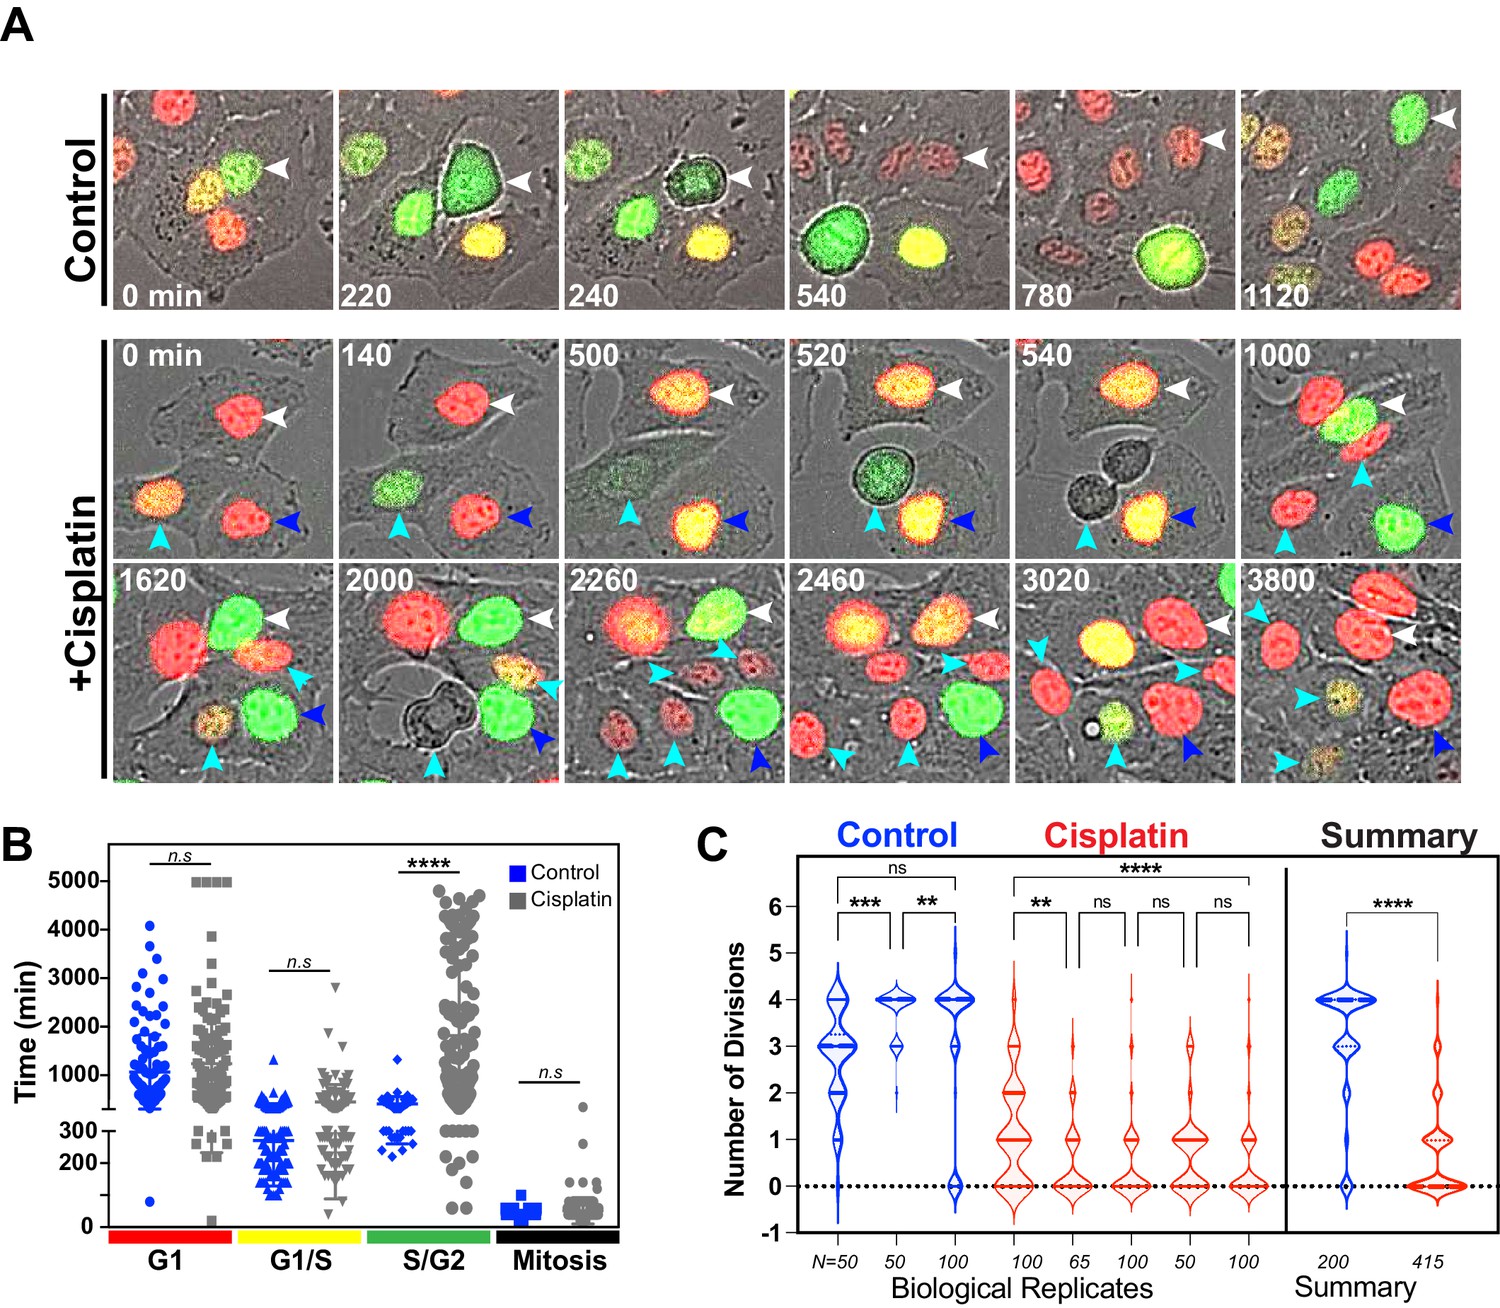
Cell cycle and p53 status at the time of exposure correlates with cell fate outcomes.
(A, B) The fate of asynchronously growing FUCCI expressing A549 individual control (n = 50) and cisplatin pulsed cells (n = 100) was tracked by time-lapse microscopy, with images taken every 30 min for 72 hr. Cisplatin-treated cell analysis was slightly biased for cells that underwent multiple divisions. (C) Violin plots of the number of divisions from cells in (A, B), based on the cell cycle phase at the time of cisplatin exposure. Statistical significance was determined by one-way ANOVA with Tukey’s correction for multiple comparisons (**p<0.01, ****p<0.0001, ns = not significant). (D) Schematic (created with BioRender.com) of optical window-based longitudinal in vivo imaging of FUCCI A549 cells. (E) Representative 3D projection images from mice imaged at days 1 and 7 with carboplatin (Carbo) or control (Saline). (F) Quantification of the proportion of red (G1), yellow (G1/S), and green (S/G2-M) cells found in tumours (n = 3) from day 0 to 7.
Figure 5—figure supplement 1
Additional replicates of FUCCI expressing A549 cells pulsed with cisplatin.
(A) Representative images of A549 FUCCI expressing cells treated with (Cisplatin) or without (Control) 5 µg/ml cisplatin for 2 hr and then followed by time-lapse microscopy. Images were taken every 20 min for 3 days. Coloured arrows indicate specific mother and daughter cells followed through time. (B) Quantification of cell cycle phase length from data generated in (B) and (C). Statistical significance was determined by one-way ANOVA with Tukey’s correction for multiple comparisons (****p<0.0001, n.s = not significant). (C) The total number of divisions completed by biological repeats of asynchronously growing FUCCI expressing A549 cells pulsed with or without (control) with 5 µg/ml cisplatin for 2 hr. Data was extracted from time-lapse imaging analysis. Statistical significance was determined by one-way ANOVA with Tukey’s correction for multiple comparisons (****p<0.0001, ***p<0.001, **p<0.01, ns = not significant) and an unpaired two-tailed Student’s t-test for summary data (****p<0.0001).
Figure 5—figure supplement 2

Role of p53 in regulating response to pulsed cisplatin.
(A) The total number of divisions completed by asynchronously growing FUCCI expressing A549 (data from Figure 5—figure supplement 1C) and NCI-H1299 cells treated without (control) or with 5 µg/ml cisplatin for 2 hr. Data was extracted from time-lapse imaging analysis. Statistical significance was determined by one-way ANOVA with Tukey’s correction for multiple comparisons (****p<0.0001, ns = not significant). (B) The individual fate maps of NCI-H1299 cells (n = 50 control, 100 = cisplatin) from (A), tracked by time-lapse microscopy, with images taken every 30 min for 72 hr. (C) Quantification of cell fate outcomes from (B), including G1 arrest before mitosis (G1 ABM), G1 arrest after mitosis (G1 AAM), death before mitosis (DBM), and death after mitosis (DAM) and proliferative (Prolif.), that is, cells that divided two or more times. (D) Violin plots of the number of divisions completed by cisplatin-treated NCI-H1299 cells based on the cell cycle phase at the time of cisplatin exposure. Statistical significance was determined by one-way ANOVA with Tukey’s correction for multiple comparisons (ns = not significant). (E) Additional analysis of data from Hastings et al., 2020 showing the total number of divisions completed by (n = 50) asynchronously growing FUCCI expressing A549 cells treated with either scramble (siControl) or one of two separate siRNAs targeting p53. Statistical significance was determined by one-way ANOVA with Tukey’s correction for multiple comparisons (****p<0.0001, ***p<0.001, **p<0.01, ns = not significant).
Figure 5—figure supplement 3
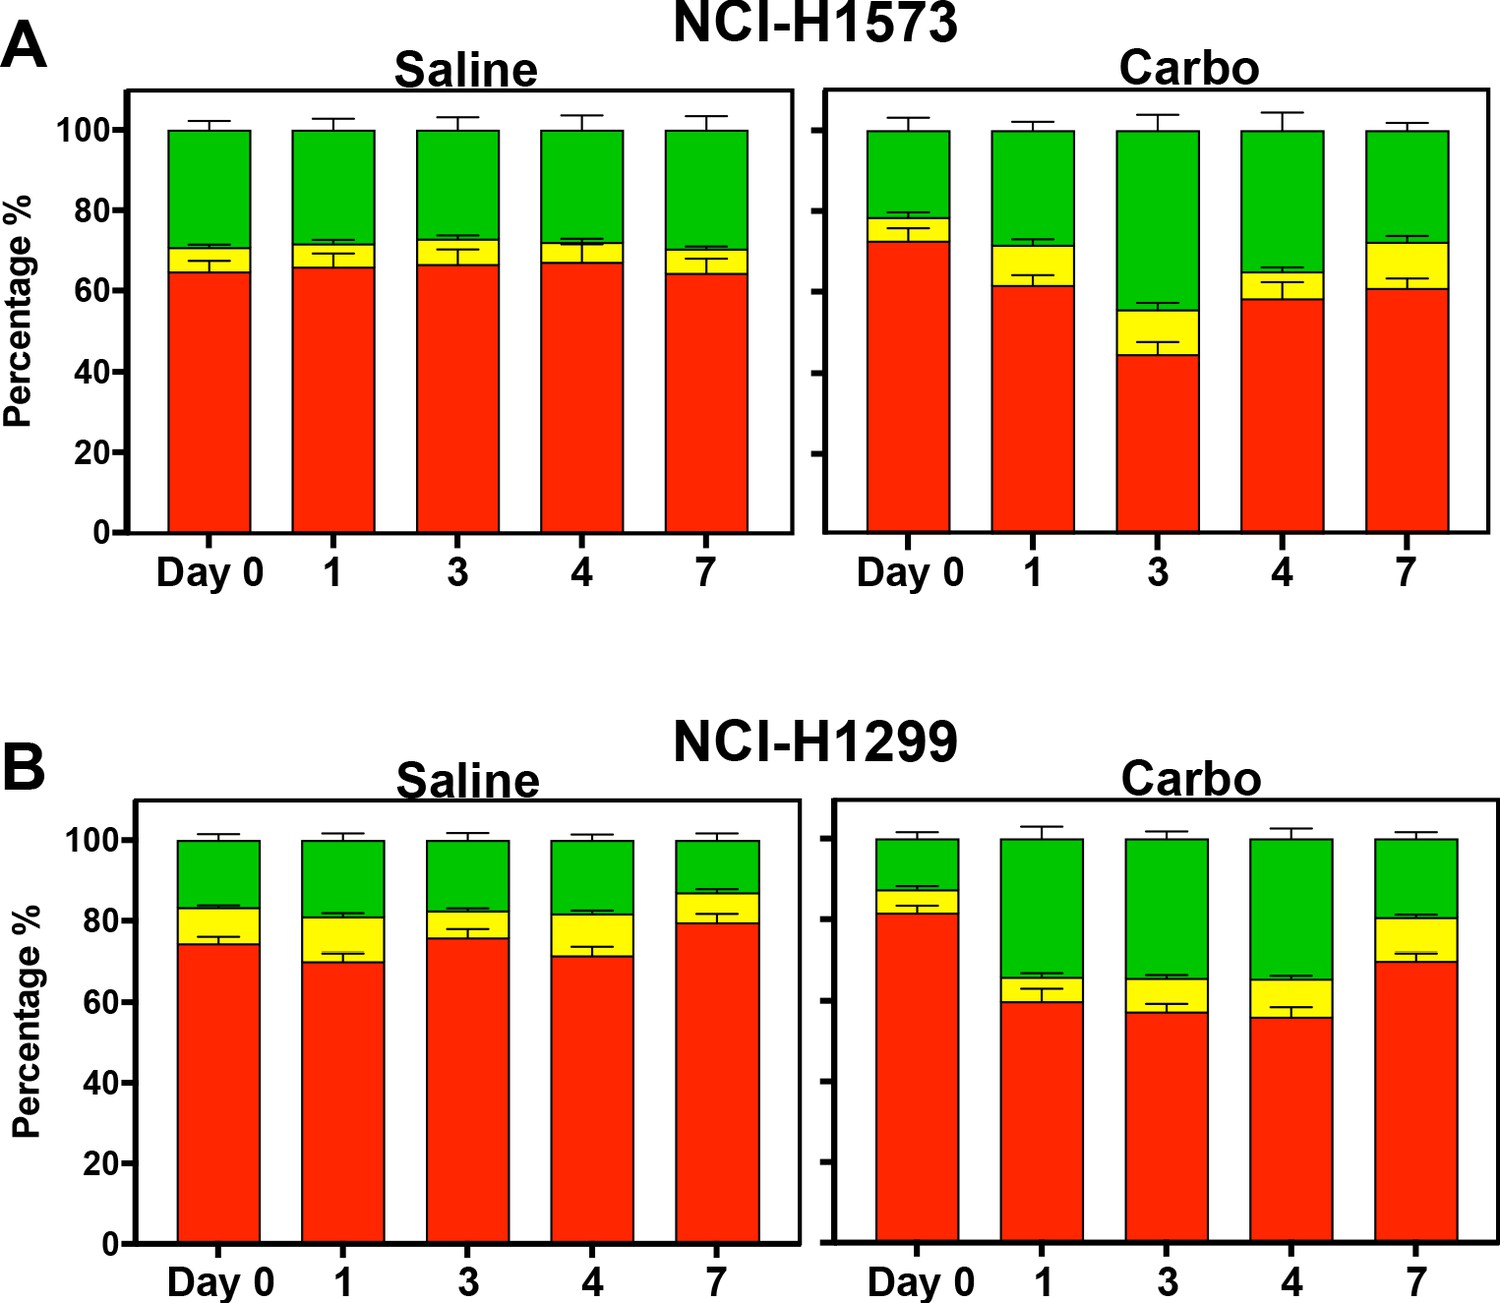
In vivo analysis of FUCCI expressing LUAD cells.
Similar to Figure 5D–F, quantification of the proportion of red (G1), yellow (G1/S), and green (S/G2-M) cells found in tumours (n = 3) from day 0 to 7 of (A) NCI-H1573 and (B) NCI-H1299 placed under optical windows in mice treated with or without carboplatin.
Figure 5—video 1
Asynchronous A549 cells pulsed with or without cisplatin.
Figure 6 with 2 supplements
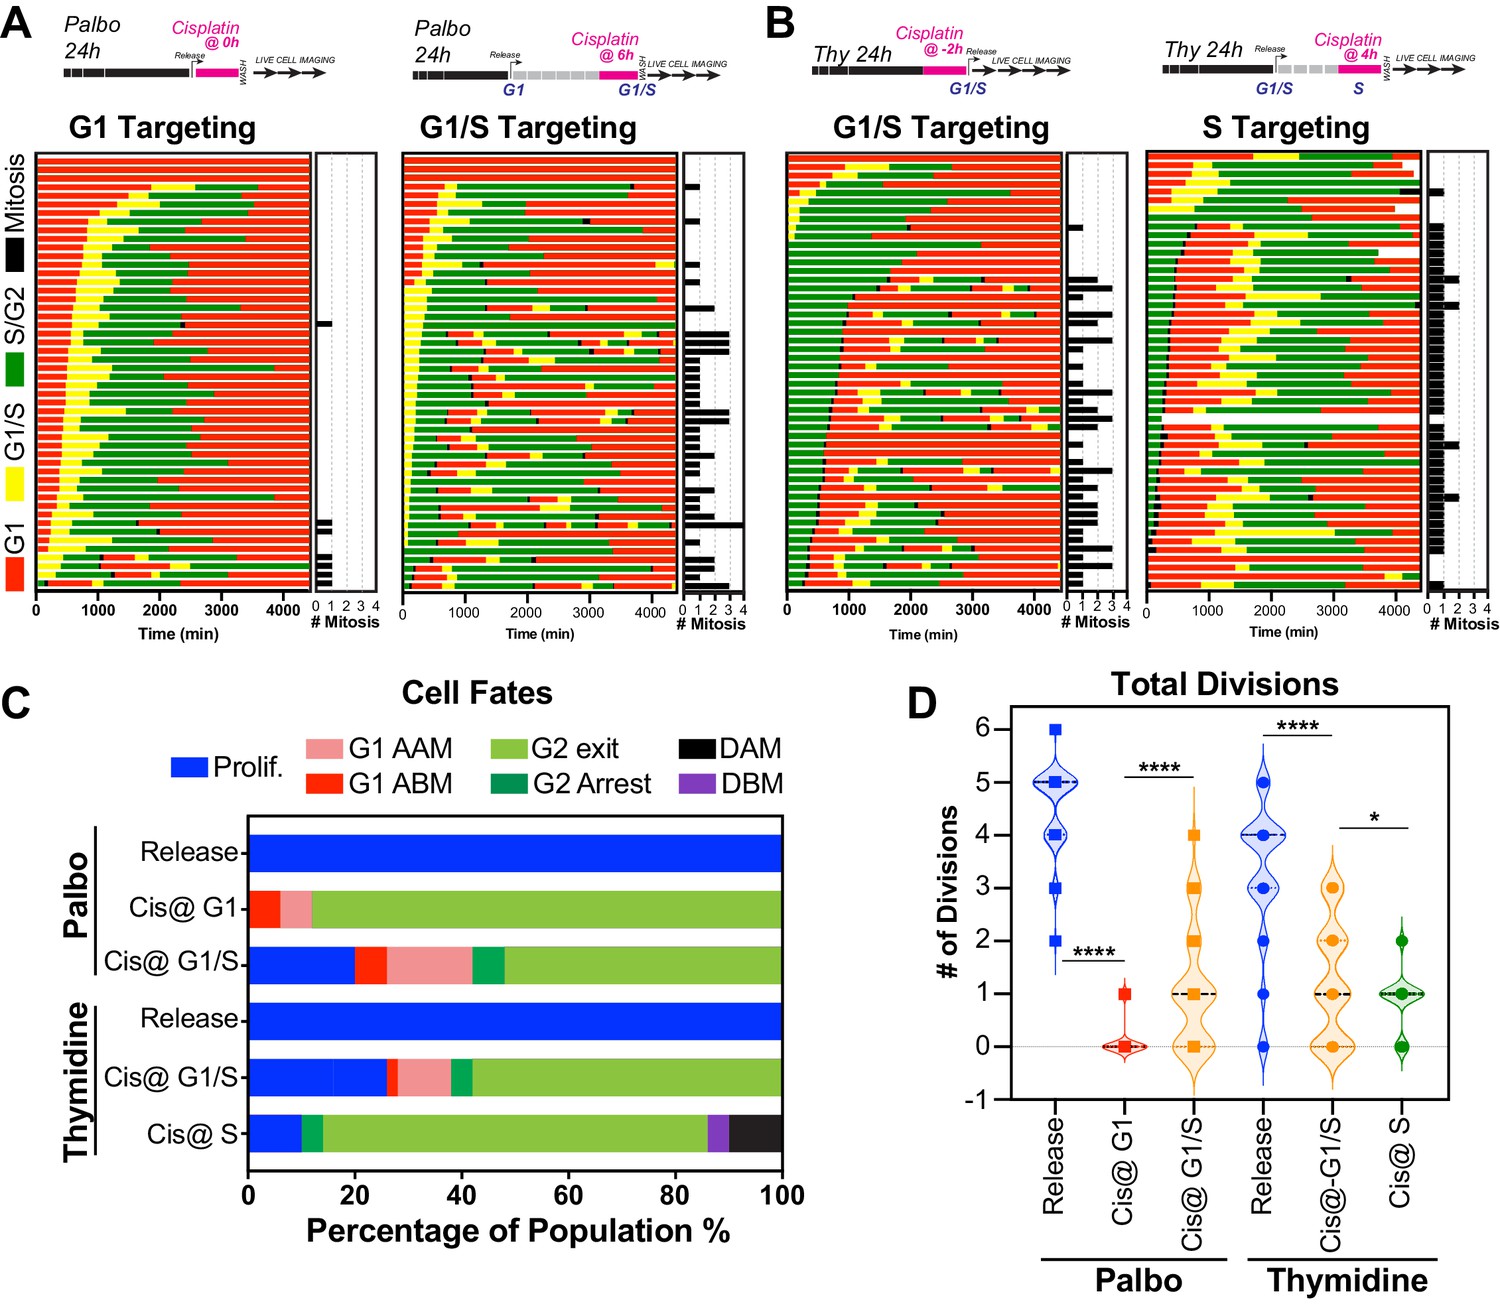
Cell cycle-dependent regulation of cisplatin response.
(A, B) Schematic of palbociclib (Palbo) and thymidine (Thy) protocols used to synchronise FUCCI expressing A549 cells in G1, G1/S, and S phase prior to 2 hr cisplatin pulse treatment. Specifically, G1 cells were released from palbociclib and pulsed immediately with cisplatin (Palbo + Cis at G1). G1/S cells were pulsed with cisplatin at 6 hr post release from palbociclib (Palbo + Cis at G1/S), or alternatively G1/S phase cells targeted by treatment with cisplatin 2 hr prior to release from thymidine (Thy + Cis at G1/S). Finally, S phase cells targeted by pulsing with cisplatin at 4 hr post-thymidine release (Thy + Cis at S). The fate of individual cells (n = 50) was tracked by time-lapse microscopy, with images taken every 30 min for 72 hr. (C) Quantification of cell fate outcomes from (A), including G1 arrest before mitosis (G1 ABM), G1 arrest after mitosis (G1 AAM), death before mitosis (DBM), and death after mitosis (DAM) and proliferative (Prolif.). (D) Quantification of the total number of cell divisions observed in each condition (n = 50). Mean is shown, statistical significance was determined by one-way ANOVA with Tukey’s correction for multiple comparisons (****p<0.0001, *p<0.05).
Figure 6—video 1
Palbociclib sychronised FUCCI expressing A549 cells pulsed with cisplatin.
Figure 6—video 2
Thymidine sychronised FUCCI expressing A549 cells pulsed with cisplatin.
Figure 7 with 2 supplements
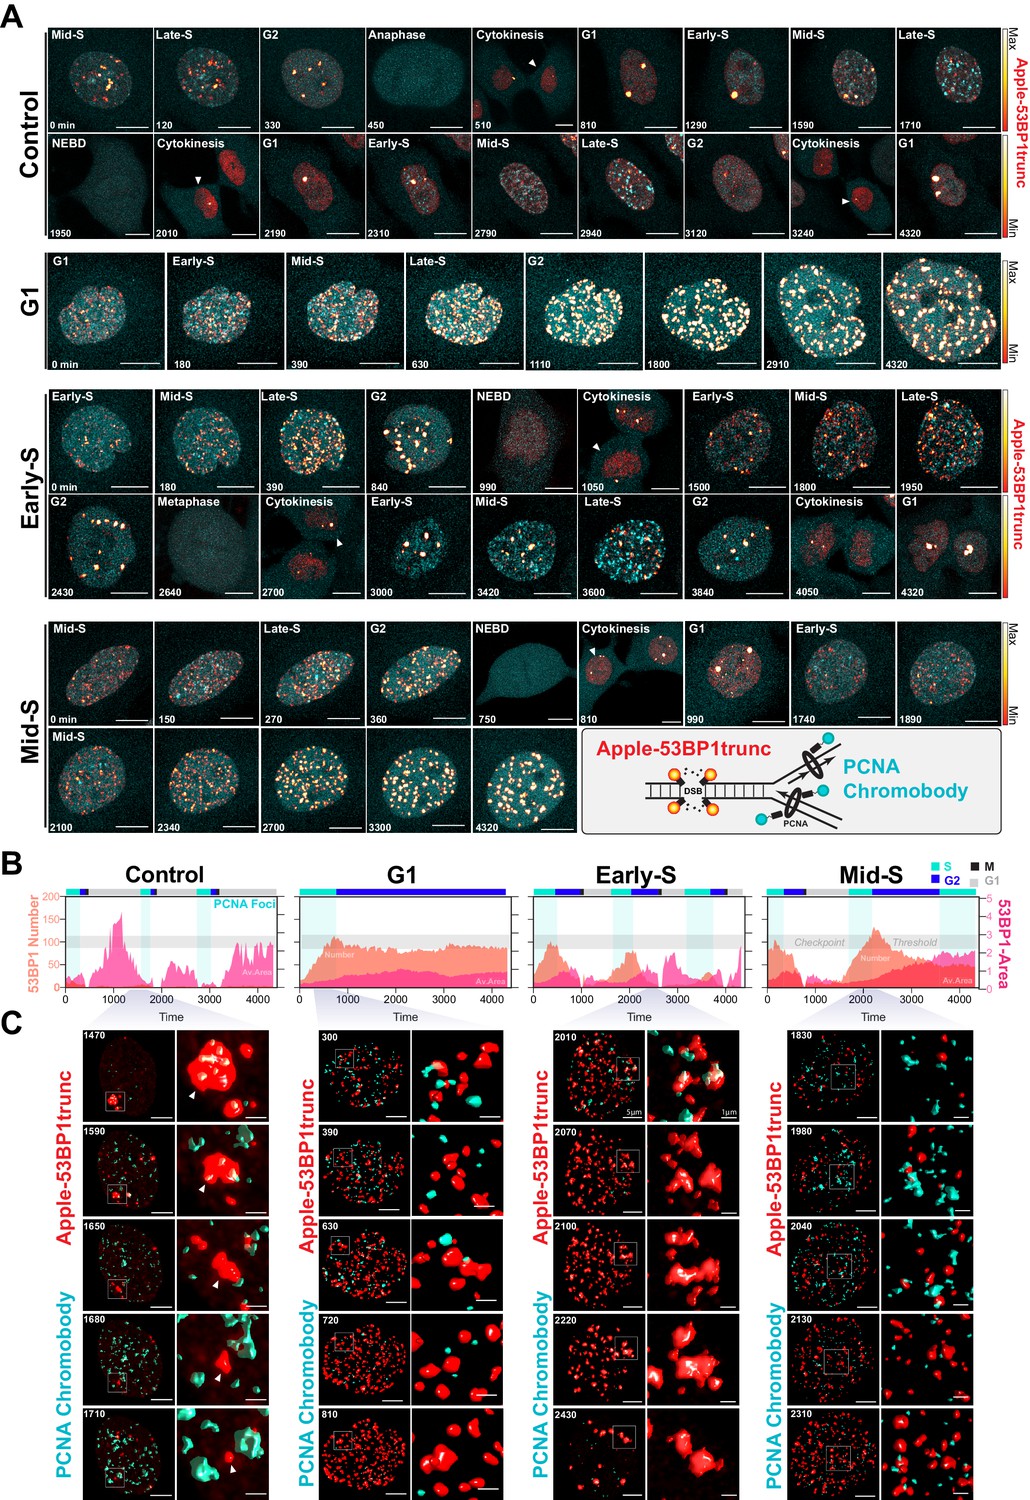
Dual DNA replication and damage biosensor analysis of cisplatin-treated cells.
(A) Representative maximum image projections of A549 cells co-expressing a mNeonGreen tagged PCNA chromobody (cyan) and a truncated version of 53BP1 tagged with mApple (trunc53BP1-mApple; red-hot LUT). Cells were imaged using confocal microscopy, with 10-µm-thick z-stack (1 µm slice) taken every 30 min for 72 hr. Scale bar 10 µm. (B) Quantification of the size and number of PCNA and 53BP1 foci for each cell shown in (A). (C) 3D volume renders from cells in (A) for the indicated times, with cropped zoom areas (right image). White arrows indicate 53BP1 foci that reduce in size over time (min). Scale bars 5 µm and 1 µm for left and right panels, respectively.
Figure 7—figure supplement 1
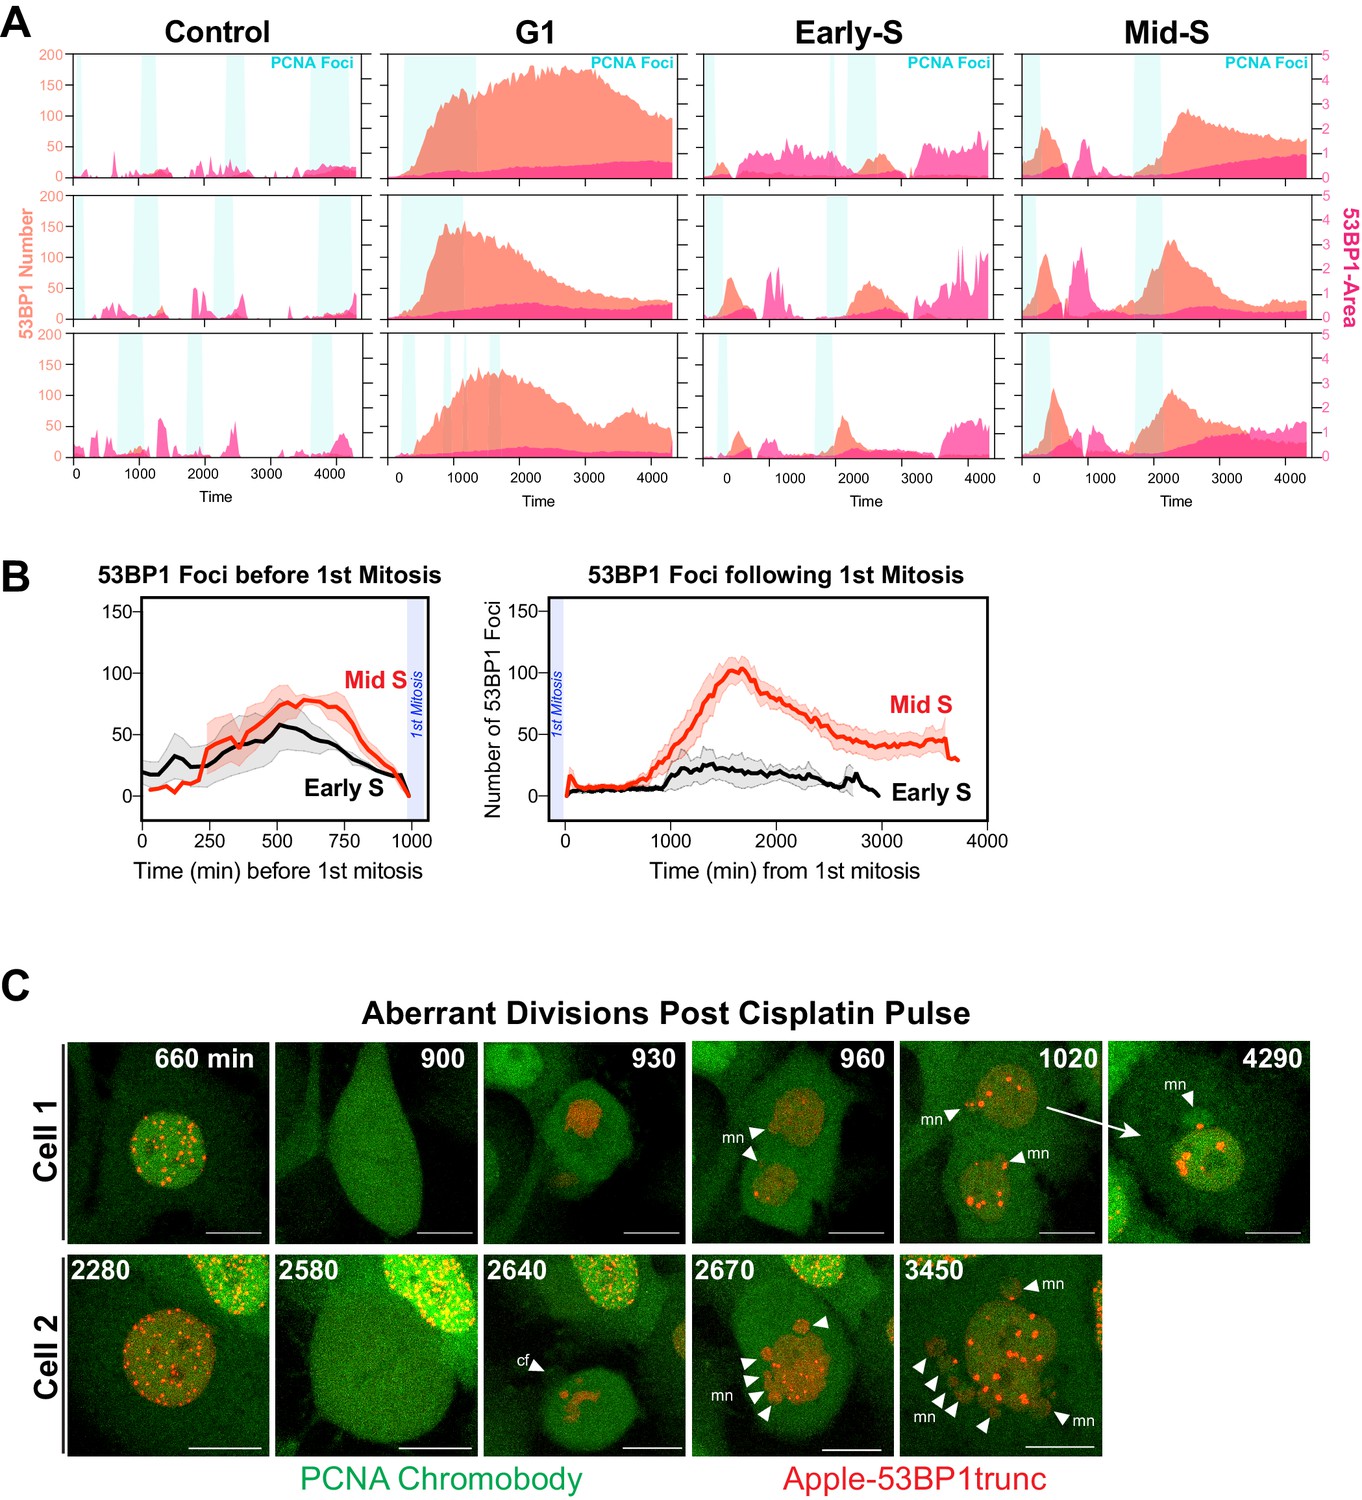
Additional analysis of dual DNA replication and damage biosensor analysis of cisplatin-treated cells.
(A) Quantification of the size and number of PCNA and 53BP1 foci for additional cells as per Figure 7A, B. (B) Number of 53BP1 foci in cells from early S and mid/late S phase (n = 4) were temporally aligned based on entry into and exit from the first mitosis. (C) Representative images of the first mitosis observed in cells that were in mid-S phase at the time of cisplatin exposure. White arrowheads indicate micronuclei (mn) in daughter cells, cf = cytokinesis failure. Scale bar = 10 µm.
Figure 7—video 1
Dual DNA replication and damage biosensor analysis of cisplatin-treated cells.
Figure 8 with 1 supplement

Inhibition of PARP reduces ability of early S phase cells to maintain proliferative capacity.
(A) Schematic of palbociclib (Palbo) and thymidine (Thy) protocols used to synchronise FUCCI expressing A549 cells in G1, early and late S phase prior to olaparib (PARPi; 1 µM) and 2 hr cisplatin (5 µg/ml) pulse treatment. The fate of (n = 50) individual cells was tracked by time-lapse microscopy, with images taken every 30 min for 72 hr. Quantification of the total number of cell divisions (B) and G1 length after (C) first mitotic division observed in each condition. Statistical significance was determined by a one-way ANOVA test with correction for multiple comparisons (****p<0.0001, ***p<0.001, **p<0.01, *p<0.05). (D) Quantification of cell fate outcomes from (A), including G1 arrest before mitosis (G1 ABM), G1 arrest after mitosis (G1 AAM), death before mitosis (DBM), and death after mitosis (DAM) and proliferative (Prolif.), that is, cells that divided two or more times. (E) Fluorescent imaging of asynchronous A549 dual biosensor cells pulsed with cisplatin for 2 hr. The percentage of cells with <5 or >15 53BP1 foci/cell after cisplatin treatment are shown. A minimum of 250 cells per timepoint and condition were counted from (n = 3) biological repeats. Statistical significance was determined by two-way ANOVA (*p<0.05). (F) Thymidine-synchronised cells treated as per (A) were harvested and analysed for cell size and γ-H2AX by flow cytometry. Representative FACS plots and quantification from (n = 3) biological repeats are shown. Statistical significance was determined by one-way ANOVA with Tukey’s correction for multiple comparisons (***p<0.001).
Figure 8—figure supplement 1
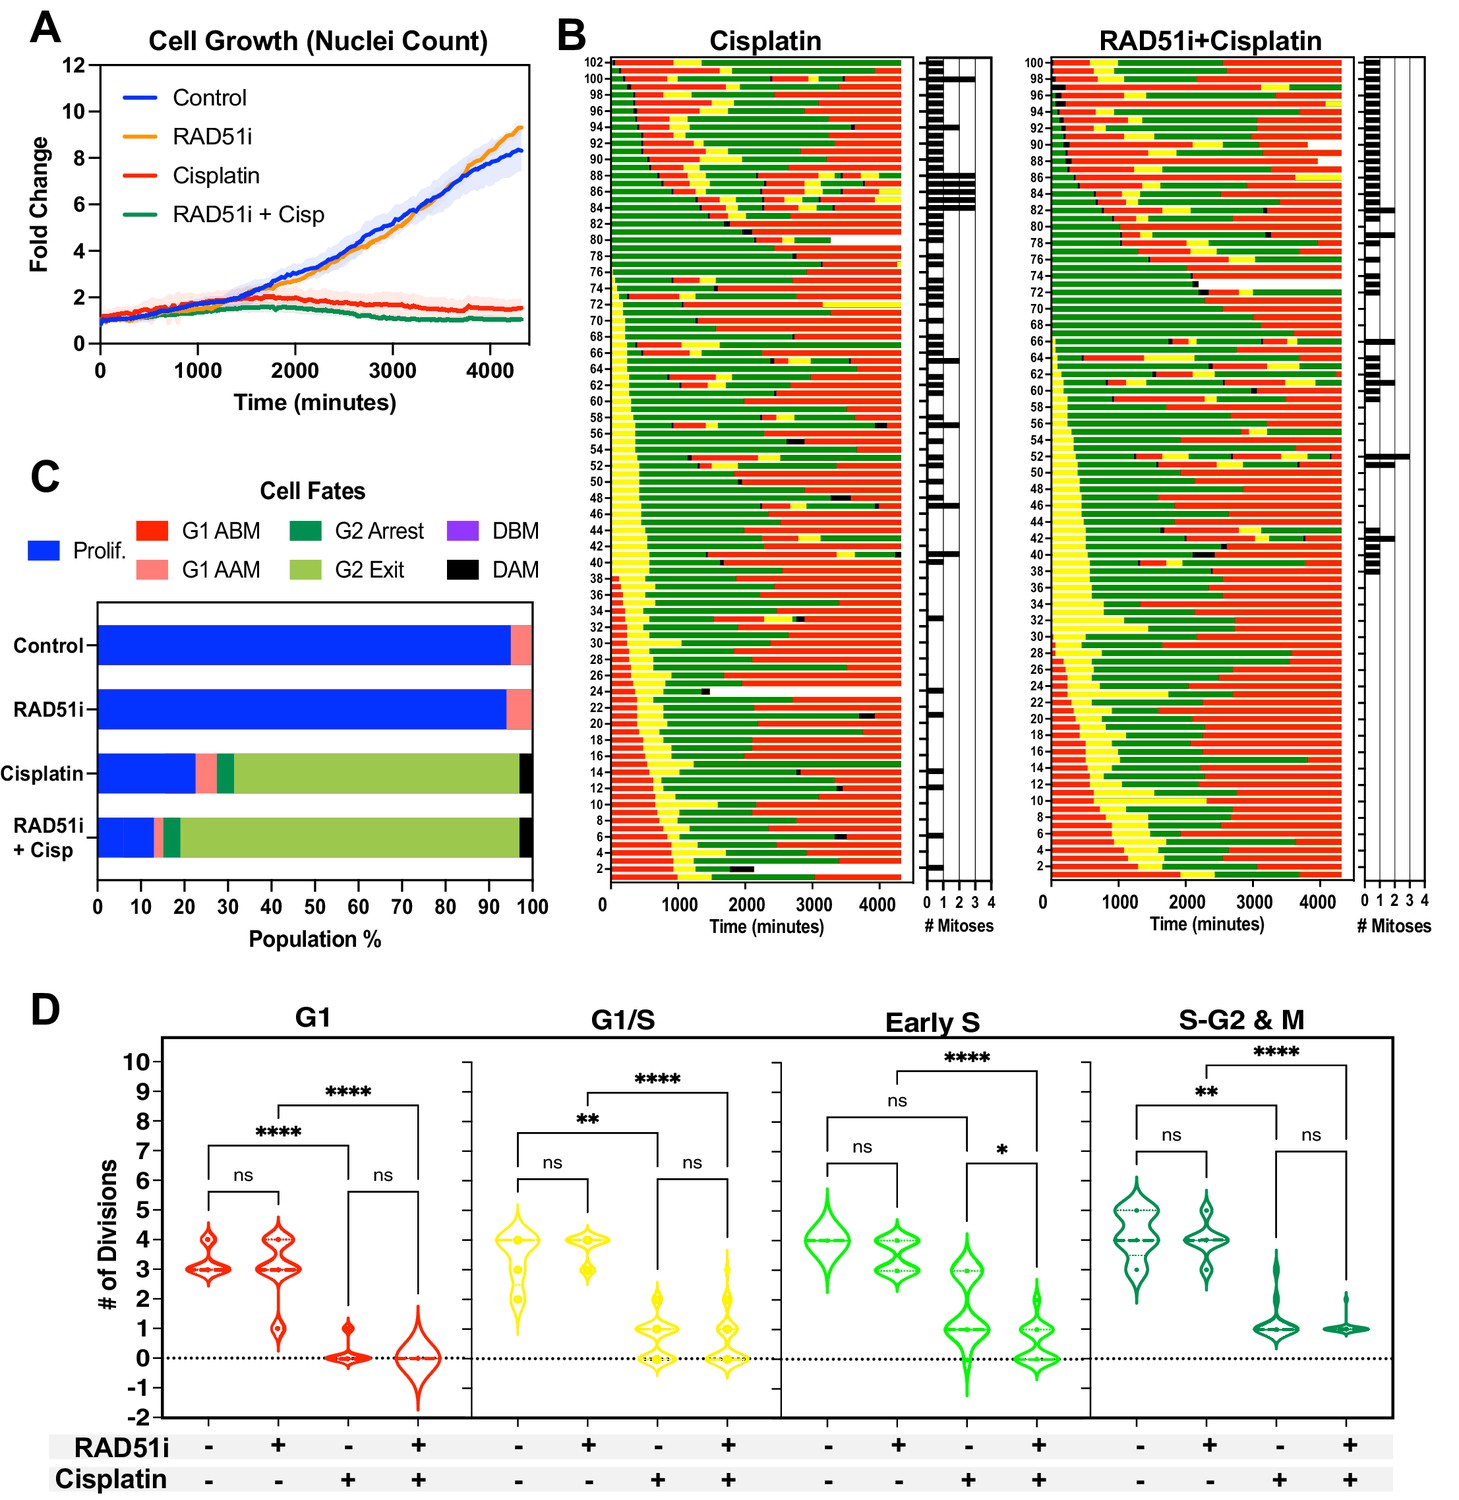
Inhibition of RAD51 reduces ability of early S phase cells to maintain proliferative capacity.
(A) Representative cell proliferation curves ± SD of FUCCI expressing A549 cells treated with 5 µM of the RAD51 inhibitor IR-1 for 1 hr prior to exposure for 2 hr with 5 µg/ml cisplatin. Nuclear counts were determined from five independent fields of time-lapse imaging, using the StarDist plugin for ImageJ/Fiji. (B) Cell fate maps for (n = 100) of cells from (A). (C) Quantification of cell fate outcomes from (B), including G1 arrest before mitosis (G1 ABM), G1 arrest after mitosis (G1 AAM), death before mitosis (DBM), and death after mitosis (DAM) and proliferative (Prolif.), that is, cells that divided two or more times. (D) Violin plots of the number of divisions of cells from (B) based on the cell cycle phase at the time of cisplatin exposure. Statistical significance was determined by one-way ANOVA with Tukey’s correction for multiple comparisons (*p<0.05, **p<0.01, ****p<0.0001, ns = not significant).
Figure 9
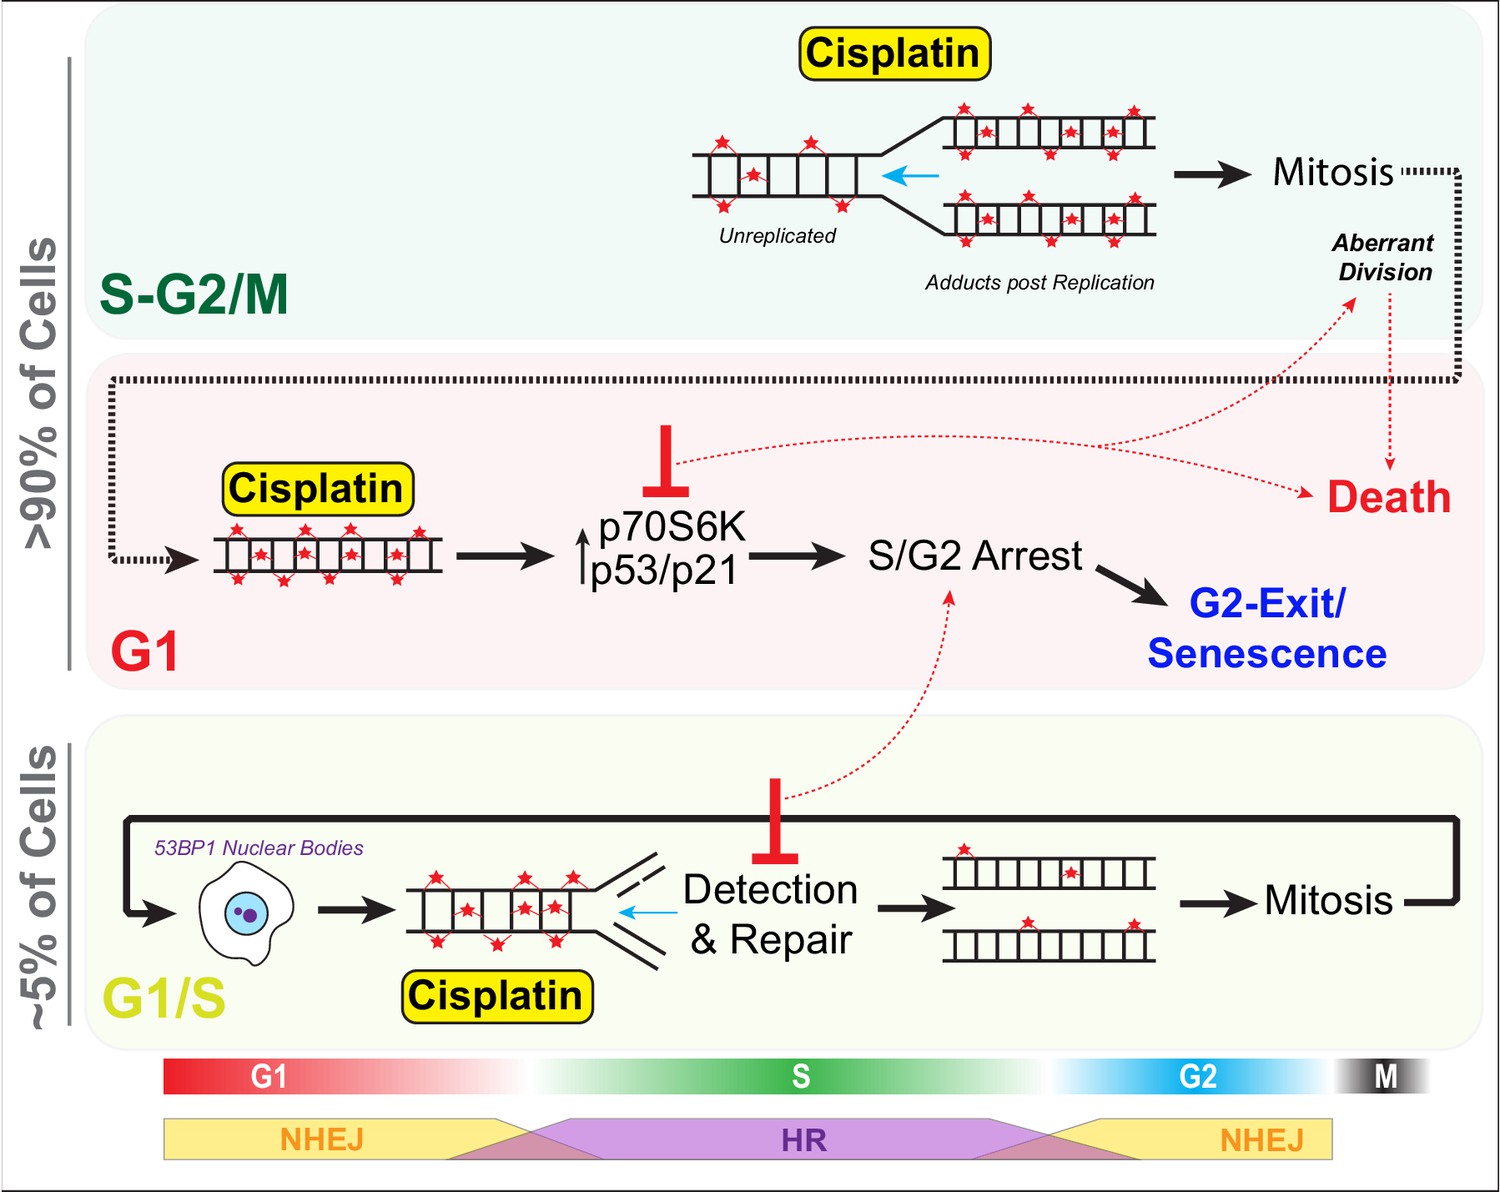
Schematic outlining cell cycle dependence of cisplatin recovery.
Briefly, cells exposed in G1 undergo S/G2 phase arrest, marked by high levels of P70S6K, p53, and p21, which results in a stable and permanent cell cycle exit from G2 phase. Cells in late S phase likely receive platinum adducts in areas of already duplicated DNA, with error-prone non-homologous end joining (NHEJ) favoured over homologous recombination (HR). Combining this with an increase in cells undergoing aberrant division results in daughter cells displaying higher rates of damage during replication, further resulting in S/G2 arrest and senescence. In contrast, cells in late G1/early S phase have the opportunity to detect and repair damage by HR during the first cycle, thereby increasing chances that daughter cells will successfully complete and repair damage, allowing continued proliferation.
Tables
Key resources table
| Reagent type (species) or resource | Designation | Source or reference | Identifiers | Additional information |
|---|---|---|---|---|
| Cell line (Homo sapiens) | A549 | ATCC | CCL-185, RRID:CVCL_0023 | |
| Cell line (Homo sapiens) | NCI-H1299 | ATCC | CRL-5803, RRID:CVCL_0060 | |
| Cell line (Homo sapiens) | NCI-H1573 | ATCC | CRL-5877, RRID:CVCL_1478 | |
| Transfected construct (human) | mVenus-hGeminin (1/110) (plasmid) | Sakaue-Sawano et al., 2008 | ||
| Transfected construct (human) | mCherry-hCdt1 (30/120) (plasmid) | Sakaue-Sawano et al., 2008 | ||
| Transfected construct (human) | Cell Cycle-Chromobody plasmid | Chromotek | ccr | Recloned into a pLVX lentiviral backbone with TagRFP replaced with mNeonGreen |
| Transfected construct (human) | 53BP1trunc-Apple | Addgene | 69531, RRID:Addgene_69531 | 53BP1 C-terminally fused to mApple fluorescent protein Yang et al., 2015 |
| Transfected construct (human) | B_mCherry_IRES_neo3 | Addgene | 21044, RRID:Addgene_21044 | Steigemann et al., 2009 |
| Transfected construct (human) | LeGO-Cer2 (Cerulean) | Addgene | 27338, RRID:Addgene_27338 | Weber et al., 2008 |
| Transfected construct (human) | LeGO-V2 (Venus fluorescent protein) | Addgene | 27340, RRID:Addgene_27340 | Weber et al., 2008 |
| Transfected construct (human) | LeGO-C2 (mCherry) | Addgene | 27339, RRID:Addgene_27339 | Weber et al., 2008 |
| Antibody | Anti-p21 Waf1/Cip1 (Rabbit monoclonal) | Cell Signaling Technology | 2947, RRID:AB_330945 | Flow (1:200) |
| Antibody | Anti-p16 Ink4a (Mouse monoclonal) | Abcam | AB201980, RRID:AB_2891086 | Flow (1:200) |
| Antibody | Anti-gamma H2A.X (phospho S139) antibody (Rabbit monoclonal) | Cell Signaling Technology | 9718, RRID:AB_2118009 | Flow (1:200) |
| Antibody | Anti-PCNA (Mouse monoclonal) | Abcam | AB29, RRID:AB_303394 | IHC (1:500−1:2000) |
| Antibody | Alexa Fluor Plus 647 Secondary Antibody (Rabbit polyclonal) | Thermo Fisher Scientific | RRID:AB_A32733, RRID:AB_2633282 | Flow (1:500) |
| Antibody | BrdU-FITC (Mouse monoclonal) | BD Biosciences | 347583, RRID:AB_400327 | Flow (1:20) |
| Chemical compound, drug | Alexa Fluor 647 Phalloidin | Thermo Fisher Scientific | RRID:AB_A22287, RRID:AB_2620155 | IF (1:40,000) |
| Chemical compound, drug | Cisplatin | Hospira Australia | 88S035 | |
| Chemical compound, drug | Carboplatin | Abcam | ab120828 | |
| Chemical compound, drug | Olaparib | Selleck Chem | S1060 | |
| Chemical compound, drug | Palbociclib | Selleck Chem | S1116 | |
| Chemical compound, drug | RI-1 | Selleck Chem | S8077 | |
| Chemical compound, drug | PureLink RNase A | Thermo Fisher Scientific | 12091021 | |
| Chemical compound, drug | C12FDG (5-Dodecanoylaminofluorescein Di-β-D-Galactopyranoside) | Thermo Fisher Scientific | D2893 | |
| Chemical compound, drug | Η33342 | Sigma | B2261 | 1 µg/ml |
| Chemical compound, drug | Propidium Iodide | Thermo Fisher Scientific | P3566 | |
| Chemical compound, drug | Thymidine | Selleck Chem | S4803 | |
| Chemical compound, drug | BrdU (5-Bromo-2′-Deoxyuridine) | Thermo Fisher Scientific | B23151 | |
| Commercial assay or kit | ImaGene Green C12FDG lacZ Gene Expression Kit | Molecular Probes | I2904 | |
| Other | Matrigel Basement Membrane | Bio-Strategy | BDAA354230 | |
| Software | Fiji/Image J | NIH | RRID:SCR_002285 | https://imagej.net/Fiji (Schindelin et al., 2012) |
| Software, algorithm | FlowJo | BD Biosciences | RRID:SCR_008520 | https://www.flowjo.com |
| Software, algorithm | GraphPad Prism (v9.1.0) | GraphPad | RRID:SCR_002798 | https://www.graphpad.com |
| Software, algorithm | Huygens Professional | Scientific Volume Imaging (SVI) | RRID:SCR_014237 | https://svi.nl/Huygens-Professional |
| Software, algorithm | LAS-X | Leica | RRID:SCR_013673 | https://www.leica-microsystems.com/products/microscope-software/p/leica-las-x-ls/ |
Additional files
-
Supplementary file 1
Summary table of comparative RNAseq data for pre-sorted untreated A549 control cells verse cisplatin pulsed cells.
- https://cdn.elifesciences.org/articles/65234/elife-65234-supp1-v3.xlsx
-
Supplementary file 2
Summary table of comparative RNAseq data for pre-sorted untreated A549 control cells verse post-sorted enlarged cisplatin pulsed cells.
- https://cdn.elifesciences.org/articles/65234/elife-65234-supp2-v3.xlsx
-
Supplementary file 3
Summary table of comparative RNAseq data for pre-sorted untreated A549 control cells verse post-sorted stable size cisplatin pulsed cells.
- https://cdn.elifesciences.org/articles/65234/elife-65234-supp3-v3.xlsx
-
Supplementary file 4
Summary table of comparative RNAseq data for post-sorted enlarged cisplatin pulsed cells A549 cells verse post-sorted stable size cisplatin pulsed cells.
- https://cdn.elifesciences.org/articles/65234/elife-65234-supp4-v3.xlsx
-
Transparent reporting form
- https://cdn.elifesciences.org/articles/65234/elife-65234-transrepform-v3.docx
Download links
A two-part list of links to download the article, or parts of the article, in various formats.
Downloads (link to download the article as PDF)
Open citations (links to open the citations from this article in various online reference manager services)
Cite this article (links to download the citations from this article in formats compatible with various reference manager tools)
A non-genetic, cell cycle-dependent mechanism of platinum resistance in lung adenocarcinoma
eLife 10:e65234.
https://doi.org/10.7554/eLife.65234


