Malaria parasites use a soluble RhopH complex for erythrocyte invasion and an integral form for nutrient uptake
- Laboratory of Malaria and Vector Research, NIAID, National Institutes of Health, United States
- Laboratory of Cell Biology, Center for Cancer Research, National Cancer Institute, National Institutes of Health, United States
- Department of Molecular Microbiology and Immunology, and Johns Hopkins Malaria Institute, Johns Hopkins Bloomberg School of Public Health, United States
- Laboratory of Mass Spectrometry and Gaseous Ion Chemistry, The Rockefeller University, United States
- Laboratory of Cellular and Structural Biology, The Rockefeller University, United States
- Office of Cyber Infrastructure & Computational Biology, National Institute of Allergy and Infectious Diseases, National Institutes of Health, United States
- Department of Biochemistry and Molecular Biology, University of British Columbia, Canada
Figures
Figure 1 with 2 supplements
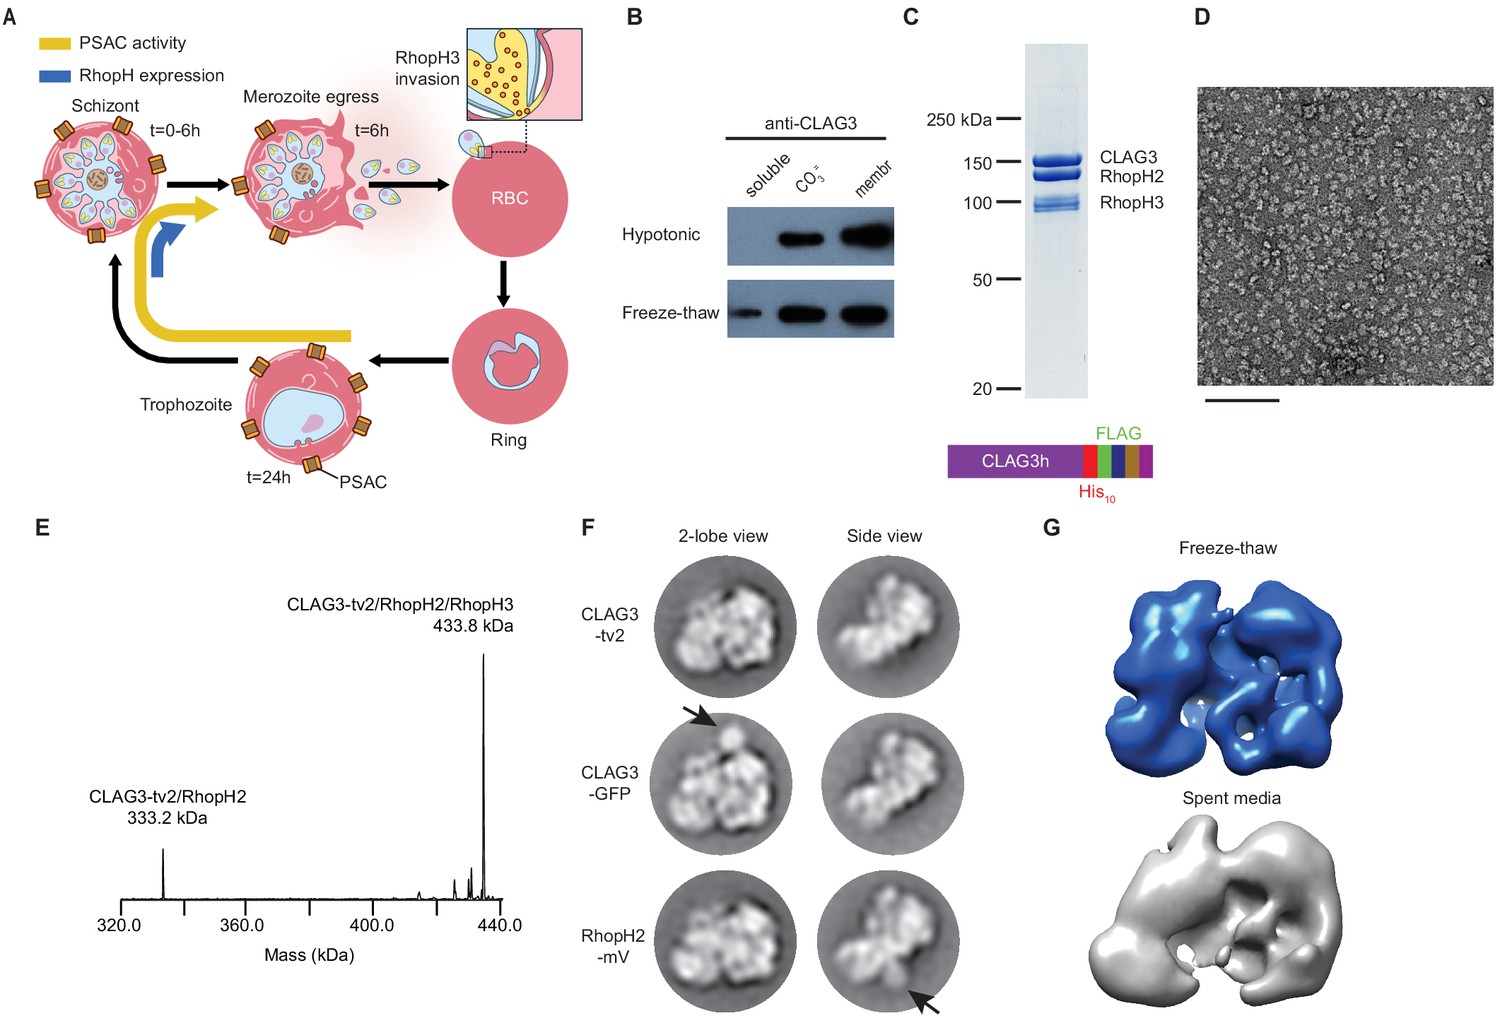
A stable, soluble RhopH complex with a 1:1:1 subunit stoichiometry in schizont-infected erythrocytes.
(A) Schematic showing RhopH complex synthesis in schizonts (t = 0–6 hr), role of RhopH3 in erythrocyte invasion (t = 6 hr), and contribution to plasmodial surface anion channel (PSAC)-mediated nutrient uptake at the host membrane (t = 24–44 hr). (B) Immunoblot showing that hypotonic lysis does not release CLAG3, but that alkaline carbonate treatment (CO3=) and freeze–thaw release distinct pools from membranes (membr). (C) Coomassie-stained gel of three RhopH proteins recovered by coimmunoprecipitation after freeze–thaw release. Ribbon at bottom, C-terminal multi-tag strategy used for purification of CLAG3-tv2. (D) Negative staining electron microscope image of purified RhopH complexes; scale bar, 100 nm. (E) Deconvolved native mass spectrometry (MS) spectrum for endogenous RhopH complexes. (F) Negative stain 2D class averages without (top) or with C-terminal tagging with green fluorescent protein (GFP) variants (CLAG3-GFP or RhopH2-mVenus, respectively). GFP-variant density is denoted by black arrows. (G) Negative stain 3D reconstructions using freeze–thaw preparation or harvest from spent media without freeze–thaw. Note similar architectures.
Figure 1—figure supplement 1
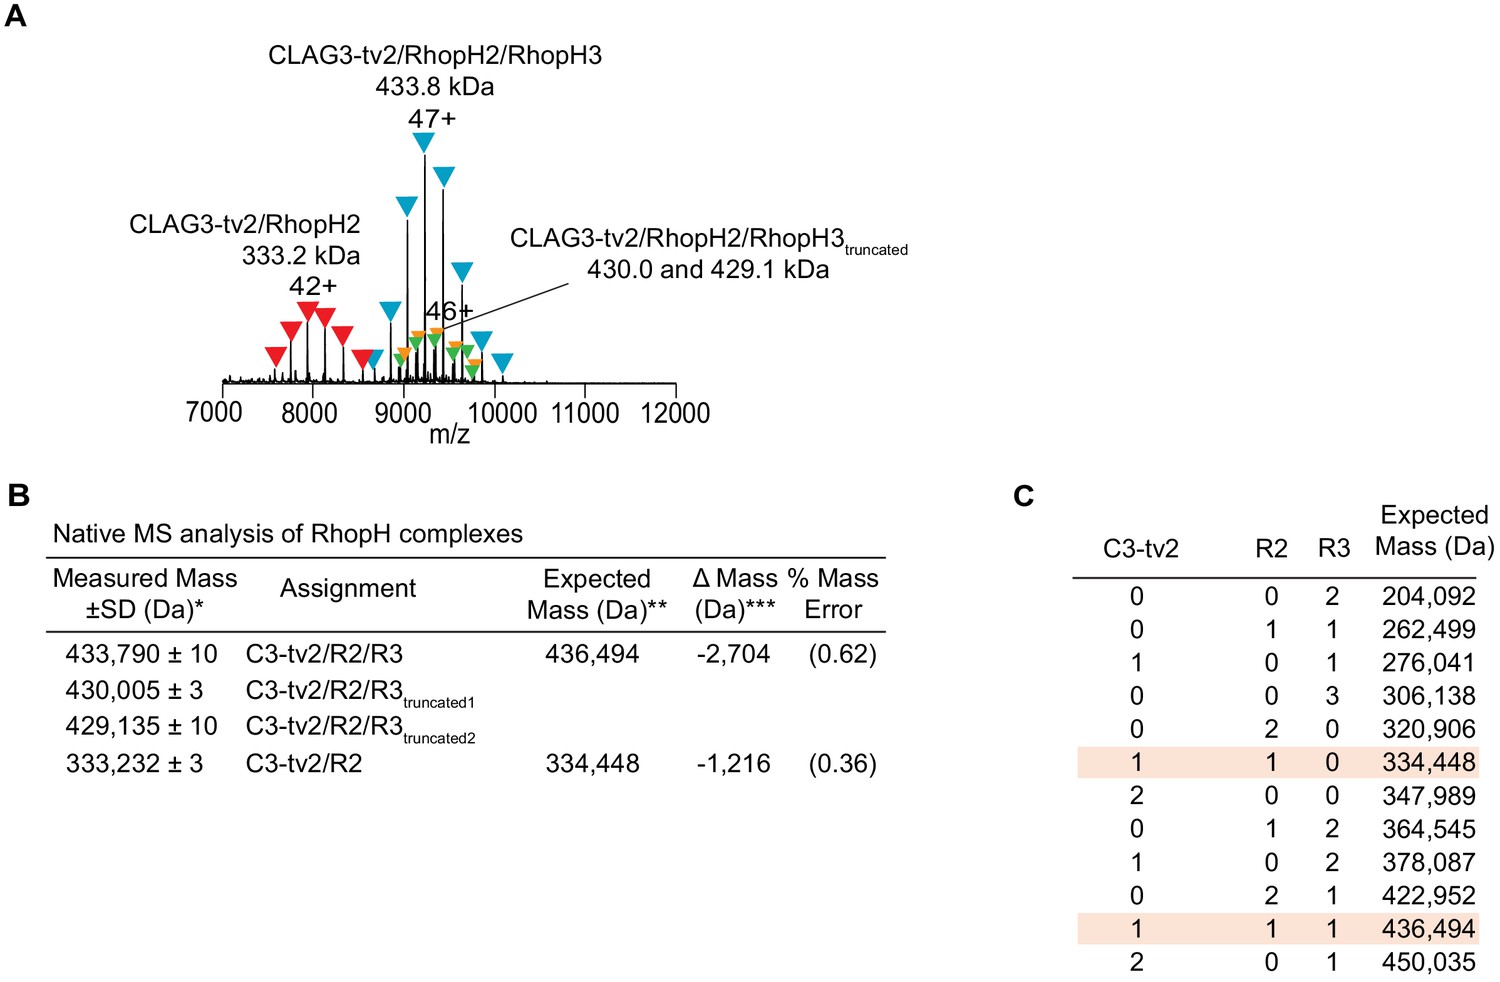
Native mass spectrometry (MS) analysis of the endogenous RhopH complex immunoprecipitated via CLAG3-tv2.
(A) Raw and deconvolved MS spectra of RhopH complex purified from schizont-infected cells. Peak series assignments for intact CLAG3-tv2/RhopH2/RhopH3 complex and a CLAG3-tv2/RhopH2 subcomplex are indicated. The highest charge state for each peak series is noted. Additional peak series at 430.0 kDa and 429.1 kDa were observed at lower intensities (10–15% relative peak signals); these smaller heterotrimeric forms may reflect RhopH3 proteolytic processing (Doury et al., 1994) or low-level degradation. (B) Table of experimental masses obtained from native MS analysis. *Estimated from mean ± standard deviation of measured masses across the charge-state distribution (n ≥ 4). **The expected masses for each subunit calculated from subunit primary sequences with predicted N-terminal signal peptides removed, as indicated in parenthesis: CLAG3-tv2 (C3-tv2, 1–24), 173,995 Da; RhopH2 (R2, 1–19), 160,453 Da; RhopH3 (R3, 1–24), 102,046 Da. ***Lower than expected measured masses may reflect incomplete mapping of subunit N-termini after signal-peptide processing or C-terminal proteolytic processing. (C) Derivation of expected masses for various stoichiometries of the three component proteins, with best matches to the measured masses highlighted.
Figure 1—figure supplement 2
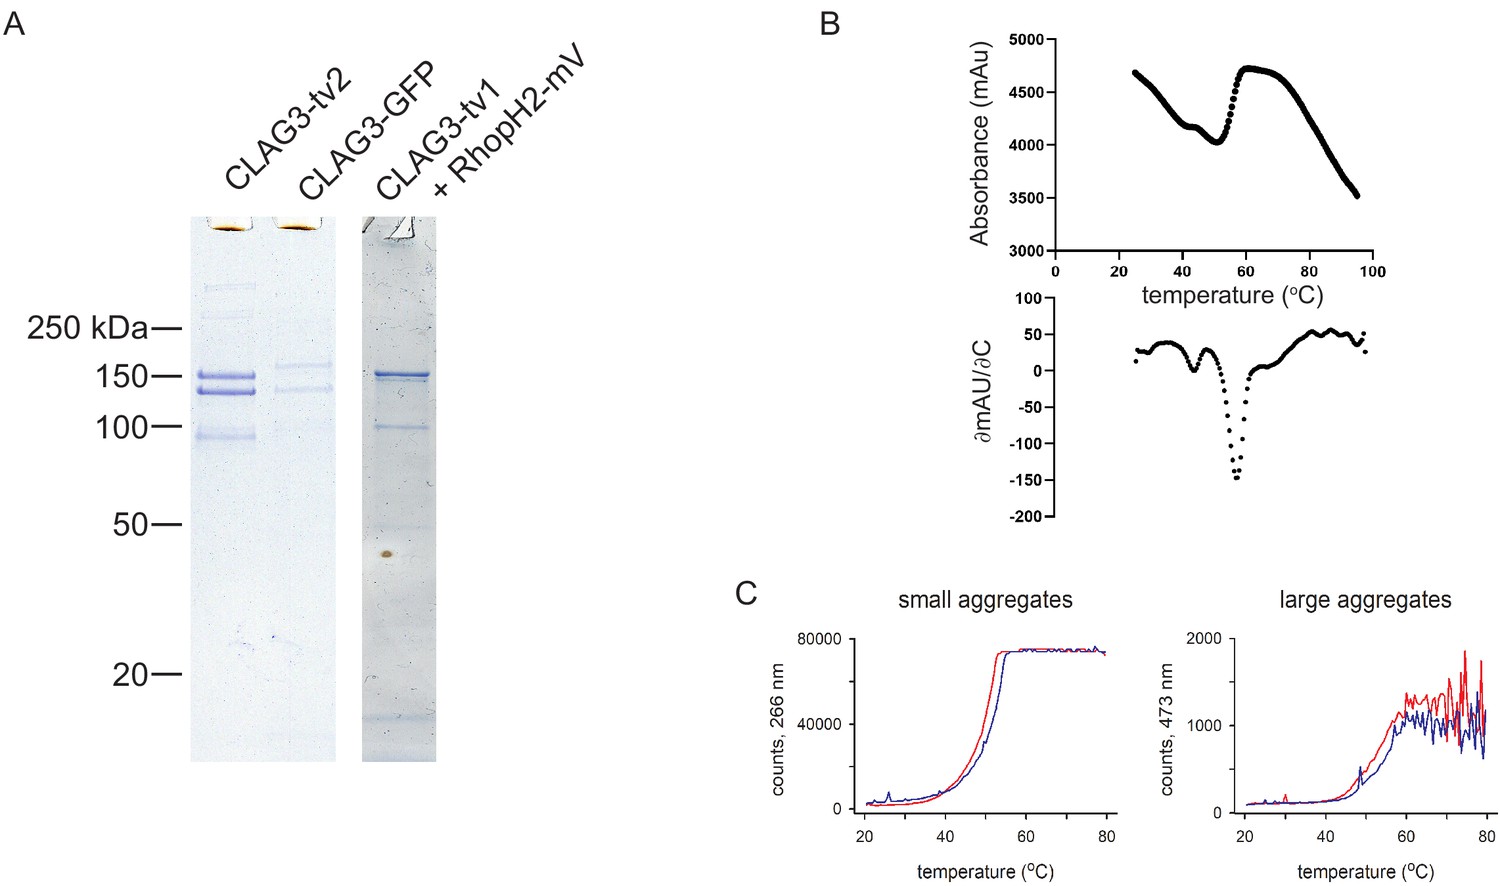
Subunit modifications and thermostability of the RhopH complex.
(A) Coomassie-stained gels showing recovery of three RhopH subunits after coimmunoprecipitation from schizont-infected cells using a tagged CLAG3 as the bait. CLAG3 and RhopH2 exhibit expected mobility shifts when tagged. Modified constructs are described in Materials and methods. (B) Thermal unfolding of purified RhopH complex. Top, relative fluorescence intensity associated with protein denaturation during indicated temperature ramp. Bottom, first-derivative plot, showing denaturation at >55°C. (C) Scattering intensities at 266 nm and 473 nm, indicative of small and large aggregate formation, during thermal ramp application. Red and blue traces reflect independent samples.
Figure 2 with 5 supplements
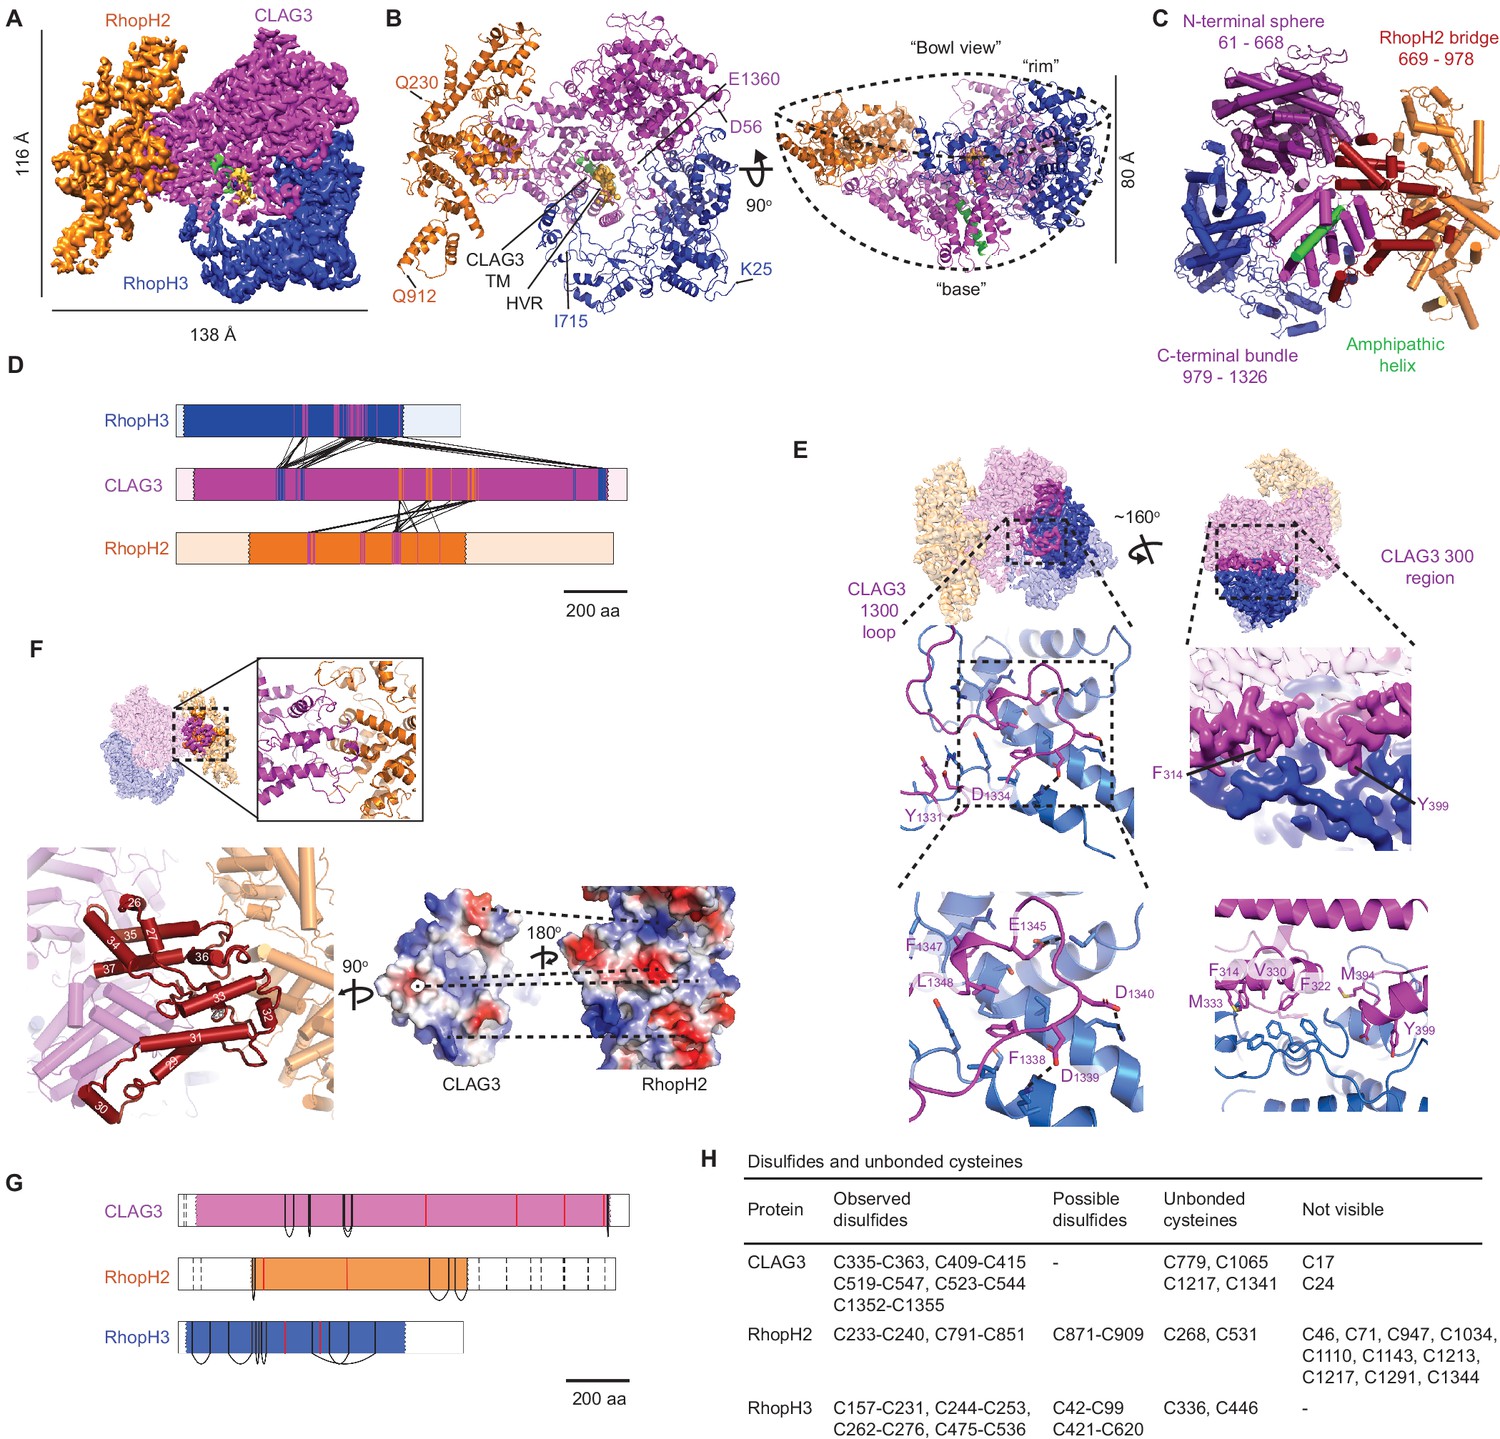
High-resolution structure of the soluble RhopH complex and stabilizing interactions.
(A) Side view of the cryo-electron microscopy (cryo-EM) reconstruction with CLAG3, RhopH2, and RhopH3 color scheme maintained in all figures that show the structure. (B) Side and 90o-turned bowl ribbon diagrams of the RhopH complex. Buildable N- and C-terminal residues of each subunit are labeled. In (A) and (B), the CLAG3 HVR and single validated transmembrane α-helix are colored yellow and green, respectively. (C) CLAG3 domain architecture, with residues numbered from N-terminus. (D) Ribbon schematic illustrating pairwise interactions between subunits. The visualized N- and C-termini of each subunit are indicated by ribbon color change. (E) CLAG3–RhopH3 binding interface, as determined by the CLAG3 1300 loop and 300 regions, shown from separate angles. Enlarged views at bottom show critical CLAG3 residues involved in hydrophobic and charge–charge interactions. (F) The CLAG3–RhopH2 binding interface from different views. Enlarged image at bottom left shows CLAG3 α-helices that define the RhopH2 bridge, with helix numbering from one at the protein N-terminus. Right, Space-filling view of the CLAG3–RhopH2 surfaces at their binding interface. The proteins are separated from one another and rotated to expose the binding surfaces; blue and red shading reflect positive and negative electrostatic potential, respectively. Complementary surface potentials on these surfaces form salt bridges and contribute to tight interactions. (G) Ribbon schematic showing positions of cysteines that form intramolecular disulfides (black), unbonded cysteines (red), and cysteines that were not visualized (dashed black lines). Intermolecular disulfides were not observed. (H) Tabulated list of disulfides and unbonded cysteines.
Figure 2—figure supplement 1

Cryo-electron microscopy (cryo-EM) data processing scheme.
(A) A raw representative cryo-EM micrograph showing RhopH complexes; scale bar, 100 nm. (B) Example 2D classes generated from 214,233 particles. (C) Flow chart of data processing procedures. An initial model was used for 3D classification, resulting in one well-resolved class (class 3). Initial refinement yielded a map with a poorly resolved small lobe; particle polishing and CTF refinement improved resolution to 2.92 Å. Multibody refinement with indicated masks permitted more complete reconstruction of the small lobe.
Figure 2—figure supplement 2
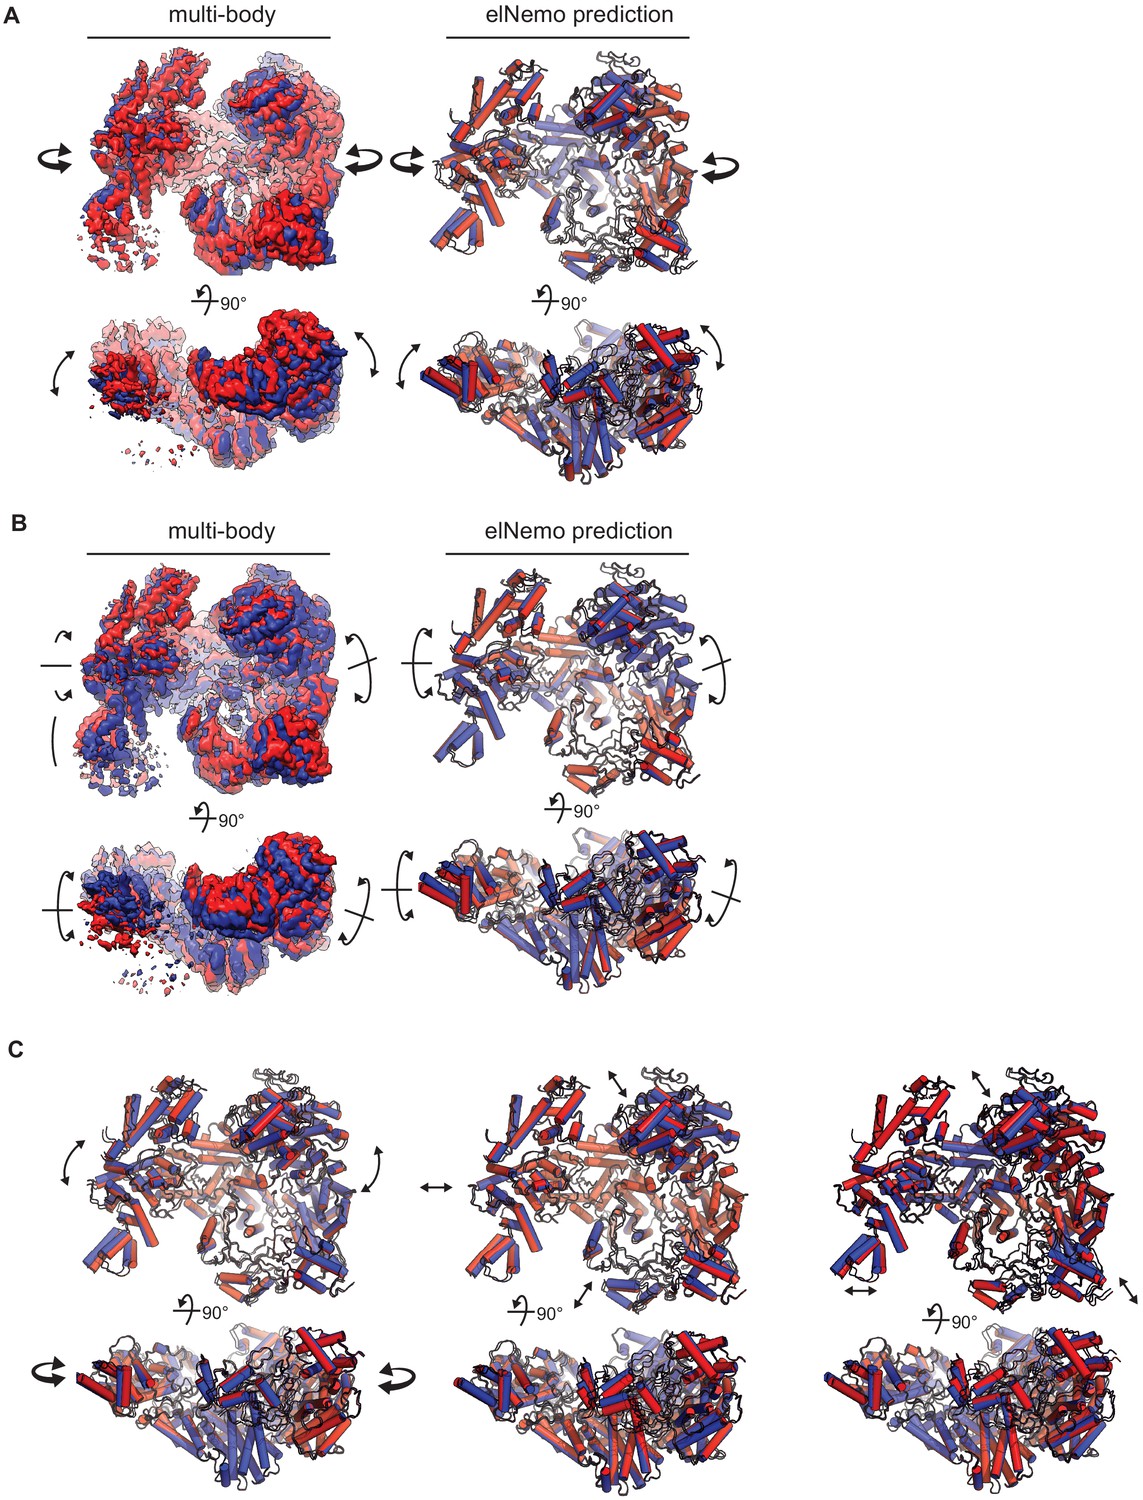
Observed and predicted movements of the RhopH complex.
(A) First (inward) component of motion derived from multibody analysis and corresponding first normal mode elNémo prediction; 90o rotated views are shown below each model. Arrows indicate direction of movement. (B) Second (torsional) component of motion. (C) Third, fourth, and fifth normal modes of motion predicted by elNémo, left to right, respectively. The third mode predicts tilting of the two lobes, while the others predict a slight expansion and contraction of the RhopH complex about its center.
Figure 2—figure supplement 3
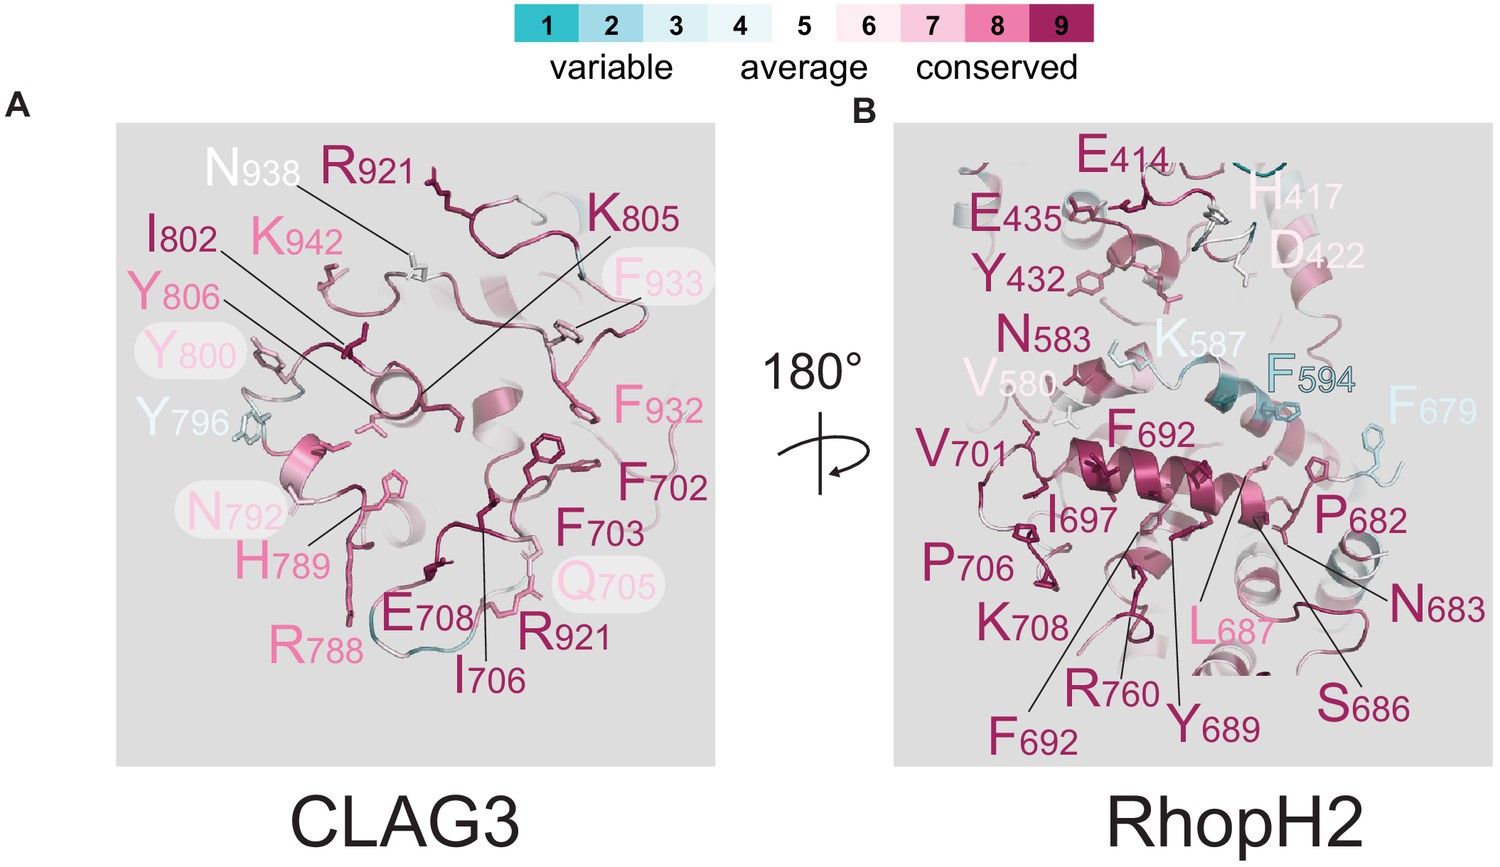
Multiple residues involved in CLAG3–RhopH2 binding.
Ribbon diagrams of the exposed surfaces of CLAG3 and RhopH2 at their binding interface (A and B, respectively). Conserved residues are indicated using Consurf color coding; scale bar at top.
Figure 2—figure supplement 4
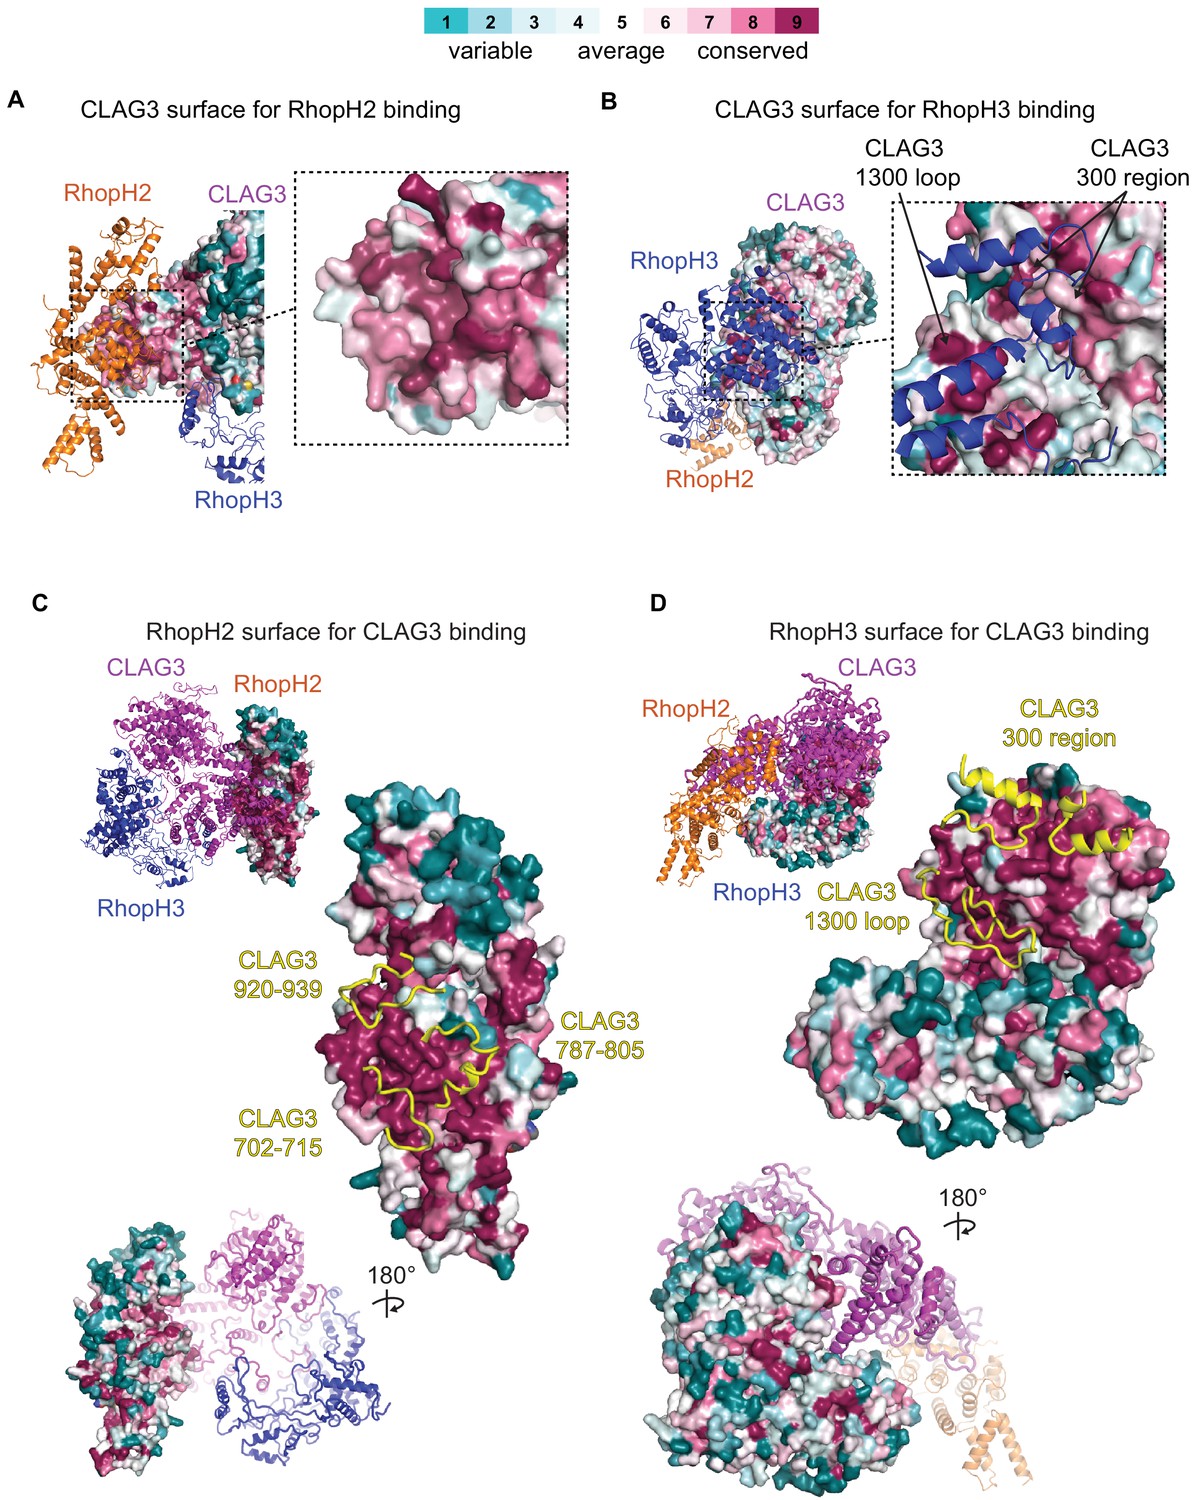
Conservation of amino acids at subunit interfaces.
Surface representations of RhopH subunit binding sites, showing sequence conservation at the RhopH2 and RhopH3 binding sites on CLAG3 (A and B, respectively) and at the CLAG3 binding sites on RhopH2 and RhopH3 (C and D). Consurf color scale bar at top for all panels.
Figure 2—figure supplement 5
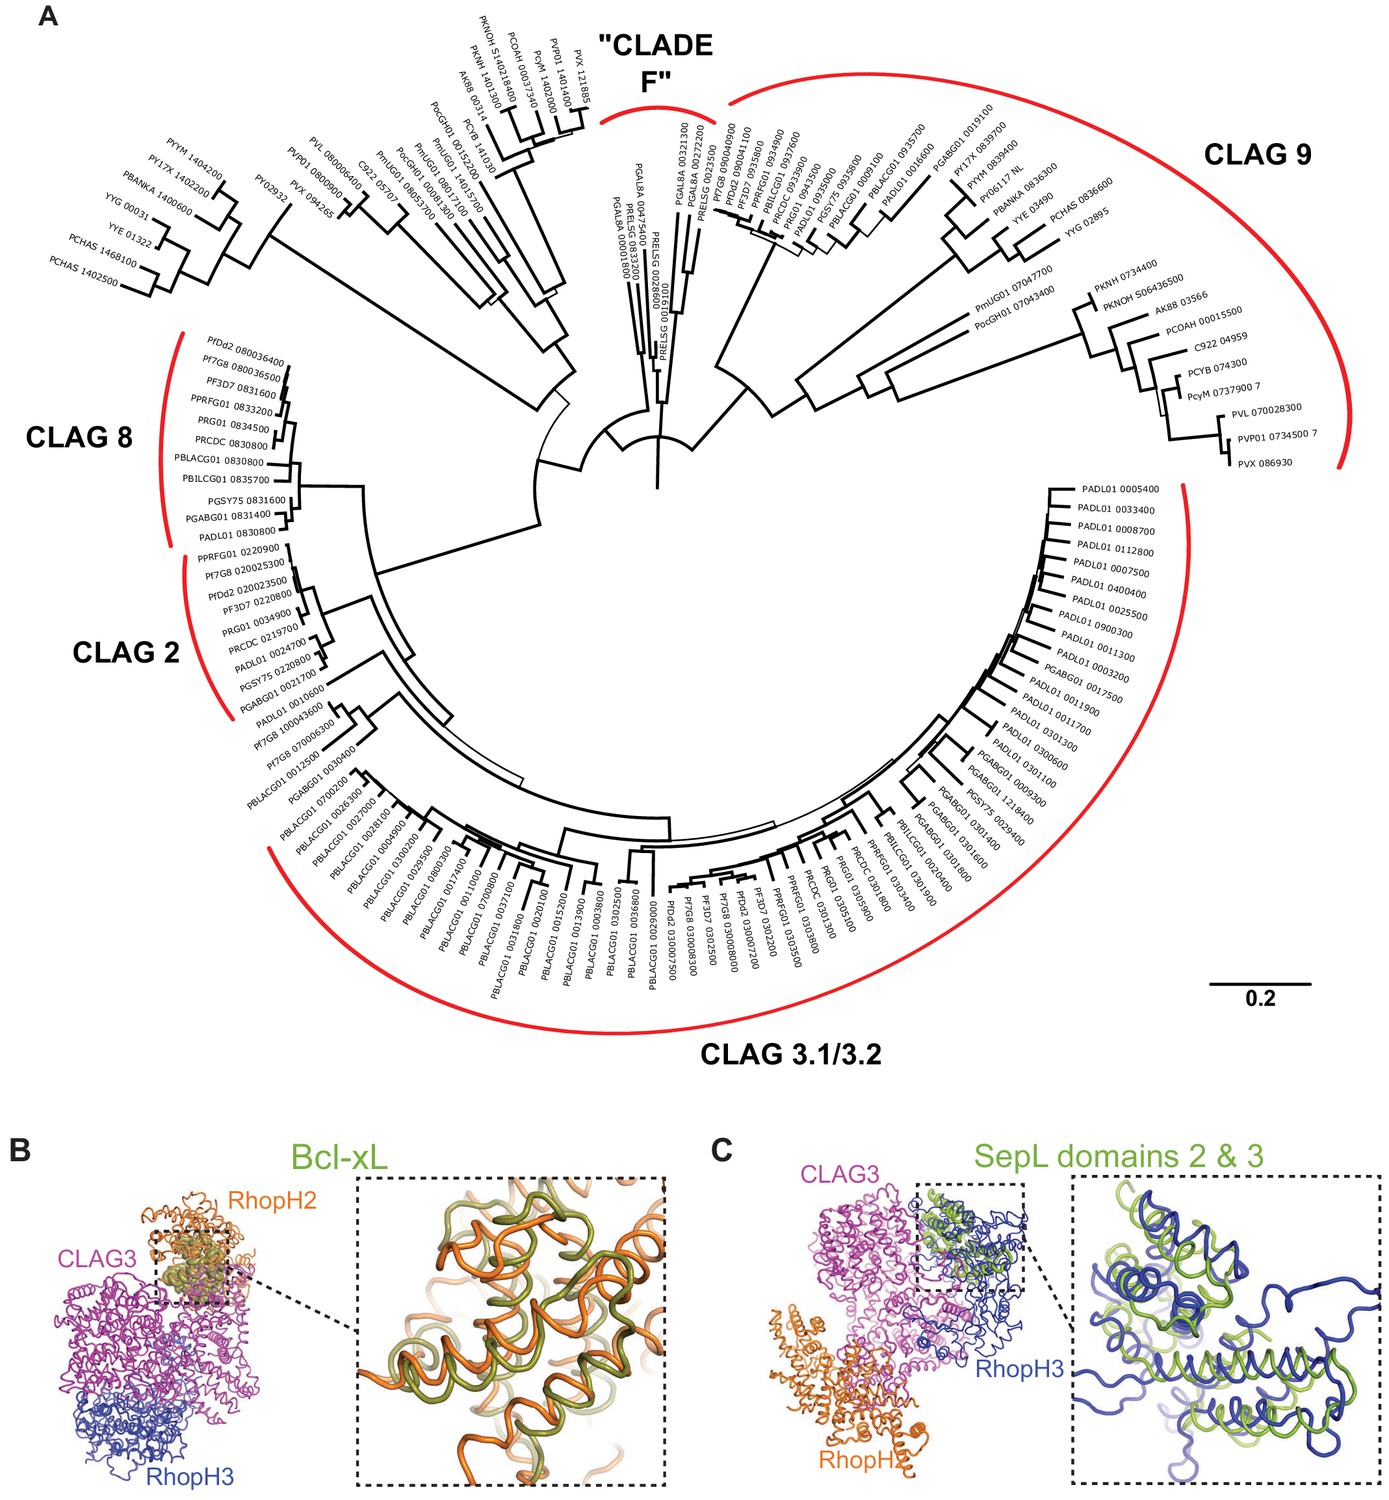
Neighbor-joining tree and structural similarities.
(A) Major CLAG paralog clades are indicated by labeled red arcs. The ‘Clade F’ label represents the Plasmodium taxonomy proposed by Galen et al., 2018 and does not reflect the precise structure of our phylogeny tree. Bootstrap support is indicated by branch width, with thin branches have less than 70% support. (B) Three-dimensional alignment of Bcl-xL to RhopH2, as identified through an exhaustive Protein Data Bank (PDB) search using the Dali Server. Expanded view shows the aligned region. Z score, 4.2; root-mean-square deviation (RMSD), 3.4 Å; number of residues aligned, 95. (C) Three-dimensional alignment of SepL to RhopH3, based on a similar PDB search. Z score, 6.0; RMSD, 3.6 Å; number of residues aligned, 115.
Figure 3 with 1 supplement
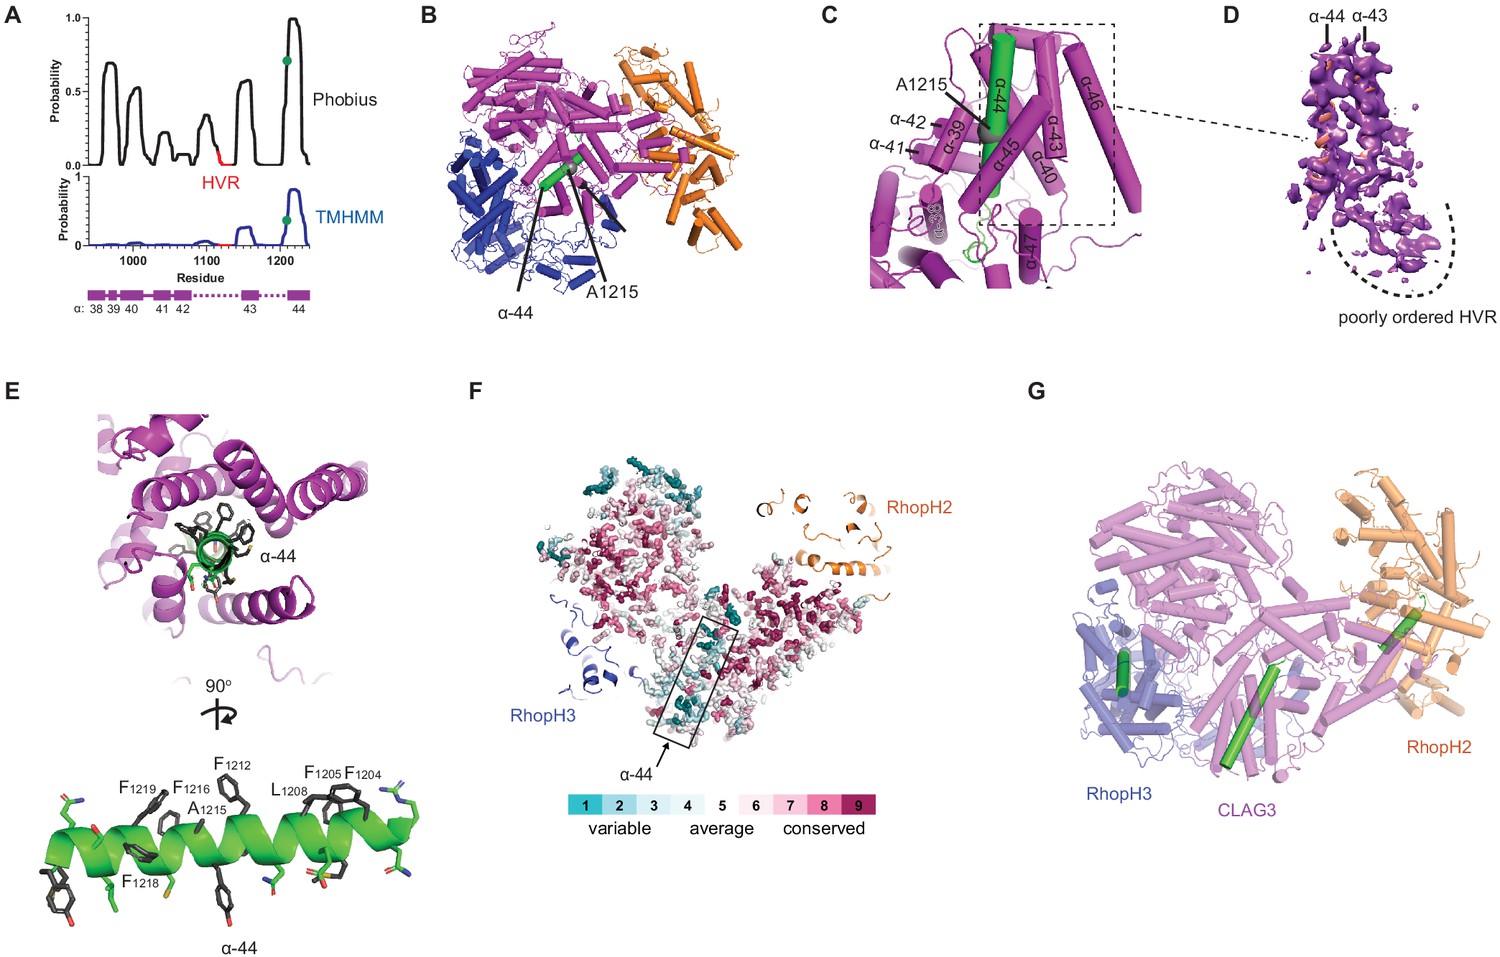
A CLAG3 transmembrane helix is buried in the soluble complex.
(A) Posterior probability plots for transmembrane (TM) domain prediction, determined for residues 940–1240 of CLAG3 using indicated algorithms. Green circle on the plots’ single confidently predicted TM (α-helix 44) represents A1215; HVR, hypervariable region. (B) Cylinder view of RhopH complex map showing the buried α-helix 44 (green). (C) Enlarged and turned view from (B). Additional helices that may interact with membranes are labeled. (D) Corresponding cryo-electron microscopy (cryo-EM) density and an adjacent poorly ordered HVR. (E) Top and side views of CLAG3 α-44. Note that hydrophobic side chains cluster on the upper helix surface in these views; polar residues are at the opposite surface and may line the eventual pore. (F) Slice-through view showing a thin interior section of the RhopH complex. CLAG3 is shown as sticks and colored by Consurf conservation score for each residue. Note that α-44 exhibits higher sequence variation than neighboring domains. (G) Cylinder view with known and predicted TM helices in green; these helices are buried and physically separated from one another.
Figure 3—figure supplement 1
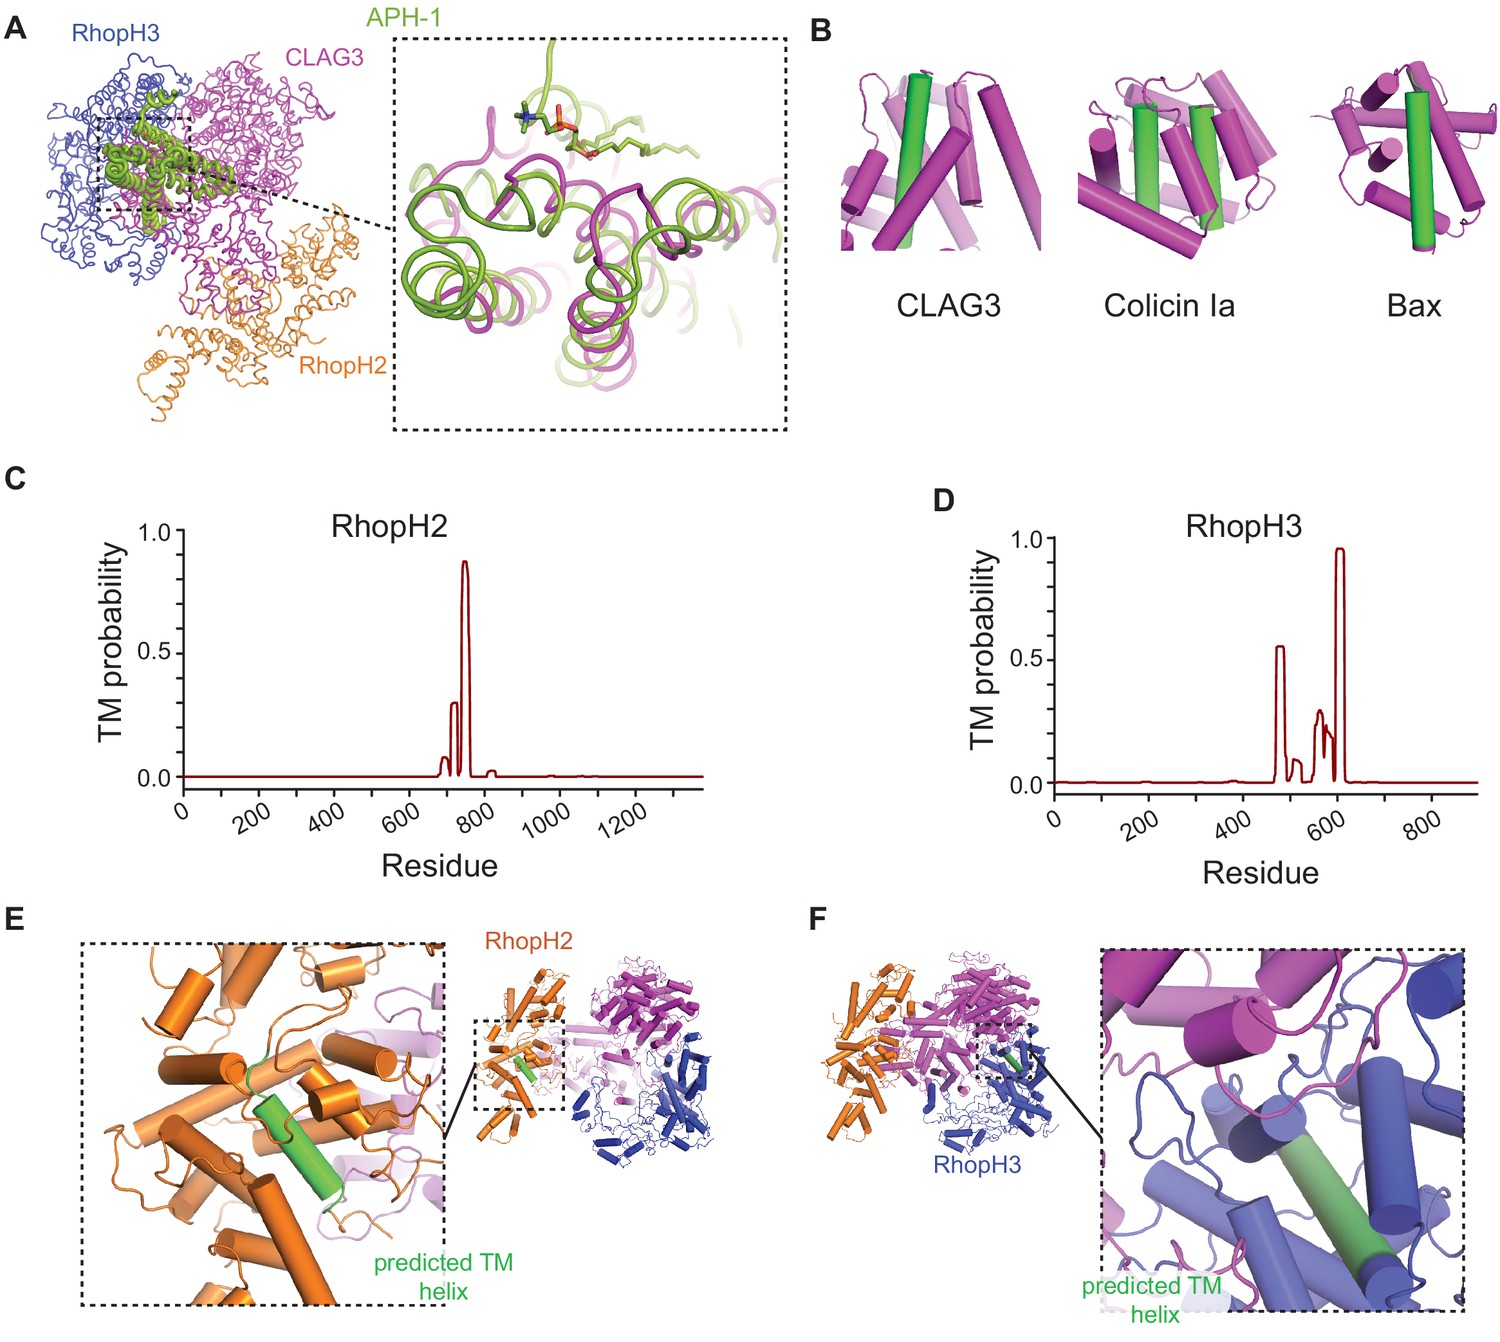
Predicted transmembrane (TM) domains are buried in the soluble RhopH complex.
(A) Structural alignment of CLAG3 to APH-1, an integral membrane component of human γ-secretase, as identified through an exhaustive PDB search. The aligned region includes α-helices 39, 40, 43, and 44 of CLAG3; a phospholipid molecule is seen in stable association with a corresponding α-helix in APH-1. Dali Z score, 4.5; RMSD, 4.3 Å; number of residues aligned, 116. (B) Cylinder view diagrams of CLAG3 and two unrelated ‘two-state’ proteins—colicin Ia and Bax. In their soluble states, each protein buries its hydrophobic TM helices within the structure for stability (green cylinders); these helices later become exposed to allow membrane insertion. (C and D) Posterior probability plots for TM domain prediction for RhopH2 and RhopH3 based on the Phobius algorithm (Käll et al., 2004). Each protein has a single confidently predicted TM that corresponds to an α-helix in our structure. (E and F) Cylinder view representations of RhopH2 and RhopH3, showing that predicted TM helices are shielded.
Figure 4
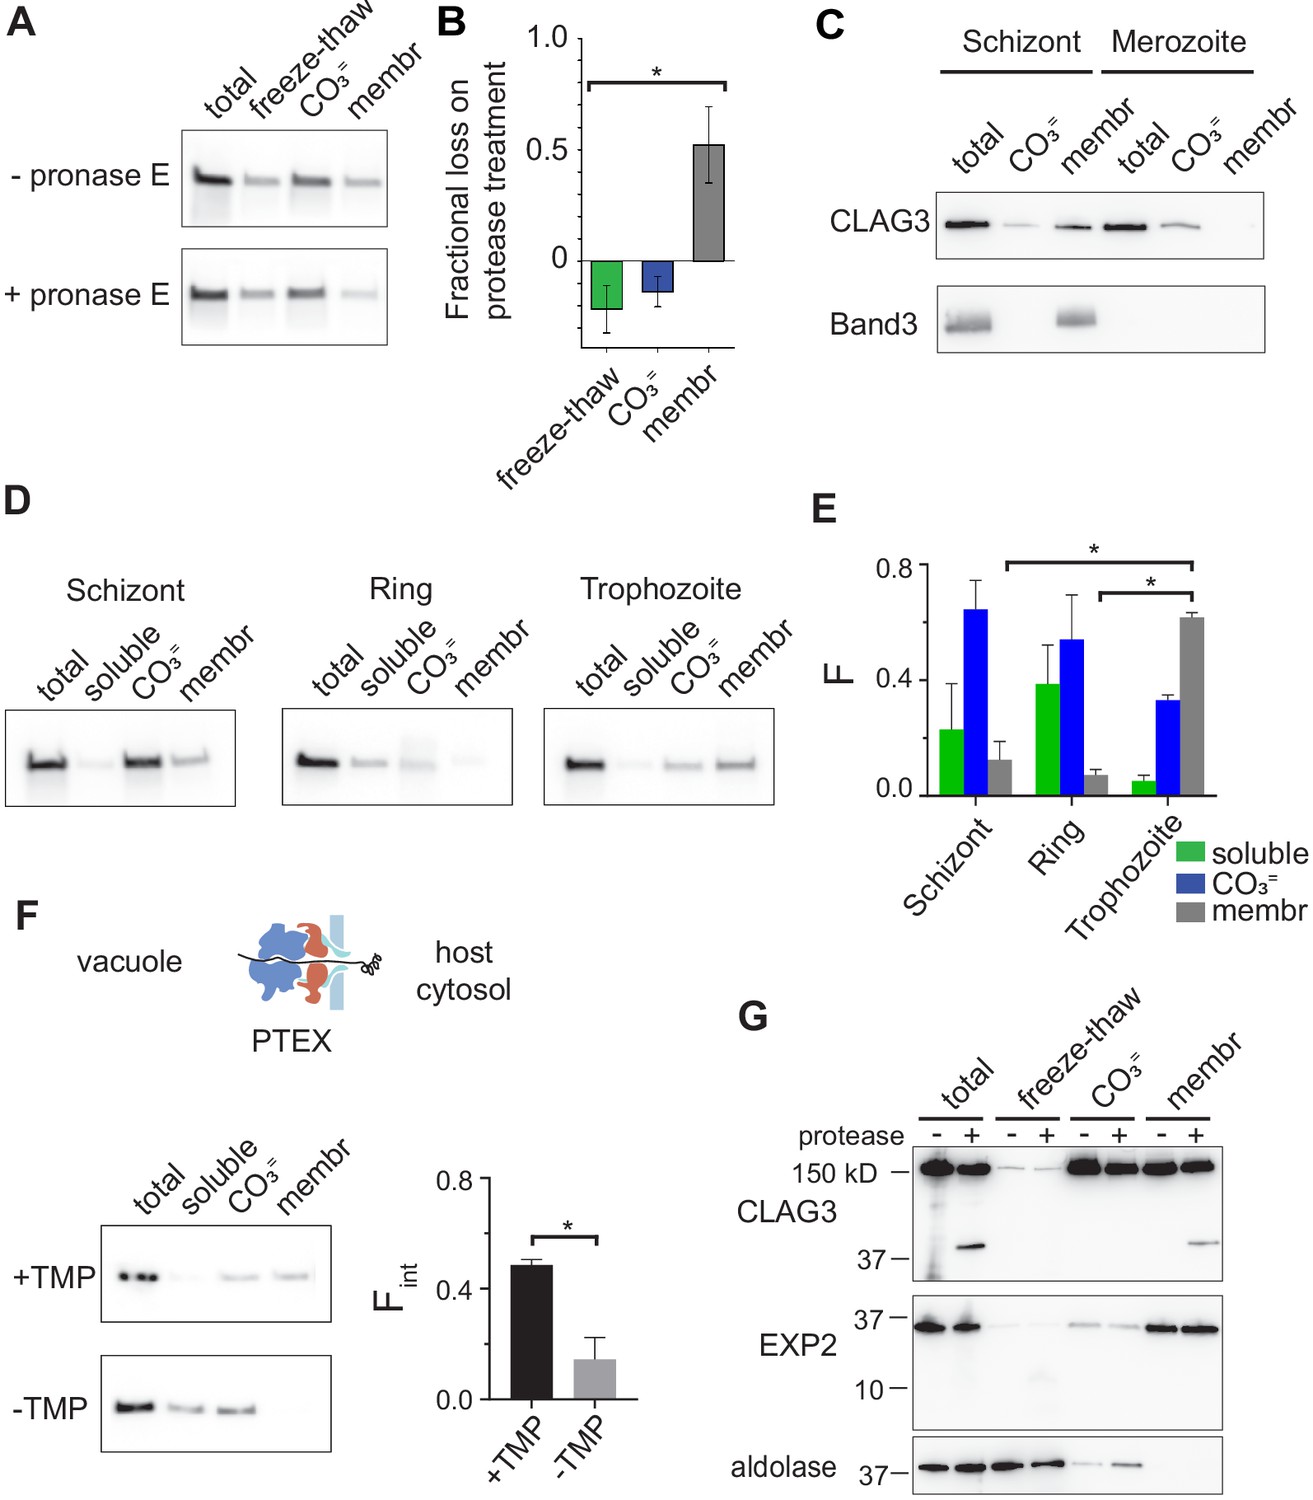
RhopH is produced as a soluble complex and requires interaction with the PTEX translocon for membrane insertion.
(A) Immunoblot showing that pretreatment of mature schizont-infected cells with pronase E, a broad specificity protease, reduces CLAG3 in the membrane fraction (membr) without affecting freeze–thaw released or Na2CO3-extractable (CO3=) pools. (B) Mean ± S.E.M. fractional reduction of indicated CLAG3 pools upon pronase E treatment, determined from changes in band intensities from matched immunoblots as in (A). *p = 0.01, n = 3. (C) Immunoblots showing membrane fractionation of CLAG3 and Band3, a host membrane marker, in purified merozoites and their schizont-infected progenitor cells. Representative of two independent trials. (D) Similar fractionation studies at indicated stages throughout the P. falciparum bloodstream cycle. While schizont- and trophozoite-infected cells were enriched by the percoll–sorbitol method, ring-infected cells cannot be similarly enriched, presumably accounting for CLAG3 detection in the soluble lane and non-additive fractionation in rings. (E) Mean ± S.E.M. band intensities from three independent trials as in (D). *p < 0.005. (F) Schematic shows PTEX-mediated protein translocation and refolding in host erythrocyte cytosol. Middle, Anti-CLAG3 immunoblots from 13F10 cellular fractions with and without trimethoprim (TMP) (top and bottom blots, respectively). Bar graph shows mean ± S.E.M. fraction of integral membrane CLAG3 (Fint), determined from band intensities. *p < 0.015; n = 3. (G) CLAG3-tv2 fractionation studies using enriched mature infected cells. Top, Anti-HA blot showing that soluble CLAG3 (freeze–thaw and CO3 = lanes) is not susceptible to extracellular protease, but the integral pool (membr) is. The ~40 kDa cleavage product remains membrane embedded. EXP2, an intracellular parasite membrane protein, is primarily integral and is protease insensitive. Aldolase, a parasite cytosolic protein, is quantitatively released by freeze–thaw and carbonate treatment. Representative of more than three trials.
Figure 5
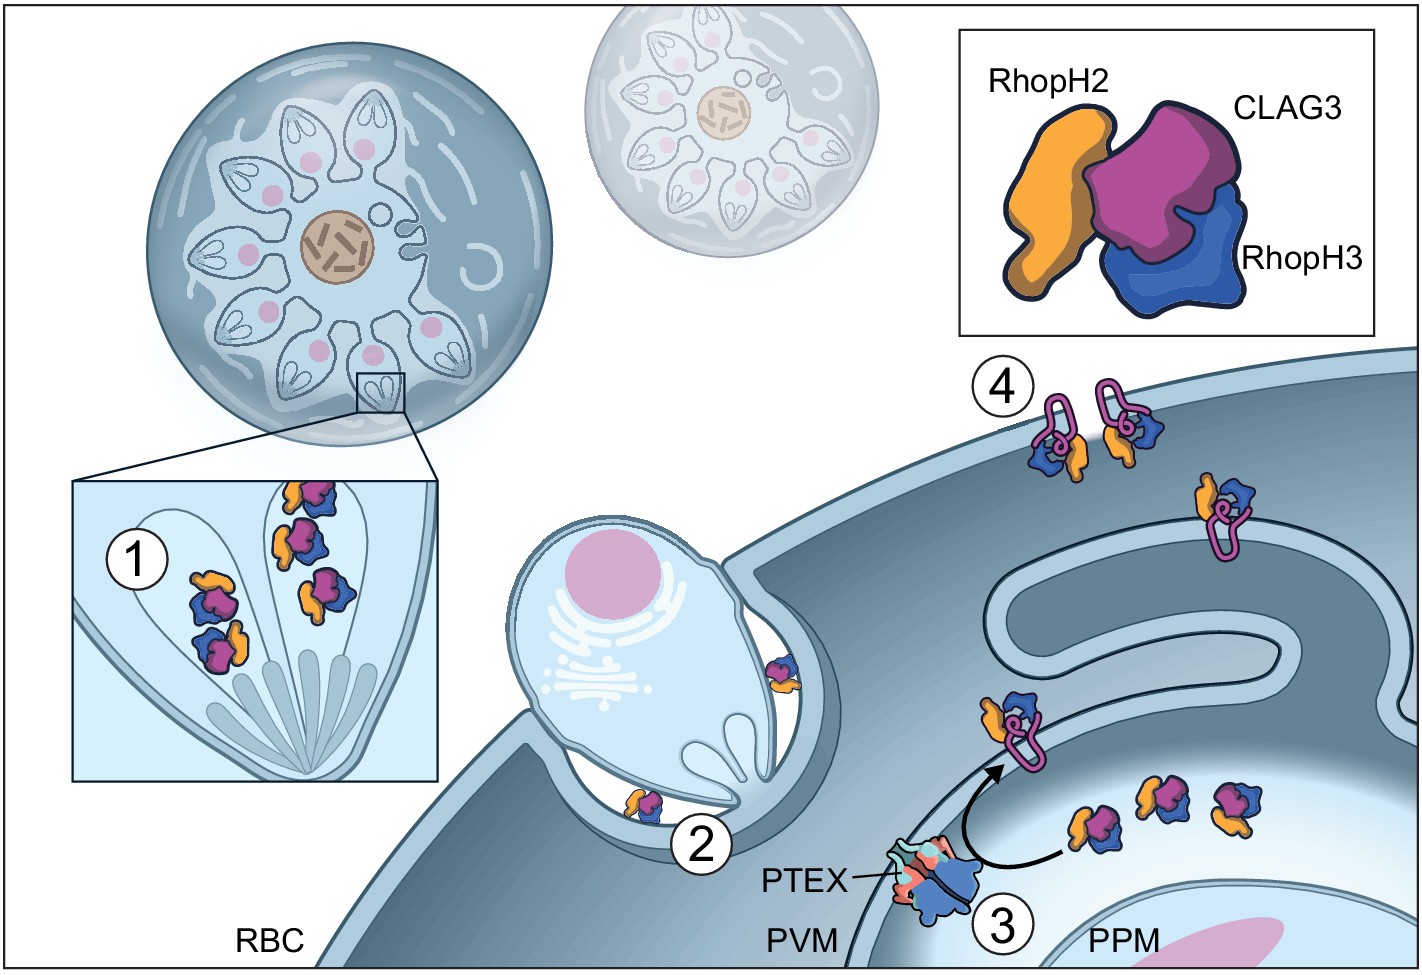
Model of RhopH synthesis and trafficking.
The complex is produced in a soluble form and packaged into rhoptries (1) before transfer via extracellular merozoites to the nascent parasitophorous vacuole of a new host erythrocyte (2). The rhoptry may also contribute lipids to the nascent parasitophorous vacuole (Dluzewski et al., 1995). The soluble RhopH complex then crosses the PVM and undergoes membrane insertion via a PTEX-dependent mechanism (3). Finally, it is deposited on the host membrane with a small variant region on CLAG3 exposed to plasma, enabling channel-mediated nutrient uptake (4).
Videos
Video 1
First (inward) component of motion derived from multibody analysis.
Video 2
Second (torsional) component of motion derived from multi-body analysis.
Video 3
First structural movement predicted by elNémo normal mode analysis.
Video 4
Second structural movement predicted by elNémo normal mode analysis.
Video 5
Third structural movement predicted by elNémo normal mode analysis.
Video 6
Fourth structural movement predicted by elNémo normal mode analysis.
Video 7
Fifth structural movement predicted by elNémo normal mode analysis.
Tables
Table 1
Cryo-electron microscopy (cryo-EM) data collection, refinement, and validation statistics.
| Freeze–thaw non-inserted (EMDB-22890) (PDB 7KIY) | |
|---|---|
| Data collection and processing | |
| Microscope Camera Calibrated magnification | Titan Krios K2 Summit 59,500 |
| Voltage (kV) Exposure time Frame/total (s) Number of frames per image | 300 23.2 2.5 frames/s 58 |
| Electron exposure (e−/Å2) | 69.6 |
| Defocus range (μm) | 0.5–3.5 |
| Pixel size (Å) Box size (pixels) | 0.82 400 |
| Symmetry imposed | C1 |
| Initial particle images (no.) | 311,390 |
| Final particle images (no.) | 68,216 |
| Map resolution (Å) FSC threshold | 2.92 0.143 |
| Map resolution range (Å) | 2.89–12.10 |
| Refinement | |
| Initial model used (PDB code) | na |
| Model resolution (Å) | 3.06 |
| Model resolution range (Å) | 2.9–12.10 |
| Map sharpening B factor (Å2) | −34 |
| Model composition Nonhydrogen atoms Protein residues Ligands | 19,943 2388 0 |
| B factors (Å2) Protein Ligand | 43.95 Na |
| R.m.s. deviations Bond lengths (Å) Bond angles (°) | 0.012 1.33 |
| Validation MolProbity score Clashscore Poor rotamers (%) | 2.51 13.52 1.42 |
| Ramachandran plot Favored (%) Allowed (%) Disallowed (%) | 78.25 19.38 2.36 |
Key resources table
| Reagent type (species) or resource | Designation | Source or reference | Identifiers | Additional information |
|---|---|---|---|---|
| Strain, strain background (Plasmodium falciparum) | KC5 | • 10.1128/mBio.02293–17 | Wt control | |
| Cell line (Plasmodium falciparum) | CLAG3-tv2 | This paper | C-terminal His10-FLAG-thrombin-TEV-HA-twinstrept-BC2 tag | |
| Cell line (Plasmodium falciparum) | CLAG3-GFP | This paper | C-terminal His8-mGFP-FLAG-Twin Strep tag | |
| Cell line (Plasmodium falciparum) | CLAG3-tv1 | This paper | C-terminal 3xFLAG-3xHA-His8-Strept II tag | |
| Cell line (Plasmodium falciparum) | CLAG3-tv1+RhopH2-mV | This paper | CLAG3-tv1 with tandem RhopH2 C-terminal mVenus tag | |
| Cell line (Plasmodium falciparum) | 13F10 | • 10.1038/nature13574 | TMP-dependent HSP101 conditional knockdown | |
| Antibody | Anti-CLAG3 (mouse polyclonal) | • 10.7554/eLife.23485 | (1:1000) | |
| Sequence-based reagent | CLAG3 sgRNA | This paper | For CRISPR editing | 5′-TAAAAACACTAATAAGACCA-3′ |
| Recombinant DNA reagent | pUF1-Cas9 | • 10.1038/nbt.2925 | Cas9 expression | |
| Recombinant DNA reagent | pL6 | • 10.1038/nbt.2925 | sgRNA expression and homology cassette | |
| Recombinant DNA reagent | pL7- CLAG3-tv2 | This study | Modification of pL6 for parasite transfection | |
| Recombinant DNA reagent | pL7-CLAG3-GFP | This study | Modification of pL6 for parasite transfection | |
| Recombinant DNA reagent | pL7-CLAG3-tv1 | This study | Modification of pL6 for parasite transfection | |
| Chemical compound, drug | DSM1 | BEI Resources Repository | Cat# MRA-1161 | |
| Chemical compound, drug | WR99210 | David Jacobus | ||
| Commercial assay or kit | Anti-FLAG M2 affinity agarose resin | Sigma–Aldrich | Cat# A2220 | |
| Commercial assay or kit | 3xFLAG peptide | Sigma–Aldrich | Cat# F4799 | |
| Commercial assay or kit | Ni-NTA Agarose resin | Qiagen | Cat# 30210 | |
| Commercial assay or kit | Zeba microspin desalting columns, 40 kDa MWCO | Thermo Scientific | Cat# 87764 | |
| Other | Gold-coated quartz emitter | This study | Native mass MS study | |
| Commercial assay or kit | SYPRO Orange | Thermo Scientific | Cat# S6650 | Protein stability assay (1:5000) |
| Other | Carbon film grids | Electron Microscopy Sciences | Cat# CF200-Cu | |
| Other | Quantifoil Cu 300 mesh grids | Electron Microscopy Sciences | Cat# Q3310CR1.3 | |
| Other | 4–15% Mini-PROTEAN TGX gel | Bio-RAD | Cat# 4561086 | |
| Software, algorithm | Thermo Xcalibur Qual Browser | Thermo Scientific | versions 3.0.63 and 4.2.47 | |
| Software, algorithm | UniDec | • 10.1021/acs.analchem.5b00140; • 10.1007/s13361-018-1951-9 | versions 3.2 and 4.1 | http://unidec.chem.ox.ac.uk/ |
| Software, algorithm | m/z | Proteometrics LLC | ||
| Software, algorithm | EPU | ThermoFischer | ||
| Software, algorithm | Latitude | Gatan Inc | ||
| Software, algorithm | RELION 2.0; RELION 3.0 | • 10.1016/j.jsb.2012.09.006 | https://www3.mrc-lmb.cam.ac.uk/relion | |
| Software, algorithm | MotionCor2 | • 10.1038/nmeth.4193 | https://emcore.ucsf.edu/ucsf-software | |
| Software, algorithm | Gctf | • 10.1016/j.jsb.2015.11.003 | https://www2.mrc-lmb.cam.ac.uk/research/locally-developed-software/zhang-software/ | |
| Software, algorithm | UCSF Chimera | • 10.1002/jcc.20084 | https://www.cgl.ucsf.edu/chimera/ | |
| Software, algorithm | Coot | • 10.1107/S0907444910007493 | https://www2.mrc-lmb.cam.ac.uk/personal/pemsley/coot/ | |
| Software, algorithm | PHENIX assign_sequence | • 10.1107/S2059798319011471 | https://www.phenix-online.org/ | |
| Software, algorithm | PHENIX real space refine | • 10.1107/S2059798318006551 | https://www.phenix-online.org/documentation/reference/real_space_refine.html | |
| Software, algorithm | JPred | • 10.1093/nar/gkv332 | http://www.compbio.dundee.ac.uk/jpred/ | |
| Software, algorithm | elNémo server | • 10.1093/nar/gkh368 | http://www.sciences.univ-nantes.fr/elnemo/ | |
| Software, database | PlasmoDB | • 10.1093/nar/gkn814 | https://plasmodb.org/plasmo/ | |
| Software, algorithm | MAFFT server | • 10.1093/bib/bbx108 | https://mafft.cbrc.jp/alignment/server/ | |
| Software, algorithm | MEGA X | • 10.1093/molbev/msy096;10.1093/molbev/msz312 | https://www.megasoftware.net/ | |
| Software, algorithm | ConSurf server | • 10.1093/nar/gkw408 | https://consurf.tau.ac.il/ | |
| Software, algorithm | NCBI Protein BLAST | • 10.1093/nar/25.17.3389 | https://blast.ncbi.nlm.nih.gov/Blast.cgi | |
| Software, algorithm | Clustal Omega | • 10.1093/nar/gkz268 | https://www.ebi.ac.uk/Tools/msa/clustalo/ | |
| Software, algorithm | Pymol | Schrödinger, LLC | https://pymol.org/2/ | |
| Software, algorithm | Dali server | • 10.1093/bioinformatics/btz536 | http://ekhidna2.biocenter.helsinki.fi/dali/ | |
| Software, algorithm | ImageJ | • 10.1186/s12859-017-1934-z | https://imagej.nih.gov/ij/index.html | |
| Software, algorithm | SigmaPlot 10.0 | Systat | ||
| Software, algorithm | Prism 8.2 | GraphPad |
Additional files
Download links
A two-part list of links to download the article, or parts of the article, in various formats.
Downloads (link to download the article as PDF)
Open citations (links to open the citations from this article in various online reference manager services)
Cite this article (links to download the citations from this article in formats compatible with various reference manager tools)
Malaria parasites use a soluble RhopH complex for erythrocyte invasion and an integral form for nutrient uptake
eLife 10:e65282.
https://doi.org/10.7554/eLife.65282


