Modeling hepatitis C virus kinetics during liver transplantation reveals the role of the liver in virus clearance
- The Program for Experimental & Theoretical Modeling, Division of Hepatology, Department of Medicine, Stritch School of Medicine, Loyola University Medical Center, United States
- Network Science Institute, Northeastern University, United States
- Liver Unit, Hospital Clínic, IDIBAPS and CIBEREHD, University of Barcelona, Spain
- Department of Microbiology & Immunology, University of Illinois Chicago, United States
- Institute for Biostatistics and Mathematical Modeling, Department of Medicine, Goethe Universität Frankfurt, Germany
- Vaccine and Infectious Disease Division, Fred Hutchinson Cancer Research Center, United States
- Theoretical Biology and Biophysics, Los Alamos National Laboratory, United States
- The Infectious Disease and Immunology Research Institute, Stritch School of Medicine, Loyola University Medical Center, United States
Figures
Figure 1

Virus kinetics in the serum of five hepatitis C virus (HCV)-infected patient before, during, and after liver transplantation (LT).
(a) Surgery was initiated at t = 0. The anhepatic phase is the first lighter shading and the darker shading immediately after it represents the first 4 hr post-reperfusion (RP). In all patients, virus levels decreased after graft reperfusion. A nadir was reached after a median time of 15 hr (range 9–87 hr) post-reperfusion. HCV RNA resurged within 7 days after reperfusion, with three of five cases reaching greater or comparable viral levels to those observed at baseline. For the remaining two cases, the corresponding viral loads were 0.87 and 0.43 log10 IU/mL lower than those just before surgery. HCV RNA levels in Case 5 remained in a lower plateau from 11 hr post-surgery until the end of follow-up period (slope <0.001, p = 0.76), with a corresponding viral load of 2.45 ± 0.002 log10 IU/mL. (b) A zoomed-in version of (a) focusing on the time of LT and 4 hr post-RP.
Figure 2

Visual description of the stages of the transplant procedure and modeling assumptions.
(A) Prior to the anhepatic (AH) phase viral load is at a steady state in which virus production is balanced by viral clearance (Equation 1). (B) During the AH phase, the liver is not present and therefore there is no viral production (Equation 2). However, virus may appear to be cleared by the input of fluids that dilute the virus in circulation (see F in Equation 3) and through processes of physiological clearance. (C) Up to 4 hr post-reperfusion there is no viral production as the cells in the new liver if they have been infected have not yet started releasing new virions. Clearance still occurs both via fluid balances but is predicted via a time-dependent function (see c(t) in Equation 4) that may represent a rapid clearance phase (possibly due to viral binding/entry into hepatocytes) immediately after graft reperfusion and a second/slower clearance phase (physiological). (D) Longer after reperfusion (over 4 hr), the new liver begins producing new virions (as evident in Figure 1a in Cases 1–4).
Figure 3
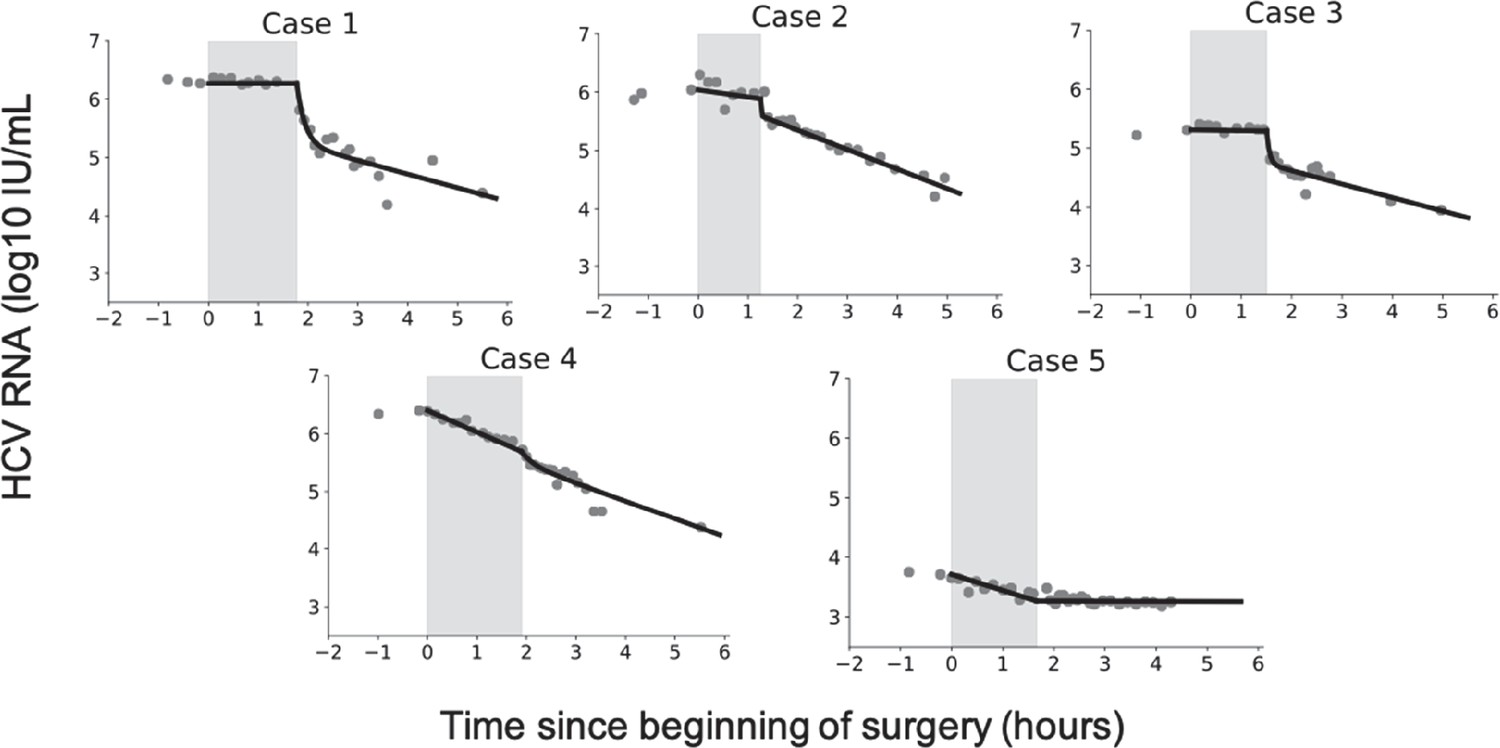
Hepatitis C virus (HCV) RNA kinetics during liver transplantation.
Serum HCV RNA kinetics in five cases before transplant, during the anhepatic phase (gray rectangles), and during the first 4 hr after liver graft reperfusion. HCV RNA measurements are shown by gray circles and best-fit model predictions by solid black lines. HCV levels are graphed relative to the time of liver removal (t = 0) on the x-axis.
-
Figure 3—source data 1
Hepatitis C virus (HCV) RNA measurements during liver transplantation.
Also includes patients demographics, fluid intake/uptake, and timing of the anhepatic phase.
- https://cdn.elifesciences.org/articles/65297/elife-65297-fig3-data1-v2.csv
Figure 4
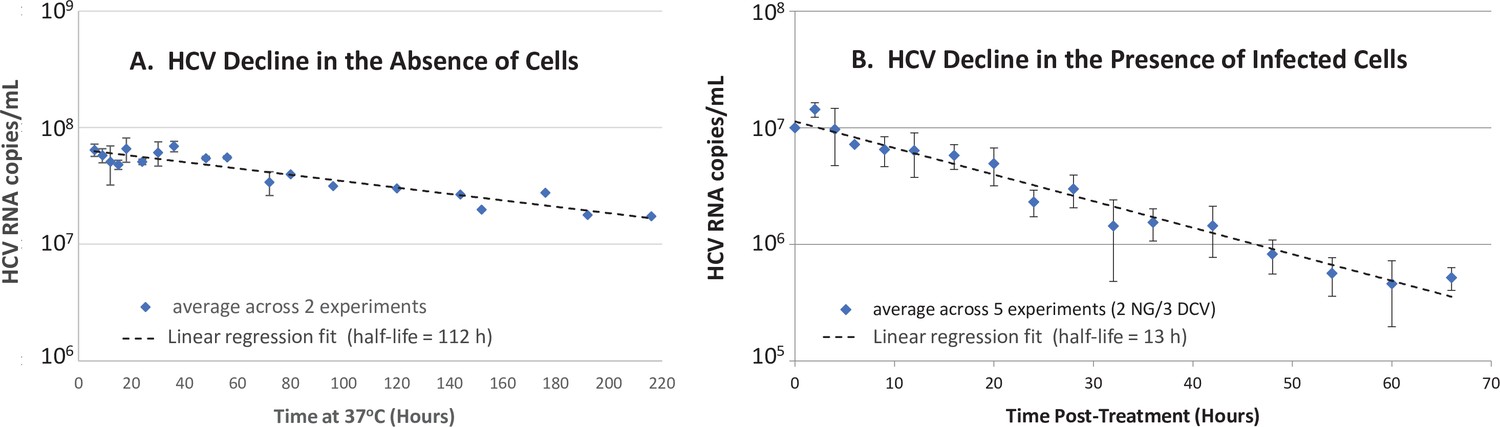
In vitro hepatitis C virus (HCV) RNA clearance kinetics.
HCV RNA clearance from culture medium at 37°C was monitored by frequent sampling at the indicated time points. (A) Decline in HCV RNA in the absence of cells averaged across two experiments, each performed with four replicate wells per time point. (B) Decline in HCV RNA in the presence of chronically infected cells in which de novo HCV secretion is inhibited. Chronically HCV-infected non-growing Huh7 cells were mock-treated or treated with 200 μM of the HCV secretion inhibitor naringenin (NG) in two experiments performed with duplicate wells or 1 nM of the HCV replication and secretion inhibitor daclatasvir (DCV) in three experiments, two performed with duplicate wells, one performed in singlet. The average copies/mL ± standard deviation across these five experiments are graphed (blue diamonds). For all experiments, RNA was extracted, and HCV copies were quantified by RT-qPCR in technical duplicate. For the infection experiment, HCV copies/mL were normalized to mock-treated samples at each time point. Graphed is the average copies/mL ± standard deviation across experiments at the indicated times (blue diamonds). Linear regression (dashed lines) was performed to calculate the virus half-life (t½).
-
Figure 4—source data 1
Hepatitis C virus (HCV) RNA measurements in vitro.
- https://cdn.elifesciences.org/articles/65297/elife-65297-fig4-data1-v2.xlsx
Author response image 1
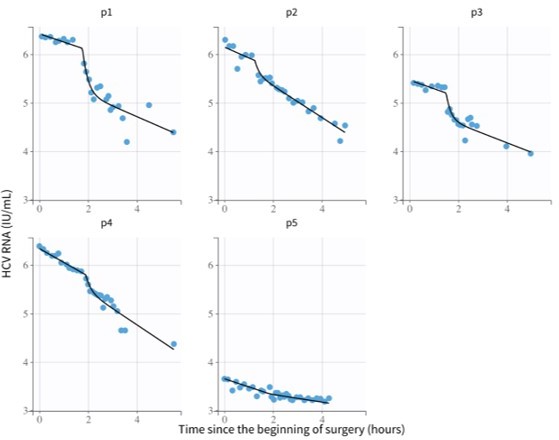
Model fits from Monolix using parameters from Author response table 2.
Author response image 2
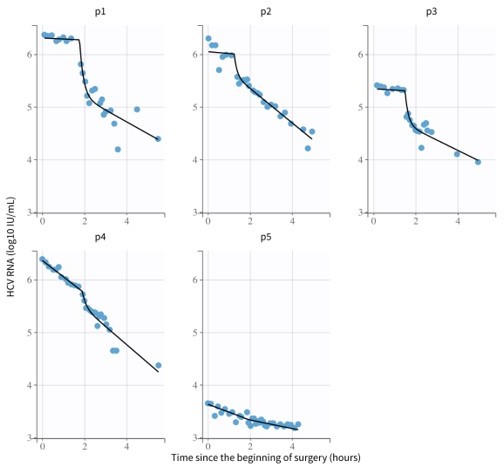
Model fits from Monolix using parameters from Author response table 4.
Tables
Table 1
Characteristics of liver transplant (LT) recipients/donors and fluid balances during transplantation.
BMI is the body mass index defined as a ratio of weight in kg to the square of height in meters. AH, anhepatic phase; RP, 4 hr after graft reperfusion.
| Case | Gender | Weight(kg) | BMI(kg/m2) | Ageat LT(year) | Donorage(year) | Donorgender | HCVgenotype | AH fluidintake(mL) | RP fluidintake(mL) |
|---|---|---|---|---|---|---|---|---|---|
| 1 | M | 88 | 30 | 68 | 72 | M | 1b | 0 | 0 |
| 2 | F | 70 | 31 | 66 | 33 | M | 1b | 500 | 1000 |
| 3 | M | 87 | 34 | 56 | 69 | M | 3 | 250 | 250 |
| 4 | F | 43 | 19 | 60 | 73 | F | 1b | 750 | 3300 |
| 5 | M | 90 | 29 | 49 | 29 | M | 1b | 951 | 3350 |
| Median (range) | 87(43–90) | 30(19–34) | 60(49–68) | 69(29–73) | 500(0–951) | 1000(0–3350) |
Table 2
Hepatitis C virus (HCV) kinetics during anhepatic phase.
The viral load prior to the anhepatic phase (AH) is the final measurement just before the anhepatic phase. The decrease was determined by linear regression.
| Phase | Case | Viral load prior to AH(log IU/mL) | Decrease slope (log/hr) | p-Value |
|---|---|---|---|---|
| AH | 1 | 6.3 | 0.07 | 0.073 |
| 2 | 6.0 | 0.30 | 0.17 | |
| 3 | 5.3 | 0.06 | 0.16 | |
| 4 | 6.4 | 0.32 | 1.3e-7 | |
| 5 | 3.7 | 0.16 | 0.006 | |
| Median(range) | 6.0(3.7–6.4) | 0.16(0.05–0.32) |
Table 3
Hepatitis C virus (HCV) kinetics during 4 hr post-reperfusion.
| Phase | Case | Viral load prior to RP*(log IU/mL) | Initial decrease slope (log/hr)† and (duration, min) | Second Decrease slope (log/hr) ‡ |
|---|---|---|---|---|
| RP | 1 | 6.3 | 2.7 (16) | 0.25 |
| 2 | 6.0 | 1.5 (22) | 0.35 | |
| 3 | 5.3 | 2.1 (14) | 0.22 | |
| 4 | 5.9 | 2.0 (11) | 0.37 | |
| 5 § | 3.4 | – | 0.06 | |
| Median (range) | 5.9(3.4–6.3) | 2.0(1.5–2.8) | 0.25(0.06–0.37) |
-
*
The viral load prior to reperfusion is the final measurement during the anhepatic phase just before reperfusion.
-
†
Slopes were calculated using the measured viral load (VL) of the last point of anhepatic phase and the first 4four points of reperfusion phase.
-
‡
VL after the first 4four points of reperfusion until 4 hr post -reperfusion were used. All slopes (determined by linear regression) were significantly different than 0 (Pp ≤ 0.01).
-
§
For Case five5 during graft reperfusion (reperfusion) only one slope was estimated from the last point of anhepatic phase until 4 hr post -reperfusion (RP);. For Cases 1–4 during reperfusion, an initial rapid decrease was estimated, followed by a slower/second decrease.
Table 4
Best-fit parameter estimates determined by fitting Equation. (3) to data obtained during the anhepatic (AH) phase (assuming extracellular fluid of 15 L per 70 kg), where we assumed that fluid intake and outtake are equal (see Materials and methods).
VP, Due to viral plateau (not significantly different from slope 0 as indicated in Table 2) hepatitis C virus (HCV) half-life (t1/2) was not undefined. Note that in the model all parameter values are converted to mL, but for simplicity some are written here in terms of L. V0AH is the final measured value prior to the AH phase.
| Case | Phase duration(days) | Num. data points | i(fluid intake/ phase duration)(L/day) | F(0) (weight*15 L/70 kg) (L) | V0AH(log IU/mL) | HCV t1/2(ln(2)/cAH)(min)(95% CI) |
|---|---|---|---|---|---|---|
| 1 | 0.074 | 8 | 0 | 18.9 | 6.3 | VP |
| 2 | 0.052 | 7 | 9.6 | 15.0 | 6.0 | VP |
| 3 | 0.062 | 8 | 4.0 | 18.6 | 5.3 | VP |
| 4 | 0.079 | 12 | 9.5 | 9.2 | 6.4 | 57 (54–60) |
| 5 | 0.069 | 11 | 13.7 | 19.3 | 3.7 | 79 (67–95) |
| Median(range) | 0.067(0.052– 0.079) | 8(7–12) | 9.5(0–13.7) | 18.6(9.2– 19.3) | 6.0 (3.7–6.4) |
Table 5
Best-fit parameter estimates determined by fitting Equation. (4) to data obtained during the 4 hr after graft reperfusion (assuming extracellular fluid of 15 L per 70 kg), where we assumed that fluid intake and outtake are equal (see Materials and methods).
| Case | Phase duration (days) | Num. data points | i(fluid intake/ duration)(L/day) | F(0) (weight*15 L/70 kg) (L) | V0RP(log IU/mL)† | Init. HCV (ln(2)/c0)t1/2* (min) | κ(1 /days)(95% CI) | HCV t1/2 (ln(2)/cRP) (min)(95% CI) | |
|---|---|---|---|---|---|---|---|---|---|
| 1 | 0.17 | 15 | 0 | 18.9 | 6.3 | 2.9 | 143 [120–166] | 77 [53–140] | |
| 2 | 0.17 | 22 | 6.0 | 15.0 | 5.9 | 0.4 | 3620 [3080–4,150] | 54 [50–59] | |
| 3 | 0.17 | 15 | 1.5 | 18.6 | 5.3 | 1.9 | 399 [348, 450] | 79 [63–105] | |
| 4 | 0.17 | 18 | 19.8 | 9.2 | 5.7 | 15.8 | 100‡ | 59 [52–68] | |
| 5 | 0.17 | 21 | 20.1 | 19.3 | 3.3 | N/A | N/A | § | |
| Median (range) | 0.17(0.17–0.17) | 18(15-22) | 6.0(0–20.1) | 18.6(9.2–19.3) | 5.7(3.3–6.3) | 2.4(0.4–15.8) | 399(143–3620) | 68(54–79) | |
-
*
Since c0 and cRP were highly correlated and not independently identifiable (correlation matrix) and population modeling (using Monolix) indicated that c0 was not identifiable (not shown), the initial virus clearance rate (i.e., c0 in Equation. 4) was fixed to its best-fit value (first estimated with c0, cRP, and κ as free parameters) and then the errors on the remaining parameters (cRP and κ) were computed.
-
†
For 4 hr after reperfusion, the V0RP listed is the final value of the fit for anhepatic phase. This value was then used in the model for calibration with HCV data 4 hr after reperfusion.
-
‡
Parameter was set to this fixed value due to high uncertainty and was omitted from the calculation of median and range.
-
§
Equation. 3 was used to estimate the HCV t1/2. Since the best estimate of clearance was cRP~0, half-life is undefined.
Author response table 1
Maximum likelihood estimates of the model parameters using mixed effects modeling in the software Monolix.
The mixed-effects model assumes a population probability distribution with form: with representing parameters , , and , and a population probability distribution: for parameter . Parameters and represent the virus clearance rate during the anhepatic phase and the final virus clearance rate after liver graft reperfusion, respectively. %RSE is the residual standard error and quantifies the identifiability of a parameter with the available data—%RSE greater than 50% means that the parameter is not identifiable. With these parameters the estimated median of the HCV t1/2 during the anhepatic phase and after liver graft reperfusion are 99 and 101 minutes, respectively, and the initial HCV t1/2 right after the anhepatic phase is 0.004 minutes. These estimations are based assuming the total fluid volume before surgery , having units of mL.
| Mixed effects model | Parameter | Units | Value | %RSE* |
|---|---|---|---|---|
| Fixed effects(Population value, ) | 1/hr | 5.13 | 25.3 | |
| 1/hr | 0.42 | 23 | ||
| 1/hr | 0.41 | 33.2 | ||
| 1/hr | 10337.1 | 235* | ||
| Log10 IU/mL | 5.6 | 8.29 | ||
| Standard deviation of the random effects(variability in the population, ) | 1/hr | 0.15 | 132* | |
| 1/hr | 0.29 | 85.6* | ||
| 1/hr | 0.69 | 35.6 | ||
| 1/hr | 1.65 | 90.6* | ||
| Log10 IU/mL | 1.04 | 31.7 |
Author response table 2
Individual parameter estimates using Monolix.
These are the parameters used for the model fits in Author response image 1.
| id | [1/hr] | [1/hr] | [1/hr] | [1/hr] | [Log10 IU/mL] |
|---|---|---|---|---|---|
| p1 | 4.59 | 0.39 | 0.51 | 33095.23 | 6.42 |
| p2 | 5.62 | 0.48 | 0.72 | 3997.18 | 6.15 |
| p3 | 5.29 | 0.4 | 0.44 | 18529.58 | 5.47 |
| p4 | 4.73 | 0.57 | 0.69 | 28783.43 | 6.34 |
| p5 | 5.65 | 0.34 | 0.13 | 3281.26 | 3.65 |
Author response table 3
Individual estimates of HCV half-life using values from Author response table 2.
| id | 1/days | HCV t1/2 [min]during anhepatic phase | HCV t1/2 [min] after liver graft reperfusion | Init. HCV t1/2 [min]after liver graft reperfusion |
|---|---|---|---|---|
| p1 | 110.16 | 106.64 | 81.55 | 0.001 |
| p2 | 134.88 | 86.64 | 57.76 | 0.010 |
| p3 | 126.96 | 103.97 | 94.52 | 0.002 |
| p4 | 113.52 | 72.96 | 60.27 | 0.001 |
| p5 | 135.60 | 122.32 | 319.91 | 0.013 |
Author response table 4
Maximum likelihood estimates of the model parameters using mixed effects modeling in the software Monolix.
The mixed-effects model assumes a population probability distribution with form: with representing parameters , and , and a population probability distribution: for parameter . Parameter had distribution with for patients 1-3 (i.e.) and for patients 4-5 (i.e. ). Parameters and represent the virus clearance rate c during the anhepatic phase and the final virus clearance rate after liver graft reperfusion, respectively. As before, %RSE greater than 50% means that the parameter is not identifiable. With these parameters the estimated median of the HCV t1/2 during the anhepatic phase are 16 hours and 98 minutes for patients 1-3 and patients 4-5, respectively (not enough data to test significance). The median of the HCV t1/2 after liver graft reperfusion was 99 minutes, respectively, and the initial HCV t1/2 right after the anhepatic phase is 0.004 minutes. These estimations are based assuming the total fluid volume before surgery , having units of mL.
| Mixed effects model | Parameter | Units | Value | %RSE* |
|---|---|---|---|---|
| Fixed effects(Population value, ) | 1/hr | 6.41 | 22.6 | |
| 1/hr | 0.043 | 309* | ||
| 1/hr | 0.42 | 136* | ||
| 1/hr | 0.42 | 32.4 | ||
| 1/hr | 106223.9 | 238* | ||
| Log10 IU/mL | 5.54 | 8.29 | ||
| Standard deviation of the random effects(variability in the population, ) | 1/hr | 0.17 | 78.9* | |
| 1/hr | 0.5 | 69.5* | ||
| 1/hr | 0.67 | 35.5 | ||
| 1/hr | 1.06 | 201* | ||
| Log10 IU/mL | 1.02 | 31.7 |
Author response table 5
Individual parameter estimates using Monolix.
These are the parameters used for the model fits in Author response image 2.
| id | [1/hr] | [1/hr] | [1/hr] | [1/hr] | [Log10 IU/mL] |
|---|---|---|---|---|---|
| p1 | 5.47 | 0.046 | 0.52 | 214764.41 | 6.31 |
| p2 | 7.42 | 0.047 | 0.72 | 74381.69 | 6.05 |
| p3 | 6.47 | 0.045 | 0.44 | 155523.87 | 5.34 |
| p4 | 5.64 | 0.63 | 0.71 | 167066.1 | 6.36 |
| p5 | 7.3 | 0.3 | 0.14 | 70417.29 | 3.63 |
Author response table 6
Individual estimates of HCV half-life using values from Author response table 5.
| id | 1/days | HCV t1/2 [min]during anhepatic phase | HCV t1/2 [min] after liver graft reperfusion | Init. HCV t1/2 [min]after liver graft reperfusion |
|---|---|---|---|---|
| p1 | 131.28 | 904.11 | 79.98 | 0.0002 |
| p2 | 178.08 | 884.87 | 57.76 | 0.0006 |
| p3 | 155.28 | 924.20 | 94.52 | 0.0003 |
| p4 | 135.36 | 66.01 | 58.58 | 0.0002 |
| p5 | 175.20 | 138.63 | 297.06 | 0.0006 |
Additional files
-
Supplementary file 1
Table S1.
Best-fit parameter estimates determined by fitting Equation. (3) with data obtained during the anhepatic (AH) phase, assuming extracellular fluid volume of 5 L and that fluid intake and outtake are equal (see Materials and methods). VP, viral plateau (not significantly different from slope 0). Note that the median is not provided because many patients had a best-fit value of 0 for the slope precluding an estimate of a half-life.
- https://cdn.elifesciences.org/articles/65297/elife-65297-supp1-v2.docx
-
Supplementary file 2
Table S2.
Best-fit parameter estimates determined by fitting Equation. (4) with data obtained during the 4 hr after graft reperfusion (RP), assuming extracellular fluid volume of 5 L and that fluid intake and outtake are equal (see Materials and methods). VP, viral plateau (not significantly different from slope 0). * Since c0 and cRP were highly correlated and not independently identifiable (correlation matrix) and population modeling (using Monolix) indicated that c0 was not identifiable (not shown), the initial virus clearance rate (i.e., c0 in Equation. 4) was fixed to its best-fit value (first estimated with c0, cRP, and κ as free parameters) and then the errors on the remaining parameters (cRP and κ) were computed. ** Equation. 3 was used to estimate hepatitis C virus (HCV) t1/2. Since best estimate of clearance was cRP = 0, half-life is undefined.
- https://cdn.elifesciences.org/articles/65297/elife-65297-supp2-v2.docx
-
Supplementary file 3
Table S3.
Longer term viral kinetics. We found the time when hepatitis C virus (HCV) VL begins increasing and then determined the half-life of HCV up until the time of the first increase. We then measured the continued decrease from the end of reperfusion (RP) until this time and determined the slope using linear regression. We converted this slope to a half-life and found that the half-life tends to be on the order of several hours (except for Case 5 in whom a viral plateau was observed until the end of the follow-up period).
- https://cdn.elifesciences.org/articles/65297/elife-65297-supp3-v2.docx
-
Transparent reporting form
- https://cdn.elifesciences.org/articles/65297/elife-65297-transrepform1-v2.docx
Download links
A two-part list of links to download the article, or parts of the article, in various formats.
Downloads (link to download the article as PDF)
Open citations (links to open the citations from this article in various online reference manager services)
Cite this article (links to download the citations from this article in formats compatible with various reference manager tools)
Modeling hepatitis C virus kinetics during liver transplantation reveals the role of the liver in virus clearance
eLife 10:e65297.
https://doi.org/10.7554/eLife.65297


