Modeling hepatitis C virus kinetics during liver transplantation reveals the role of the liver in virus clearance

  1. Louis Shekhtman
  2. Miquel Navasa
  3. Natasha Sansone
  4. Gonzalo Crespo
  5. Gitanjali Subramanya
  6. Tje Lin Chung
  7. E Fabian Cardozo-Ojeda
  8. Sofía Pérez-del-Pulgar
  9. Alan S Perelson
  10. Scott J Cotler
  11. Xavier Forns
  12. Susan L Uprichard  Is a corresponding author
  13. Harel Dahari  Is a corresponding author
  1. The Program for Experimental & Theoretical Modeling, Division of Hepatology, Department of Medicine, Stritch School of Medicine, Loyola University Medical Center, United States
  2. Network Science Institute, Northeastern University, United States
  3. Liver Unit, Hospital Clínic, IDIBAPS and CIBEREHD, University of Barcelona, Spain
  4. Department of Microbiology & Immunology, University of Illinois Chicago, United States
  5. Institute for Biostatistics and Mathematical Modeling, Department of Medicine, Goethe Universität Frankfurt, Germany
  6. Vaccine and Infectious Disease Division, Fred Hutchinson Cancer Research Center, United States
  7. Theoretical Biology and Biophysics, Los Alamos National Laboratory, United States
  8. The Infectious Disease and Immunology Research Institute, Stritch School of Medicine, Loyola University Medical Center, United States

Abstract

While the liver, specifically hepatocytes, are widely accepted as the main source of hepatitis C virus (HCV) production, the role of the liver/hepatocytes in clearance of circulating HCV remains unknown. Frequent HCV kinetic data were recorded and mathematically modeled from five liver transplant patients throughout the anhepatic (absence of liver) phase and for 4 hr post-reperfusion. During the anhepatic phase, HCV remained at pre-anhepatic levels (n = 3) or declined (n = 2) with t1/2~1 hr. Immediately post-reperfusion, virus declined in a biphasic manner in four patients consisting of a rapid decline (t1/2 = 5 min) followed by a slower decline (t1/2 = 67 min). Consistent with the majority of patients in the anhepatic phase, when we monitored HCV clearance at 37°C from culture medium in the absence/presence of chronically infected hepatoma cells that were inhibited from secreting HCV, the HCV t1/2 in cell culture was longer in the absence of chronically HCV-infected cells. The results suggest that the liver plays a major role in the clearance of circulating HCV and that hepatocytes may be involved.

Editor's evaluation

In their work, the authors combine clinical data and mathematical modelling to shed light on the role of hepatocytes in HCV clearance. This manuscript will be of interest to clinicians in organ transplantation centers and to translational hepatitis virus researchers given that it provides a rare and carefully collected dataset of hepatitis C virus blood titers during and after liver transplantation. The manuscript is also of potential interest to modelers interested in HCV infection and more broadly infectious disease specialists.

https://doi.org/10.7554/eLife.65297.sa0

Introduction

The liver, specifically hepatocytes, is widely accepted as the main source of hepatitis C virus (HCV) production but the role of the liver/hepatocytes in the clearance of circulating HCV remains largely unknown. To determine the function of the liver/hepatocytes in clearing cell-free virus from the circulation in patients requires being able to monitor and compare viral kinetics during the presence and absence of the liver/hepatocytes. This can be achieved readily in vitro but only transiently in vivo during liver transplantation where viral levels can be measured in the blood during the anhepatic phase when the native liver has been removed compared to after reperfusion of the new liver.

Previous kinetic studies (Dahari et al., 2005; Fukumoto et al., 1996; Garcia-Retortillo et al., 2002; Hughes et al., 2017; Powers et al., 2006) have suggested that HCV was cleared at the same rate during the anhepatic phase and early after reperfusion. However, these estimates were based on limited data (one to four samples during the anhepatic phase), obtained at the beginning and end of the anhepatic phase and several hours after reperfusion. Interestingly, Garcia-Retortillo et al., 2002, reported a patient with a prolonged anhepatic phase of 20 hr in whom the HCV half-live (t1/2) during the anhepatic phase and after reperfusion was estimated to be 10.3 and 3.8 hr, respectively, suggesting that viral clearance occurs relatively slowly during the anhepatic phase and increases after reperfusion. Garcia-Retortillo et al., 2002, also hypothesized that the rapid clearance of HCV from the serum post-reperfusion was at least in part due to entrance of HCV into the hepatocytes or the liver reticuloendothelial system. However, a detailed viral kinetic study during the anhepatic phase and immediately after reperfusion has not been performed.

Here, we measured viral levels in five liver transplant patients over the course of liver transplantation (Figure 1a). We focus on very frequent sampling during the anhepatic phase (i.e., every 5–15 min) and during the first 4 hr of the reperfusion period (every 5–10 min) (Figure 1b) along with recording fluid balances during the surgical procedure (Table 1). The viral clearance rate during these two distinct phases was estimated using a mathematical modeling framework (Figure 2) accounting for viral kinetics and taking into account fluid balance including infusion of red blood cells, plasma, saline, and albumin, as well as blood loss. HCV serum levels were observed to remain at steady state during the AH phase in three of the five patients suggesting that the liver plays a major role in clearing HCV from the circulation. Interestingly, in parallel in vitro experiments, when we monitored the clearance rate of HCV from culture medium at 37°C in the absence and presence of chronically infected Huh7 human hepatoma cells, HCV clearance was faster in the presence of the hepatoma cells suggesting that hepatocytes may play a role in the observed clearance of circulating HCV.

Virus kinetics in the serum of five hepatitis C virus (HCV)-infected patient before, during, and after liver transplantation (LT).

(a) Surgery was initiated at t = 0. The anhepatic phase is the first lighter shading and the darker shading immediately after it represents the first 4 hr post-reperfusion (RP). In all patients, virus levels decreased after graft reperfusion. A nadir was reached after a median time of 15 hr (range 9–87 hr) post-reperfusion. HCV RNA resurged within 7 days after reperfusion, with three of five cases reaching greater or comparable viral levels to those observed at baseline. For the remaining two cases, the corresponding viral loads were 0.87 and 0.43 log10 IU/mL lower than those just before surgery. HCV RNA levels in Case 5 remained in a lower plateau from 11 hr post-surgery until the end of follow-up period (slope <0.001, p = 0.76), with a corresponding viral load of 2.45 ± 0.002 log10 IU/mL. (b) A zoomed-in version of (a) focusing on the time of LT and 4 hr post-RP.

Visual description of the stages of the transplant procedure and modeling assumptions.

(A) Prior to the anhepatic (AH) phase viral load is at a steady state in which virus production is balanced by viral clearance (Equation 1). (B) During the AH phase, the liver is not present and therefore there is no viral production (Equation 2). However, virus may appear to be cleared by the input of fluids that dilute the virus in circulation (see F in Equation 3) and through processes of physiological clearance. (C) Up to 4 hr post-reperfusion there is no viral production as the cells in the new liver if they have been infected have not yet started releasing new virions. Clearance still occurs both via fluid balances but is predicted via a time-dependent function (see c(t) in Equation 4) that may represent a rapid clearance phase (possibly due to viral binding/entry into hepatocytes) immediately after graft reperfusion and a second/slower clearance phase (physiological). (D) Longer after reperfusion (over 4 hr), the new liver begins producing new virions (as evident in Figure 1a in Cases 1–4).

Table 1
Characteristics of liver transplant (LT) recipients/donors and fluid balances during transplantation.

BMI is the body mass index defined as a ratio of weight in kg to the square of height in meters. AH, anhepatic phase; RP, 4 hr after graft reperfusion.

CaseGenderWeight(kg)BMI(kg/m2)Ageat LT(year)Donorage(year)DonorgenderHCVgenotypeAH fluidintake(mL)RP fluidintake(mL)
1M88306872M1b00
2F70316633M1b5001000
3M87345669M3250250
4F43196073F1b7503300
5M90294929M1b9513350
Median (range)87(43–90)30(19–34)60(49–68)69(29–73)500(0–951)1000(0–3350)

Results

Viral kinetics before and during the anhepatic phase

Prior to the anhepatic phase, the viral load is at steady state. Since there was minimal variation prior to the anhepatic phase, we defined the final measured value of viral load prior to the anhepatic phase as the initial viral load for the model. The median viral load measured just before the anhepatic phase was 6.0 (range 3.7–6.4) log10 IU/mL (Figure 3; Table 2). We carried out a linear fit to the data during the anhepatic phase, which lasted 1.25–1.90 hr. We found that virus levels were flat in three cases (Case 1, Case 2, and Case 3) while in two patients (Case 4 and Case 5) the viral decline slope was 0.32 and 0.16 log10 IU/mL per hour, respectively (Table 2).

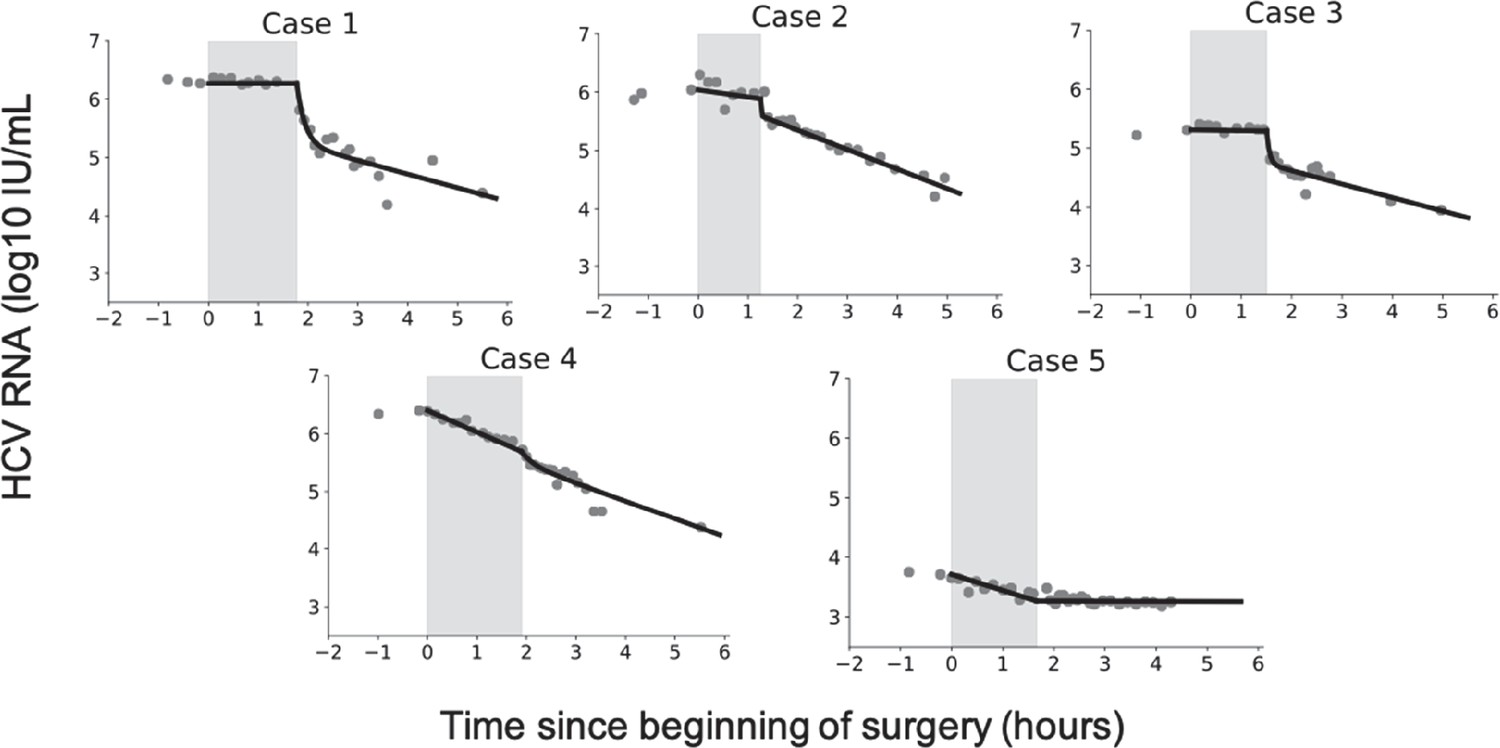
Hepatitis C virus (HCV) RNA kinetics during liver transplantation.

Serum HCV RNA kinetics in five cases before transplant, during the anhepatic phase (gray rectangles), and during the first 4 hr after liver graft reperfusion. HCV RNA measurements are shown by gray circles and best-fit model predictions by solid black lines. HCV levels are graphed relative to the time of liver removal (t = 0) on the x-axis.

Figure 3—source data 1

Hepatitis C virus (HCV) RNA measurements during liver transplantation.

Also includes patients demographics, fluid intake/uptake, and timing of the anhepatic phase.

https://cdn.elifesciences.org/articles/65297/elife-65297-fig3-data1-v2.csv
Table 2
Hepatitis C virus (HCV) kinetics during anhepatic phase.

The viral load prior to the anhepatic phase (AH) is the final measurement just before the anhepatic phase. The decrease was determined by linear regression.

PhaseCaseViral load prior to AH(log IU/mL)Decrease slope (log/hr)p-Value
 AH16.30.070.073
26.00.300.17
35.30.060.16
46.40.321.3e-7
53.70.160.006
Median(range)6.0(3.7–6.4)0.16(0.05–0.32)

Viral kinetics after graft reperfusion

During the first 4 hr after reperfusion, HCV measurements were taken at intermittent times (Figure 3) and volume input was recorded. Fluid input during post-reperfusion for Cases 1–5 were 0, 1000, 250, 3300, and 3350 mL, respectively (Table 1). In Cases 1–4, HCV RNA declined in a biphasic manner, while in Case 5, HCV RNA remained at the same levels as at the end of the anhepatic phase. For Cases 1–4, the biphasic decline consisted of an initial, sharp decrease within 11–22 min, followed by a longer but slower decrease (Table 3). Using linear regression, the slope of the initial decrease was 2.7, 1.5, 2.1, and 2.0 log10 IU/mL per hour for Cases 1–4, respectively, that lasted for 1.2–2.8 min. The slower second phase slope for Cases 1–4 was 0.2, 0.3, 0.2, and 0.4 log10 IU/mL per hour, respectively (Table 3). The viral plateau in Case 5 is distinct from the other cases, although it is worth noting that this patient’s viral load continued to be flat for ~6 days post-reperfusion (Figure 1).

Table 3
Hepatitis C virus (HCV) kinetics during 4 hr post-reperfusion.
PhaseCaseViral load prior to RP*(log IU/mL)Initial decrease slope (log/hr) and (duration, min)Second Decrease slope (log/hr)
RP16.32.7 (16)0.25
26.01.5 (22)0.35
35.32.1 (14)0.22
45.92.0 (11)0.37
5 §3.40.06
Median (range)5.9(3.4–6.3)2.0(1.5–2.8)0.25(0.06–0.37)
  1. *

    The viral load prior to reperfusion is the final measurement during the anhepatic phase just before reperfusion.

  2. Slopes were calculated using the measured viral load (VL) of the last point of anhepatic phase and the first 4four points of reperfusion phase.

  3. VL after the first 4four points of reperfusion until 4 hr post -reperfusion were used. All slopes (determined by linear regression) were significantly different than 0 (Pp ≤ 0.01).

  4. §

    For Case five5 during graft reperfusion (reperfusion) only one slope was estimated from the last point of anhepatic phase until 4 hr post -reperfusion (RP);. For Cases 1–4 during reperfusion, an initial rapid decrease was estimated, followed by a slower/second decrease.

Modeling HCV kinetics

Model fits are shown in Figure 3 and viral clearance (cAH) estimates are shown in Table 4. The estimated virus clearance rates during the anhepatic phase in Cases 1–3 were ~0 (i.e., very long t1/2 that implies no clearance) but were significantly different from 0 in Cases 4 and 5 corresponding to an HCV t1/2 = Ln(2)/cAH of 1–2 hr. Similar results were obtained under the assumption of 5 L of extracellular fluid per 70 kg (Supplementary file 1, Table S1).

Table 4
Best-fit parameter estimates determined by fitting Equation. (3) to data obtained during the anhepatic (AH) phase (assuming extracellular fluid of 15 L per 70 kg), where we assumed that fluid intake and outtake are equal (see Materials and methods).

VP, Due to viral plateau (not significantly different from slope 0 as indicated in Table 2) hepatitis C virus (HCV) half-life (t1/2) was not undefined. Note that in the model all parameter values are converted to mL, but for simplicity some are written here in terms of L. V0AH is the final measured value prior to the AH phase.

CasePhase duration(days)Num. data pointsi(fluid intake/ phase duration)(L/day)F(0) (weight*15 L/70 kg) (L)V0AH(log IU/mL)HCV t1/2(ln(2)/cAH)(min)(95% CI)
10.0748018.96.3VP
20.05279.615.06.0VP
30.06284.018.65.3VP
40.079129.59.26.457 (54–60)
50.0691113.719.33.779 (67–95)
Median(range)0.067(0.052–
0.079)
8(7–12)9.5(0–13.7)18.6(9.2–
19.3
)
  6.0(3.7–6.4)

When fitting the model to data from the reperfusion phase, we found that there was significant correlation between the parameters c0 and cRP, representing the initial faster clearance rate, and the longer term slower clearance rate, respectively. The high correlation between the parameters suggests that these two parameters were not independently identifiable. This led us to fit the model in two steps. first, we set all of the parameters c0, cRP, and κ, which governs the speed of the transition from c0 to cRP, as free. Second, we fixed c0 to its best-fit value and then fit the model again estimating κ, cRP. For Cases 1–4, the initial viral clearance, c0, gave t1/2 on the order of 5 [0.4–16] min (Table 5). The median time constant was κ = 399/day meaning that the time it took for the clearance rate to shift from its initial value of c0 to its final value of cRP was around 4 min. The second, slower clearance rate, cRP, corresponded to a t1/2 of order 67 [54–79] min (Table 5 and Figure 3). In Case 5, Equation. (3) was used because an extremely slow (or plateaued) viral load (slope of 0.06 log10 IU/mL/hr) was observed suggesting no production and clearance during the first 6 hr post-reperfusion (Figure 3, Table 5) or the subsequent 6 days (Figure 1). Similar results were obtained under the assumption of 5 L of extracellular fluid per 70 kg (Supplementary file 2, Table S2).

Table 5
Best-fit parameter estimates determined by fitting Equation. (4) to data obtained during the 4 hr after graft reperfusion (assuming extracellular fluid of 15 L per 70 kg), where we assumed that fluid intake and outtake are equal (see Materials and methods).
CasePhase duration (days)Num. data pointsi(fluid intake/ duration)(L/day)F(0) (weight*15 L/70 kg) (L)V0RP(log IU/mL)Init. HCV (ln(2)/c0)t1/2* (min)κ(1 /days)(95% CI)HCV t1/2 (ln(2)/cRP) (min)(95% CI)
1    0.1715018.96.32.9143 [120–166]77
[53–140]
2    0.17226.015.05.90.43620 [3080–4,150]54
[50–59]
3    0.17151.518.65.31.9399
[348, 450]
79
[63–105]
4    0.171819.89.25.715.810059
[52–68]
5    0.172120.119.33.3N/AN/A§
Median (range)0.17(0.17–0.17)18(15-22)6.0(0–20.1)18.6(9.2–19.3)5.7(3.3–6.3)2.4(0.4–15.8)399(143–3620)68(54–79)
     
  1. *

    Since c0 and cRP were highly correlated and not independently identifiable (correlation matrix) and population modeling (using Monolix) indicated that c0 was not identifiable (not shown), the initial virus clearance rate (i.e., c0 in Equation. 4) was fixed to its best-fit value (first estimated with c0, cRP, and κ as free parameters) and then the errors on the remaining parameters (cRP and κ) were computed.

  2. For 4 hr after reperfusion, the V0RP listed is the final value of the fit for anhepatic phase. This value was then used in the model for calibration with HCV data 4 hr after reperfusion.

  3. Parameter was set to this fixed value due to high uncertainty and was omitted from the calculation of median and range.

  4. §

    Equation. 3 was used to estimate the HCV t1/2. Since the best estimate of clearance was cRP~0, half-life is undefined.

HCV clearance from culture medium in vitro

To further investigate the role of hepatocytes in HCV clearance, we turned to the more controlled in vitro HCV infection experimental system (Zhong et al., 2005) as previously described in detail (Yu and Uprichard, 2010). To determine the effect of Huh7 hepatoma cells on HCV clearance in vitro, we measured the half-life of HCV virions at 37°C in cell culture medium in the absence and presence of chronically infected Huh7 cells by monitoring the decrease of HCV RNA over time (Figure 4). To measure HCV half-life in cell culture medium in the presence of chronically HCV-infected cells, we established a steady-state chronic infection in Huh7 cells, and then inhibited the secretion of HCV from the cells using 1 nM of the NS5a inhibitor daclatasvir to block HCV replication and secretion (Meanwell and Belema, 2019) or 200 µM naringenin to block HCV secretion (Goldwasser et al., 2011). In the absence of cells, the HCV half-life observed was 112 hr (Figure 4a). In the presence of chronically infected cells inhibited from de novo virus secretion, the HCV half-life observed was 13 hr (Figure 4b), which is 8.5 times faster than the clearance observed in the absence of cells (Figure 4a).

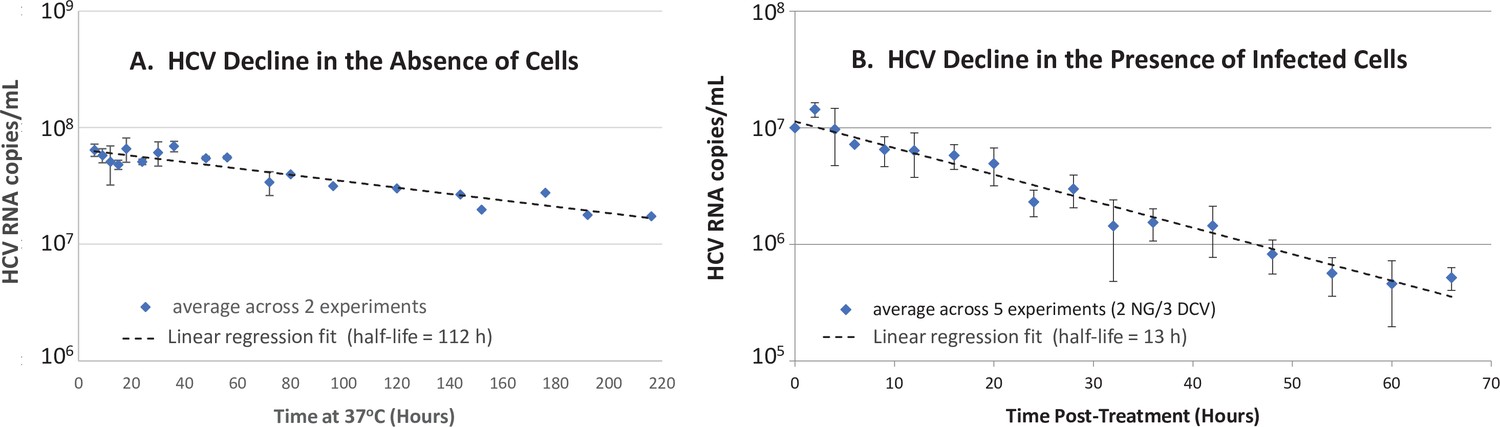
In vitro hepatitis C virus (HCV) RNA clearance kinetics.

HCV RNA clearance from culture medium at 37°C was monitored by frequent sampling at the indicated time points. (A) Decline in HCV RNA in the absence of cells averaged across two experiments, each performed with four replicate wells per time point. (B) Decline in HCV RNA in the presence of chronically infected cells in which de novo HCV secretion is inhibited. Chronically HCV-infected non-growing Huh7 cells were mock-treated or treated with 200 μM of the HCV secretion inhibitor naringenin (NG) in two experiments performed with duplicate wells or 1 nM of the HCV replication and secretion inhibitor daclatasvir (DCV) in three experiments, two performed with duplicate wells, one performed in singlet. The average copies/mL ± standard deviation across these five experiments are graphed (blue diamonds). For all experiments, RNA was extracted, and HCV copies were quantified by RT-qPCR in technical duplicate. For the infection experiment, HCV copies/mL were normalized to mock-treated samples at each time point. Graphed is the average copies/mL ± standard deviation across experiments at the indicated times (blue diamonds). Linear regression (dashed lines) was performed to calculate the virus half-life (t½).

Figure 4—source data 1

Hepatitis C virus (HCV) RNA measurements in vitro.

https://cdn.elifesciences.org/articles/65297/elife-65297-fig4-data1-v2.xlsx

Discussion

The current cross-disciplinary study employs in vivo clinical methods and mathematical modeling to assess virus levels during the anhepatic phase and immediately after graft reperfusion, providing evidence that the liver plays a major role in HCV clearance from the circulation. While others have suggested that the liver sinusoidal endothelial may be responsible for clearance of other viruses from circulation (Ganesan et al., 2011), our in vitro data also implicates hepatocytes as possibly playing a role, opening up a new avenue for investigation.

To enhance our ability to derive accurate viral kinetic data over previous studies, very frequent sampling for viral load monitoring during both the anhepatic phase (every 5–15 min) and immediately post-reperfusion (every 5–10 min) was performed. This frequent sampling revealed that viral clearance is often minimal during the anhepatic phase, which goes against our and others’ assumptions in previous models in which similar viral clearance rates were assumed during both the anhepatic and post-reperfusion phases (Dahari et al., 2005; Garcia-Retortillo et al., 2002; Hughes et al., 2017; Powers et al., 2006). Specifically, in three of five cases, viral load remained at a plateau in the absence of the liver indicating that not only viral production stopped but that viral clearance stopped as well, suggesting that the liver is involved in the clearance of circulating HCV. Interestingly, however, in Cases 4 and 5, fast viral clearance (t1/2~1–2 hr) was estimated via model calibration with measured data during the anhepatic phase while accounting for the recorded high fluid input of 3300 and 3350 mL in Cases 4 and 5, respectively (Equation. 3). Theoretically, to explain the fast viral clearance solely based on fluid input, the model (Equation. 3) predicts about fourfold higher fluid input (i.e, ~13,000 mL) than the recorded input (not shown), suggesting that other extrahepatic mechanisms must have contributed to viral clearance during the anhepatic phase in these patients.

The current study includes five patients who underwent liver transplant before the era of direct-acting antivirals (DAA) and were viremic at the time of transplant. With the advent of DAA therapy, many patients are treated successfully for HCV before liver transplantation (Belli et al., 2018). Nevertheless, the finding of viral steady state during anhepatic phase in the majority of patients and the rapid uptake of HCV by the liver during reperfusion reinforces the benefit of achieving not only viral negativity but also achieving less than one virus particle in the entire extracellular body fluid (i.e., cure boundary recently used in Etzion et al., 2020), with DAA therapy prior to transplantation to prevent infection of the graft.

Another novel finding reported herein is that following the introduction and reperfusion of the donor liver, the viral load declined in a biphasic manner (in Cases 1–4) consistent with an extremely fast viral decline (t1/2~ 5 min) that lasted ~14 min post-reperfusion followed by slower decline (HCV t1/2= 67 min). To reproduce this biphasic decline, we extended Powers et al., 2006, model (Equation. 3) by introducing a time-dependent HCV clearance, c(t), as shown in Equation. 4. We hypothesize that the initial rapid decrease is due to entrance into and binding of the virus to the new liver reminiscent of the Ganesan et al., 2011, findings in a mouse model for adenovirus clearance 1 min after infusion. The slower decrease (i.e., HCV t1/2 of 67 min) likely represents a more physiological (i.e., infectious) uptake rate of virions by the new liver before new virions are likely to be released from infected cells. Previous efforts to measure serum HCV virion clearance have been performed in chronically infected patients receiving antiviral drugs that inhibit viral production (Dahari et al., 2011). Interestingly, the 67 min for HCV t1/2 estimated in the current study is consistent with previous estimates of the HCV t1/2 of 45 min in patients treated with a potent inhibitor, daclatasvir, that blocks virus production (Guedj et al., 2013).

While in Cases 1–4, a rapid resurgence of HCV was observed 6 hr post-reperfusion, in Case 5, an extremely slow viral decline was observed during the first 4 hr post-reperfusion (Figure 3 and Table 3), followed by a viral plateau (~2.5 log IU/ml) during the subsequent 6 days (Figure 1A and Supplementary file 3, Table S3). This might be explained by graft dysfunction due to ischemia-reperfusion injury altering HCV binding to its receptors on hepatocytes. We previously reported a slow viral decline post-reperfusion (over 6 hr) in 3 (of 20) patients who underwent liver transplantation, where 2 of the 3 patients had a large degree of ischemia-reperfusion injury (Garcia-Retortillo et al., 2002). In addition, closure of porto-collateral vessels is not immediate after transplantation and in some patients blood shunting might contribute to a more modest decrease in HCV viral load during reperfusion (Navasa et al., 1993). In addition, we previously observed, in some patients, an extremely slow viral decline post-reperfusion and predicted, via mathematical modeling, the existence of extrahepatic HCV contribution compartment (see Table 1 in Dahari et al., 2005). Thus, the extremely slow viral load decline (or plateau) post-reperfusion in Case 5 might also be explained by the existence of an extrahepatic (or second) replication compartment. Since Case 5 had viral resurgence 3 weeks post-LT (not shown), we cannot rule out that the observed viral plateau of ~2.5 log IU/mL represents viral production from newly infected hepatocytes of the grafted liver with temporary (~3 weeks) extremely limited viral spread.

Two models (Equation. 3 and 4) were used in the current study, to separately account for viral clearance during the absence of the liver (i.e., anhepatic phase) and immediately after graft reperfusion (i.e., in the presence of a liver), respectively. When fitting the models to the viral load data, an individualized (per case) modeling calibration approach of Equation. 3 and 4 with the measured viral data was deemed optimal due to the small number (N = 5) of cases for whom very frequent viral sampling was measured during the anhepatic phase and immediately after graft reperfusion, respectively. A population mixed-effects (pME) modeling approach was found inappropriate for two main reasons. (i) some of the population probability distributions of the model parameters were not identifiable and it wrongly predicted a viral decline with HCV t1/2~98 min (instead of a viral plateau that was not significantly different than slope 0, i.e., very long HCV t1/2) during the anhepatic phase in Cases 1–3, if the clearance rate is assumed to have the same median in the population. (ii) Assuming a bimodal distribution for the virus clearance during the anhepatic phase (i.e., different parameter medians for Cases 1–3 and Cases 4 and 5, respectively) reproduced the viral plateau observed on Cases 1–3, but most of the model parameters were no longer identifiable (not shown). In general, the small sample size of N = 5 was insufficient to accurately train a predictive, pME model. Furthermore, it appears unlikely that additional HCV kinetic data can be acquired to explore mixed-effect models since currently patients are treated successfully with DAA before liver transplantation (Feld et al., 2020).

In the absence of confounding different cell types, our cell culture experiments support the notion that hepatocytes not only produce the virus, but also may play a role in clearing the virus from the extracellular space even if the cells are already chronically infected. Reminiscent of what was observed in vivo, the t1/2 of HCV in vitro was significantly shorter in the presence of Huh7 cells that were pharmacologically inhibited from secreting virus compared to in the absence of cells. We used chronically infected cells to avoid any initial rapid binding and influx of HCV as would be expected if naïve Huh7 cells were introduced and utilized the well-characterized drugs daclatasvir or naringenin at doses known to effectively block de novo virus secretion (Goldwasser et al., 2011; Hu et al., 2020). Because neither daclatasvir nor naringenin are known to enhance the degradation rate of HCV particles in the media, the data suggest that a large amount of the virus in the media enters and/or binds to the cells over time. Of note, the HCV t½ measured in the presence of cells in vitro may be overestimated if daclatasvir or naringenin do not completely block cell culture produced HCV (HCVcc) secretion, hence the difference in HCV t1/2 calculated compared to the absence of cells may be underestimated.

While we find this in vitro data interesting, it is important to note that hepatoma cells in vitro and the HCVcc virions they produce are not identical to in vivo infection and thus more investigation is needed before specific conclusions can be drawn directly from the in vitro data. Because the vast majority of HCV RNA in the culture media in vitro is non-infectious (e.g., specific infectivity of 1:500–1:1000) (Wakita et al., 2005; Cai et al., 2005; Hueging et al., 2015; Sarhan et al., 2017) and superinfection exclusion has been reported (Schaller et al., 2007), we assume this entry is primarily non-productive. However, whether this non-productive uptake involves an HCV-specific entry mechanism (i.e., involves HCV receptors) or represents some sort of general supernatant sampling, by which the hepatoma cells may be acquiring nutrients or clearing debris remains to be determined. This could be investigated experimentally in a variety of ways through the use of different cells (e.g., primary hepatocytes and HCV non-permissive hepatic and non-hepatic cells), different HCV sources (e.g., HCVcc entry defective HCV particles and clinically obtained HCV), or even the use of specific HCV entry inhibitors. However, because it is suspect to extrapolate quantitative differences in cell behavior from cell culture to the in vivo situation, questions regarding the relative contribution of the different cells in the liver to the observed HCV clearance in patients will likely require the use of in vivo models of HCV infection, such as urokinase-type plasminogen activator/severe combined immunodeficiency mice transplanted with human hepatocytes (Uchida et al., 2017). The current data simply raises the possibility that hepatocytes might be involved and helps justify the further investigation of this hypothesis.

The notion of the liver playing a significant role in the clearance of pathogens from circulation is not new. Others have suggested hepatic involvement in the clearing of simian immunodeficiency virus and adenovirus in animals (Ganesan et al., 2011; Zhang et al., 2002). However, to our best knowledge, the current study is the first one to investigate this in vitro, providing evidence that hepatocytes may contribute to viral clearance, but it remains to be determined the extent to which hepatocytes contribute to HCV clearance and if the involvement of hepatocytes might be different for non-hepatotropic viruses.

Materials and methods

Patients

Five transplant recipients (termed cases) with median age 60 years (range, 49–68) and median BMI 30 kg/m2 (range, 19–34) underwent liver transplantation (Table 1). Four of the five liver donors were male with median age 69 years (range, 29–73) (Table 1). All patients received 500 mg methylprednisolone immediately before laparotomy and 500 mg during graft reperfusion. For each patient, blood samples (2 mL) were taken before liver transplantation, every 5–15 min during the anhepatic phase for a total of 7–12 samples, every 5 min during the first hour of reperfusion, and every 10 min until the end of surgery for a total of 15–21 samples. Thereafter, blood was sampled every hour for the first 6 hr, every 6 hr during the first day, and daily during the first week. Transfusion of blood products, saline, and albumin were recorded. The study was approved by the Ethics Committee at Hospital Clinic Barcelona and all patients provided a written informed consent.

Mathematical modeling of HCV kinetics during liver transplantation

Request a detailed protocol

A schematic of the mathematical modeling approach utilized to understand HCV dynamics during the different stages of liver transplantation is shown in Figure 2. Shortly before liver removal, we assume that virus is produced at constant rate P and cleared from the serum at rate c per virion as in Neumann et al., 1998:

(1) dV/dt=PcV

where V is the viral load, expressed in international units (IU) per mL. Assuming the pre-transplant viral load to be at steady state, that is, dV/dt=0, implies that HCV production and clearance balance or P = cV. During the anhepatic phase and 4 hr after reperfusion, we assume that in the absence of the liver (i.e., anhepatic phase), virus production ceases, P = 0. Hence, Equation 1 reduces to

(2) dV/dt=-cAHV

where parameter c in Equation. 1 is replaced by cAH to represent viral clearance during the anhepatic phase. Some patients received albumin and blood transfusions to compensate for the fluid loss that occurred during transplant surgery. The blood loss causes a reduction in the absolute amount of virus in circulation, but does not affect the virus concentration, V. In contrast, the fluid intake results in a dilution of V. We can describe the change in patient viral load during the anhepatic phase as in Powers et al., 2006.

(3) dVdt=-cAH+iFVdFdt=i-λ

where F denotes the total body extracellular fluid which can vary over the course of the anhepatic phase, i is the rate of fluid intake, and λ is the rate of blood/fluid loss.

To account for the initial rapid and second slower phases of HCV decline post-reperfusion (RP) in Cases 1–4, we modified Equation. 3 by including a time-dependent viral clearance rate ct (t).

(4) dVdt=-ctt+iFVdFdt=i-λctt=c0+cRP-c01-e-κt

where c0 represents the initial rapid clearance rate, cRP the second slower clearance rate, and κ governs how quickly c0 reduces to c. Note that if κ = 0 or if κ is very large then ct (t) reduces to a constant. The units of cRP and c0 are both 1/day, V is in IU/mL, F is in mL, i and λ are in mL/day, κ is in units of 1/day and t is in days. For clarity parameter, units are sometimes converted to other units (e.g., liter to mL and day to hour).

The fluid input and loss rates i,λ were computed by the ratio of recorded volumes of fluid input and loss divided by each patient’s duration in the anhepatic phase. In the absence of surgical complications, the fluid loss and intake are usually approximately balanced, though loss is generally slightly more than the input. Since the exact volume of blood loss was not available, we evaluated the maximum impact of fluid intake which occurs when the blood loss and input are balanced, that is, λ = i. When λ≤ i, the total fluid volume F is a non-decreasing function over time, which attains a minimum when λ = i. As a consequence, the impact of i/F, involved in describing viral concentration dynamics, is maximum if λ = i.

Several studies have previously reported that HCV can be detected in different human body fluids of HCV-infected patients (Wang et al., 2006; Suzuki et al., 2005; Ortiz-Movilla et al., 2002; Bourlet et al., 2002; Leruez-Ville et al., 2000; Mendel et al., 1997; Numata et al., 1993; Pfaender et al., 2018). Therefore, the total fluid volume before surgery, F(0), was calculated using the patient’s body weight (Table 1) under the assumption of 15 L of extracellular fluid per 70 kg. In addition, we explored utilizing just 5 L of blood per 70 kg since transfusions are mainly given to compensate for blood loss during transplantation and HCV viral load is typically higher by several orders of magnitude in the blood compared to the other diverse body fluids (Numata et al., 1993; Pfaender et al., 2018). Lastly, parameter i was estimated by taking the recorded volumes of fluid input divided by each phase (actual anhepatic and 4 hr post-reperfusion).

Model calibration was performed using Python 3.7.4 together with Scipy Version 1.3.1 and Numpy Version 1.17.2. The fitting used the optimize.least_squares function in Scipy, which minimizes the squares of the differences between the model and patient data (least squares). The minimization is done using the Trust Region Reflective Algorithm ‘trf,’. For the linear regression, the linregress function was used from the scipy.stats package. Results with p-values ≤ 0.05 were considered statistically significant. The viral slope was considered flat (or plateau) if the estimate was not significantly different from 0, that is, p > 0.05. To identify coupled parameters (i.e., identifiability issues), the optimize.least_squares provides the covariance matrix of the resulting fit, which was converted to the correlation matrix by normalizing the covariances by the standard deviations of the corresponding variables (Chis et al., 2016).

Cells and virus

Request a detailed protocol

Huh7 human hepatoma cells (JCRB0403; RRID.CVCL_0336) were obtained from the Japanese Collection of Research Bioresources Cell Bank. Cell stocks have only been passaged 19 times. Every time a new stock is generated, cells are mycoplasma-tested prior to freezing. New aliquots are thawed after 10 passages and cultured in complete Dulbecco’s modified Eagle’s medium supplemented with 100 units/mL penicillin, 100 mg/mL streptomycin, 2 mM L-glutamine (Corning), 10 mM HEPES (Santa Cruz), and non-essential amino acids (Thermofisher Scientific) and 10% fetal bovine serum (Hyclone or Gibco) at 37°C in 5% CO2. Stocks of HCVcc were generated as previously described from a plasmid encoding the JFH-1 genome that was provided by Takaji Wakita (National Institute of Infectious Diseases, Tokyo, Japan) (Zhong et al., 2005; Yu and Uprichard, 2010; Wakita et al., 2005).

Measuring HCV half-life in vitro

Request a detailed protocol

To measure the HCVcc half-life in the absence of cells, the JFH-1 HCVcc stock was diluted to 104 ffU/mL, which is the level observed in culture media during steady state in the JFH-1 HCVcc infection system (Zhong et al., 2005) and incubated at 37°C simulating conditions during HCV infection in cell culture. At indicated time points, medium was harvested from duplicate wells and frozen at –80°C until HCV RNA was isolated for quantification.

To measure HCVcc half-life in the presence of chronically HCV-infected cells, confluent non-growing Huh7 cells (~60,000 cells/well) (Yu and Uprichard, 2010) were infected with JFH-1 HCVcc at a low MOI (0.01) and cultured for 12 days until HCV levels reached a steady state. Cells were then treated with 1 nM daclatasvir (provided by Bristol-Myers Squibb, NYC, NY) to stop HCV replication and infectious virus secretion (a dose 36 times the reported EC50 [19]) or 200 μM naringenin to block HCV secretion (a dose reported to block 74% of JFH-1 HCVcc secretion; Goldwasser et al., 2011). Cultures were immediately placed back at 37°C and at indicated times post-treatment, medium was harvested from replicate wells (the number of replicate wells included in each experiment is indicated in Figure 4). Because the goal was to compare HCV disappearance from the media in the absence and presence of a confluent cell monolayer, and the cells completely covered the bottom of the cell culture-treated 96-well plate in which they were plated, we utilized non-cell cultured treated plastics for the ‘no cell’ condition.

Mouse liver RNA was added as an internal extraction efficiency control and total RNA was isolated using an ABI PRISM 6100 Nucleic Acid Prepstation (Applied Biosystems), using the manufacturer’s instructions. RNA was used for random primed cDNA synthesis using Fermentas reverse transcriptase reagents (ThermoScientific), followed by real-time PCR quantification in technical replicate using an Applied Biosystems 7300 real-time thermocycler (Applied Biosystems). Thermal cycling consisted of an initial denaturation step for 10 min at 95°C followed by 40 cycles of denaturation (15 s at 95°C) and annealing/extension (1 min at 60°C). HCV levels were determined relative to an HCV standard curve and normalized to carrier RNA levels (as a control for recovery efficiency). The PCR primers used to detect HCV were 5’-CGACACTCCACCATAGATCACT-3’_ (sense) and 5’-GAGGCTGCACGACACTCATACT-3’_ (antisense).

Data availability

All data generated or analyzed during this study are included in the manuscript and supporting files.

References

Decision letter

  1. Niel Hens
    Reviewing Editor; Hasselt University & University of Antwerp, Belgium
  2. Päivi M Ojala
    Senior Editor; University of Helsinki, Finland
  3. Niel Hens
    Reviewer; Hasselt University & University of Antwerp, Belgium
  4. Melanie Prague
    Reviewer

In the interests of transparency, eLife publishes the most substantive revision requests and the accompanying author responses.

Thank you for submitting your article “Modeling hepatitis C virus kinetics in vivo and in vitro reveals the role of hepatocytes in virus clearance“ for consideration by eLife. Your article has been reviewed by 3 peer reviewers, including Niel Hens as the Reviewing Editor and Reviewer #1, and the evaluation has been overseen by Päivi Ojala as the Senior Editor. The following individual involved in review of your submission has agreed to reveal their identity: Melanie Prague (Reviewer #3).

The reviewers have discussed the reviews with one another and the Reviewing Editor has drafted this decision to help you prepare a revised submission.

As the editors have judged that your manuscript is of interest, but as described below that additional experiments are required before it is published, we would like to draw your attention to changes in our revision policy that we have made in response to COVID-19 (https://elifesciences.org/articles/57162). First, because many researchers have temporarily lost access to the labs, we will give authors as much time as they need to submit revised manuscripts. We are also offering, if you choose, to post the manuscript to bioRxiv (if it is not already there) along with this decision letter and a formal designation that the manuscript is “in revision at eLife“. Please let us know if you would like to pursue this option. (If your work is more suitable for medRxiv, you will need to post the preprint yourself, as the mechanisms for us to do so are still in development.)

Summary:

Using mathematical modeling applied to a precise collection of blood samples in 5 patients, Shekhtman et al. evaluate the kinetics of hepatitis C viral load during and after liver transplantation. The data suggest that anhepatic (absence of liver) and early post-reperfusion phases of liver transplantation do not have similar HCV clearance rates, and therefore that the liver plays a major role not only in HCV production but also in HCV clearance. It shows indeed, in a fraction of the patients, maintenance of unchanged viral load during the anhepatic phase followed by a prompt decrease of HCV RNA titers upon reperfusion of the new liver graft. This drop could not be attributed to the transfusion of blood products and dilution of the virus load. In fact, the authors report a biphasic decrease of the viral load early after liver reperfusion, with a first abrupt drop in viremia in the first 20 minutes, attributed to HCV uptake in the new liver, and a subsequent slower decline in viral titers in the next 6 hours, suggested to correspond to the physiological HCV clearance rate in absence of new virus production, and in adequation with previous estimates.

This study consolidates previous reports on HCV viremia during liver transplantation, with a limited number of patients (5) but more extensive and precise sampling. The hepatic clearance of HCV is not completely surprising given the high vascularization of the liver. Also, as the authors point out, similar findings were reported by Ganesan et al. for adenovirus clearance, although in this latter study the liver sinusoidal endothelial cells were involved. The study emphasizes the need to clear HCV before performing a liver transplantation in order to prevent the infection of the liver graft. The conceptual advance is limited by the lack of mechanistic study but the authors share a unique dataset. Furthermore, some parts of the manuscripts need to be clarified and the in vitro aspect of the study needs to be better controlled and deepened to support the authors' claims.

Essential revisions:

1) Mathematical model.

Motivation: A clear motivation for the use of the mathematical model as is presented now is missing. The logical flow is there but how did the authors arrive to this model and not to another model as such. The authors should also highlight the novelty of their model as compared to previously published models on the same question. The mathematical modelling resembles in some ways the models by Powers K et al. (PMID 16447184) and Neumann et al. (PMID 9756471). Adequate references should be included and novelties in the proposed model highlighted. They could also comment on the use of the complete body fluid volume rather than the blood volume in their mathematical model; it is not clear for the non-initiated reader whether the HCV titer is the same in the different body fluids and whether all are affected in the same way by the transfusions and blood losses during surgery.

Description: The equation used could be made more accessible for a broad range of readers by introducing more thoroughly the variables (e.g. please introduce V already for equation 1) and including the dimensional analysis for each equation (e.g. [L][T]-1, etc. do c and P correspond to HCV RNA concentrations produced per unit of time?). Please provide a clear description of how t1/2 is derived from Equations 3-4.

Statistical methodology:

a. The description of statistical methods for calibration and fitting is very poor. P5 last paragraph. How do parameters in Table 1-3 relate to equation 2-3-4? Which ”regression models“ did the author fit? Authors also mentioned that they fitted model from equation 4, please provide the method. Is it simple least mean square? Why did the author did not adopt a population fitting approach such as described in Guedj et al. 2013 (https://doi.org/10.1073/pnas.1203110110) using (for example) the Monolix software (R package saemix could also be relevant)?

b. In the result section, I am confused how section 1, 2 and 3 relate? Can you explain better what is the added value of ”Viral kinetics before and during the anhepatic phase“ and ”Viral kinetics after graft reperfusion“, when a clearer/deeper description of the results in the “Modeling HCV kinetics“ would probably carry the same information? Please clarify the analysis done (as e.g. fitting individual data) and present the parameter values (effect sizes in Table 2; please do not use a median based on decreasing slopes only) etc. To what extent is the model well specified and parameters identifiable? It is disturbing to change the model of analysis because of data (see example of patient 5) – i.e. conditioning the model structure on data observation. If the model is flexible enough, it should be possible to fit the data assuming some parameters such as c very large. Being able to keep the same dynamical model for all patients would help warranting its validity. I strongly believe that analyzing jointly all the observed course of trajectories (before AH, during AH and after RP) will have a strong added value.

2) The in vitro evidence is weak and lack controls. Because it relies on a hepatoma cell line rather than primary cells and does not include any other cell type as a comparison the depicted assay does not support a larger role of hepatocytes as compared to other liver or non-liver cell types in HCV uptake. Furthermore, controls are missing that should show the complete block in viral RNA secretion in this system. In particular, liver sinusoidal endothelial cells were proposed by Ganesan and colleagues as playing a major role in virus uptake in the liver, and the role of this cell type should be tested if the authors want to make a claim on the cell type responsible for the post-transfusion decline in HCV titers. Also, there seems to be a confusion between technical and biological replicates in this in vitro data.

The cell culture experiment does not seem valid to test the author´s hypothesis and more specifically quantify the role of hepatocytes, as indicated by the authors. Additional controls and details would be instructive.

a. Are the hepatoma cells confluent (can one exclude virus adsorption to the dish)? Is the control condition (absence of cells, Figure 4A) in a tube or a cell culture-coated dish?

b. Why using HCV-infected cells in Figure 4B? The authors mentioned they want to avoid any initial rapid binding and influx of HCV as expected if using Huh7 cells, but wouldn´t this in fact mimic the situation of the reperfusion of a naive liver graft? Why not incubating the virus stock used in A on different (non-infected) cell culture dishes: empty dish (control for virus / viral RNA adsorption to plastic dish) vs. dish containing confluent monolayers of different cell types (different hepatocyte-derived cells, other liver cell types, non-liver cells…). This would be much easier to interpret than the proposed assay, where it is not clear whether virus production is directly abrogated at t=0 post-treatment. The authors should test other liver cells and liver-unrelated cells since they propose that “hepatocytes in particular“ play a major role in circulating HCV clearance. Ideally, the authors should test primary human hepatocytes and LSECs in parallel.

c. The authors should verify that their inhibitors indeed completely block HCV RNA secretion in the conditions tested (for instance by performing a medium change in similarly infected wells at t=0, after which the virus titer in the supernatant should remain at 0 if HCV RNA secretion is blocked). This is unlikely the case, at least for Naringerin: according to Goldwasser et al. (PMID 21354229), 200 μm Naringerin merely decreased 4 fold HCV RNA secretion.

3) Other essential revisions:

– Blood transfusion, which is an important confounder in the in vivo study, is not sufficiently described and discussed. Can you comment on the relevance of accounting for other covariates (from Table 1 put also possibly the length of HCV infection, type of treatments…). I bet there may be a lack of power in the study but a discussion of possible confounder could be added.

– The authors should discuss the potential role of extrahepatic HCV reservoirs in their study.

– Magnitude of results between in vivo and in vitro study should be better described and compared.

– Can you clarify why you did not model phase D i.e. >4h post RP, see Figure 2?

[Editors' note: further revisions were suggested prior to acceptance, as described below.]

Thank you for resubmitting your work entitled “Modeling hepatitis C virus kinetics during liver transplantation reveals the role of the liver in virus clearance“ for further consideration by eLife. Your revised article has been evaluated by Päivi Ojala (Senior Editor) and a Reviewing Editor.

The manuscript has been improved but there are some remaining issues that need to be addressed, as outlined below:

Both reviewers have acknowledged the authors' efforts in providing a revision of their work addressing most of their comments raised. There is, however, some more work needed to clarify some outstanding issues.

Reviewer #2:

The validity of the approach still suffers from several pitfalls:

1. HCV cell culture systems are mostly limited to cancer cell lines and a particular HCV genotype, hence justifying the approach used by the authors. These systems have proven very useful to dissect HCV replication cycle, however, it is not clear whether they are helpful to support the specific authors conclusions. In particular, the virus genotype, lipoprotein coat and most importantly specific infectivity is different in the cell culture system and might affect HCV genome stability and uptake. Indeed, the authors quantify HCV RNA as a readout for HCV half time. This is coherent with the in vivo readout (where infectivity is difficult to assess) but this RNA might be in completely different forms in JFH1 HCVcc as compared to infected patient serum. In fact, Lindenbach and colleagues, PNAS 2006, reported a 100x lower specific infectivity for cell culture virus as compared to virus retrieved from animals. The relative proportions of subgenomic, naked, encapsidated, enveloped, lipoviroparticle-associated, exosome-associated viral RNA might be completely different from what is found in patient serum samples. On the other hand, the cancer cell lines in culture might behave differently than hepatocytes in clearing HCV genome, whether by uptake or RNase degradation inside or outside the cells. Would any other cancer cell line give the same clearance effect? If yes, how does it support the authors’ point: does the liver clear many viruses simply because it is very vascularized?

2. I agree that the definition of biological replicates is problematic and subject to interpretation in particular with cell lines. However, as stated in the authors’ response, biological replicates refer to “biologically distinct samples“. If I understood well, the “biological duplicates“ described in Figure 4 are replicate wells of the Huh7 cell line that were seeded, treated and infected in parallel, with the same cell passage, virus and inhibitor stocks, on the same day, which to me does not quality as biologically distinct samples, and the variation observed between these wells is mostly technical (as opposed to different mice in an animal experiment for instance). I therefore recommend removing “biological duplicate“ from the figure legend. Since the data shown is representative of 2 experiments, the conclusion would be stronger by averaging the 2 independent experiments.

Given the low impact of the cell culture experiment on the authors conclusions and its strong limitations, I recommend the authors significantly reinforce the in vitro evidence and discuss the remaining limitations more in detail (as discussed above and in the previous review: testing other cell types, checking infectivity in addition to genome copies, etc).

Reviewer #3:

Figure 1 could be made of 2 figures: 1/ the existing one 2/ a zoom in in the first few hours.

https://doi.org/10.7554/eLife.65297.sa1

Author response

Essential revisions:

1) Mathematical model.

Motivation: A clear motivation for the use of the mathematical model as is presented now is missing. The logical flow is there but how did the authors arrive to this model and not to another model as such. The authors should also highlight the novelty of their model as compared to previously published models on the same question. The mathematical modelling resembles in some ways the models by Powers K et al. (PMID 16447184) and Neumann et al. (PMID 9756471). Adequate references should be included and novelties in the proposed model highlighted. They could also comment on the use of the complete body fluid volume rather than the blood volume in their mathematical model; it is not clear for the non-initiated reader whether the HCV titer is the same in the different body fluids and whether all are affected in the same way by the transfusions and blood losses during surgery.

We have cited Neumann et al. before introducing Equation 2 in the revised manuscript (Line 217). We also note that the reviewer may have overlooked that Powers et al. was already cited in the original submission. To enhance clarity, we add “Powers et al” before its citation in the revised manuscript (Line 226).

Regarding the choices in the model, we have expanded our model description to better explain and justify some of the modelling choices (Lines 222, 233-235, 243-249). We also make it clear what is novel about Equation 4 in the revised manuscript (see the paragraph in the Discussion that begins with “Another novel finding…”).

In addition, the referee makes an important point about the use of total extracellular body fluid volume compared to the blood volume and the issue of HCV titers in different body fluids. Several studies have previously reported that HCV RNA can be detected in different human body fluids of HCV-infected patients (refs 7-14 in the revised manuscript), supporting our decision to account for the entire extracellular body fluid volume in our model (Lines243-248). Since transfusions are mainly given to compensate for blood loss and HCV viral load is typically higher by several orders of magnitude in the blood compared to the other body fluids, we also included in the revised manuscript a supplementary Table S1 to show that using just blood volume of 5L (compared to 15L of entire extracellular body fluid volume including blood) did not significantly affect the results of the study. We made it clear in Methods of the revised manuscript about the studies showing that HCV is present in various body fluids of infected patients and note the additional supplementary modeling results using 5L of body fluid volume (Lines 75 and 85).

Description: The equation used could be made more accessible for a broad range of readers by introducing more thoroughly the variables (e.g. please introduce V already for equation 1) and including the dimensional analysis for each equation (e.g. [L][T]-1, etc. do c and P correspond to HCV RNA concentrations produced per unit of time?). Please provide a clear description of how t1/2 is derived from Equations 3-4.

We have included descriptions of variables immediately where they appear (such as V in Equation 1) and added a discussion of the dimensions of each variable (Lines 222, 238-240). Lastly, we added equations in Tables 4 and 5 showing how HCV t1/2 was derived from the HCV clearance parameters, CAH, C0 and CRP in Equations (3)-(4). We also for clarity renamed viral clearance (c) during AH as cAH and during RP as cRP.

Statistical methodology:

a. The description of statistical methods for calibration and fitting is very poor. P5 last paragraph. How do parameters in Table 1-3 relate to equation 2-3-4? Which “regression models” did the author fit? Authors also mentioned that they fitted model from equation 4, please provide the method. Is it simple least mean square? Why did the author did not adopt a population fitting approach such as described in Guedj et al. 2013 (https://doi.org/10.1073/pnas.1203110110) using (for example) the Monolix software (R package saemix could also be relevant)?

We have expanded significantly on our model calibration and fitting approach description in the revised manuscript (Lines 256-258). All models were indeed fit using least squares and with the Trust Region Reflective Algorithm (‘trf’) as implemented in Scipy.

We also described in the Results sections on viral kinetics (Lines 55, 64-65), in Methods (Lines 258-9), and in table legends (Lines 411 and 426) that Tables 2-3 are the results of linear regression. The modelling section now clearly emphasizes that only there is the modelling applied, whereas the kinetics section only using linear regression.

Because population modeling approaches are not designed for studies with small N (N<~8), we did not originally include this approach. However, we went ahead and explored it as the reviewer suggested and confirmed that it is not suitable for the current study. We added a new paragraph in the Discussion of the revised manuscript about this (Lines 159-174).

The following results (Author response table 1; Author response table 2 and Author response table 3) are from Monolix after assuming similar probability distribution for all model parameters among all 5 Cases wrongly predicted a viral decline (instead of a plateau) during the anhepatic phase in Cases 1-3.

Author response table 1
Maximum likelihood estimates of the model parameters using mixed effects modeling in the software Monolix.

The mixed-effects model assumes a population probability distribution with form: logxN(logx^,ωx2) with x representing parameters κ, cah, crp and c0, and a population probability distribution: xN(x^,ωx2) for parameter  log10V0. Parameters cah and crp represent the virus clearance rate c during the anhepatic phase and the final virus clearance rate after liver graft reperfusion, respectively. %RSE is the residual standard error and quantifies the identifiability of a parameter with the available data—%RSE greater than 50% means that the parameter is not identifiable. With these parameters the estimated median of the HCV t1/2 during the anhepatic phase and after liver graft reperfusion are 99 and 101 minutes, respectively, and the initial HCV t1/2 right after the anhepatic phase is 0.004 minutes. These estimations are based assuming the total fluid volume before surgery F(0)=1000mlL×15L70Kg×weight (kg), having F units of mL.

Mixed effects modelParameterUnitsValue%RSE*
Fixed effects(Population value, x^)κ^1/hr5.1325.3
c^ah 1/hr0.4223
c^rp1/hr0.4133.2
c^01/hr10337.1235*
log10V0Log10 IU/mL5.68.29
Standard deviation of the random effects(variability in the population, ωx)ωκ1/hr0.15132*
ωcah1/hr0.2985.6*
ωcrp1/hr0.6935.6
ω01/hr1.6590.6*
ωlog10V0Log10 IU/mL1.0431.7
Author response table 2
Individual parameter estimates using Monolix.

These are the parameters used for the model fits in Author response image 1.

idκ[1/hr]cah[1/hr]crp[1/hr]c0[1/hr]log10V0[Log10 IU/mL]
p14.590.390.5133095.236.42
p25.620.480.723997.186.15
p35.290.40.4418529.585.47
p44.730.570.6928783.436.34
p55.650.340.133281.263.65
Author response table 3
Individual estimates of HCV half-life using values from Author response table 2.
idκ1/daysHCV t1/2 [min]during anhepatic phaseHCV t1/2 [min] after liver graft reperfusionInit. HCV t1/2 [min]after liver graft reperfusion
p1110.16106.6481.550.001
p2134.8886.6457.760.010
p3126.96103.9794.520.002
p4113.5272.9660.270.001
p5135.60122.32319.910.013
Author response image 1
Model fits from Monolix using parameters from Author response table 2.

*, Residual standard error, RSE, higher than 50% is considered not identifiable.

The following results (Author response image 2; Author response table 4 and Author response table 5; Author response table 6) are after assuming a bimodal distribution for the virus clearance during the anhepatic phase (i.e., different parameter medians for Cases 1-3, and Cases 4 and 5, respectively) reproduced the viral plateau observed on Cases 1-3, but most of the model parameters were no longer identifiable (%RSE>50, see Author response table 4):

Author response image 2
Model fits from Monolix using parameters from Author response table 4.
Author response table 4
Maximum likelihood estimates of the model parameters using mixed effects modeling in the software Monolix.

The mixed-effects model assumes a population probability distribution with form: logxN(logx^,ωx2) with x representing parameters κ, crp and c0, and a population probability distribution: xN(x^,ωx2) for parameter  log10V0. Parameter cah had distribution logcahN(logc^ah+β,ωx2) with β=0 for patients 1-3 (i.e. c^ahp13 =c^ah) and β>0 for patients 4-5 (i.e. c^ahp45 =c^aheβ). Parameters cah and crp represent the virus clearance rate c during the anhepatic phase and the final virus clearance rate after liver graft reperfusion, respectively. As before, %RSE greater than 50% means that the parameter is not identifiable. With these parameters the estimated median of the HCV t1/2 during the anhepatic phase are 16 hours and 98 minutes for patients 1-3 and patients 4-5, respectively (not enough data to test significance). The median of the HCV t1/2 after liver graft reperfusion was 99 minutes, respectively, and the initial HCV t1/2 right after the anhepatic phase is 0.004 minutes. These estimations are based assuming the total fluid volume before surgery F(0)=1000mlL×15L70Kg×weight (kg), having F units of mL.

Mixed effects modelParameterUnitsValue%RSE*
Fixed effects(Population value, x^)κ^1/hr6.4122.6
c^ahp13 1/hr0.043309*
c^ahp45 1/hr0.42136*
c^rp1/hr0.4232.4
c^01/hr106223.9238*
log10V0Log10 IU/mL5.548.29
Standard deviation of the random effects(variability in the population, ωx)ωκ1/hr0.1778.9*
ωcah1/hr0.569.5*
ωcrp1/hr0.6735.5
ω01/hr1.06201*
ωlog10V0Log10 IU/mL1.0231.7
Author response table 5
Individual parameter estimates using Monolix.

These are the parameters used for the model fits in Author response image 2.

idκ[1/hr]cah[1/hr]crp[1/hr]c0[1/hr]log10V0[Log10 IU/mL]
p15.470.0460.52214764.416.31
p27.420.0470.7274381.696.05
p36.470.0450.44155523.875.34
p45.640.630.71167066.16.36
p57.30.30.1470417.293.63
Author response table 6
Individual estimates of HCV half-life using values from Author response table 5.
idκ1/daysHCV t1/2 [min]during anhepatic phaseHCV t1/2 [min] after liver graft reperfusionInit. HCV t1/2 [min]after liver graft reperfusion
p1131.28904.1179.980.0002
p2178.08884.8757.760.0006
p3155.28924.2094.520.0003
p4135.3666.0158.580.0002
p5175.20138.63297.060.0006

*, Residual standard error, RSE, higher than 50% is considered not identifiable.

b. In the result section, I am confused how section 1, 2 and 3 relate? Can you explain better what is the added value of “Viral kinetics before and during the anhepatic phase“ and ”Viral kinetics after graft reperfusion“, when a clearer/deeper description of the results in the “Modeling HCV kinetics“ would probably carry the same information? Please clarify the analysis done (as e.g. fitting individual data) and present the parameter values (effect sizes in Table 2; please do not use a median based on decreasing slopes only) etc. To what extent is the model well specified and parameters identifiable? It is disturbing to change the model of analysis because of data (see example of patient 5) – i.e. conditioning the model structure on data observation. If the model is flexible enough, it should be possible to fit the data assuming some parameters such as c very large. Being able to keep the same dynamical model for all patients would help warranting its validity. I strongly believe that analyzing jointly all the observed course of trajectories (before AH, during AH and after RP) will have a strong added value.

We agree that an alternative structure for the paper could incorporate the modelling results immediately after the model description, however we believe that among the journal’s interdisciplinary audience there are likely many non-modeler readers who prefer a separate Results section enabling them to understand the key biological findings of the paper and who will only briefly review the modeling details in the methods section. Such structures of a separate methods and modeling section are common in cross-disciplinary publications, and we chose to continue that pattern as we believe it is most effective approach for broad audiences. Lastly, we have been requested by eLife’s production editor to locate the Methods section in the end of the manuscript (after the Discussion section).

Regarding the issue of HCV kinetics during the anhepatic phase, we have revised Table 2 to include the decrease in slope for all patients regardless of whether that decrease was statistically significant.

Regarding the modeling choices for Case (patient) 5, the decision to revise the model for that patient was because that Case 5 does not experience a second viral decline slope post-reperfusion phase, which is why the two different slopes are needed for the other 4 cases. Since this patient only has a single slope after graft reperfusion, there would indeed be identifiability issues with that Case if the same biphasic model were used, e.g., the first slope could be fixed and parameter kappa could just be very large, or the second slope could simply be equal to the first slope. We agree that ideally the model would not need to be altered in this way, however, Case 5 is unique in several ways as the HCV RNA measurements for this Case were lower to begin with and primarily only decreased during the anhepatic phase itself. The reason for this is not clear.

Lastly, regarding a single model for all trajectories, we would like to note that the model during the various different periods Equations (1)-(4) all have many of the same parameters and the same basic structure of clearance. While we appreciate the referee’s suggestion to combine these into a single model, we feel this is impractical as the model must incorporate the discrete nature of the transplantation process and thereby will have to have some discontinuities (at the times where the liver is removed and then reattached). Likewise, the patient receives fluid input and loses fluid during the anhepatic and graft reperfusion phases in different amounts. We noted in the revised manuscript that we use two models that were separately calibrated with data measured during the anhepatic phase and graft reperfusion in a new paragraph in the Discussion that begins with the words “Two models (Equations 3 and 4) were used……” (Lines 159-174).

2) The in vitro evidence is weak and lack controls. Because it relies on a hepatoma cell line rather than primary cells and does not include any other cell type as a comparison the depicted assay does not support a larger role of hepatocytes as compared to other liver or non-liver cell types in HCV uptake.

The Reviewer is correct that the assay performed does not speak to a larger role of hepatocytes as compared to other cell types as our goal was not to compare the relative contributions, but to only support the possible contribution of hepatocytes. We independently observed this phenomenon in our in vitro experiments and felt that including this intriguing parallel data enhances the interest of this primarily in vivo study as it suggests a novel clearance mechanism not previously considered and opens the door to further detailed investigation (Line 110).

Furthermore, controls are missing that should show the complete block in viral RNA secretion in this system.

Because the two inhibitors utilized are extremely well characterized and their inhibition of JFH-1 HCVcc infection in vitro had been quantitatively evaluated many times, we did not repeat that analysis in this publication. That being said, we did fail to provide the necessary references documenting this pre-existing data and have now provided the appropriate references (references 19 and 20 in the current version). Additionally, we have added a sentence to the discussion highlighting the important fact that if these inhibitors did not block secretion completely, that the difference in ½ life between the cell/no cell condition would be even greater (Line 180-182). Hence, the lack of complete inhibition would not reduce the effect we have observed, but rather enhance it.

In particular, liver sinusoidal endothelial cells were proposed by Ganesan and colleagues as playing a major role in virus uptake in the liver, and the role of this cell type should be tested if the authors want to make a claim on the cell type responsible for the post-transfusion decline in HCV titers.

Indeed, if we were trying to make a claim regarding the relative role of hepatocytes verses other cells within the liver, then it would be important to test the various cell types in parallel. However, as noted above, that was not our goal.

Additionally, thinking about how one might go about trying to quantify the relative contributions, we would be hesitant to extrapolate quantitatively from in vitro cell culture conditions to the in vivo situation as different cell types do not necessarily maintain similar levels on in vivo function in vitro. We have done our best to go through the manuscript and make sure we have not suggested that hepatocytes contribute to liver uptake more or less than cell types.

Also, there seems to be a confusion between technical and biological replicates in this in vitro data.

Respectfully, we have utilized the standardly accepted definitions articulated by the NIH:

– Biological replicates are parallel measurements of biologically distinct samples

that capture random biological variation, which may itself be a subject of study or a source of noise.

– Technical replicates are repeated measurements of the same sample that represent independent measures of the random noise associated with protocols or equipment.

By this NIH definition the duplicate wells in the experiment (previously mentioned on page 6 and noted by the reviewer in the comment above) are biological replicates as stated by the NIH, i.e. parallel measurements of biologically distinct samples. These biological replicates were then measured in technical replicate by RT-qPCR (i.e. repeat measurements of the same sample). As is standard, we then simply state how many times a particular experiment was repeated.

The cell culture experiment does not seem valid to test the author´s hypothesis and more specifically quantify the role of hepatocytes, as indicated by the authors. Additional controls and details would be instructive.

As noted above, our goal was not to compare the relative contribution, but to only support the possible contribution of hepatocytes. Again, we have made sure that no suggestion of this is contained within the manuscript.

a. Are the hepatoma cells confluent (can one exclude virus adsorption to the dish)? Is the control condition (absence of cells, Figure 4A) in a tube or a cell culture-coated dish?

These non-growing cells were completely confluent. At ~60,000 cells per well, the cells are packed in with absolutely none of the 96 well plate bottom exposed. As such, we utilized non-cell culture treated plastics for the no cell condition to avoid the virus binding to bottom of the wells. We have added this information to the M&M (Lines 277-278).

b. Why using HCV-infected cells in Figure 4B? The authors mentioned they want to avoid any initial rapid binding and influx of HCV as expected if using Huh7 cells, but wouldn´t this in fact mimic the situation of the reperfusion of a naive liver graft?

Our intent was not to try and mimic the in vivo situation, but rather to specifically determine if our hepatoma cells exhibited an alternative HCV uptake aside from the known infectious virus uptake observed by uninfected cells. We know that if we put virus on uninfected Huh7 cells, that it will be taken up. It has also been published that the Huh7-based HCV infection system exhibits superinfection exclusion (PMID: 17287280, 17301154). Hence, we designed the experiment to specifically test if the presence of infected Huh7 cells would result in clearance of HCV from the media.

That being said, it is also worth pointing out that to the extent that we might want to mimic the in vivo condition… it is not the post-reperfusion phase we would try to recapitulate. The more informative situation to mimic, which our in vitro experimental design does do to some extent, is the comparison between the PRE-transplant condition vs the anhepatic phase. What is most telling in the in vivo experiment is that pre-transplant HCV levels are at steady-state indicative of balanced viral production and viral clearance and that surprisingly once the liver is removed, that HCV levels remain at steady state in the majority of patients even though the main source of viral production has been removed (it is this transition that indicates that the liver is also involved in clearance from the serum). in vitro, we have shown many times that we achieve a steady state chronic infection. Because we can control the in vitro situation more precisely, we not only “removed the producer cells completely analogous to the anhepatic phase (by incubating the steady state HCV containing media in the absence of cells), but also additionally blocked virus production while leaving the cells present (by utilizing inhibitors to block virus production). This allowed us to directly compare the intrinsic ½ life of the virus (i.e., in the absence of cells) to the ½ life measured in the presence of the cells not actively secreting virus.

Of note, we do mention in the Discussion that the ½ life of HCV measured in chronically infected patients treated with DSV is ~45 minutes, which not surprisingly is much faster than the 14 hour ½ life measured in vitro which lacks all the other cells and blood components present in vivo, including anti-HCV antibodies.

Why not incubating the virus stock used in A on different (non-infected) cell culture dishes: empty dish (control for virus / viral RNA adsorption to plastic dish) vs. dish containing confluent monolayers of different cell types (different hepatocyte-derived cells, other liver cell types, non-liver cells…). This would be much easier to interpret than the proposed assay, where it is not clear whether virus production is directly abrogated at t=0 post-treatment. The authors should test other liver cells and liver-unrelated cells since they propose that “hepatocytes in particular“ play a major role in circulating HCV clearance. Ideally, the authors should test primary human hepatocytes and LSECs in parallel.

All of the above, is repetition of the points above and has been answered. Importantly, we have removed the phrase “hepatocytes in particular” and “particularly hepatocytes.” This was just intended to emphasize that our data suggested hepatocytes may be involved, not to suggest exclusivity and so we removed the problematic language. Accordingly, we also edited the title of the revised manuscript and noted of future research needed in Lines 203-205.

c. The authors should verify that their inhibitors indeed completely block HCV RNA secretion in the conditions tested (for instance by performing a medium change in similarly infected wells at t=0, after which the virus titer in the supernatant should remain at 0 if HCV RNA secretion is blocked). This is unlikely the case, at least for Naringerin: according to Goldwasser et al. (PMID 21354229), 200 μm Naringerin merely decreased 4 fold HCV RNA secretion.

As the reviewer points out, the effect of these inhibitors is established in the literature. As noted above, we have now provided references for this and indicate in the manuscript that any residual secretion occurring would only serve to make the measure ½ life of the virus longer in the cell-containing situation (19 and 20 in the revised manuscript). As such, the expected lack of complete inhibition would reduce the effect we are observing meaning that we are measuring the minimal possible effect of the cells (Lines 185-187).

3) Other essential revisions:

– Blood transfusion, which is an important confounder in the in vivo study, is not sufficiently described and discussed. Can you comment on the relevance of accounting for other covariates (from Table 1 put also possibly the length of HCV infection, type of treatments…). I bet there may be a lack of power in the study but a discussion of possible confounder could be added.

To clarify the issues about blood transfusion in the model, we increased our discussion of the parameters i and F, which are both related to this important issue (Lines 253-254 and 62-63). We have also shifted the raw values of the blood input to revised Table 1 and then provided in the revised Tables 4-5 the actual values of parameter i. We also included in the revised Tables 4-5 the value of F, which is determined based on the patient weight. Regarding treatment, we mentioned in the Methods of the original manuscript (Lines 210-211 in the revised manuscript) about the treatment with 500 mg methylprednisolone immediately before laparotomy and 500 mg during graft reperfusion. In relation to the length of chronic HCV infection, it is difficult to know as these individuals reached the point of needing transplantation, suggesting that the length of infection could be on the order of many years. We certainly also agree about a lack of power in the study, however we have very frequent sampling enabling us to better understand what occurs in each phase compared to previous studies noted in the manuscript (Lines 38-39). We discussed challenges (or confounders) and limitations of the small but unique kinetic data in Lines 172-175.

– The authors should discuss the potential role of extrahepatic HCV reservoirs in their study.

Indeed, we previously observed, in some patients, an extremely slow viral slope post reperfusion and predicted, via mathematical modeling, the existence of extrahepatic HCV contribution compartment (ref 1 in the revised manuscript). While we cannot rule out that the extremely slow viral load slope post reperfusion in Case 5 represents the predicted extrahepatic (or second) replication compartment, it seems unlikely since both during the 4 hr post reperfusion and beyond (until viral resurged, as shown in the revised Figure 1) HCV t1/2 was on the order of hours (see a new Table S3), whereas the extrahepatic clearance in our previous report was on the order of days (see Table 1 in aforementioned ref 1 ). This was added to the Discussion of the revised manuscript (Lines 152-158).

– Magnitude of results between in vivo and in vitro study should be better described and compared.

As noted above, we would not presume to compare the effects quantitatively between the in vitro and in vivo situation which are different in multiple ways. The in vitro experiment here was provided simply to make the point that it is possible that hepatocytes contribute to the clearance observed in vivo. It is intended a conceptual comparison.

– Can you clarify why you did not model phase D i.e. >4h post RP, see Figure 2?

The focus of this paper was primarily on a high-resolution analysis of the early time during and immediately after reperfusion. Many previous studies such as Dahari et al. (Ref 1) and Powers et al. (ref 5) have modeled and analyzed the long-term dynamics post reperfusion, thus we did not feel the need to go in depth on this point.

[Editors' note: further revisions were suggested prior to acceptance, as described below.]

The manuscript has been improved but there are some remaining issues that need to be addressed, as outlined below:

Both reviewers have acknowledged the authors' efforts in providing a revision of their work addressing most of their comments raised. There is, however, some more work needed to clarify some outstanding issues.

Reviewer #2:

The validity of the approach still suffers from several pitfalls:

1. HCV cell culture systems are mostly limited to cancer cell lines and a particular HCV genotype, hence justifying the approach used by the authors. These systems have proven very useful to dissect HCV replication cycle, however, it is not clear whether they are helpful to support the specific authors conclusions. In particular, the virus genotype, lipoprotein coat and most importantly specific infectivity is different in the cell culture system and might affect HCV genome stability and uptake. Indeed, the authors quantify HCV RNA as a readout for HCV half time. This is coherent with the in vivo readout (where infectivity is difficult to assess) but this RNA might be in completely different forms in JFH1 HCVcc as compared to infected patient serum. In fact, Lindenbach and colleagues, PNAS 2006, reported a 100x lower specific infectivity for cell culture virus as compared to virus retrieved from animals. The relative proportions of subgenomic, naked, encapsidated, enveloped, lipoviroparticle-associated, exosome-associated viral RNA might be completely different from what is found in patient serum samples. On the other hand, the cancer cell lines in culture might behave differently than hepatocytes in clearing HCV genome, whether by uptake or RNase degradation inside or outside the cells. Would any other cancer cell line give the same clearance effect? If yes, how does it support the authors’ point: does the liver clear many viruses simply because it is very vascularized?

The in vitro experiment is provided to support what is primarily an in vivo study. The Reviewer acknowledges “the low impact of the cell culture experiment on the authors conclusions” (see Reviewer comment #2 below), which is simply that hepatocytes may be involved in viral clearance, and that additional investigation is needed (lines 13-14 and 113, respectively). We believe this relegates the limitations of the in vitro experiment to a relatively minor issue. We provide the in vitro data because it surprisingly parallels what was observed in vivo and feel this is worth conveying.

There is no doubt that there are differences between in vitro and in vivo systems and we have done our best to clearly highlight this fact and note the extensive further analysis required before the cell culture data would allow final conclusions (lines 193-195; 200-209). However, to address some of the specific Reviewer comments, it is well known in the field that it is primarily the lipoprotein/lipid differences between the in vitro and in vivo HCV particles that cause the different specific infectivity (and not issues of subgenomic RNA or naked RNA). There are certainly different levels of exosomes in vitro and in vivo (and between cell types) but exosomes are a minor species in both cases. As such, we believe including this preliminary, but consistent, data from the widely used cell culture system strengths the in vivo data and is exciting because it suggests that we may indeed have a means to dissect this further in vitro, and importantly it opens up the possibility for the entire HCV research community to contribute to this effort. However, dissecting this further is a major undertaking which is beyond the scope of this paper. It is in fact the focus of an entire Aim in our recent NIH R01 renewal and will take years to complete (e.g. different cell lines, different primary cells, organoids, other viruses, different sources of HCV, etc.).

Because this is not a simple issue that can be addressed fully at this time, we have instead revised the manuscript to further explain the preliminary and purely supportive role of the in vitro experiment and discuss in more detail the obvious limitations and further work that might allow for the dissecting of this phenomena in vitro (lines 193-195; 200-209).

2. I agree that the definition of biological replicates is problematic and subject to interpretation in particular with cell lines. However, as stated in the authors’ response, biological replicates refer to “biologically distinct samples“. If I understood well, the “biological duplicates“ described in Figure 4 are replicate wells of the Huh7 cell line that were seeded, treated and infected in parallel, with the same cell passage, virus and inhibitor stocks, on the same day, which to me does not quality as biologically distinct samples, and the variation observed between these wells is mostly technical (as opposed to different mice in an animal experiment for instance). I therefore recommend removing “biological duplicate“ from the figure legend. Since the data shown is representative of 2 experiments, the conclusion would be stronger by averaging the 2 independent experiments.

Given the low impact of the cell culture experiment on the authors conclusions and its strong limitations, I recommend the authors significantly reinforce the in vitro evidence and discuss the remaining limitations more in detail (as discussed above and in the previous review: testing other cell types, checking infectivity in addition to genome copies, etc).

Respectfully, while the reviewer may not agree with the definition of biological replicate that is standard in the field (and defined by the NIH), that is the definition we are using. According to the common/NIH definition, technical replicates are when the same sample is measured multiple times (e.g., our qPCR replicates, which represent random noise associated with protocols or equipment). Biological replicates are parallel measurements of biologically distinct samples (e.g., our replicate wells, which capture random biological variation in replicate samples that are then measured in parallel). That being said, we have no issues removing the phrase “biological replicates” from the figure legend.

Additionally, as requested, we now showing the average of 2 no cell experiments in Figure 4A and the average of 3 daclatasvir experiments and 2 naringenin experiments in Figure 4B. We had already averaged the one representative DCV and NG experiments, but now average all five of the DCV and NG experiments. The data from all the individual experiment is provided in Figure 4 source data file. This should make it clear that the results are reproducible in multiple experiments even when two different inhibitors are used to block HCV secretion. We believe the additional data provided should put to rest any concerns about the data reproducibility/variability.

Reviewer #3:

Figure 1 could be made of 2 figures: 1/ the existing one 2/ a zoom in in the first few hours.

We have added the figure (i.e., Fig. 1B in the revised manuscript) as suggested by the referee and referenced the revised subpanels within the text (lines 39-40) and Figure 1 legend.

https://doi.org/10.7554/eLife.65297.sa2

Article and author information

Author details

  1. Louis Shekhtman

    1. The Program for Experimental & Theoretical Modeling, Division of Hepatology, Department of Medicine, Stritch School of Medicine, Loyola University Medical Center, Maywood, IL, United States
    2. Network Science Institute, Northeastern University, Boston, MA, United States
    Contribution
    Formal analysis, Investigation, Methodology, Writing – original draft, Writing – review and editing
    Contributed equally with
    Miquel Navasa and Natasha Sansone
    Competing interests
    No competing interests declared
    ORCID icon "This ORCID iD identifies the author of this article:" 0000-0001-5273-8363
  2. Miquel Navasa

    Liver Unit, Hospital Clínic, IDIBAPS and CIBEREHD, University of Barcelona, Barcelona, Spain
    Contribution
    Investigation, Methodology, Writing – original draft
    Contributed equally with
    Louis Shekhtman and Natasha Sansone
    Competing interests
    No competing interests declared
    ORCID icon "This ORCID iD identifies the author of this article:" 0000-0002-3130-9604
  3. Natasha Sansone

    1. The Program for Experimental & Theoretical Modeling, Division of Hepatology, Department of Medicine, Stritch School of Medicine, Loyola University Medical Center, Maywood, IL, United States
    2. Department of Microbiology & Immunology, University of Illinois Chicago, Chicago, IL, United States
    Contribution
    Formal analysis, Investigation, Methodology, Writing – review and editing
    Contributed equally with
    Louis Shekhtman and Miquel Navasa
    Competing interests
    No competing interests declared
  4. Gonzalo Crespo

    Liver Unit, Hospital Clínic, IDIBAPS and CIBEREHD, University of Barcelona, Barcelona, Spain
    Contribution
    Investigation, Writing – review and editing
    Competing interests
    No competing interests declared
  5. Gitanjali Subramanya

    The Program for Experimental & Theoretical Modeling, Division of Hepatology, Department of Medicine, Stritch School of Medicine, Loyola University Medical Center, Maywood, IL, United States
    Contribution
    Investigation, Methodology, Writing – review and editing
    Competing interests
    No competing interests declared
  6. Tje Lin Chung

    1. The Program for Experimental & Theoretical Modeling, Division of Hepatology, Department of Medicine, Stritch School of Medicine, Loyola University Medical Center, Maywood, IL, United States
    2. Institute for Biostatistics and Mathematical Modeling, Department of Medicine, Goethe Universität Frankfurt, Frankfurt, Germany
    Contribution
    Investigation, Methodology, Writing – original draft, Writing – review and editing
    Competing interests
    No competing interests declared
  7. E Fabian Cardozo-Ojeda

    1. The Program for Experimental & Theoretical Modeling, Division of Hepatology, Department of Medicine, Stritch School of Medicine, Loyola University Medical Center, Maywood, IL, United States
    2. Vaccine and Infectious Disease Division, Fred Hutchinson Cancer Research Center, Seattle, WA, United States
    Contribution
    Validation
    Competing interests
    No competing interests declared
    ORCID icon "This ORCID iD identifies the author of this article:" 0000-0001-8690-9896
  8. Sofía Pérez-del-Pulgar

    Liver Unit, Hospital Clínic, IDIBAPS and CIBEREHD, University of Barcelona, Barcelona, Spain
    Contribution
    Funding acquisition, Investigation, Writing – review and editing
    Competing interests
    No competing interests declared
    ORCID icon "This ORCID iD identifies the author of this article:" 0000-0002-9890-300X
  9. Alan S Perelson

    Theoretical Biology and Biophysics, Los Alamos National Laboratory, Los Alamos, NM, United States
    Contribution
    Funding acquisition, Writing – review and editing
    Competing interests
    No competing interests declared
    ORCID icon "This ORCID iD identifies the author of this article:" 0000-0002-2455-0002
  10. Scott J Cotler

    The Program for Experimental & Theoretical Modeling, Division of Hepatology, Department of Medicine, Stritch School of Medicine, Loyola University Medical Center, Maywood, IL, United States
    Contribution
    Writing – original draft, Writing – review and editing
    Competing interests
    No competing interests declared
  11. Xavier Forns

    Liver Unit, Hospital Clínic, IDIBAPS and CIBEREHD, University of Barcelona, Barcelona, Spain
    Contribution
    Conceptualization, Funding acquisition, Supervision, Writing – original draft, Writing – review and editing
    Competing interests
    XF acted as advisor for Gilead and AbbVie
    ORCID icon "This ORCID iD identifies the author of this article:" 0000-0002-8188-1764
  12. Susan L Uprichard

    1. The Program for Experimental & Theoretical Modeling, Division of Hepatology, Department of Medicine, Stritch School of Medicine, Loyola University Medical Center, Maywood, IL, United States
    2. The Infectious Disease and Immunology Research Institute, Stritch School of Medicine, Loyola University Medical Center, Maywood, IL, United States
    Contribution
    Conceptualization, Funding acquisition, Methodology, Supervision, Writing – original draft, Writing – review and editing
    For correspondence
    suprichard@luc.edu
    Competing interests
    No competing interests declared
    ORCID icon "This ORCID iD identifies the author of this article:" 0000-0001-5691-1557
  13. Harel Dahari

    The Program for Experimental & Theoretical Modeling, Division of Hepatology, Department of Medicine, Stritch School of Medicine, Loyola University Medical Center, Maywood, IL, United States
    Contribution
    Conceptualization, Formal analysis, Investigation, Methodology, Supervision, Writing – original draft, Writing – review and editing, Funding acquisition
    For correspondence
    hdahari@luc.edu
    Competing interests
    No competing interests declared
    ORCID icon "This ORCID iD identifies the author of this article:" 0000-0002-3357-1817

Funding

National Institute of Allergy and Infectious Diseases (R01-AI078881)

  • Susan L Uprichard

National Institute of Allergy and Infectious Diseases (R01-AI116868)

  • Alan S Perelson

Instituto de Salud Carlos III (PI15/00151)

  • Xavier Forns

Secretaria d'Universitats i Recerca del Departament d'Economia i Coneixement (grant 2017_SGR_1753)

  • Xavier Forns

CERCA Programme/Generalitat de Catalunya

  • Xavier Forns

Germany Academic Exchange Service

  • Tje Lin Chung

National Institute of General Medical Sciences (R01GM121600)

  • Harel Dahari

Instituto de Salud Carlos III (PI13/00155)

  • Sofía Pérez-del-Pulgar

National Institutes of Health (R01-OD011095)

  • Alan S Perelson

The funders had no role in study design, data collection and interpretation, or the decision to submit the work for publication.

Acknowledgements

The study was supported, in part, by U.S. National Institute of Health grants, R01-AI078881, R01-OD011095, R01GM121600, and R01-AI116868, Instituto de Salud Carlos III (PI15/00151 and PI13/00155,cofunded by the European Regional Development Fund [ERDF]) and by Secretaria d’Universitats i Recerca del Departament d’Economia i Coneixement (grant 2017_SGR_1753) and CERCA Programme/Generalitat de Catalunya, and Germany Academic Exchange Service.

Ethics

Human subjects: The study was approved by the Ethics Committee at Hospital Clinic Barcelona (Record 2010/5810) and all patients provided a written informed consent.

Senior Editor

  1. Päivi M Ojala, University of Helsinki, Finland

Reviewing Editor

  1. Niel Hens, Hasselt University & University of Antwerp, Belgium

Reviewers

  1. Niel Hens, Hasselt University & University of Antwerp, Belgium
  2. Melanie Prague

Version history

  1. Preprint posted: August 4, 2020 (view preprint)
  2. Received: November 29, 2020
  3. Accepted: November 1, 2021
  4. Accepted Manuscript published: November 3, 2021 (version 1)
  5. Version of Record published: November 22, 2021 (version 2)

Copyright

This is an open-access article, free of all copyright, and may be freely reproduced, distributed, transmitted, modified, built upon, or otherwise used by anyone for any lawful purpose. The work is made available under the Creative Commons CC0 public domain dedication.

Metrics

  • 469
    Page views
  • 74
    Downloads
  • 2
    Citations

Article citation count generated by polling the highest count across the following sources: Crossref, PubMed Central, Scopus.

Download links

A two-part list of links to download the article, or parts of the article, in various formats.

Downloads (link to download the article as PDF)

Open citations (links to open the citations from this article in various online reference manager services)

Cite this article (links to download the citations from this article in formats compatible with various reference manager tools)

  1. Louis Shekhtman
  2. Miquel Navasa
  3. Natasha Sansone
  4. Gonzalo Crespo
  5. Gitanjali Subramanya
  6. Tje Lin Chung
  7. E Fabian Cardozo-Ojeda
  8. Sofía Pérez-del-Pulgar
  9. Alan S Perelson
  10. Scott J Cotler
  11. Xavier Forns
  12. Susan L Uprichard
  13. Harel Dahari
(2021)
Modeling hepatitis C virus kinetics during liver transplantation reveals the role of the liver in virus clearance
eLife 10:e65297.
https://doi.org/10.7554/eLife.65297

Further reading

    1. Evolutionary Biology
    2. Microbiology and Infectious Disease
    Rebecca EK Mandt, Madeline R Luth ... Amanda K Lukens
    Research Article Updated

    Drug resistance remains a major obstacle to malaria control and eradication efforts, necessitating the development of novel therapeutic strategies to treat this disease. Drug combinations based on collateral sensitivity, wherein resistance to one drug causes increased sensitivity to the partner drug, have been proposed as an evolutionary strategy to suppress the emergence of resistance in pathogen populations. In this study, we explore collateral sensitivity between compounds targeting the Plasmodium dihydroorotate dehydrogenase (DHODH). We profiled the cross-resistance and collateral sensitivity phenotypes of several DHODH mutant lines to a diverse panel of DHODH inhibitors. We focus on one compound, TCMDC-125334, which was active against all mutant lines tested, including the DHODH C276Y line, which arose in selections with the clinical candidate DSM265. In six selections with TCMDC-125334, the most common mechanism of resistance to this compound was copy number variation of the dhodh locus, although we did identify one mutation, DHODH I263S, which conferred resistance to TCMDC-125334 but not DSM265. We found that selection of the DHODH C276Y mutant with TCMDC-125334 yielded additional genetic changes in the dhodh locus. These double mutant parasites exhibited decreased sensitivity to TCMDC-125334 and were highly resistant to DSM265. Finally, we tested whether collateral sensitivity could be exploited to suppress the emergence of resistance in the context of combination treatment by exposing wildtype parasites to both DSM265 and TCMDC-125334 simultaneously. This selected for parasites with a DHODH V532A mutation which were cross-resistant to both compounds and were as fit as the wildtype parent in vitro. The emergence of these cross-resistant, evolutionarily fit parasites highlights the mutational flexibility of the DHODH enzyme.

    1. Biochemistry and Chemical Biology
    2. Microbiology and Infectious Disease
    Rui-Qiu Yang, Yong-Hong Chen ... Cheng-Gang Zou
    Research Article Updated

    An imbalance of the gut microbiota, termed dysbiosis, has a substantial impact on host physiology. However, the mechanism by which host deals with gut dysbiosis to maintain fitness remains largely unknown. In Caenorhabditis elegans, Escherichia coli, which is its bacterial diet, proliferates in its intestinal lumen during aging. Here, we demonstrate that progressive intestinal proliferation of E. coli activates the transcription factor DAF-16, which is required for maintenance of longevity and organismal fitness in worms with age. DAF-16 up-regulates two lysozymes lys-7 and lys-8, thus limiting the bacterial accumulation in the gut of worms during aging. During dysbiosis, the levels of indole produced by E. coli are increased in worms. Indole is involved in the activation of DAF-16 by TRPA-1 in neurons of worms. Our finding demonstrates that indole functions as a microbial signal of gut dysbiosis to promote fitness of the host.