Evidence for additive and synergistic action of mammalian enhancers during cell fate determination
- Max Planck Institute for Biophysical Chemistry, Department of Molecular Biology, Germany
- Gene Regulation, Stem Cells and Cancer Program, Centre for Genomic Regulation (CRG), Spain
- Max Planck Institute for Biophysical Chemistry, Quantitative Biology and Bioinformatics, Germany
Figures
Figure 1 with 1 supplement
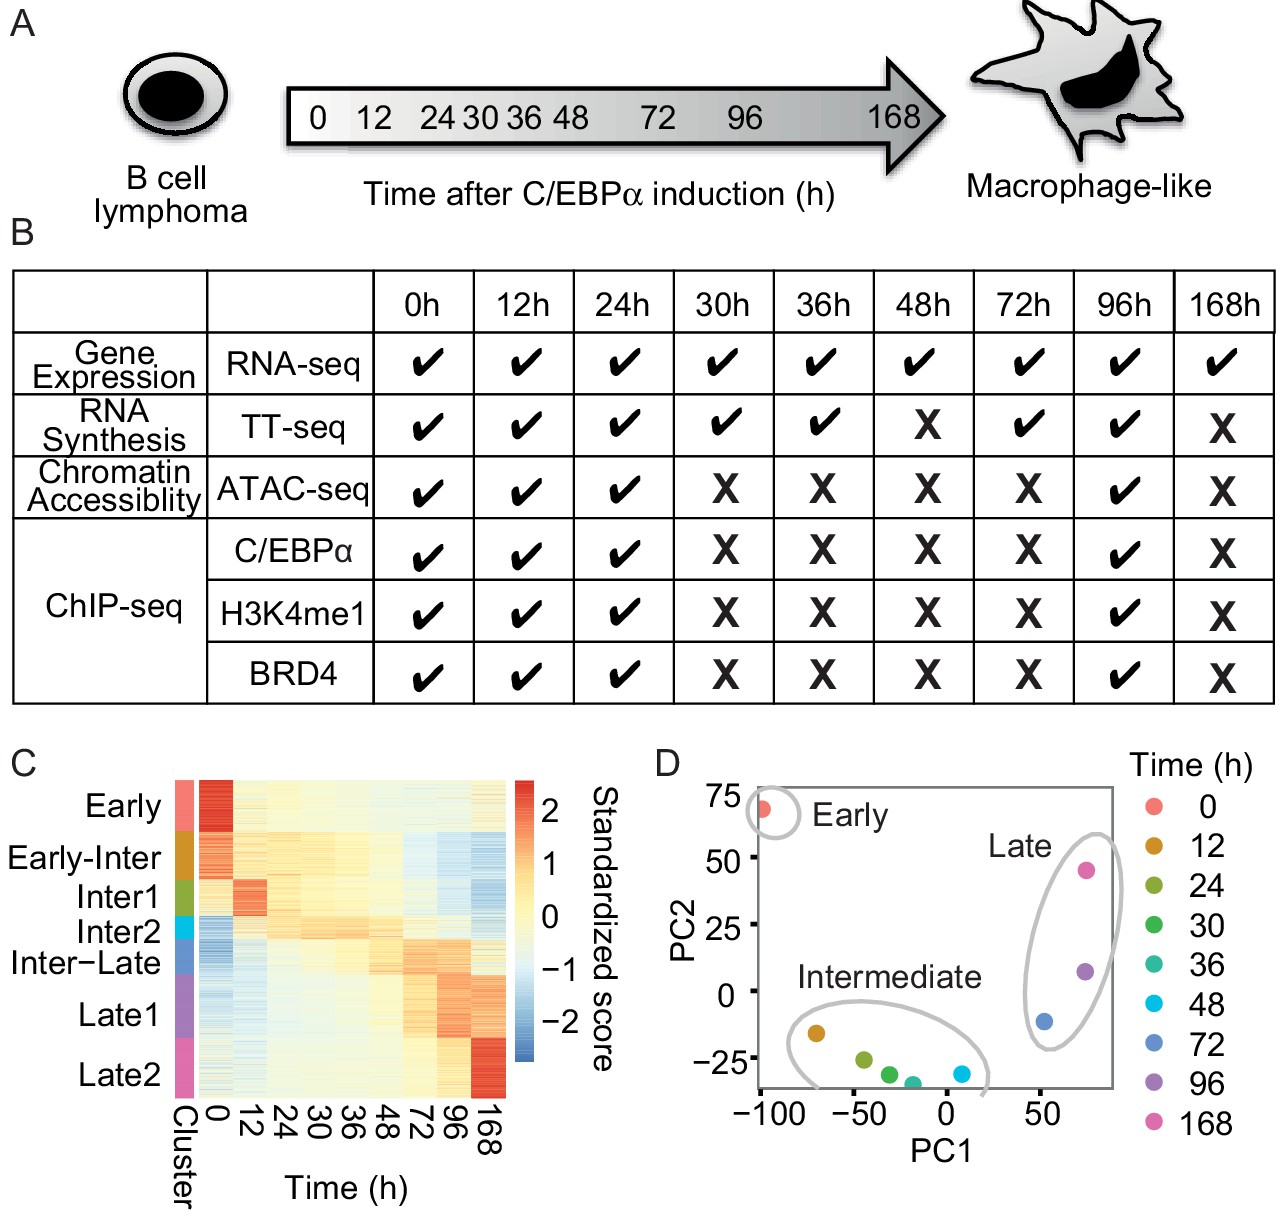
RNA-seq monitors two transitions during transdifferentiation.
(A) C/EBPα induces transdifferentiation from precursor leukemia B-cell to macrophage-like cells. (B) Genome-wide data sets collected at different time points during transdifferentiation. (C) Heatmap of differentially expressed genes (n = 5516) from RNA-seq (|log2(FC)|>1, FDR < 0.05) for seven clusters obtained with k-mean clustering. (D) PCA plot of differentially expressed genes from RNA-seq during transdifferentiation.
Figure 1—figure supplement 1
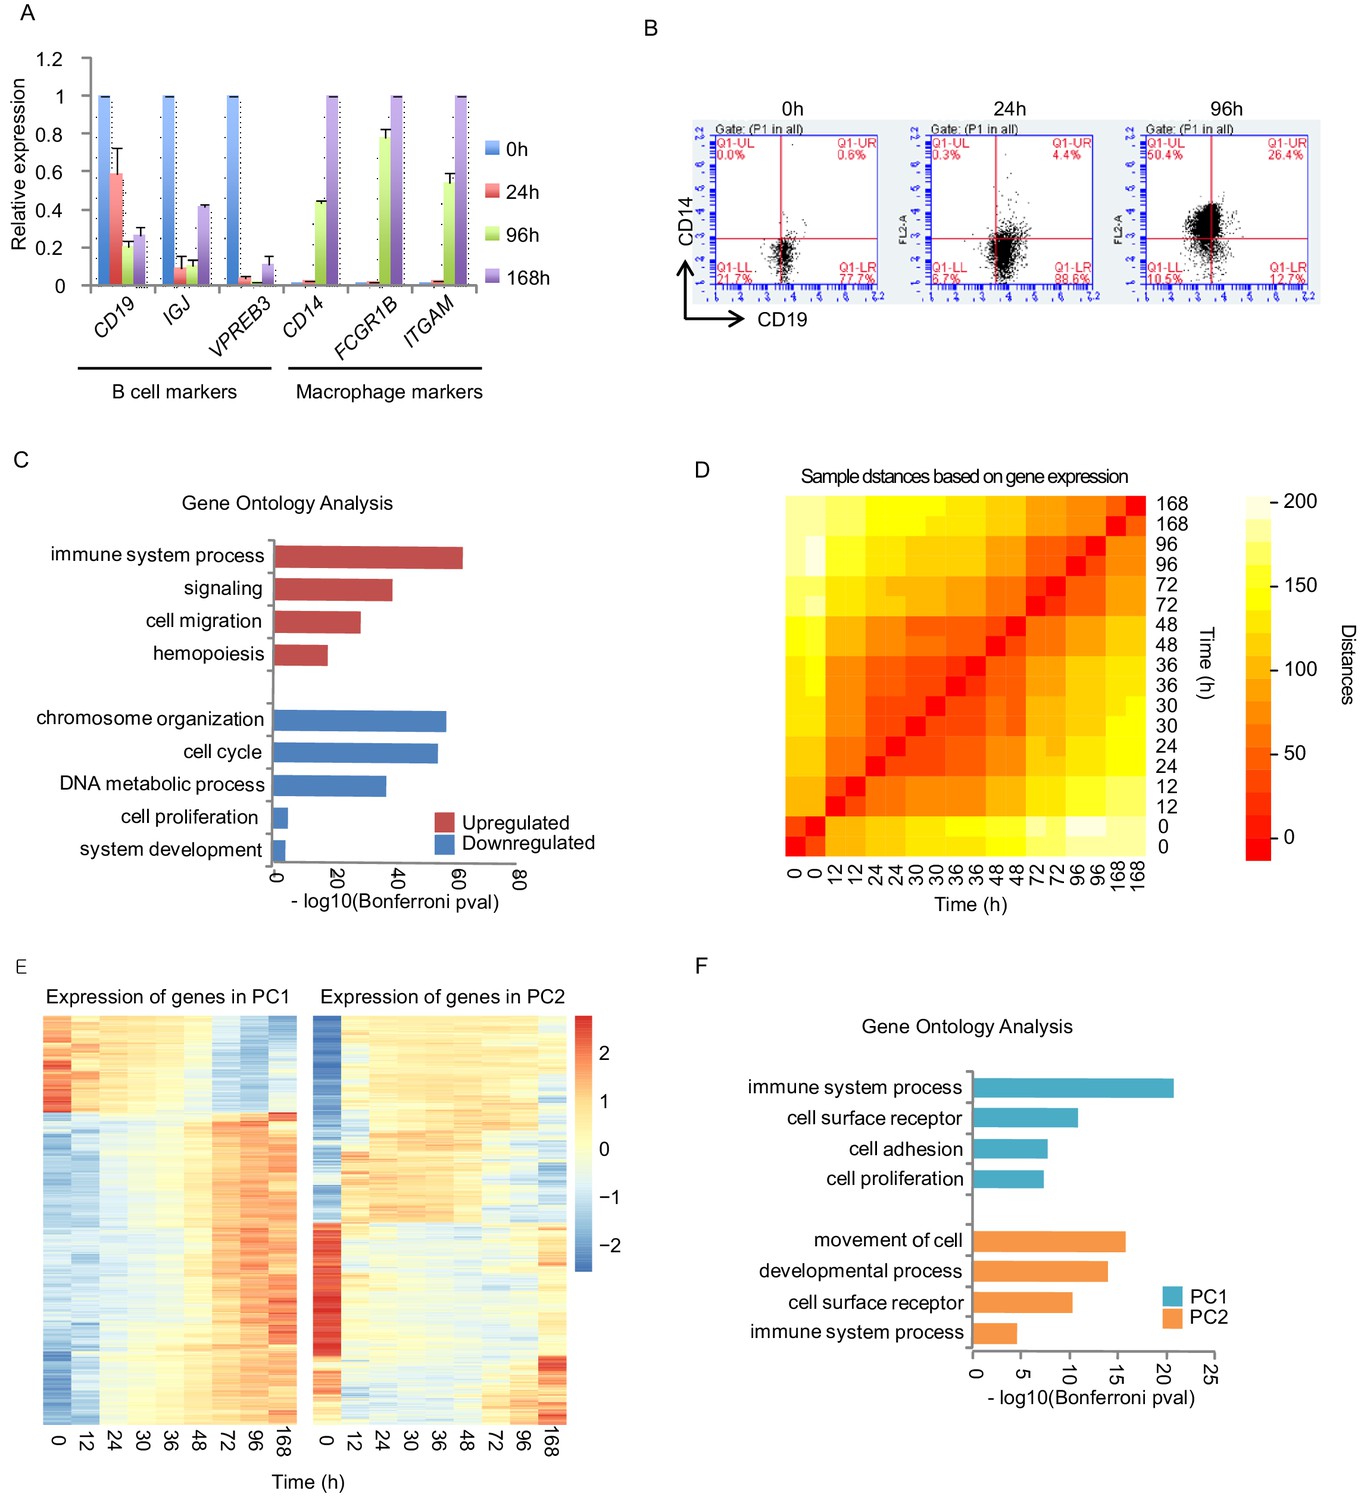
Transcription activity during transdifferentiation.
(A) B-cell or macrophage marker gene expressions during the transdifferentiation are tested by quantitative PCR (qPCR). C/EBPα was induced for 0 hr, 24 hr, 96 hr, and 168 hr. Gene expressions of indicated genes were quantified using GAPDH expression. Relative expression to 0 hr for B cell markers and to 168 hr for macrophage markers is shown. Standard deviation from three independent experiments are shown as error bars. (B) FACS analysis with antibodies against CD19 (B-cell specific surface marker) and CD14 (macrophage specific surface marker). (C) Gene ontology analysis on the upregulated or downregulated genes during the transdifferentiation, determined by RNA-seq. Bonferroni corrected p-values were transformed by log10. (D) Heatmap of sample distances (similarities) between the indicated time points based on gene expressions during the transdifferentiation. (E) Heatmap of gene expression in principle component 1 or 2 (PC1 or 2) from Figure 1D. (F) Gene ontology analysis on the PC1 or two from E and Figure 1D.
Figure 2 with 1 supplement
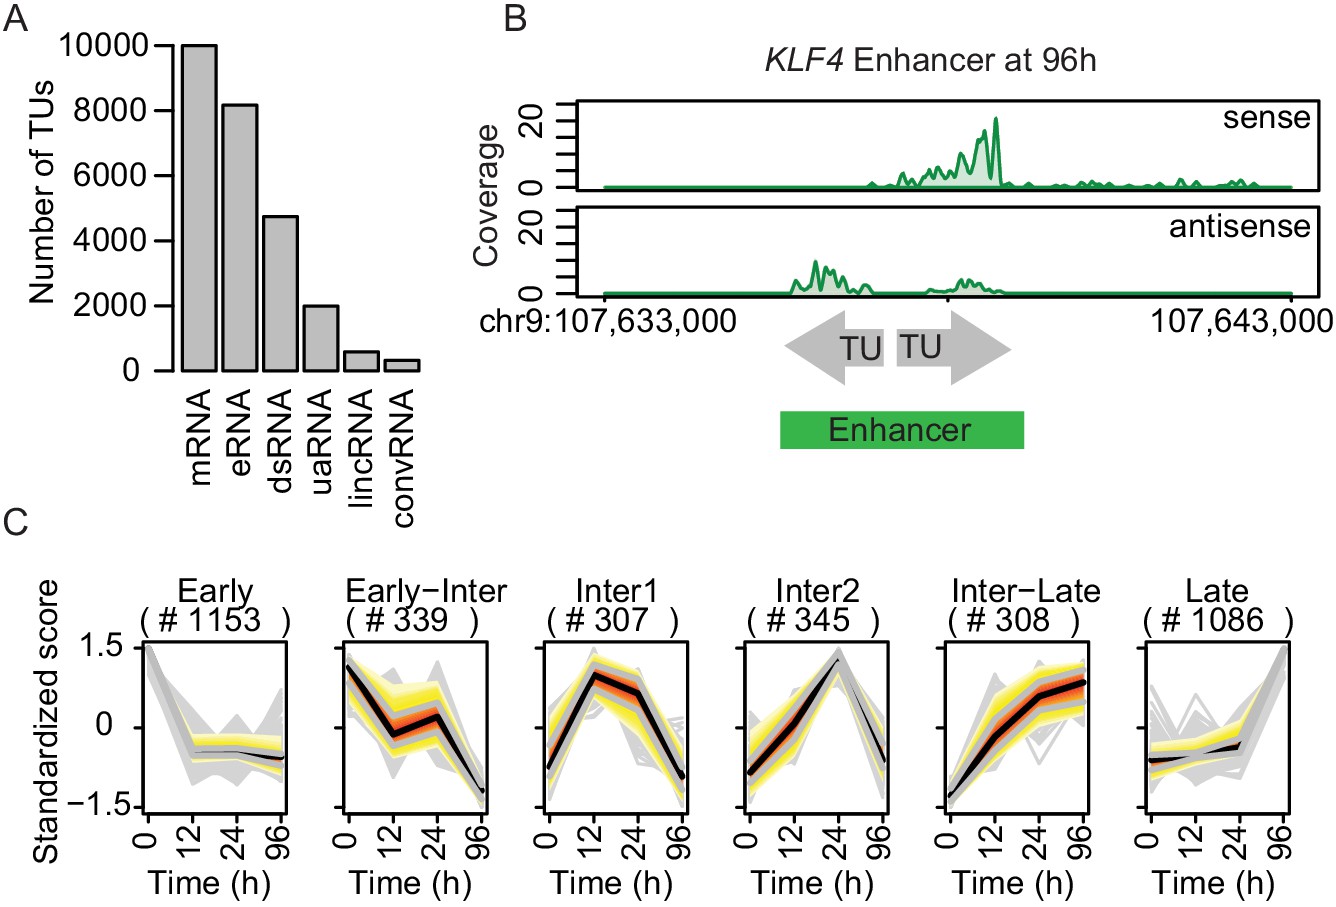
TT-seq identifies transcriptionally active enhancers.
(A) TT-seq identified various classes of RNAs including previously annotated stable messenger RNAs (mRNAs), novel transient enhancer RNAs (eRNAs), and other noncoding RNAs (downstream RNAs (dsRNAs), upstream antisense RNAs (uaRNAs), long intergenic noncoding RNAs (lincRNAs), convergent RNAs (convRNAs)). (B) TT-seq coverage tracks on KLF4 enhancer at 96 hr exemplify how RNAs that were synthesized within 1 kb of another were merged into a single enhancer. (C) Dynamically regulated eRNAs (|log2(FC)|>1, FDR < 0.05) were clustered using k-means clustering according to the kinetics of synthesis level changes during transdifferentiation. Black line represents median. Red, yellow, and gray represent 0.25, 0.5, and 0.75 quantiles, respectively.
Figure 2—figure supplement 1
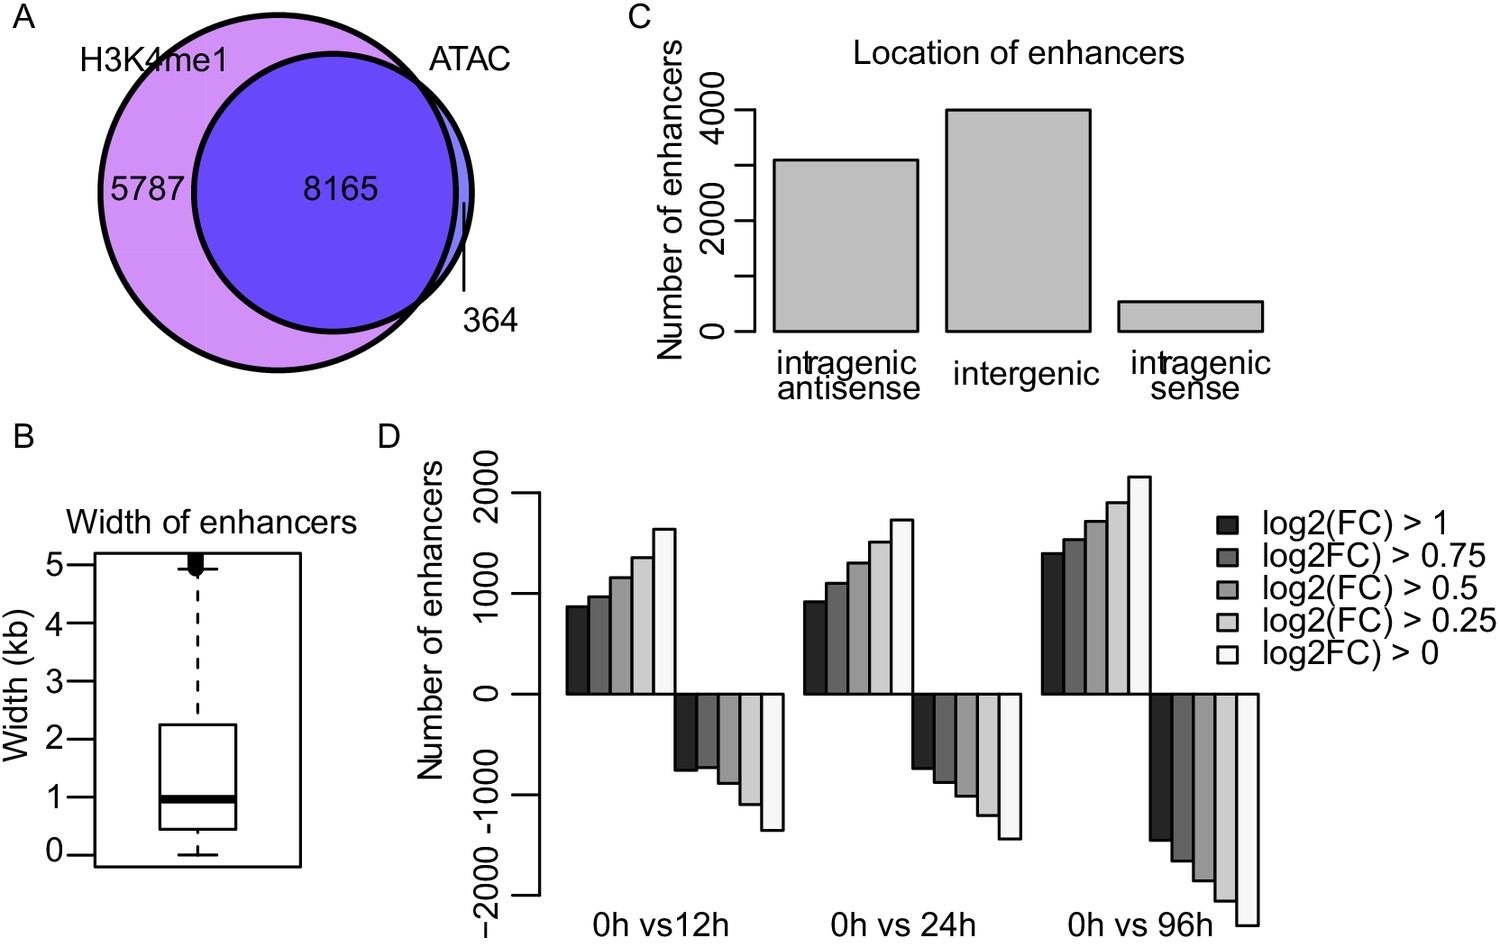
TT-seq identifies transcriptionally active enhancers.
(A) Venn diagram of ncRNAs overlapping with H3K4me1 ChIP-seq or ATAC-seq signal. (B) Width of enhancers identified by TT-seq (Figure 2A and Materials and methods). (C) Location of identified enhancers. (D) Number of enhancers with differentially regulated synthesis levels at various cutoff levels of log2 fold change. (FDR < 0.05).
Figure 3 with 1 supplement

Enhancer transcription follows chromatin opening.
(A) Average signal of ChIP-seq of C/EBPα (red) and H3K4me1 (purple) or ATAC-seq (blue) on C/EBPα binding sites where chromatin accessibility is limited at 0 hr (n = 4550). Each panel depicts coverage at the indicated time. (B) Coverage plots of genome-wide data sets as indicated. Rows of all panels represent enhancers occupied by C/EBPα, sorted by eRNA synthesis kinetics and intensity. The coverage was aligned to the transcription start site (TSS) of eRNAs. (C) Log2-transformed counts of chromatin accessibility and eRNA synthesis on enhancers within chromatin regions previously inaccessible at 0 hr. (D) Difference between changes of chromatin accessibility and changes in eRNA synthesis at each locus (y-axis) between indicated time points (x-axis). Log2-transformed counts of chromatin accessibility and eRNA synthesis on enhancers within chromatin regions previously inaccessible at 0 hr. (E) Coverage tracks of eRNA synthesis (green) and chromatin accessibility (blue) over indicated time points illustrate that chromatin becomes accessible before enhancer transcription at KDM7A and CD14 enhancers.
Figure 3—figure supplement 1
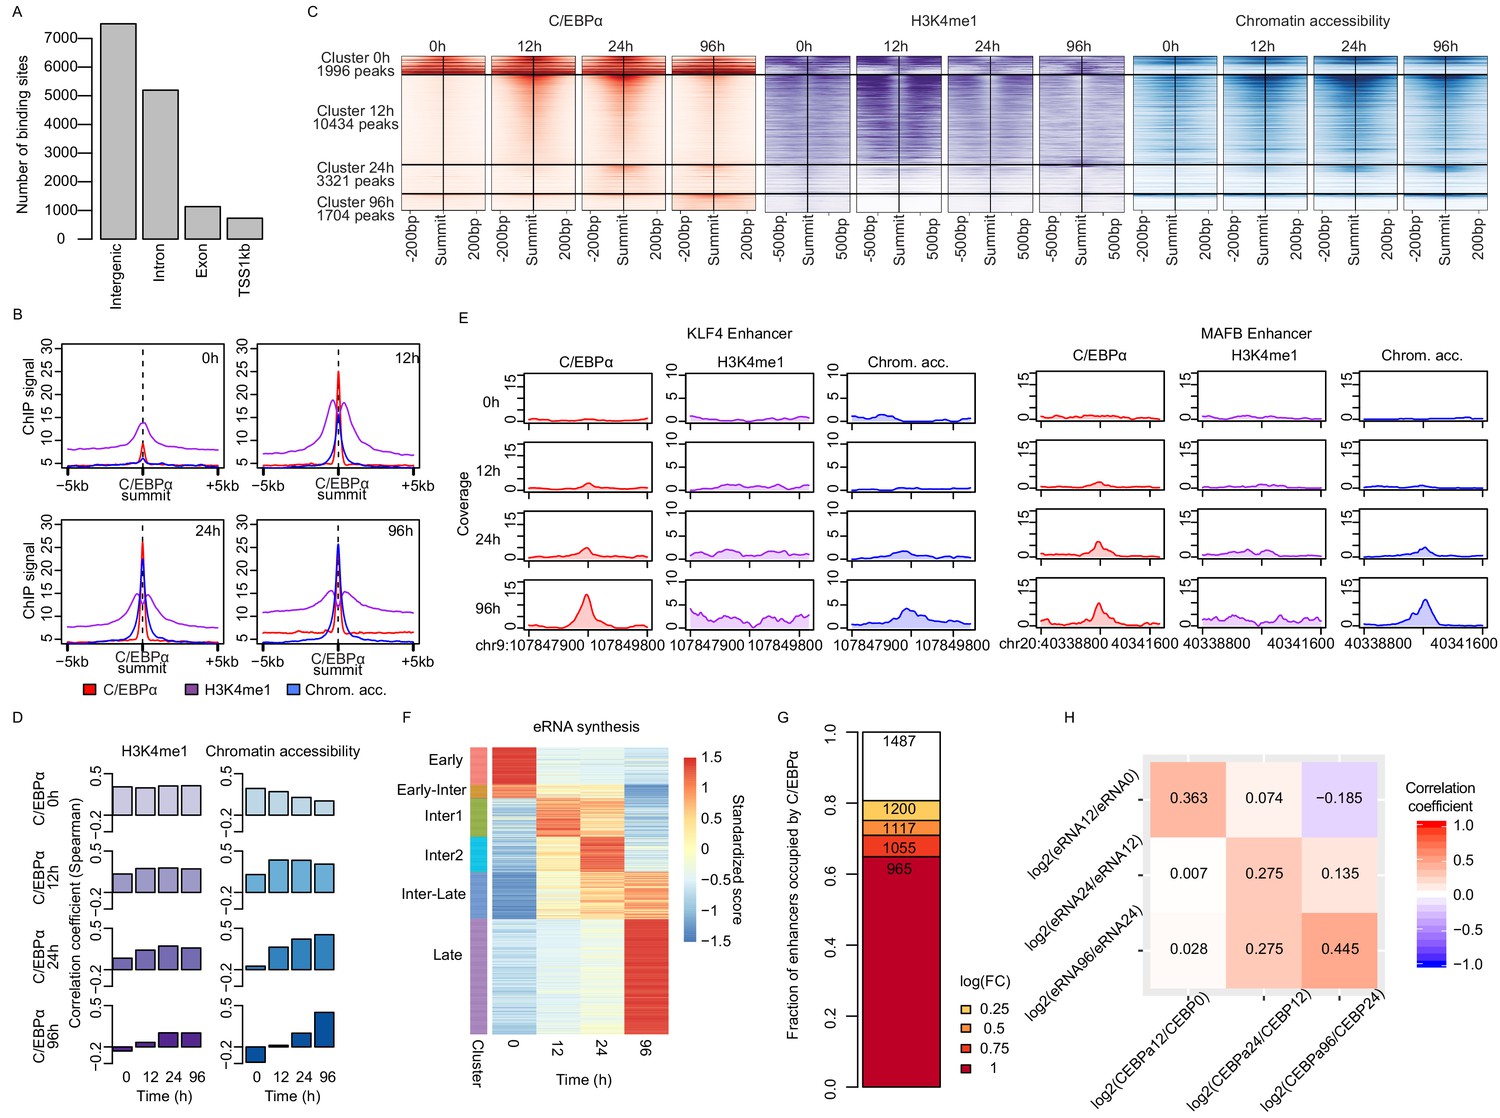
C/EBPα binding induces chromatin opening and activate enhancers.
(A) C/EBPα binding location across the genome during transdifferentiation. (B) Average signal of ChIP-seq of C/EBPα (red) and H3K4me1 (purple) or ATAC-seq (blue) on ±5 kb around C/EBPα binding sites where chromatin accessibility is limited at 0 hr (n = 4550). Each panel depicts coverage at the indicated time. (C) Coverage plots of genome-wide data sets as indicated. Rows represent C/EBPα binding sites that appeared at indicated times and were sorted by intensity. The coverage was aligned to the summits of C/EBPα binding sites. (D) Spearman's correlation coefficients between C/EBPα and histone H3K4me1 or chromatin accessibility signal at indicated time points. (E) Exemplary coverage plots for KLF4 and MAFB enhancers show that C/EBPα binding induces chromatin opening. (F) Heatmap of eRNA synthesis changes induced by C/EBPα for six clusters obtained with k-means clustering. (G) Fractions of enhancers where eRNA synthesis was altered upon C/EBPα binding. (H) Spearman's correlation coefficient heatmap of log2 fold changes of eRNA synthesis and C/EBPα binding signal from previous time points.
Figure 4 with 2 supplements
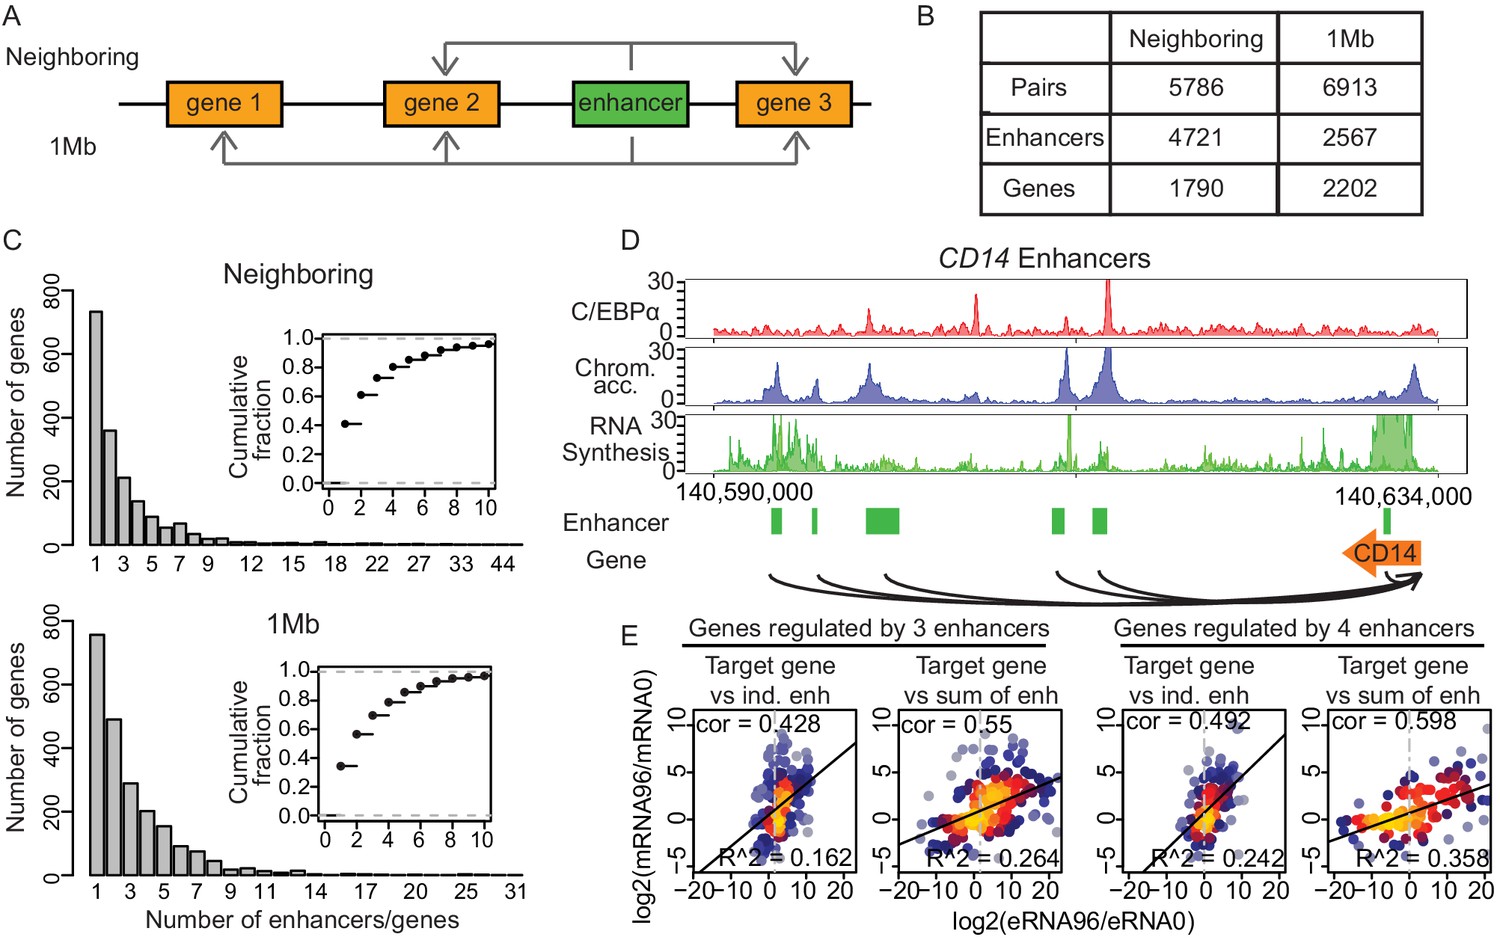
Multiple enhancers activate target gene promoters.
(A) Schematic diagram describing ‘neighboring’ and ‘1 Mb’ enhancer–promoter pairing methods. With the neighboring method, enhancers are paired to the nearest upstream and downstream transcribed promoters. Pairs with differentially regulated promoters were taken for further analysis. With the 1 Mb method, enhancers were paired with all promoters within 1 Mb, which corresponds to the median width of a human topologically associating domain (TAD) (Dixon et al., 2012; Yan et al., 2017). Pairs with promoters and enhancers that are differentially regulated in a correlated manner were analyzed further (Materials and methods). (B) Number of enhancer–promoter pairs, enhancers and genes per pair and method. (C) 59.1% and 65.7% of genes are regulated by more than one enhancer when using the neighboring and 1 Mb method, respectively. (D) Multiple enhancer cooperation at CD14 gene is exemplified by the coverage tracks of indicated data sets at 96 hr. CD14 gene is regulated by six enhancers. BRD4, H3K4me1, and H3K27Ac coverage tracks at 0 hr and 96 hr are depicted in Figure 4—figure supplement 1E. (E) Scatterplot of log2 fold change of mRNA synthesis level at 96 hr compared to 0 hr and log2 fold change of eRNA synthesis from individual (ind.) or sum of all enhancers. Genes regulated by three enhancers (left) or by four enhancers (right) are shown. Spearman's correlation coefficients at the top left corner and adjusted R-squared (R2) values at the bottom right corner indicate that the sum of enhancer activity changes explains changes in mRNA synthesis better.
Figure 4—figure supplement 1
Enhancer–promoter pairing.
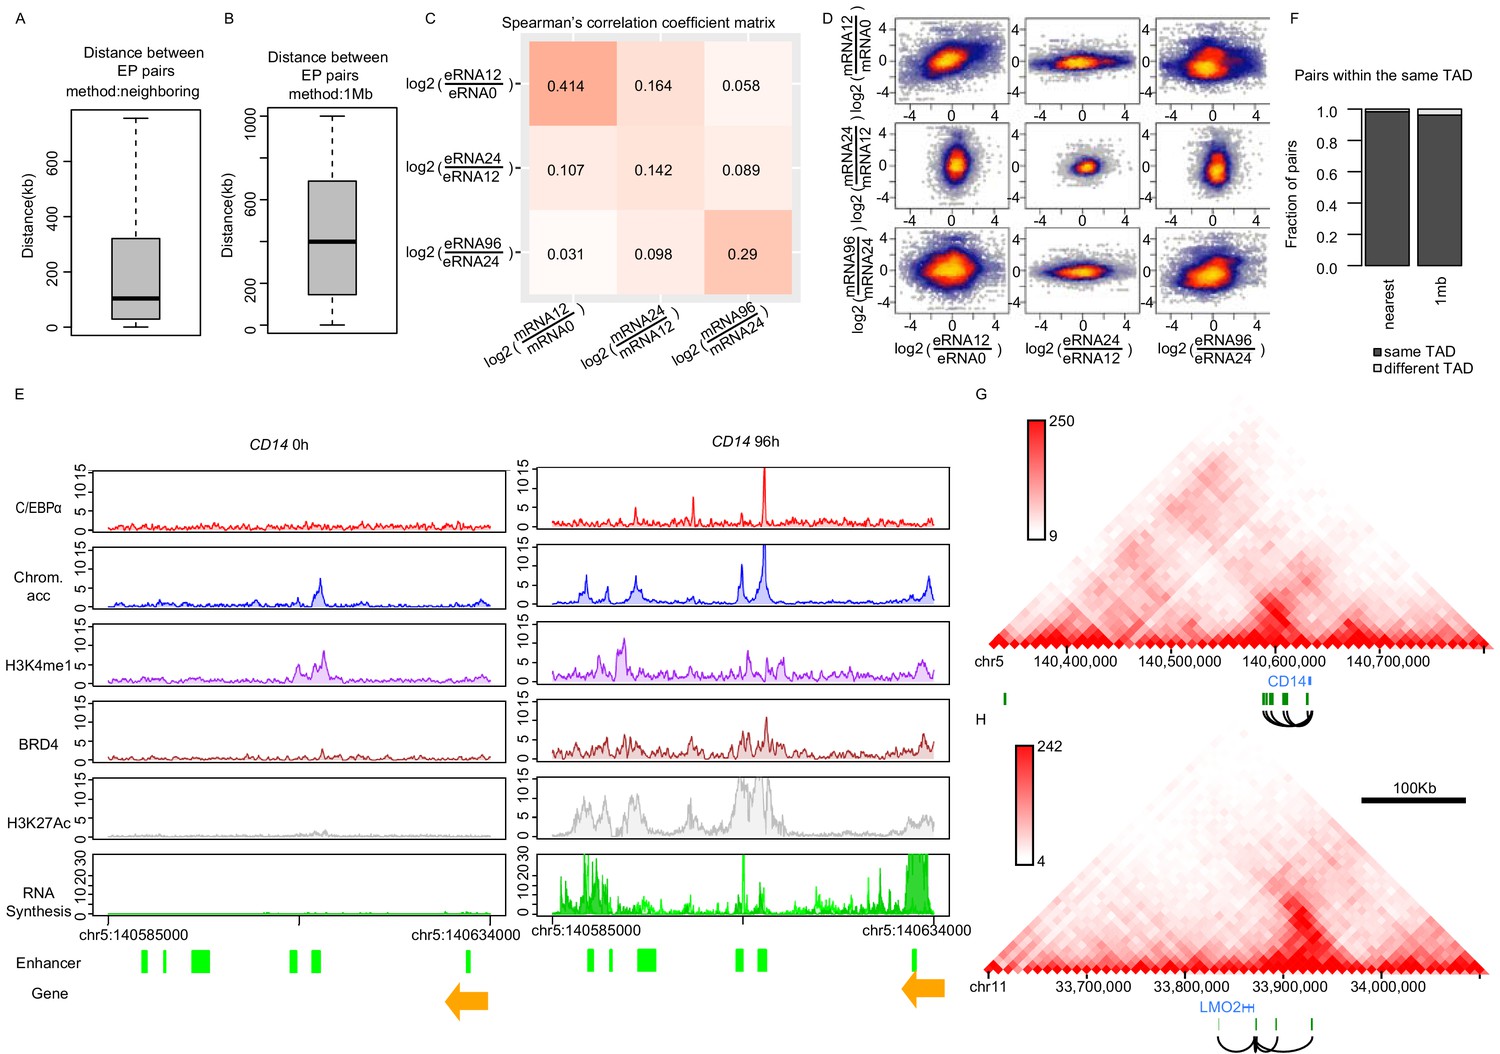
(A and B) Distance between enhancer–promoter paired by ‘neighboring’ (A) or ‘1 Mb’ (B) methods. (C and D) Spearman's correlation heatmap (C) and scatter plot (D) of log2 fold changes of eRNA and mRNA synthesis from previous time points, using the neighboring method. (E) The exemplary coverage tracks of indicated data sets at CD14 gene are depicted. H3K27Ac coverage track of 72 hr is shown since H3K27Ac ChIP-seq at 96 hr is not available. (F) Fraction of EP pairs from indicated method overlapping with TAD obtained from Hi-C data. (G and H) Positions of enhancers paired with CD14 (G) and LMO2 (H) with chromatin contact information (HiC data from THP-1 cells [Phanstiel et al., 2017]) indicate that these enhancers have high contact frequency (orange: genes, green: enhancers, black lines: pairs).
Figure 4—figure supplement 2

Multiple enhancers activate target gene promoters.
(A) mRNA synthesis level (log2 transformed) was greater as number of paired enhancers was increased, both by neighboring and 1 Mb methods. The regression coefficients and p-value of linear regression model (lm) are indicated. (B) Regression coefficients indicating changes in mRNA synthesis over individual eRNA synthesis. Neighboring (left) or 1 Mb (right) methods. (C and D) Spearman's correlation coefficients of mRNA synthesis and individual or the sum of 2, 3, or all of paired enhancers by neighboring (C) and 1 Mb methods (D). (E and F) Adjusted coefficient of determination (R-squared, R2) was calculated from linear regression models (lm) of mRNA synthesis against individual enhancers or against the sum of the indicated number of paired enhancers by neighboring (E) and 1 Mb methods (F).
Figure 5 with 4 supplements
Enhancer cooperation can be additive or synergistic.
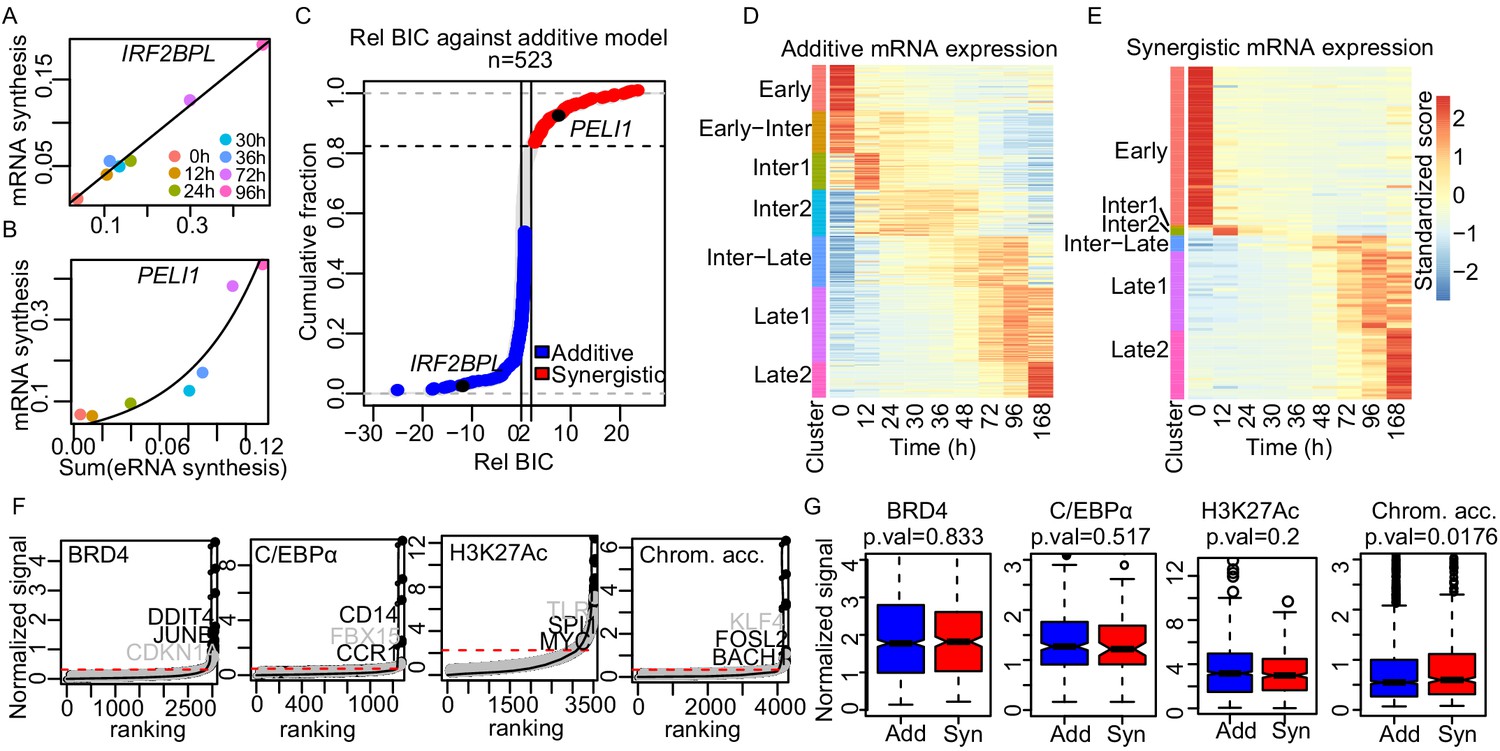
(A and B) Exemplary curve fits of the additive (A) and the synergistic models (B) to the observed size factor and length normalized TT-seq RNA synthesis level for the indicated mRNA and the sum of the paired eRNAs. (C) The relative Bayesian Information Criterion (BIC) for the curve fits for a total of 523 promoters reveals that RNA synthesis at most loci follows either the additive or the synergistic model. The synergistic model fitted better for 17% of tested loci, showing a relative BIC greater than 2 (red). Any loci with a relative BIC between 0 and 2 were left as ambiguous because they fitted both models (gray). (D and E) Heatmap of gene expression (RNA-seq) regulated in additive (n = 348) (D) or synergistic (n = 136) (E) manner. Clusters are as shown in Figure 1C (k-means). (F) ChIP signal for BRD4, C/EBPα, and H3K27Ac, and ATAC-seq signal, ranked by signal strength on the peaks within 1 kb of our enhancers (Materials and methods, black dots) with cut-off values for superenhancers (red dashed lines). Synergistic enhancers are depicted with gray dots. (G) Additive (blue) and synergistic (red) enhancers are compared for their occupancy with BRD4, C/EBPα, H3K27Ac, or their chromatin accessibility (ATAC-seq). The comparison was carried out for the time point where the highest signal was observed. Fold differences in median signal of BRD4, C/EBPα, H3K27Ac, and chromatin accessibility between additive and synergistic enhancers are 1.02, 0.96, 1.07, and 1.09, respectively.
Figure 5—figure supplement 1
Enhancer cooperation can be additive or synergistic.
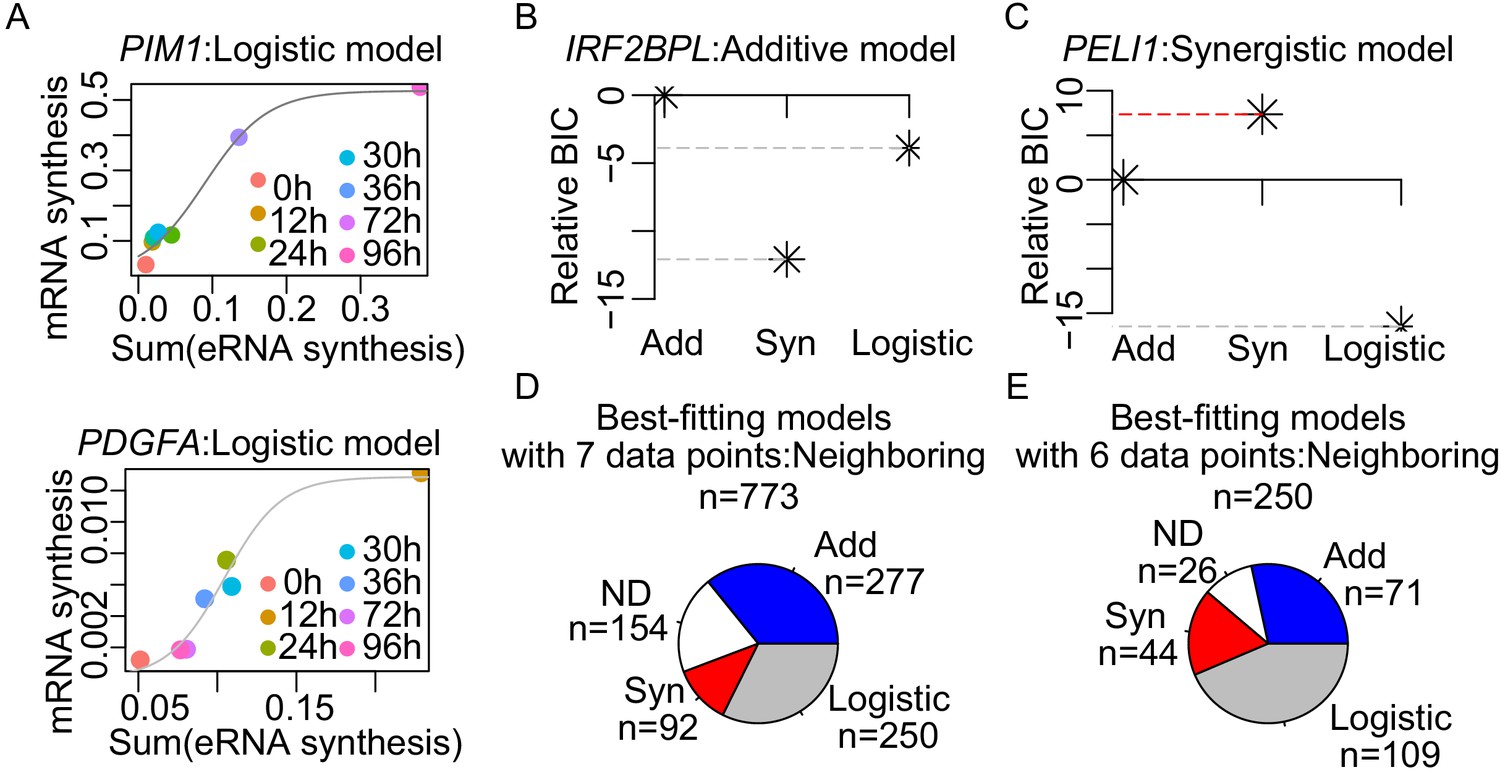
(A) The observed normalized TT-seq RNA synthesis level for the indicated mRNA and the sum of the paired eRNAs were plotted for PIM1 and PDGFA, those best-fitted with a logistic model as shown with curve fits (gray line). (B and C) The relative Bayesian Information Criterion (BIC) reveals that RNA synthesis follows either the additive (B) or the synergistic model (C). A higher relative BIC indicates better fitting of the model. (D) Using the neighboring pairing method, each of the tested genes was assigned to three theoretical models according to the BIC with seven data points. Numbers of the genes assigned with the indicated models are depicted. (E) Using the neighboring pairing method, BIC of the genes that were best fitted with logistic model were recalculated with six data points, without the data point with the highest sum of enhancer activities. Number of the genes assigned with the indicated models according to BIC is depicted.
Figure 5—figure supplement 2
Enhancer synergy is a robust phenomenon.
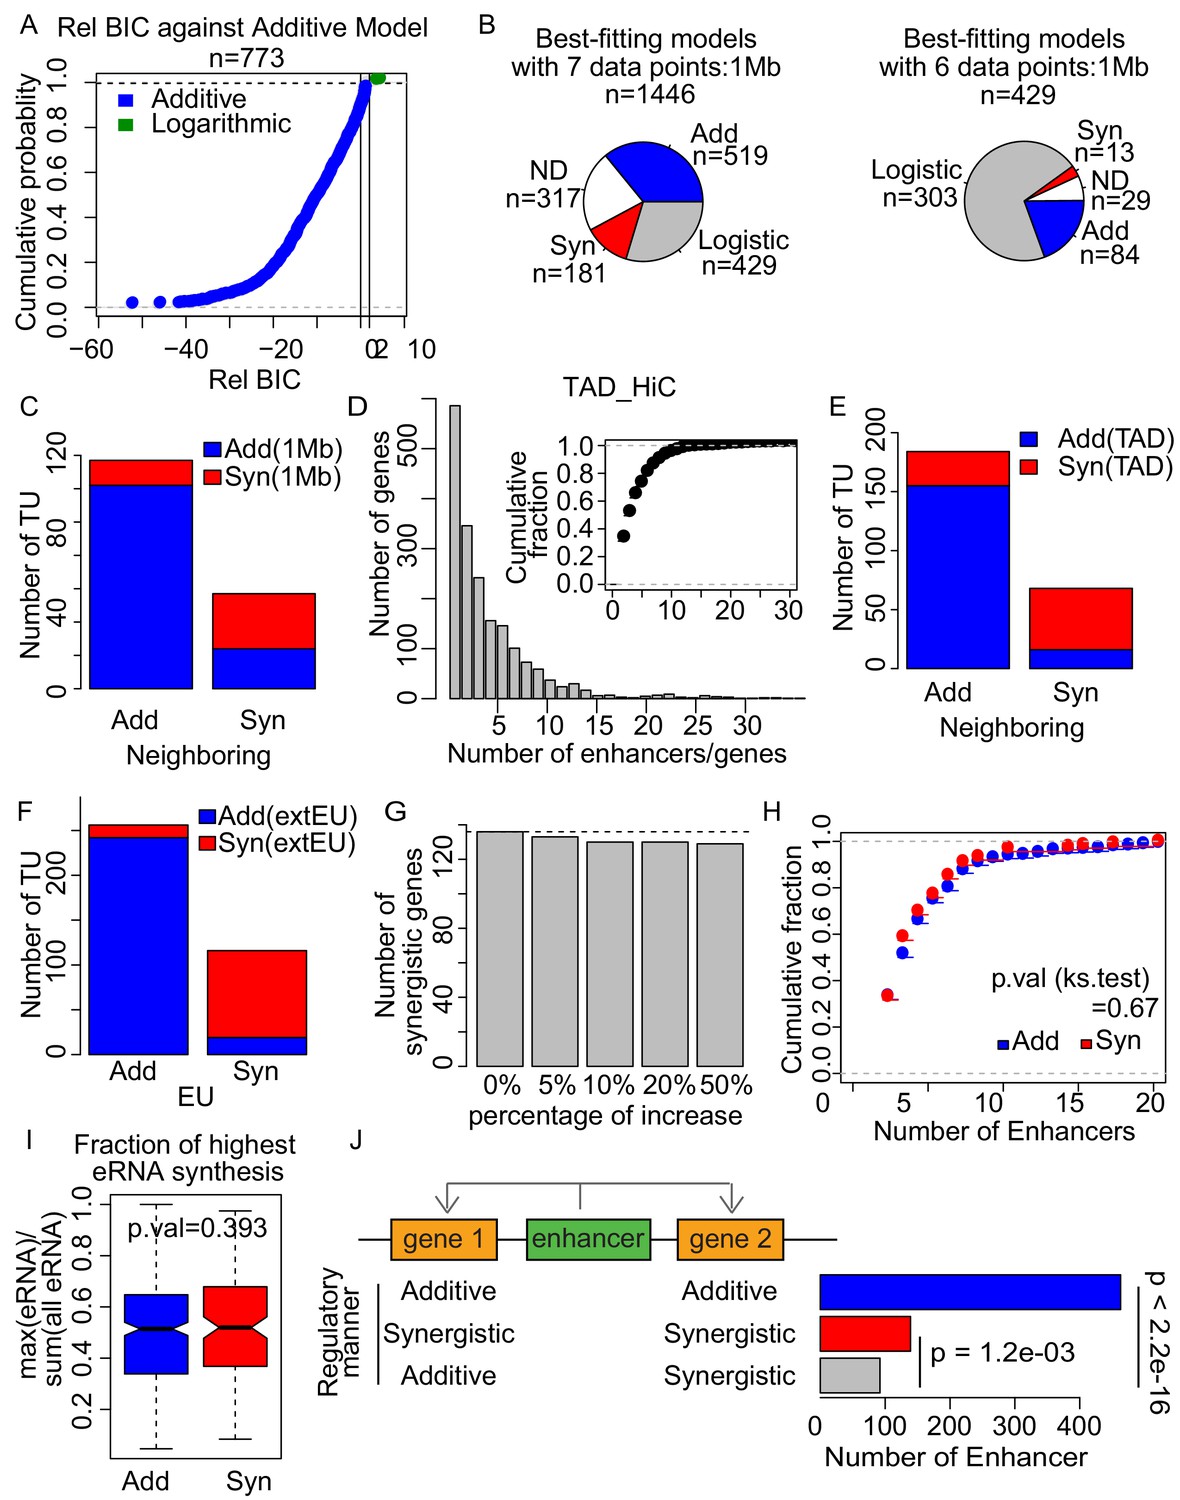
(A) The relative Bayesian Information Criterion (BIC) of logarithmic model against additive model. The logarithmic model fitted better only for a few tested loci, showing a relative BIC greater than 2 (green) showing distinct curve shape from Figure 5C. (B) Using the 1 Mb pairing, each of the tested genes was assigned to three theoretical models according to the BIC with seven data points (upper). BIC of the genes that were best fitted with logistic model were recalculated with six data points, without the data point with the highest sum of enhancer activities (lower). Numbers of the genes assigned with the indicated models are depicted. (C) Overlap of additive and synergistic enhancers obtained from neighboring and 1 Mb methods. (D) 68.9% of genes are regulated by more than one enhancer when using the TAD method. (E) Overlap of additive and synergistic enhancers obtained from neighboring and TAD methods. (F) Overlap of additive and synergistic enhancers obtained using 7624 EUs defined by H3K4me1 ChIP-seq and ATAC-seq signals (indicated as EU) and 15487 extended EUs defined by TT-seq signals regardless of epigenetic state (indicated as extEU) (Materials and methods). (G) Number of synergistic enhancers obtained using simulatively increased eRNA transcription level. (H) Fraction of additive (blue) or synergistic (red) genes paired with different numbers of enhancers. (I) Fraction of the maximum (highest) eRNA synthesis to the total eRNA signal for all paired enhancers of each gene. (J) Number of enhancers regulating two genes in the indicated regulatory manner. Nearest pairing method was used. p-values from binomial test are indicated.
Figure 5—figure supplement 3
Synergistic enhancers drive cell type-specific genes.
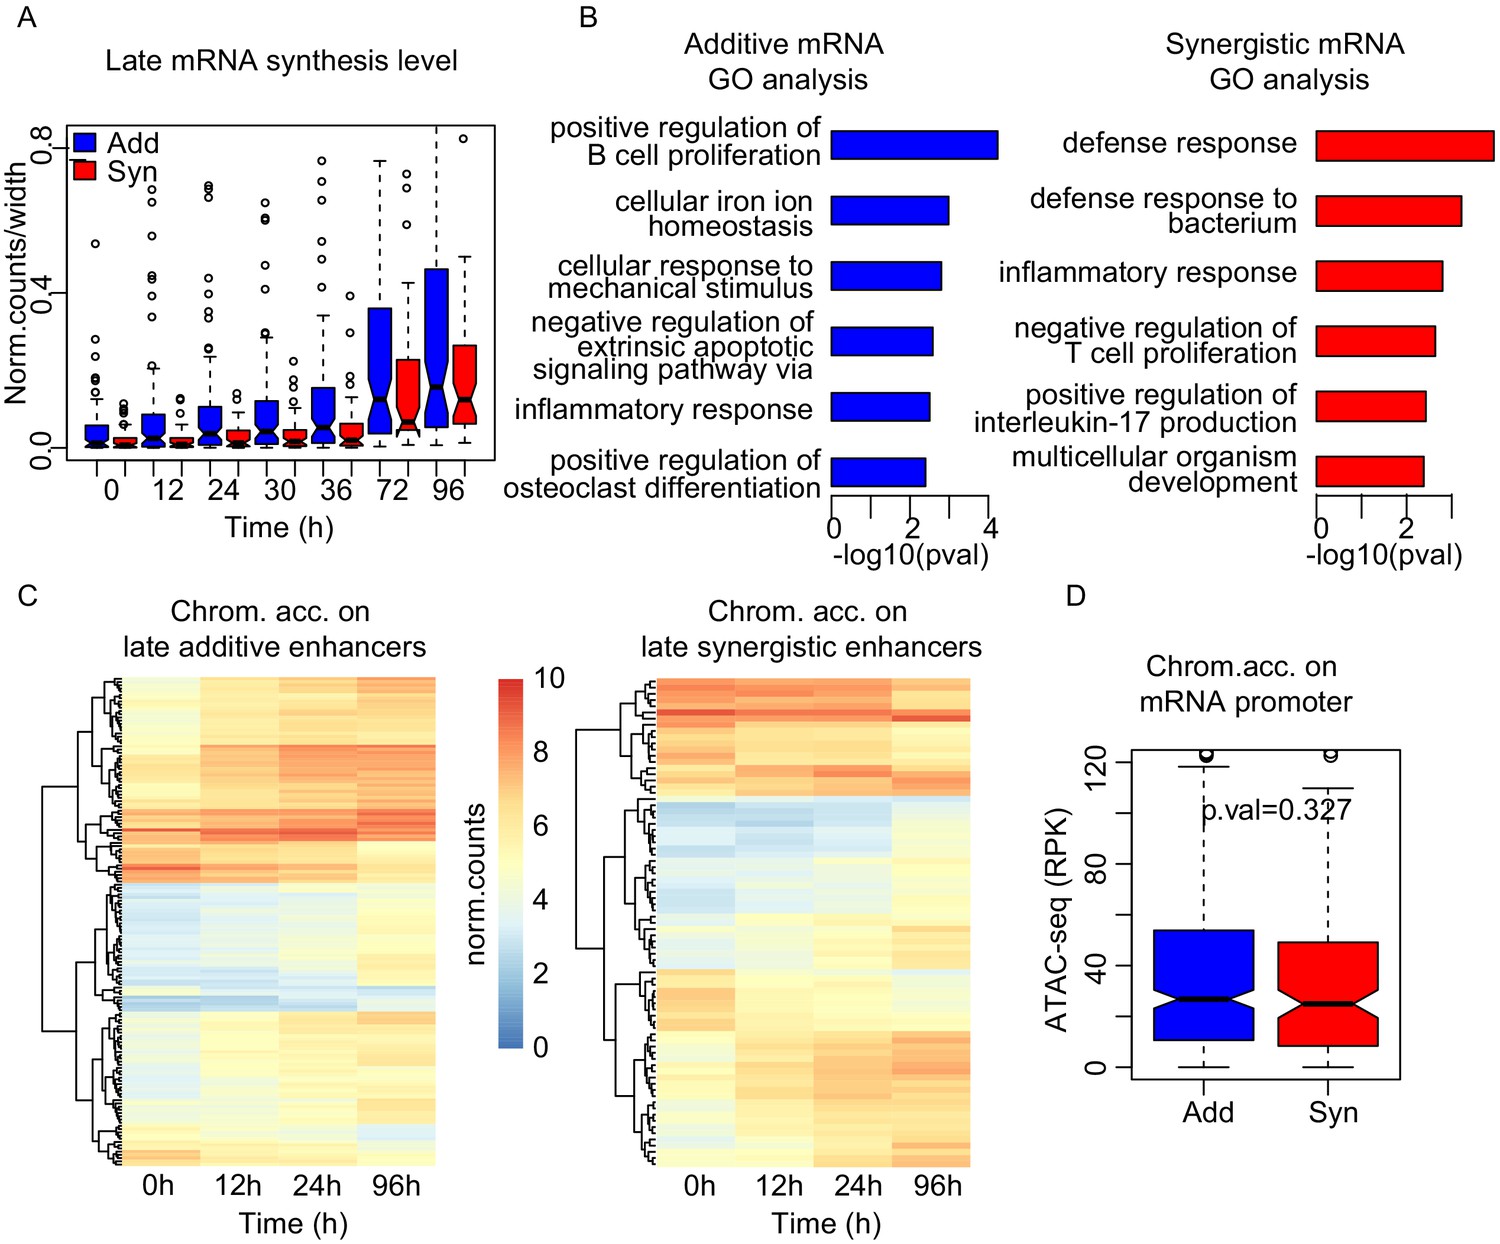
(A) mRNA synthesis of the upregulated genes at 96 hr in additive (blue) or synergistic (red) manner. (B) GO analysis of mRNAs regulated in additive (blue) or synergistic (red) manner. (C) Heatmap of chromatin accessibility on additive (left) or synergistic (right) enhancers upregulating the genes at 96 hr. (D) Chromatin accessibility at promoters at 0 hr was not significantly different between additive and synergistic genes in late cluster.
Figure 5—figure supplement 4
Synergistic enhancers drive cell type-specific genes.
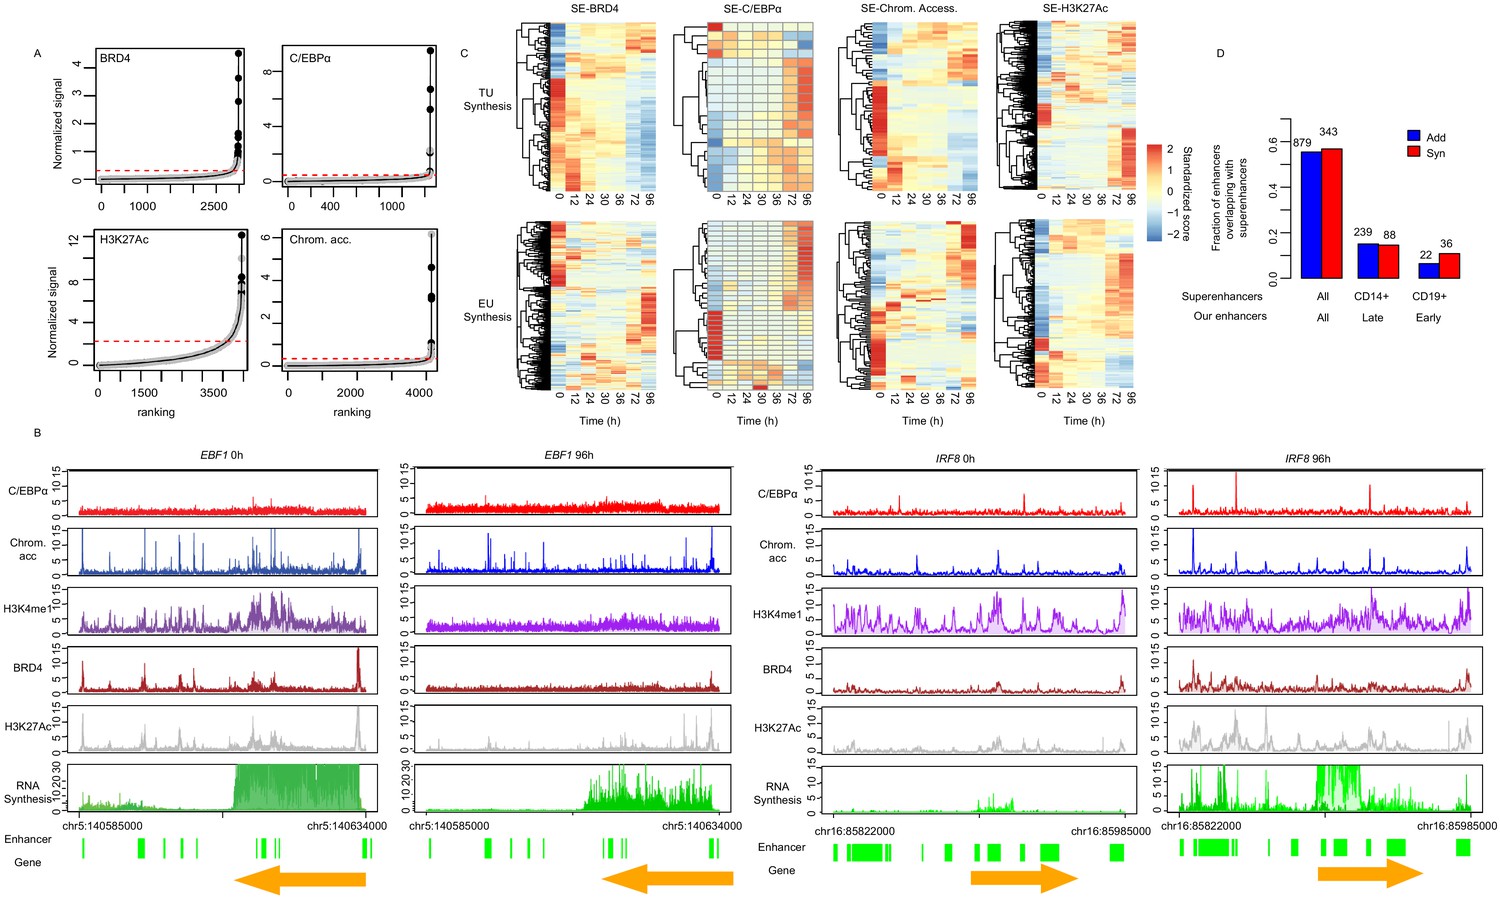
(A) ChIP signal for BRD4, C/EBPα, and H3K27Ac, and ATAC-seq signal, ranked by signal strength on the peaks within 1 kb of our enhancers (Materials and methods, black dots) with cutoff value for superenhancers (red dashed line). Additive enhancers are shown with gray dots. (B) Coverage tracks of exemplary superenhancers, EBF1 and IRF8 at 0 hr and 96 hr. H3K27Ac at 72 hr instead of 96 hr is depicted. (C) Heatmap of RNA synthesis on target genes (upper panel) or eRNAs (lower panel) of superenhancers determined by ChIP occupancy with BRD4 or C/EBPα, H3K27Ac, and chromatin accessibility. (D) Fraction of our additive (blue) or synergistic (red) enhancers overlapping with superenhancers from dbSUPER (Hnisz et al., 2013; Khan and Zhang, 2016). All of our additive or synergistic enhancers (136 enhancers) were compared with superenhancers from all available cells in dbSUPER (first column), from CD14+ cells, which are macrophage cells (second column), and from CD19+ cells, which are B cells (third column). Fisher’s exact test p-value is shown.
Figure 6 with 1 supplement
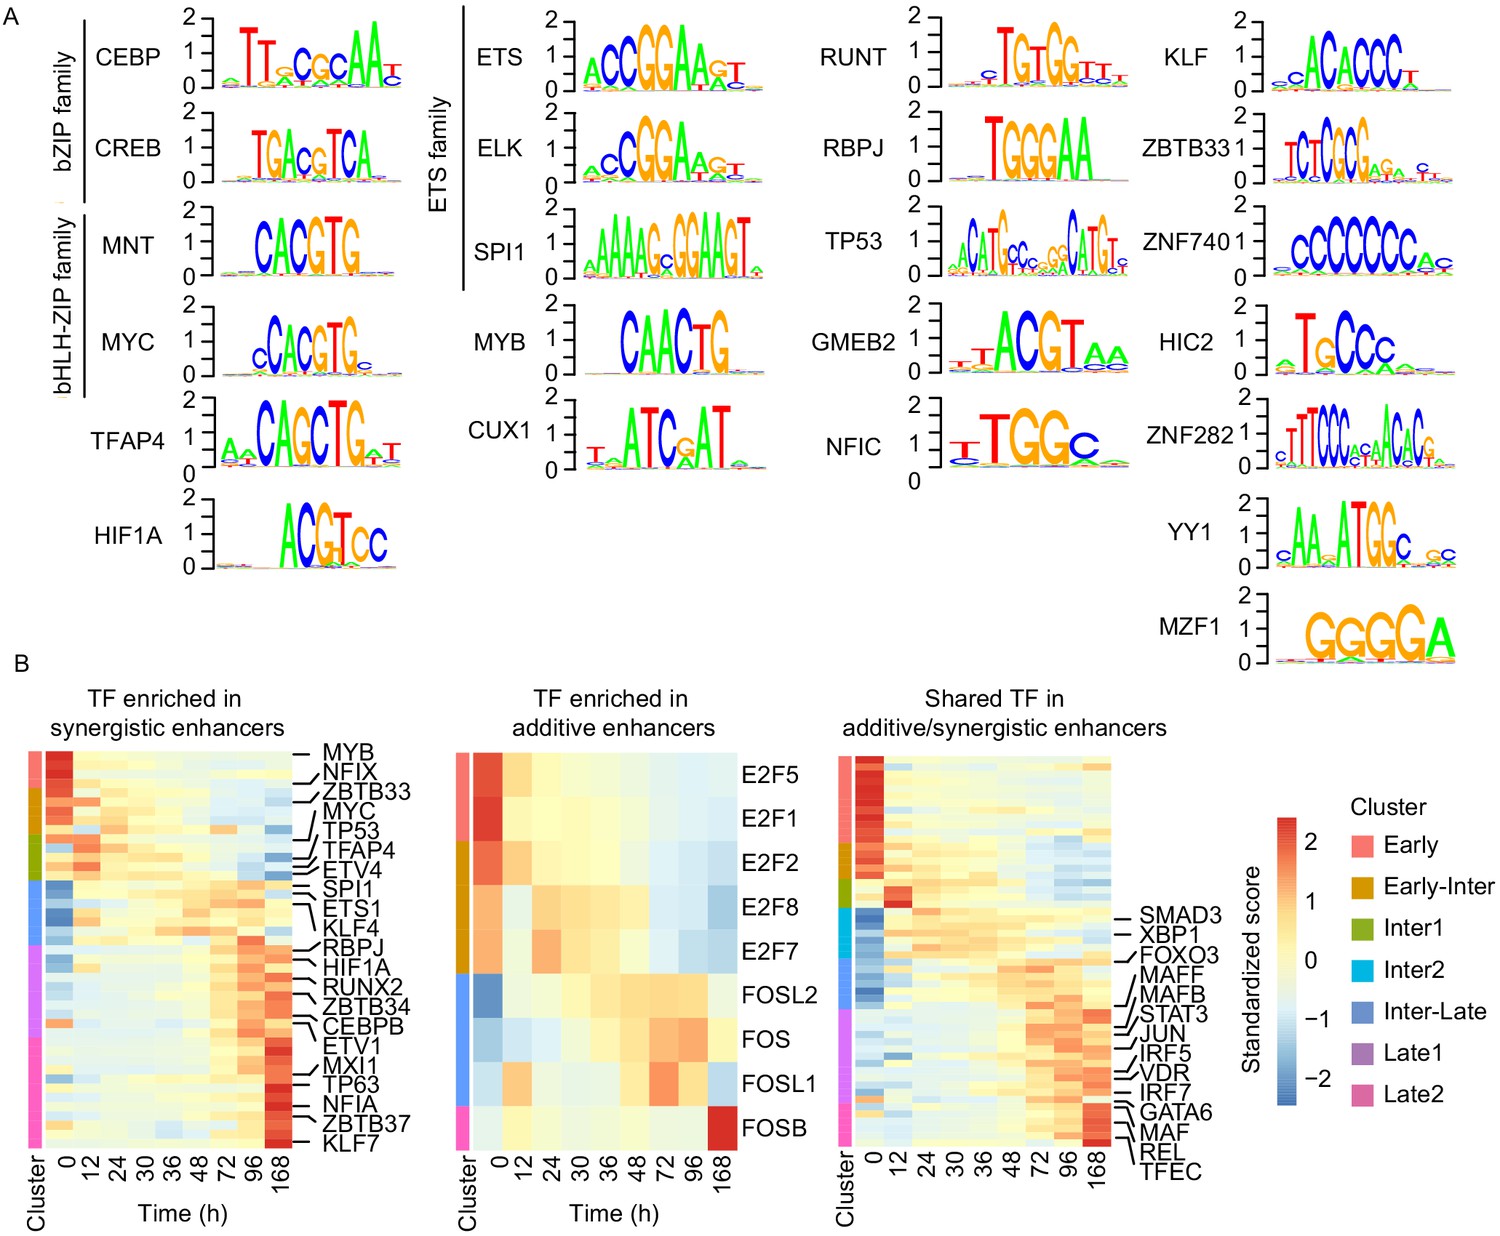
Cell type-specific transcription factors are enriched in synergistic enhancers.
(A) Motifs of TFs enriched in synergistic enhancers from TF footprinting analysis (Materials and methods). (B) Expression of differentially expressed TFs (| log2(FC) |>1, FDR < 0.05, RNA-seq) enriched in synergistic (left panel), additive (middle panel), and both synergistic and additive (right panel) enhancers.
Figure 6—figure supplement 1
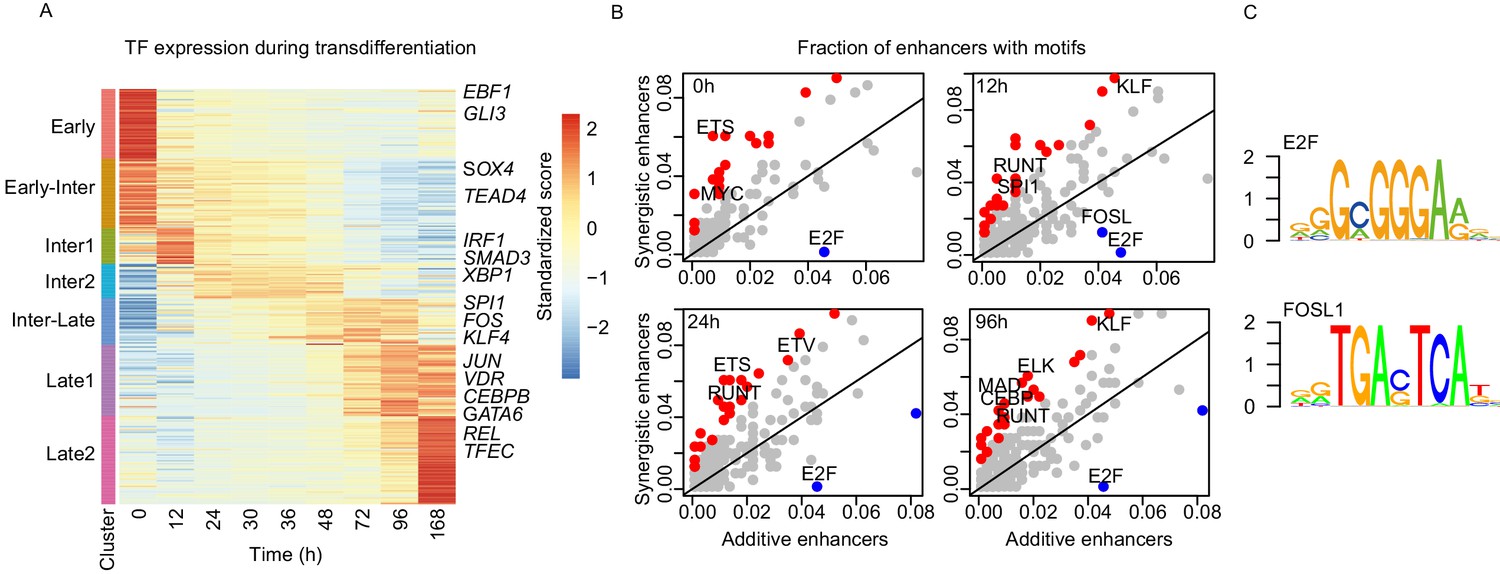
Specific sets of TFs are enriched on synergistic enhancers.
(A) Heatmap of differentially expressed TFs from RNA-seq (| log2(FC) |>1, FDR < 0.05) for seven clusters obtained with k-mean clustering (Figure 1C). (B) Bound TF motif occurrences were calculated from TF footprinting with ATAC-seq at each indicated time point. Each dot represents a fraction of synergistic enhancers with a TF motif to a fraction of additive enhancers with a TF motif. TF motifs that are bound significantly more within the synergistic or additive enhancers are indicated in red or blue, respectively (Fisher’s exact test p-value < 0.05). (C) Motifs of TFs enriched in additive enhancers upregulating genes at 96 hr from TF footprinting analysis (Materials and methods).
Figure 7
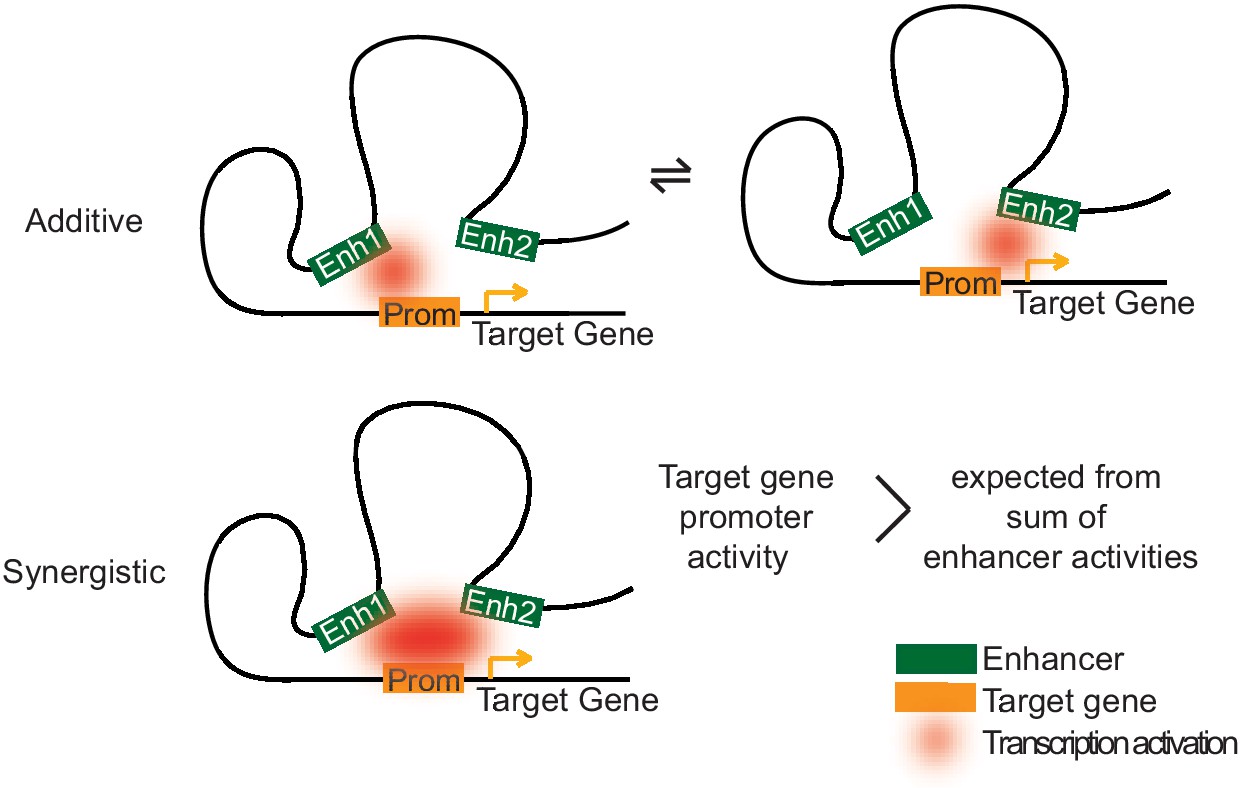
Two models of how multiple enhancers regulate target genes.
Simple models may explain additive and synergistic enhancer cooperation during target gene activation. Additive cooperation may result from alternative activation of the target promoter by each constituent enhancer at different time points. Synergistic cooperation may be achieved if multiple enhancers contact the target gene promoter simultaneously. For details compare text.
Tables
Key resources table
| Reagent type (species) or resource | Designation | Source or reference | Identifiers | Additional information |
|---|---|---|---|---|
| Cell line (Homo sapiens; female) | BLaER1 B-cell precursor leukemia | Laboratory of Thomas Graf | RRID:CVCL_VQ57 | RCH-ACV stably expressing estrogen inducible C/EBPα |
| Commercial assay, kit | Plasmo Test Mycoplasma Detection Kit | InvivoGen | rep-pt1 | |
| Commercial assay, kit | NUGEN Ovation V2 Kit | NUGEN | 0343 | |
| Commercial assay, kit | NEB Ultra DNA Library kit | NEB | E7370S | |
| Commercial assay, kit | KAPA Real-Time Library Amplification Kit | Peqlab | KK2701 | |
| Commercial assay, kit | Nextera Tn5 Transposase | Illumina | FC-121–1030 | |
| Chemical compound, drug | Human CSF-1 | PEPROTECH | 300–25 | |
| Chemical compound, drug | Human IL-3 | PEPROTECH | 200–03 | |
| Chemical compound, drug | β-estradiol | CALBIOCHEM | 3301 | |
| Chemical compound, drug | 4-thiouridine | Carbosynth | 13957-31-8 | |
| Antibody | Anti-C/EBPα (rabbit polyclonal) | Santa Cruz | Cat# sc-61, RRID:AB_631233 | ChIP-seq (5 μg for 50 μg of chromatin) |
| Antibody | Anti-H3K4me1 (rabbit polyclonal) | Abcam | Cat# ab8895, RRID:AB_306847 | ChIP-seq (5 μg for 30 μg of chromatin) |
| Antibody | Anti-BRD4 (rabbit polyclonal) | Bethyl Laboratories | Cat# A301-985A100, RRID:AB_2620184 | ChIP-seq (5 μg for 100 μg of chromatin) |
| Antibody | Anti-human CD19-APC-cy7APC-cy7 mouse anti-human CD19(mouse monoclonal) | BD Biosciences | Cat# 557791, RRID:AB_396873 | FACS (2.5 μL per test) |
| Antibody | Anti-human CD14-PEPE mouse anti-human CD14 (mouse monoclonal) | BD Biosciences | Cat# 555398, RRID:AB_395799 | FACS (5 μL per test) |
| Sequenced-based reagent | CD19 forward | Rapino et al., 2013 | qPCR primers | GATGCAGACTCTTATGAGAAC |
| Sequenced-based reagent | CD19 reverse | Rapino et al., 2013 | qPCR primers | TCAGATTTCAGAGTCAGGTG |
| Sequenced-based reagent | IGJ forward | Rapino et al., 2013 | qPCR primers | TGTTCATGTGAAAGCCCAAG |
| Sequenced-based reagent | IGJ reverse | Rapino et al., 2013 | qPCR primers | TCGGATGTTTCTCTCCACAA |
| Sequenced-based reagent | VPREB3 forward | Rapino et al., 2013 | qPCR primers | GGGGACCTTCCTGTCAGTTT |
| Sequenced-based reagent | VPREB3 reverse | Rapino et al., 2013 | qPCR primers | ACCGTAGTCCCTGATGGTGA |
| Sequenced-based reagent | CD14 forward | Rapino et al., 2013 | qPCR primers | GATTACATAAACTGTCAGAGGC |
| Sequenced-based reagent | CD14 reverse | Rapino et al., 2013 | qPCR primers | TCCATGGTCGATAAGTCTTC |
| Sequenced-based reagent | FCGR1B forward | Rapino et al., 2013 | qPCR primers | CCTTGAGGTGTCATGCGTG |
| Sequenced-based reagent | FCGR1B reverse | Rapino et al., 2013 | qPCR primers | AAGGCTTTGCCATTTCGATAGT |
| Sequenced-based reagent | ITGAM forward | Rapino et al., 2013 | qPCR primers | GGGGTCTCCACTAAATATCTC |
| Sequenced-based reagent | ITGAM reverse | Rapino et al., 2013 | qPCR primers | CTGACCTGATATTGATGCTG |
| Sequenced-based reagent | GAPDH forward | This paper | qPCR primers | TCTCTGCTCCTCCTGTTCGAC |
| Sequenced-based reagent | GAPDH reverse | This paper | qPCR primers | GGCGCCCAATACGACCAAAT |
| Software, algorithm | Cutadapt | Martin, 2012 | RRID:SCR_011841 | Version 1.9.1 |
| Software, algorithm | Trim Galore | https://www.bioinformatics.babraham.ac.uk/projects/trim_galore/ | RRID:SCR_011847 | Version 0.4.1 |
| Software, algorithm | FastQC | http://www.bioinformatics.bbsrc.ac.uk/projects/fastqc | RRID:SCR_014583 | |
| Software, algorithm | SAMTOOLS | Li et al., 2009 | RRID:SCR_002105 | Version 1.2 |
| Software, algorithm | STAR | Dobin et al., 2013 | RRID:SCR_004463 | Version 2.4.2 |
| Software, algorithm | DESeq2 | Love et al., 2014 | RRID:SCR_015687 | |
| Software, algorithm | Bowtie 2 | Langmead and Salzberg, 2012 | RRID:SCR_016368 | Version 2.2.5 |
| Software, algorithm | MACS | Zhang et al., 2008 | RRID:SCR_013291 | Version 2.1.1 |
| Software, algorithm | Bowtie | Langmead et al., 2009 | RRID:SCR_005476 | Version 1.0.0 |
| Software, algorithm | HTSeq | Anders et al., 2015 | RRID:SCR_005514 | Version 0.6.1p1 |
| Software, algorithm | ggplot2 | http://ggplot2.org | RRID:SCR_014601 | |
| Software, algorithm | Pheatmap | https://CRAN.R-project.org/package=pheatmap | RRID:SCR_016418 | |
| Software, algorithm | DAVID | Huang et al., 2009 | RRID:SCR_001881 | |
| Software, algorithm | GenoSTAN | Zacher et al., 2017 | ||
| Software, algorithm | MEME Suite - motif-based sequence analysis tools | Bailey et al., 2009 | RRID:SCR_001783 | Version 4.11.2 |
| Software, algorithm | 3D Genome | http://promoter.bx.psu.edu/hi-c/ | RRID:SCR_017525 | |
| Software, algorithm | DEoptim | Dukler et al., 2017 | ||
| Software, algorithm | ROSE | Lovén et al., 2013; Whyte et al., 2013 | RRID:SCR_017390 | |
| Software, algorithm | PIQ | Sherwood et al., 2014 | ||
| Software, algorithm | TFBSTool | Tan and Lenhard, 2016 |
Additional files
-
Supplementary file 1
List of superenhancers identified from chromatin accessibility, BRD4, C/EBPα, and H3K27Ac occupancies.
- https://cdn.elifesciences.org/articles/65381/elife-65381-supp1-v1.xlsx
-
Supplementary file 2
GO analysis on superenhancers identified from BRD4 signal.
- https://cdn.elifesciences.org/articles/65381/elife-65381-supp2-v1.xlsx
-
Supplementary file 3
GO analysis on superenhancers identified from H3K27Ac ChIP-seq signal.
- https://cdn.elifesciences.org/articles/65381/elife-65381-supp3-v1.xlsx
-
Supplementary file 4
GO analysis on superenhancers identified from C/EBPα signal.
- https://cdn.elifesciences.org/articles/65381/elife-65381-supp4-v1.xlsx
-
Supplementary file 5
GO analysis on superenhancers identified from chromatin accessibility signal.
- https://cdn.elifesciences.org/articles/65381/elife-65381-supp5-v1.xlsx
-
Supplementary file 6
Primer list.
- https://cdn.elifesciences.org/articles/65381/elife-65381-supp6-v1.docx
-
Supplementary file 7
Quality assessment of ChIP seq data sets.
- https://cdn.elifesciences.org/articles/65381/elife-65381-supp7-v1.xlsx
-
Transparent reporting form
- https://cdn.elifesciences.org/articles/65381/elife-65381-transrepform-v1.pdf
Download links
A two-part list of links to download the article, or parts of the article, in various formats.
Downloads (link to download the article as PDF)
Open citations (links to open the citations from this article in various online reference manager services)
Cite this article (links to download the citations from this article in formats compatible with various reference manager tools)
Evidence for additive and synergistic action of mammalian enhancers during cell fate determination
eLife 10:e65381.
https://doi.org/10.7554/eLife.65381


