The whale shark genome reveals patterns of vertebrate gene family evolution
- Illinois Natural History Survey at University of Illinois Urbana-Champaign, United States
- Smurfit Institute of Genetics, Trinity College Dublin, Ireland
- University of Maryland School of Medicine, Institute of Marine & Environmental Technology, United States
- Okinawa Churashima Research Center, Okinawa Churashima Foundation, Japan
- Okinawa Churaumi Aquarium, Motobu, Japan
- RIKEN Center for Biosystems Dynamics Research (BDR), RIKEN, Japan
- National Human Genome Research Institute, National Institutes of Health, United States
- Georgia Aquarium, United States
- Department of Infectious Diseases, Emory University School of Medicine, United States
Figures
Figure 1
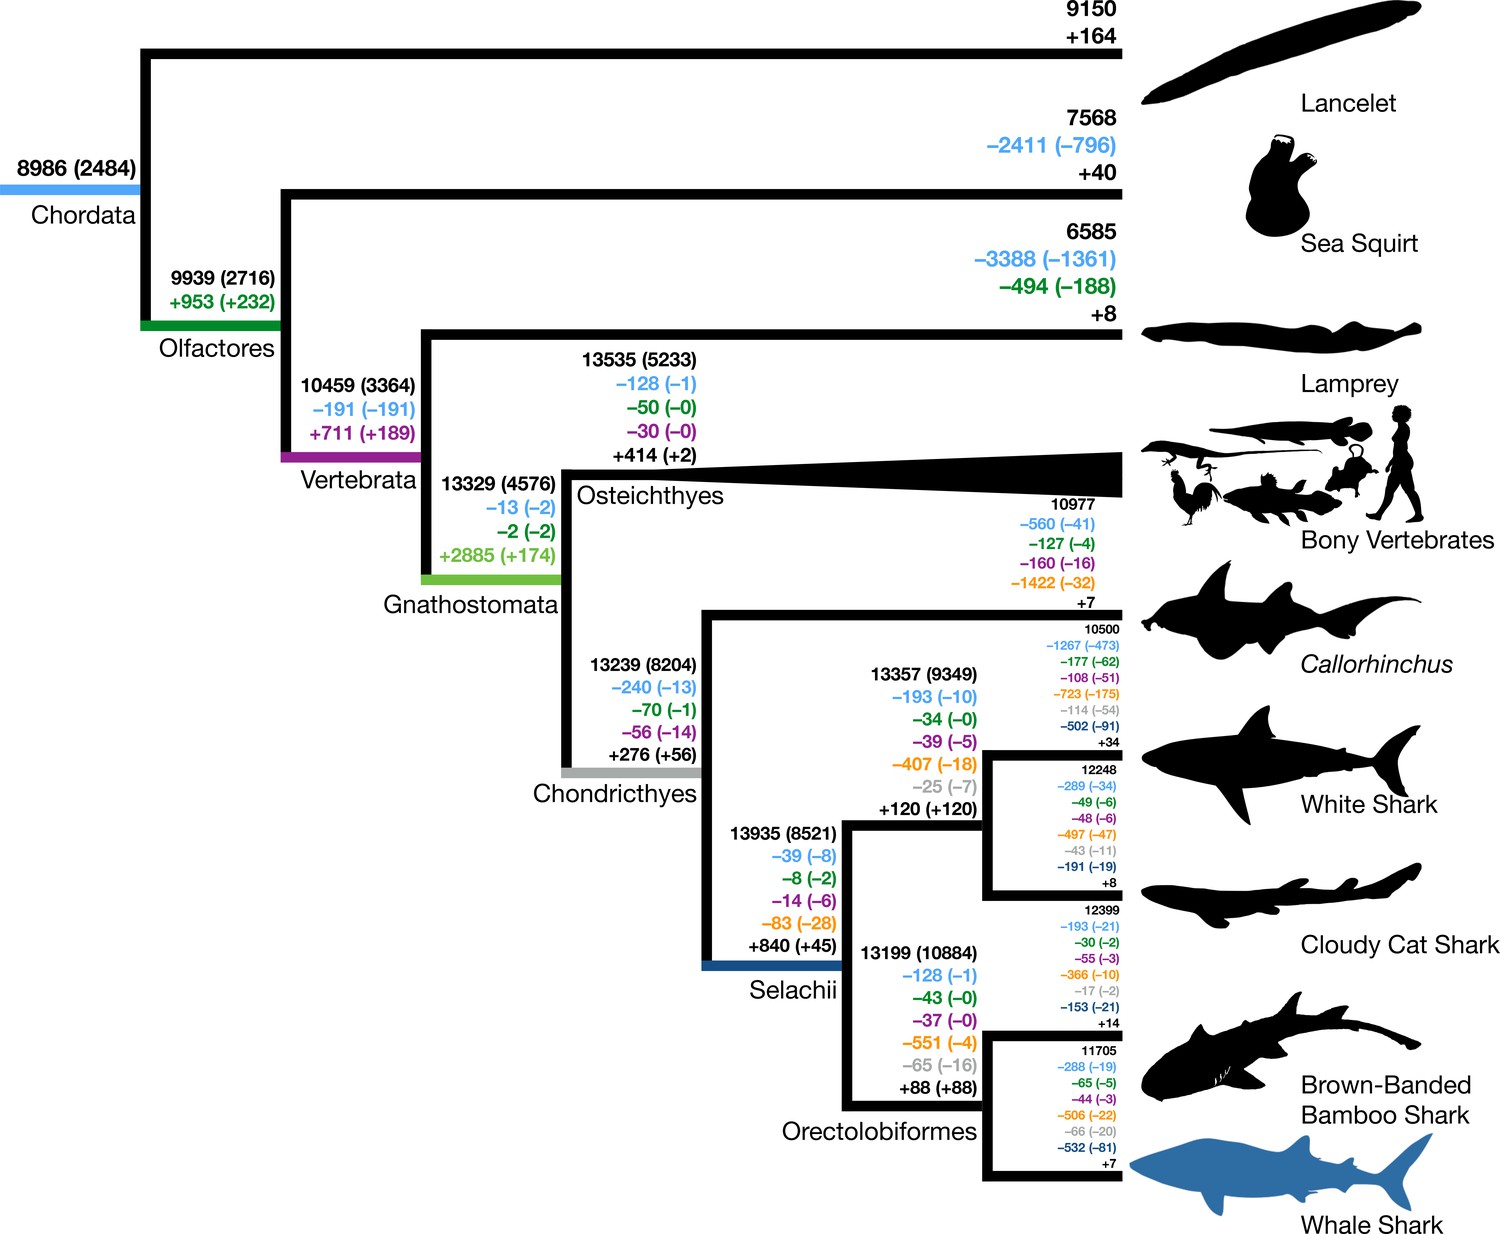
Origins and losses of vertebrate gene families.
Above the branch in black is the total number of gene families inferred to be present in the most recent common ancestor at that branch; the number in parentheses indicates the number of gene families conserved in all descendants of that branch. Numbers preceded by + and – indicate the number of gene families inferred to be gained or lost along that branch, respectively. Gains and losses are color-coded based on the branch where these gene families originated. Light blue indicates gene families present in the most recent common ancestor of chordates, green indicates gene families that originated in the most recent common ancestor of tunicates and vertebrates (Olfactores), purple indicates vertebrate-derived gene families, orange indicates gnathostome-derived gene families, gray indicates chondrichthyan-derived gene families, while dark blue indicates shark-derived gene families. Negative numbers within parentheses indicate gene family losses that are unique to that branch (as opposed to gene families that were also lost along other branches). Positive colored numbers within parentheses indicate novel gene families conserved in all descendants (‘core’ gene families).
Figure 2 with 4 supplements
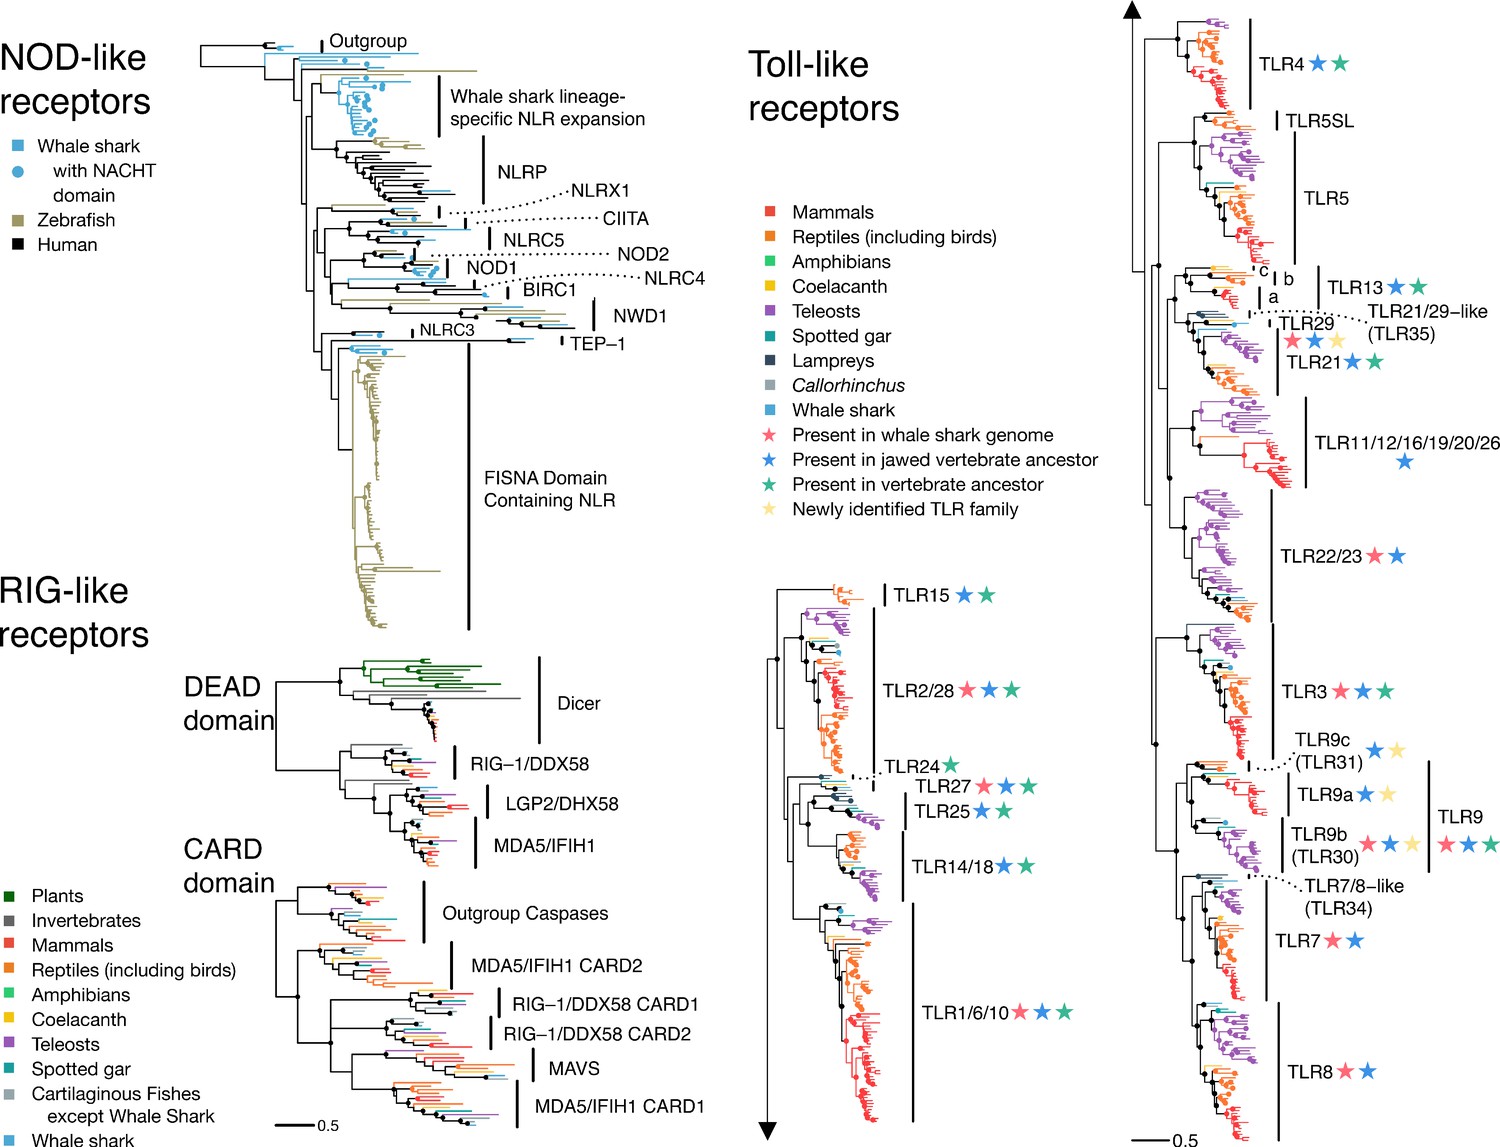
The pathogen recognition receptor (PRR) repertoire of whale shark.
Nodes supported ≥95% UFBOOT indicated with a dot. For NOD-like receptors, NLRs in whale shark with a NACHT domain are indicated by a dot at the tip. See also Figure 2—figure supplements 1–2. For RIG-like receptors (RLRs), branches are colored by gene, except for RLRs in whale shark which are colored distinctly and labeled by a dot at each tip. See also Figure 2—figure supplement 3. For toll-like receptors (TLRs), each clade represents a separate TLR except families found within TLR13 are also labeled a (TLR13a), b (TLR32), and c (TLR33). TLR families are also labeled by stars indicating whether they were present in the whale shark genome, present in jawed vertebrate ancestor, present in the vertebrate ancestor, and novel to this study. See also Figure 2—figure supplement 4.
Figure 2—figure supplement 1
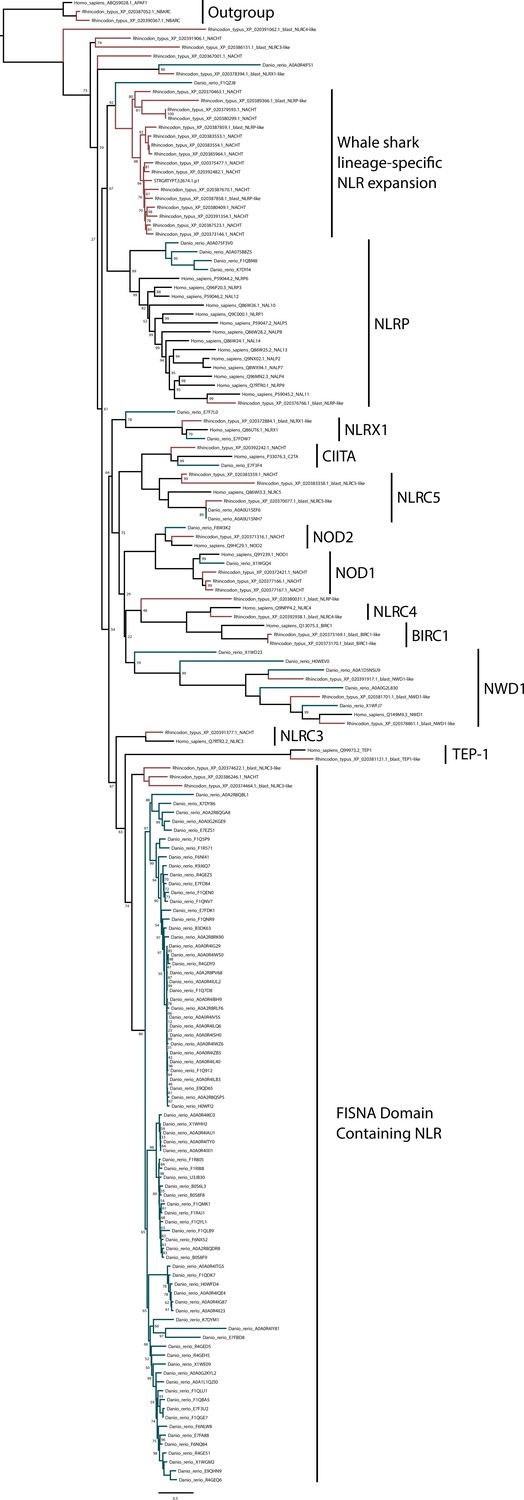
Phylogenetic analysis of NOD-like receptors (NLRs) from whale shark, zebrafish, and human.
Branches leading to human sequences are shown in black, to zebrafish in blue-green, and whale shark in red. Whale shark sequences with a detectable NACHT have ‘_NACHT’ at the end of the sequence identifier (except for transcriptome sequence which all contain NACHT domains; all NACHT domain containing sequences are also noted with ‘*’ in Supplementary file 12).
Figure 2—figure supplement 2
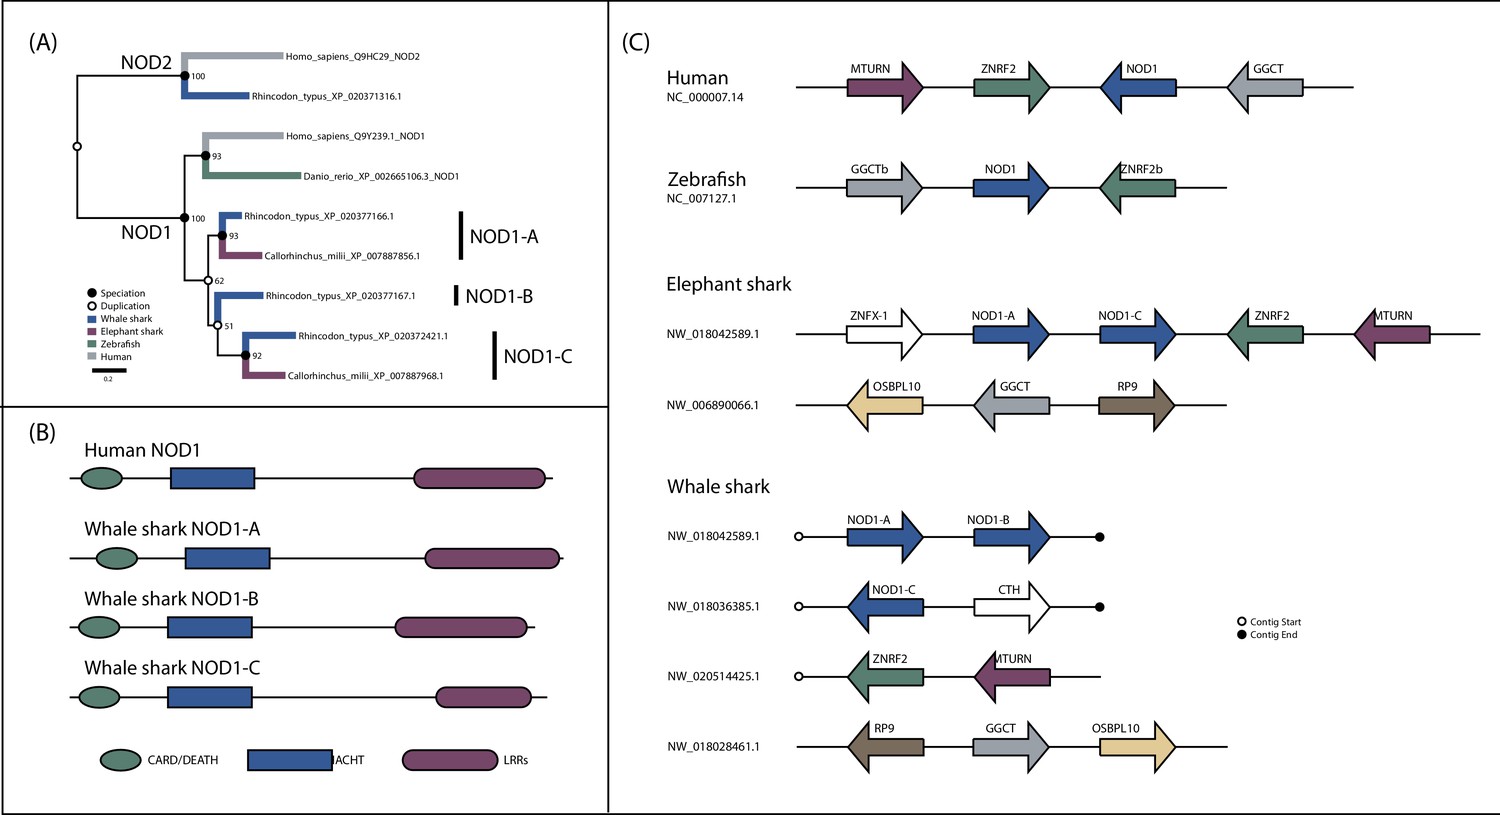
Detailed analysis of NOD1 evolution.
(A) Phylogenetic analysis of NOD1 focused NOD-like receptor (NLR) dataset. (B) Domain structure of NOD1 duplicates in whale shark. (C) Synteny analysis of jawed vertebrate NOD1s.
Figure 2—figure supplement 3
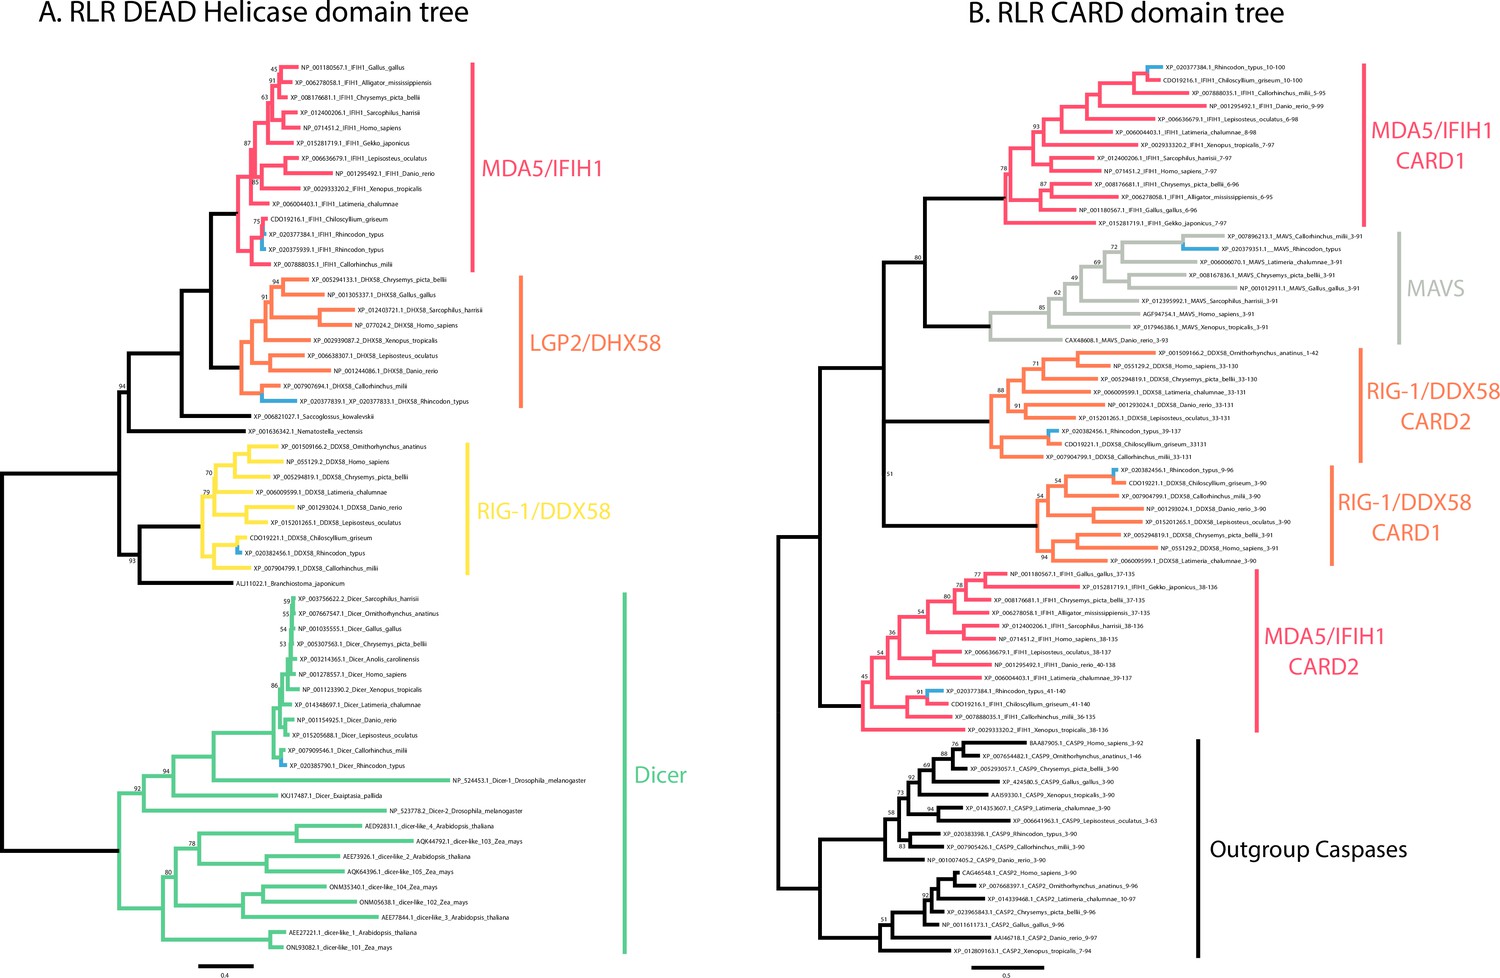
Phylogenetic analyses of whale shark and jawed vertebrate RIG-like receptors (RLRs), DICER, and mitochondrial antiviral signaling (MAVS).
(A) Tree of the RLR and DICER DEAD-Helicase domains. (B) Tree of the RLR and MAVS CARD domains. Whale shark sequences are highlighted in blue.
Figure 2—figure supplement 4

Phylogenetic tree of vertebrate toll-like receptors (TLRs), including new whale shark sequences.
The tree is rooted according to the minimal ancestor deviation method (Tria et al., 2017).
Figure 3
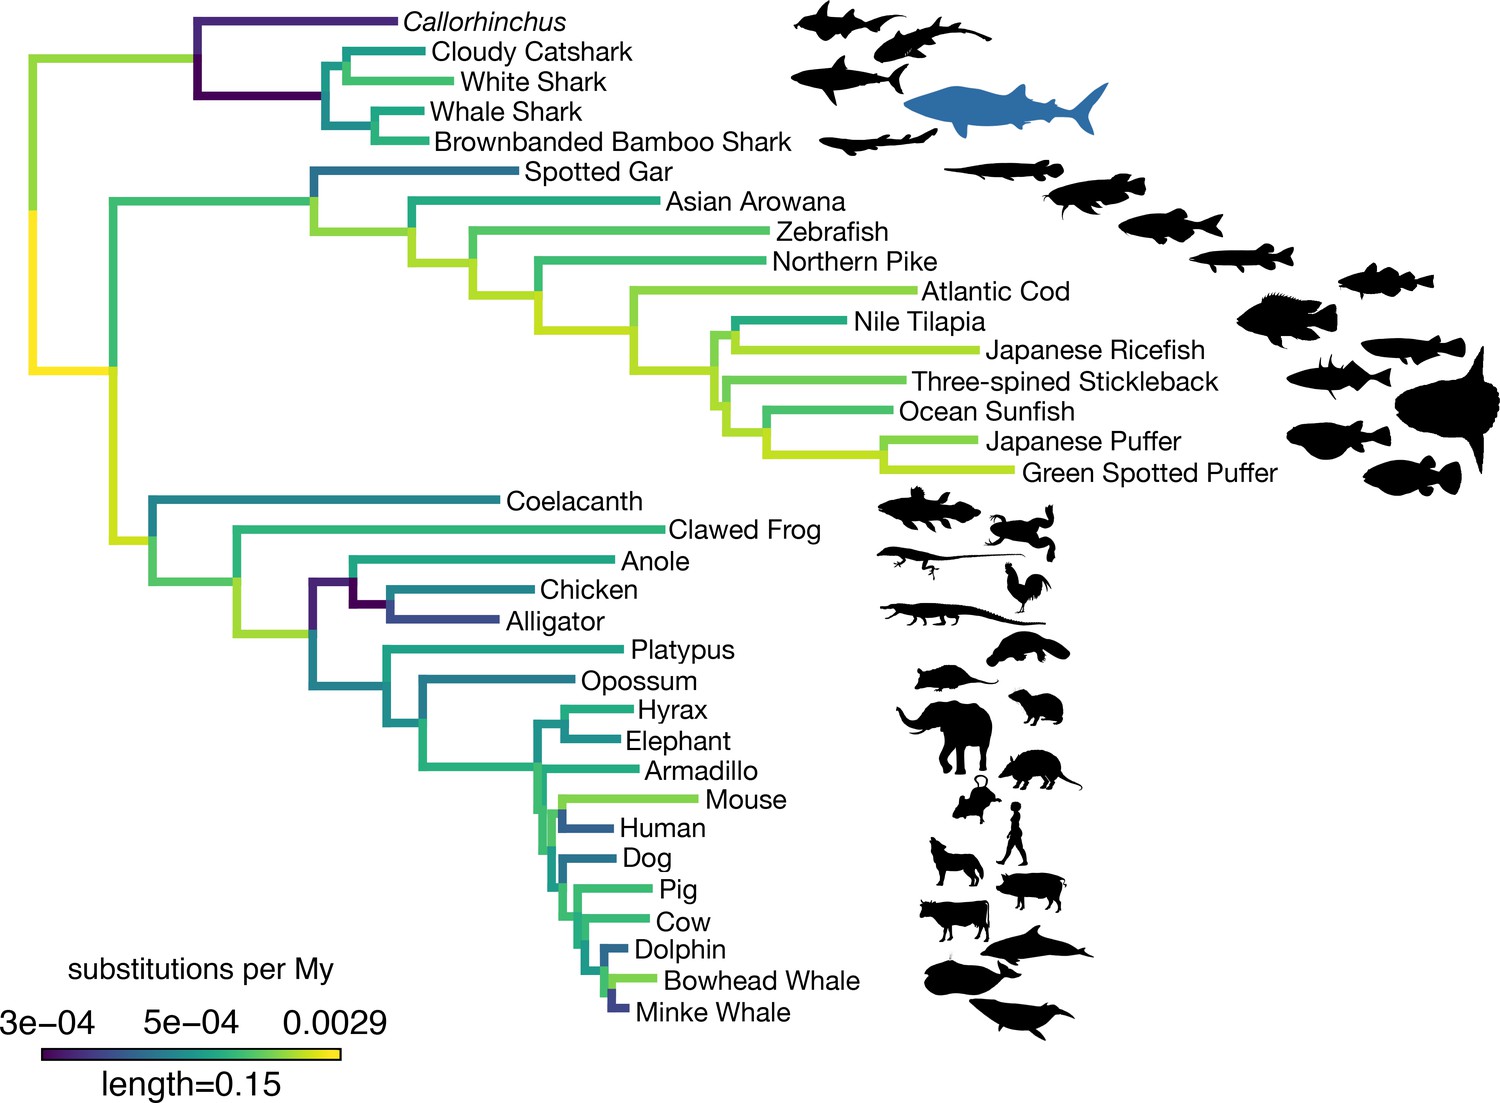
Amino acid substitution rate variation among jawed vertebrates.
Branches are colored based on rates quantified by substitutions per site per million years of the maximum likelihood tree compared to a time-calibrated tree. Together, sharks have a slower rate of molecular evolution than Callorhinchus (see text on two-cluster test). However, sharks do not have a significantly slower rate of molecular evolution than spotted gar. Furthermore, vertebrate giants – including the whale shark, ocean sunfish, elephant, and whales – have significantly lower rates of molecular evolution than other vertebrates. Note, color scale is on normalized reciprocal-transformed data, which emphasizes changes between smaller values of substitution per My.
Figure 4
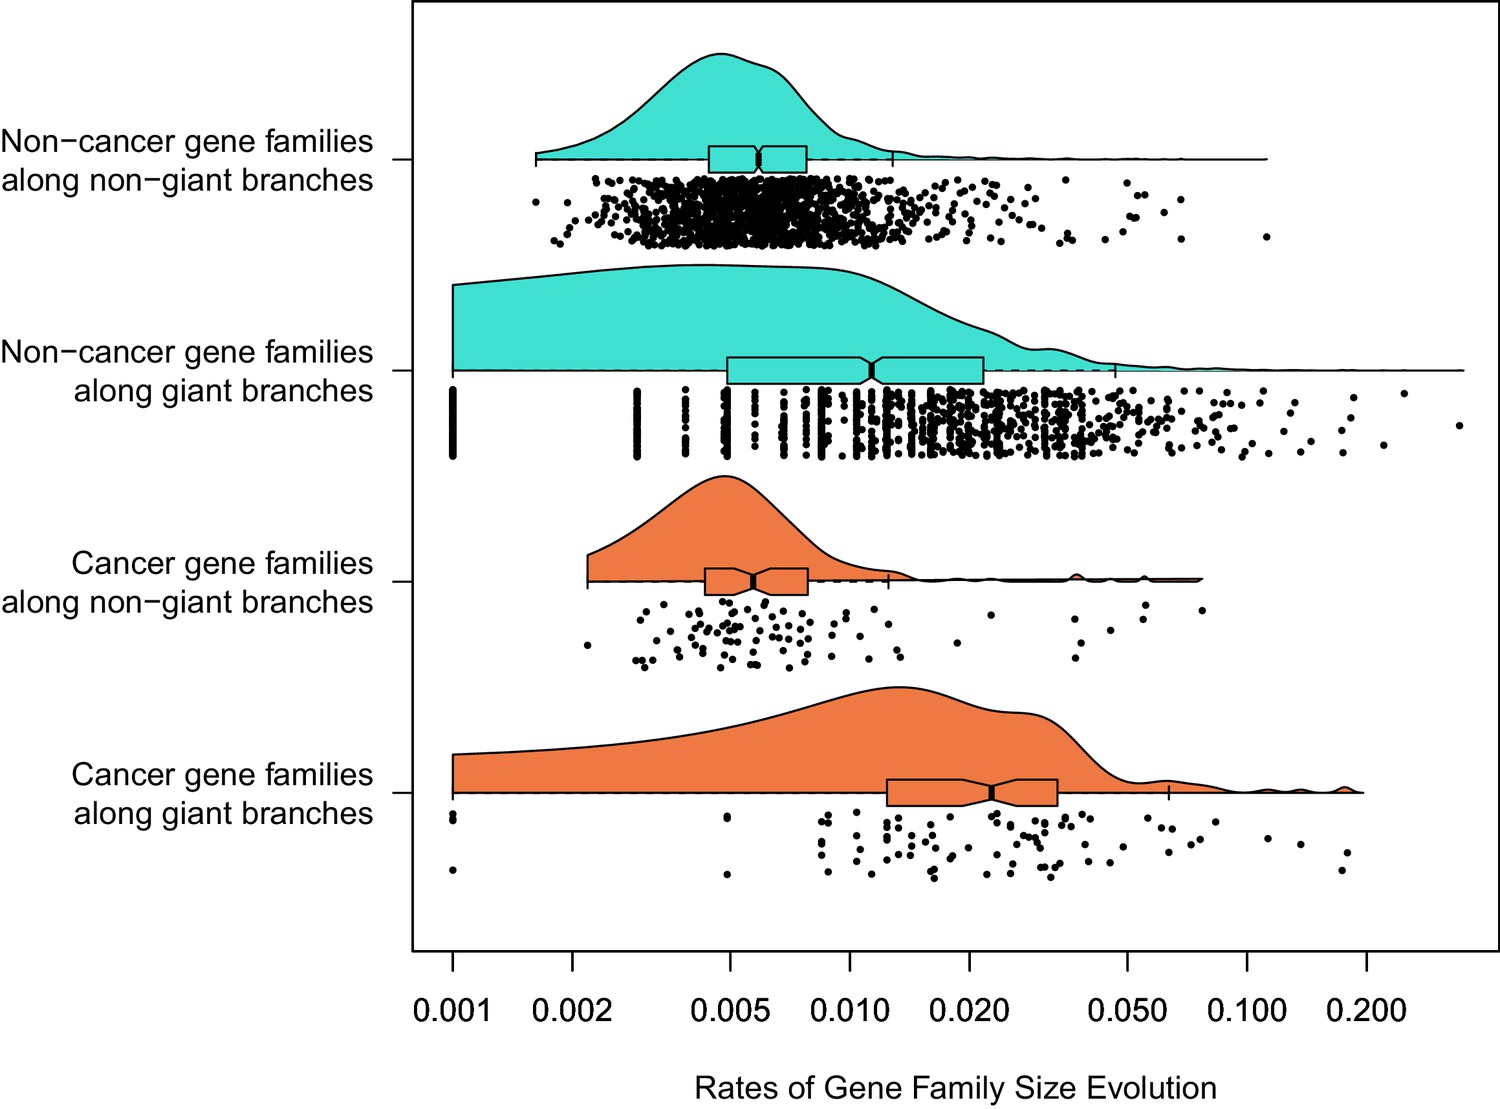
Among 1387 gene families with a significant rate shift.
Branch-specific rates of gene family size evolution for branches leading to giant taxa were significantly higher than in branches leading to other taxa, and additionally the rate of gene family size evolution was even greater in cancer-related gene families related to other gene families specifically in branches leading to giant taxa.
Appendix 1—figure 1
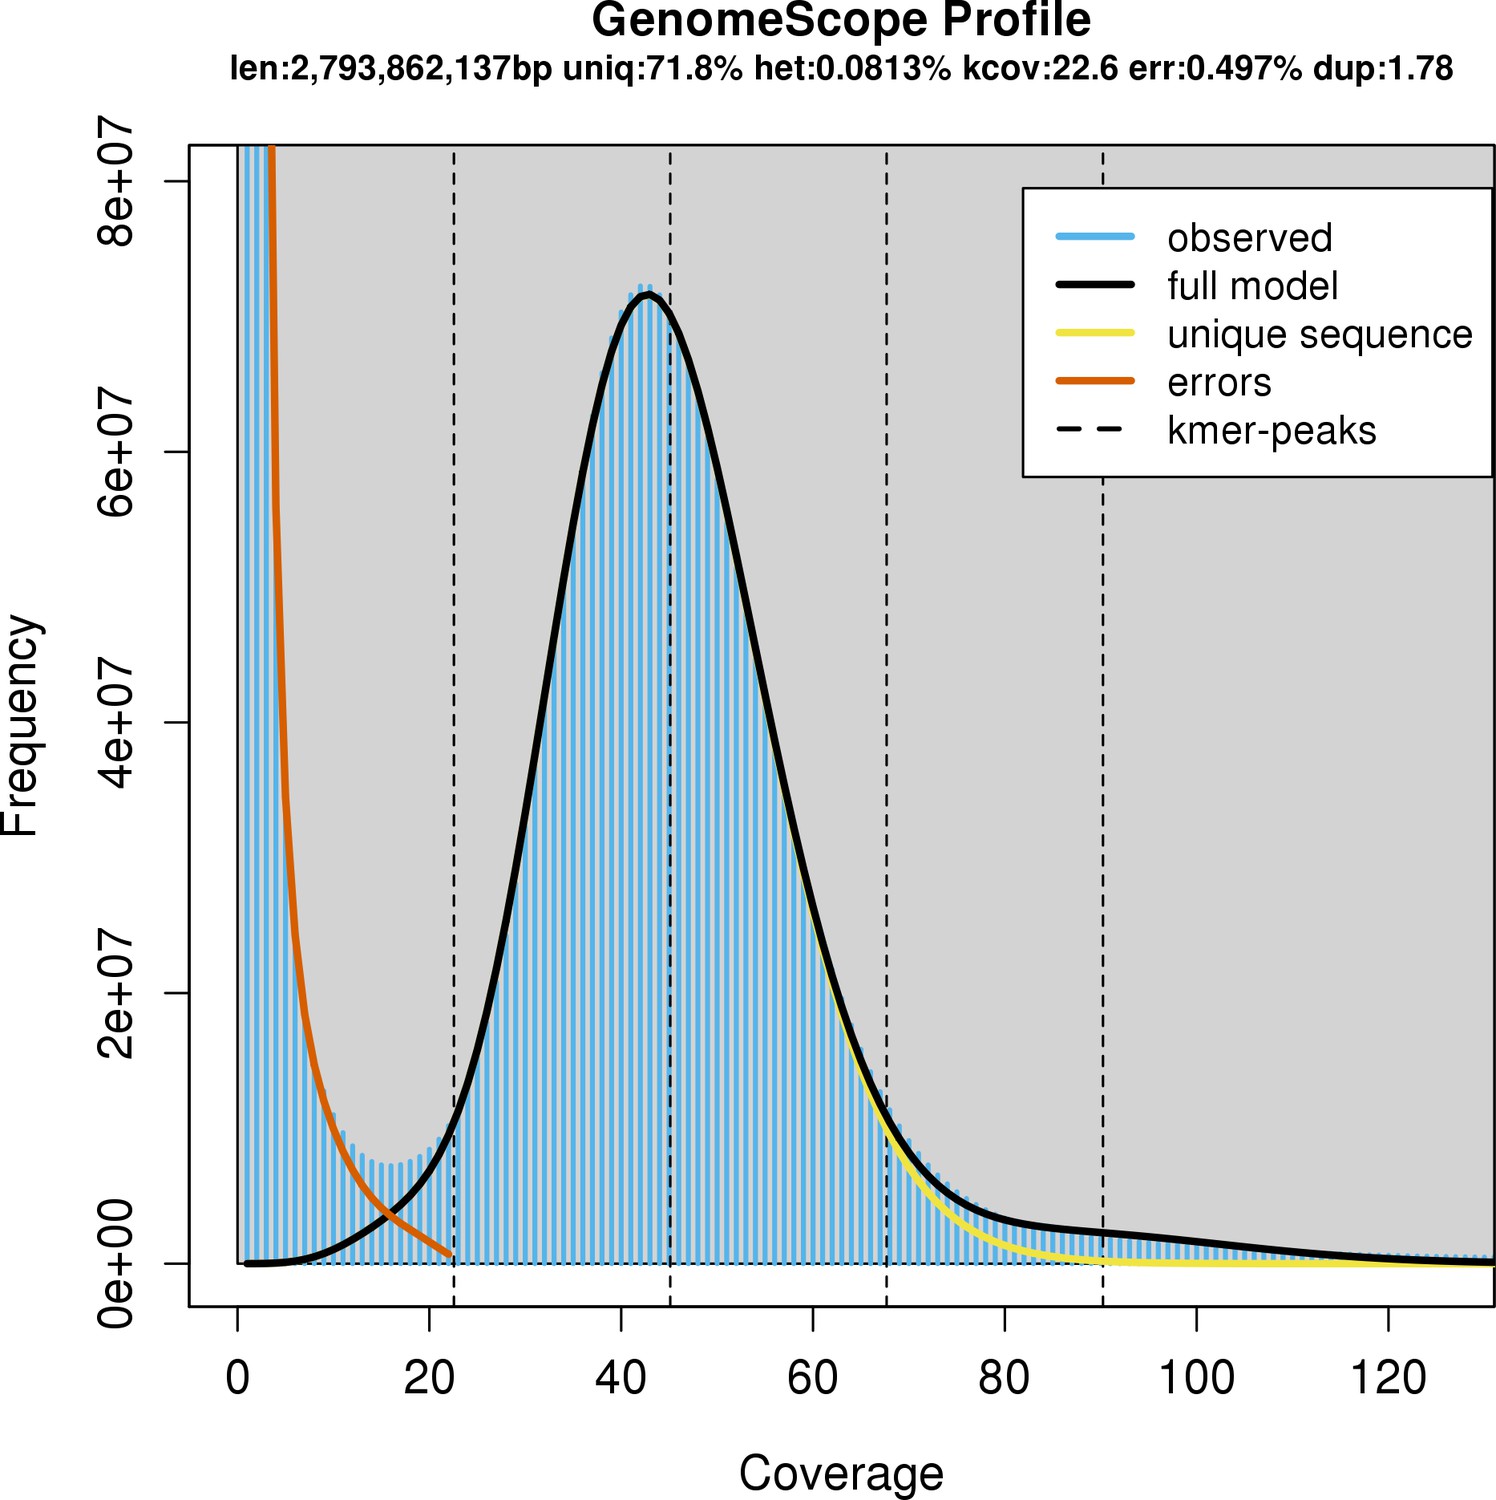
Characteristics of the whale shark genome assembly by k-mer profiling of raw Illumina reads by GenomeScope.
GenomeScope fits a model to estimate genome parameters including heterozygosity (het), an estimated genome size (len), the unique proportion of the genome (uniq; as opposed to the remainder which would be repetitive genome length). Profiling of k-mers reveals high coverage sequencing as well as low heterozygosity. Consistent with low heterozygosity, most of the k-mers form one peak centered around roughly 40× coverage, and do not form another peak centered at roughly half the coverage that would represent k-mers arising from heterozygous alleles.
Appendix 1—figure 2
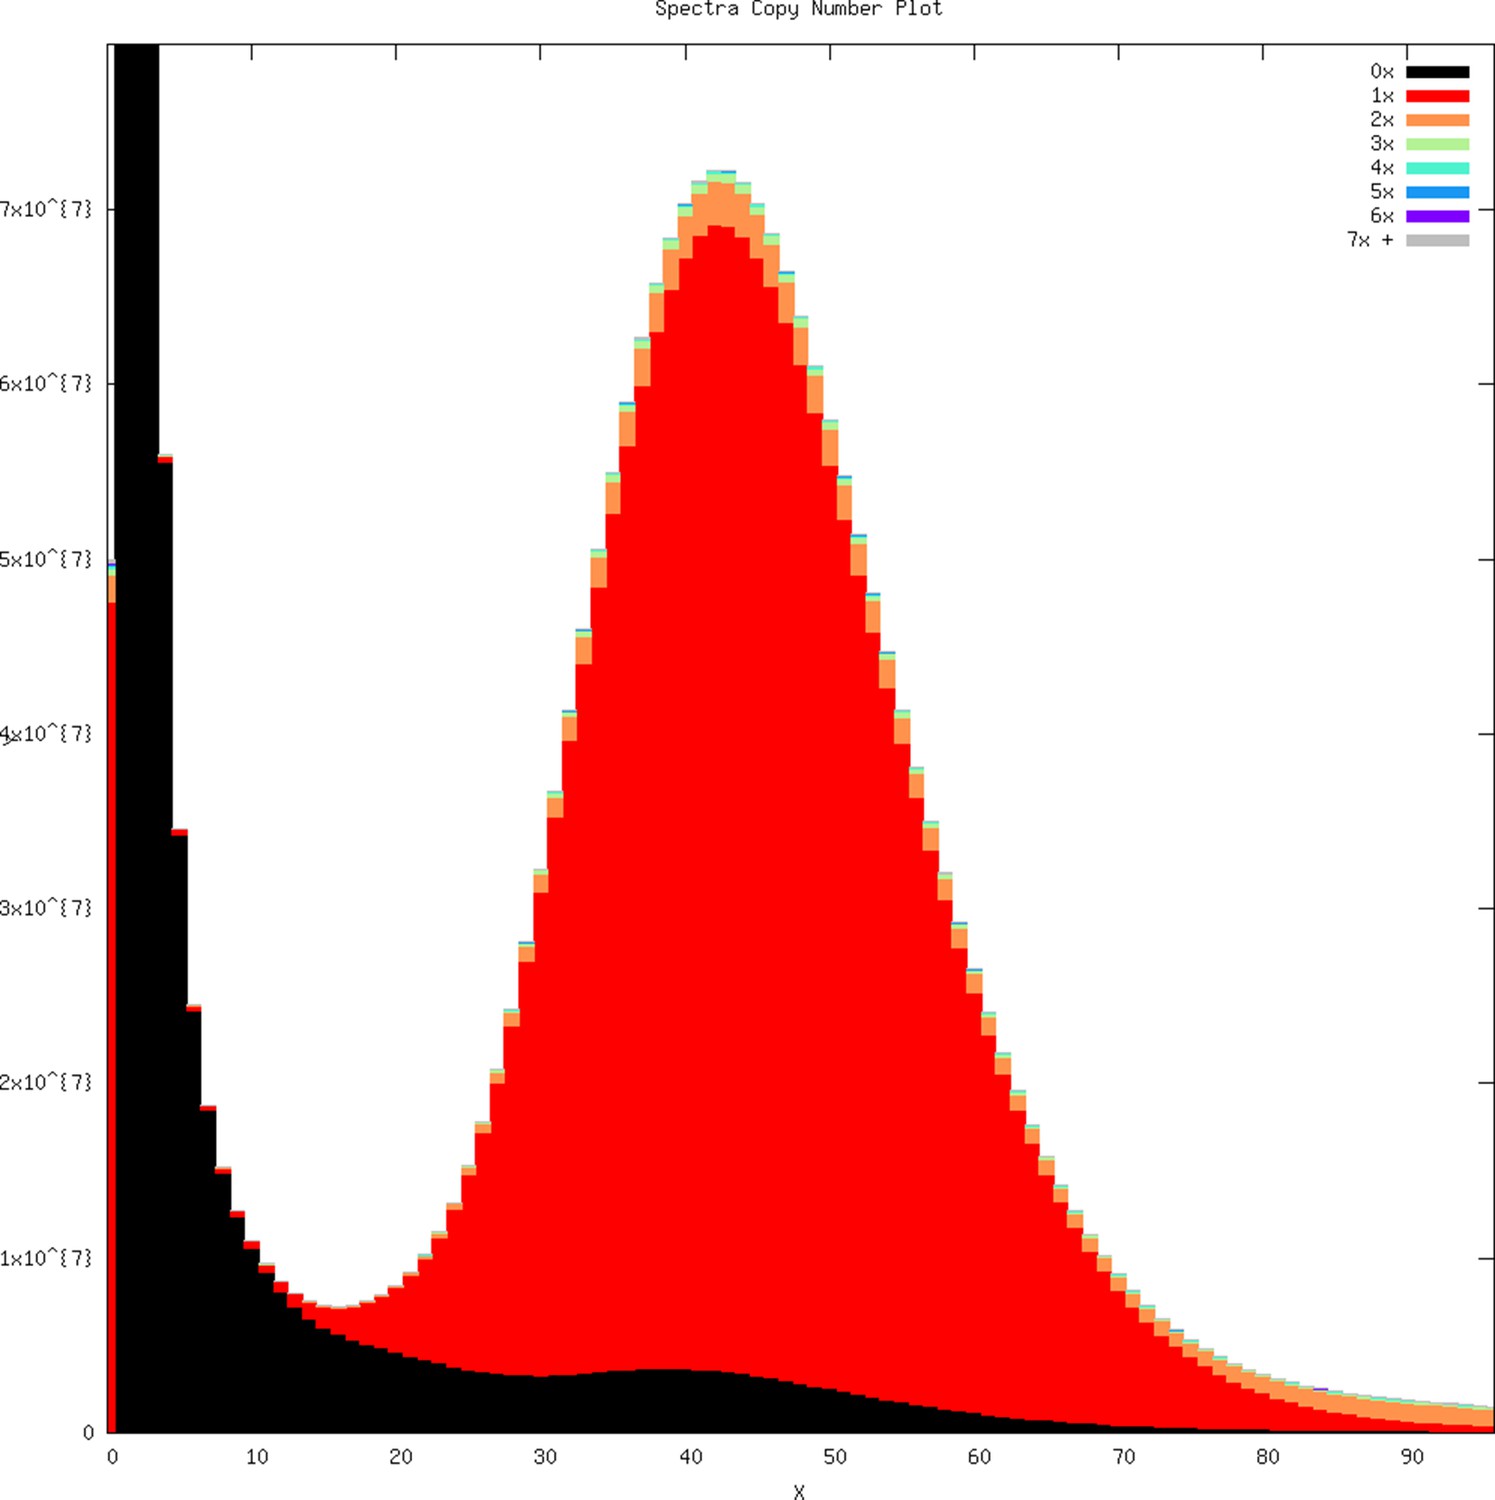
k-mer profile overlaid with copy number representation within the genome assembly as produced by KAT.
k-mers arising from error in Illumina raw reads on the left part of the plot are not within the assembly (represented 0×). Most of the k-mers in the genome assembly are represented by a single copy (1×, red), suggesting an accurate haploid genome assembly with few diploid alleles assembled as separate contigs.
Appendix 4—figure 1
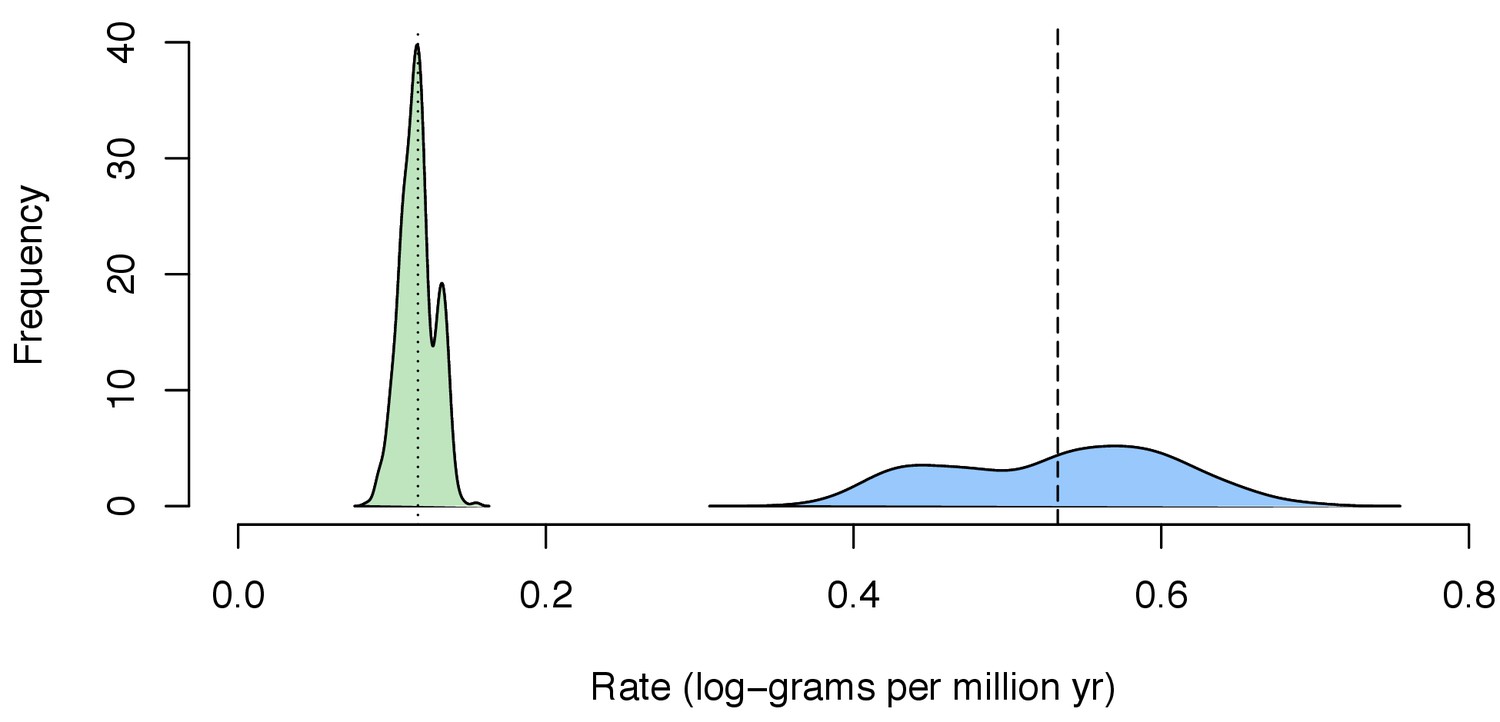
Distribution of mean estimated rate of body size evolution of the posterior distribution estimated for each tree sample (n = 500) for the background in Chondrichthyes (green) and for the whale shark (blue).
Dotted line indicates mean estimated rate for Chondrichthyes across all tree samples, while the dashed line indicates mean estimated rate for the whale shark.
Tables
Table 1
Vertebrate and invertebrate pathogen recognition receptor (PRR) repertoires.
Superscripts indicate these citations: 1: Chen et al., 2021; 2: Howe et al., 2016; 3: Mukherjee et al., 2014; 4: Kasamatsu et al., 2010; 5: Buckley and Rast, 2015 ; 6: Tassia et al., 2017.
| Species | Toll-like receptors (TLRs) | NOD-like receptors (NLRs) | RIG-like receptors (RLRs) |
|---|---|---|---|
| Jawed vertebrates | |||
| Homo sapiens (human) | 10 | 21 | 3 |
| Danio rerio (zebrafish) | 201 | 4212 | 33 |
| Rhincodon typus (whale shark) | 13 | 43 | 3 |
| Jawless vertebrates | |||
| Petromyzon marinus (lamprey) | 164 / 195 | 345 | 23 |
| Invertebrate deuterostomes | |||
| Ciona intestinalis | 35 | 165 | 23 |
| Branchiostoma floridae | 196 / 725 | 925 | 53 |
| Strongylocentrotus purpuratus | 1046 / 2535 | 2035 | 63 |
| Cephalodiscus hodgsoni | 66 | ||
| Ptychodera flava | 146 | ||
| Saccoglossus kowalevskii | 106 | 33 | |
| Protostomes | |||
| Drosophila melanogaster | 95 | 05 | 0 |
| Daphnia pulex | 75 | 25 | |
| Caenorhabditis elegans | 15 | 05 | 23 |
| Capitella teleta | 1055 | 555 | 23 |
| Helobdella robusta | 165 | 05 | 23 |
| Lottia gigantea | 605 | 15 | 33 |
| Non-bilaterian animals | |||
| Nematostella vectensis | 15 | 425 | 23 |
| Amphimedon queenslandica | 05 | 1355 | 23 |
Additional files
-
Source code 1
Scripts for assessing gene family gain and loss and enrichment of gene family functional annotations (R).
- https://cdn.elifesciences.org/articles/65394/elife-65394-code1-v2.zip
-
Source code 2
Scripts for comparing gene family assignment to known ohnologs (ZIP).
- https://cdn.elifesciences.org/articles/65394/elife-65394-code2-v2.zip
-
Source code 3
Scripts for estimating divergence times using TREEPL and comparing rates of substitution using LINTRE and PAML (ZIP).
- https://cdn.elifesciences.org/articles/65394/elife-65394-code3-v2.zip
-
Source code 4
Scripts for summarizing CAFE results for rates of gene family size evolution and enrichment of functional annotations and cancer-related function (ZIP).
- https://cdn.elifesciences.org/articles/65394/elife-65394-code4-v2.zip
-
Source code 5
Scripts for annotating repetitive sequences (SH).
- https://cdn.elifesciences.org/articles/65394/elife-65394-code5-v2.zip
-
Source code 6
Scripts for assessing rates of body size evolution across cartilaginous fishes and compared to the whale shark (R).
- https://cdn.elifesciences.org/articles/65394/elife-65394-code6-v2.zip
-
Source data 1
Table for Statistical Reporting Form.
- https://cdn.elifesciences.org/articles/65394/elife-65394-data1-v2.xlsx
-
Supplementary file 1
Comparison of whale shark genome assemblies.
- https://cdn.elifesciences.org/articles/65394/elife-65394-supp1-v2.xlsx
-
Supplementary file 2
BUSCO v2 and core vertebrate gene (CVG) results.
BUSCO v2 and CVG results for brownbanded bamboo shark and cloudy catshark were those reported by Hara et al., 2018 Figure 2—figure supplement 1d, who did not report Complete Single-copy and Complete Duplicate numbers and only reported percentages. Callorhinchus CVG scores are reported on the gVolante database (https://gvolante.riken.jp/script/database.cgi, accessed January 19, 2021). The BUSCO v2 set has 2586 vertebrate orthologs, while the CVG has 233 total genes. Note CVG does not report if complete are single copy or duplicated. Percentages in parentheses. Note also that Callorhinchus was used in the ortholog design of both sets and therefore BUSCO and CVG overestimate its completeness.
- https://cdn.elifesciences.org/articles/65394/elife-65394-supp2-v2.xlsx
-
Supplementary file 3
Chordate species with whole-genomic data included in comparative genomic analyses.
- https://cdn.elifesciences.org/articles/65394/elife-65394-supp3-v2.xlsx
-
Supplementary file 4
Orthogroup assignment by OrthoFinder of chordate proteins (CSV).
- https://cdn.elifesciences.org/articles/65394/elife-65394-supp4-v2.txt
-
Supplementary file 5
Gene ontology (GO) and Pfam annotations of orthogroups assigned by KinFin (tab-delimited table TSV).
- https://cdn.elifesciences.org/articles/65394/elife-65394-supp5-v2.tsv
-
Supplementary file 6
Summary of functional enrichment tests of gene families gained and lost throughout chordate evolution.
We tested whether or not gene families in the foregrounds were enriched for functional terms and domains (gene ontology [GO], Pfam) relative to the background of what was present at a relevant ancestor.
- https://cdn.elifesciences.org/articles/65394/elife-65394-supp6-v2.xlsx
-
Supplementary file 7
Significantly enriched functional and domain terms identified in novel gene families (orthogroups, Supplementary file 5) gained in the most recent common ancestor (MRCA) of Olfactores.
n refers to the number of these gene families with that function gained. p refers to uncorrected p-values for Fisher’s exact test, adj.p refers to the adjusted p-value for multiple testing (see Materials and methods). See Supplementary file 19 for specific assignments of human gene names to each orthogroup.
- https://cdn.elifesciences.org/articles/65394/elife-65394-supp7-v2.xlsx
-
Supplementary file 8
Significantly enriched functional and domain terms identified in novel gene families (orthogroups) gained in the most recent common ancestor (MRCA) of vertebrates.
n refers to the number of these gene families with that function gained. p.value refers to uncorrected p-values for Fisher’s exact test, adj.p refers to the adjusted p-value for multiple testing (see Materials and methods). See Supplementary file 19 for specific assignments of human gene names to each orthogroup.
- https://cdn.elifesciences.org/articles/65394/elife-65394-supp8-v2.xlsx
-
Supplementary file 9
Significantly enriched functional and domain terms identified in novel gene families (orthogroups) gained in the most recent common ancestor (MRCA) of gnathostomes.
n refers to the number of these gene families with that function gained. p.value refers to uncorrected p-values for Fisher’s exact test, adj.p refers to the adjusted p-value for multiple testing (see Materials and methods). See Supplementary file 19 for specific assignments of human gene names to each orthogroup.
- https://cdn.elifesciences.org/articles/65394/elife-65394-supp9-v2.xlsx
-
Supplementary file 10
Significantly enriched functional and domain terms identified in novel gene families (orthogroups) gained in the most recent common ancestor (MRCA) of Osteichthyes.
n refers to the number of these gene families with that function gained. p.value refers to uncorrected p-values for Fisher’s exact test, adj.p refers to the adjusted p-value for multiple testing (see Materials and methods). See Supplementary file 19 for specific assignments of human gene names to each orthogroup.
- https://cdn.elifesciences.org/articles/65394/elife-65394-supp10-v2.xlsx
-
Supplementary file 11
Significantly enriched functional and domain terms identified in gene families (orthogroups) lost in the most recent common ancestor (MRCA) of Chondrichthyes.
n refers to the number of these gene families with that function gained. p.value refers to uncorrected p-values for Fisher’s exact test, adj.p refers to the adjusted p-value for multiple testing (see Materials and methods). See Supplementary file 19 for specific assignments of human gene names to each orthogroup.
- https://cdn.elifesciences.org/articles/65394/elife-65394-supp11-v2.xlsx
-
Supplementary file 12
Whale shark pathogen recognition receptor (PRR) gene accessions.
Sequences that have identical or are isoforms of the same gene are indicated. TLR9 and TLR29 sequences that were not annotated are also indicated.
- https://cdn.elifesciences.org/articles/65394/elife-65394-supp12-v2.xlsx
-
Supplementary file 13
CAFE output for rates of gene duplication and loss of vertebrate orthogroups computed under a single global rate of gene duplication and loss for orthogroups (TXT).
- https://cdn.elifesciences.org/articles/65394/elife-65394-supp13-v2.txt
-
Supplementary file 14
Significantly enriched functional and domain terms identified in gene families (orthogroups) with a rate shift in gene family size in any part of the vertebrate phylogeny.
n refers to the number of these gene families with that function gained. p.value refers to uncorrected p-values for Fisher’s exact test, adj.p refers to the adjusted p-value for multiple testing (see Materials and methods). See Supplementary file 19 for specific assignments of human gene names to each orthogroup.
- https://cdn.elifesciences.org/articles/65394/elife-65394-supp14-v2.xlsx
-
Supplementary file 15
Putative conserved vertebrate genes absent from the whale shark RefSeq annotation that were annotated using genBlast.
Annotations are for the GCF_001642345.1 genome assembly (GFF).
- https://cdn.elifesciences.org/articles/65394/elife-65394-supp15-v2.gff
-
Supplementary file 16
Putative conserved vertebrate genes absent from the Callorhinchus RefSeq annotation that were annotated using genBlast.
Annotations are for the GCF_000165045.1 genome assembly (GFF).
- https://cdn.elifesciences.org/articles/65394/elife-65394-supp16-v2.gff
-
Supplementary file 17
Species included and excluded for toll-like receptor (TLR) analysis from Wang et al., 2016 dataset (XLSX).
- https://cdn.elifesciences.org/articles/65394/elife-65394-supp17-v2.xlsx
-
Supplementary file 18
Fossil calibration age ranges, and the result of fossil concordance analysis.
Discordant fossils were excluded from divergence time analysis. All age ranges are derived from Benton et al., 2014, except for the age of Chondricthyes, which were derived from Coates et al., 2017.
- https://cdn.elifesciences.org/articles/65394/elife-65394-supp18-v2.xlsx
-
Supplementary file 19
Human gene names of human orthologs assigned to each orthogroup (TXT).
- https://cdn.elifesciences.org/articles/65394/elife-65394-supp19-v2.txt
-
Supplementary file 20
Repeat library annotated using the MAKER repeat annotation pipeline (FASTA).
Repeat classification of each repeat sequence follows a ‘#’ delimiter.
- https://cdn.elifesciences.org/articles/65394/elife-65394-supp20-v2.fasta
-
Supplementary file 21
Repetitive element content of the whale shark genome assembly (for methods, see Appendix 1).
- https://cdn.elifesciences.org/articles/65394/elife-65394-supp21-v2.xlsx
-
Supplementary file 22
Whale shark transcriptome annotation based on StringTie (GFF).
- https://cdn.elifesciences.org/articles/65394/elife-65394-supp22-v2.gff
-
Transparent reporting form
- https://cdn.elifesciences.org/articles/65394/elife-65394-transrepform-v2.docx
Download links
A two-part list of links to download the article, or parts of the article, in various formats.
Downloads (link to download the article as PDF)
Open citations (links to open the citations from this article in various online reference manager services)
Cite this article (links to download the citations from this article in formats compatible with various reference manager tools)
The whale shark genome reveals patterns of vertebrate gene family evolution
eLife 10:e65394.
https://doi.org/10.7554/eLife.65394


