Ciliary neuropeptidergic signaling dynamically regulates excitatory synapses in postnatal neocortical pyramidal neurons
- Department of Biology, Brandeis University, United States
Figures
Figure 1 with 1 supplement

Acute knockdown of ciliary proteins does not alter dendritic morphology of cortical pyramidal neurons.
(A) Representative images of a DIV11 pyramidal neuron expressing GFP (top), and an inhibitory neuron immunolabeled with GAD67 antibodies (bottom). Cilia (arrows) are immunolabeled using antibodies against AC3 and ARL13B (top) or ARL13B alone (bottom). Scale bars: 5 μm. (B) Percentage of inhibitory (GAD67+) and excitatory (GAD67−) neurons containing cilia immunolabeled with antibodies against AC3 and/or ARL13B. n = 150 total; three dissociations. (C) Lengths of cilia in excitatory and inhibitory neurons. Each dot is a measurement from a single neuron. Bars are average ± SEM. n: GAD67+ = 44, GAD67− = 46; five dissociations. (D) Representative images of neurons expressing GFP alone (top) or shArl13b_1 and GFP (see Key Resources) (bottom). Cilia were immunolabeled with antibodies against AC3 and ARL13B. Images at right show enlarged (2.5×) views of cilia (yellow boxes). Scale bars: 5 μm. (E and F) Relative fluorescence intensities of immunolabeled ciliary ARL13B (E) and cilia lengths (F) in neurons transfected with the indicated plasmids. Each dot is a measurement from a single neuron. Values in (E) are normalized to intensity in control neurons. Bars are average ± SEM. *** indicates p<0.001 for the indicated conditions (Kruskal–Wallis with Dunn’s multiple comparisons test). n: Control = 34, shArl13b_1 = 43, shArl13b_2 = 40; four dissociations. (G) Representative images of pyramidal neurons expressing GFP alone (control) or shArl13b_1 and GFP. Scale bar: 50 μm. (H and I) Total lengths (H) and number of branch points (I) of apical-like dendritic arbors of neurons expressing GFP or shArl13b_1 and GFP. Each dot is a measurement from a single neuron. Bars are average ± SEM. n: Control = 32, shArl13b_1 = 28; four dissociations. Here and below, statistical tests used and exact p-values for each comparison are shown in Supplementary file 1. Also see Figure 1—figure supplement 1.
-
Figure 1—source data 1
Source data for Figure 1.
- https://cdn.elifesciences.org/articles/65427/elife-65427-fig1-data1-v2.xlsx
Figure 1—figure supplement 1
Gross neuronal morphology is unaltered upon acute knockdown of ciliary proteins.
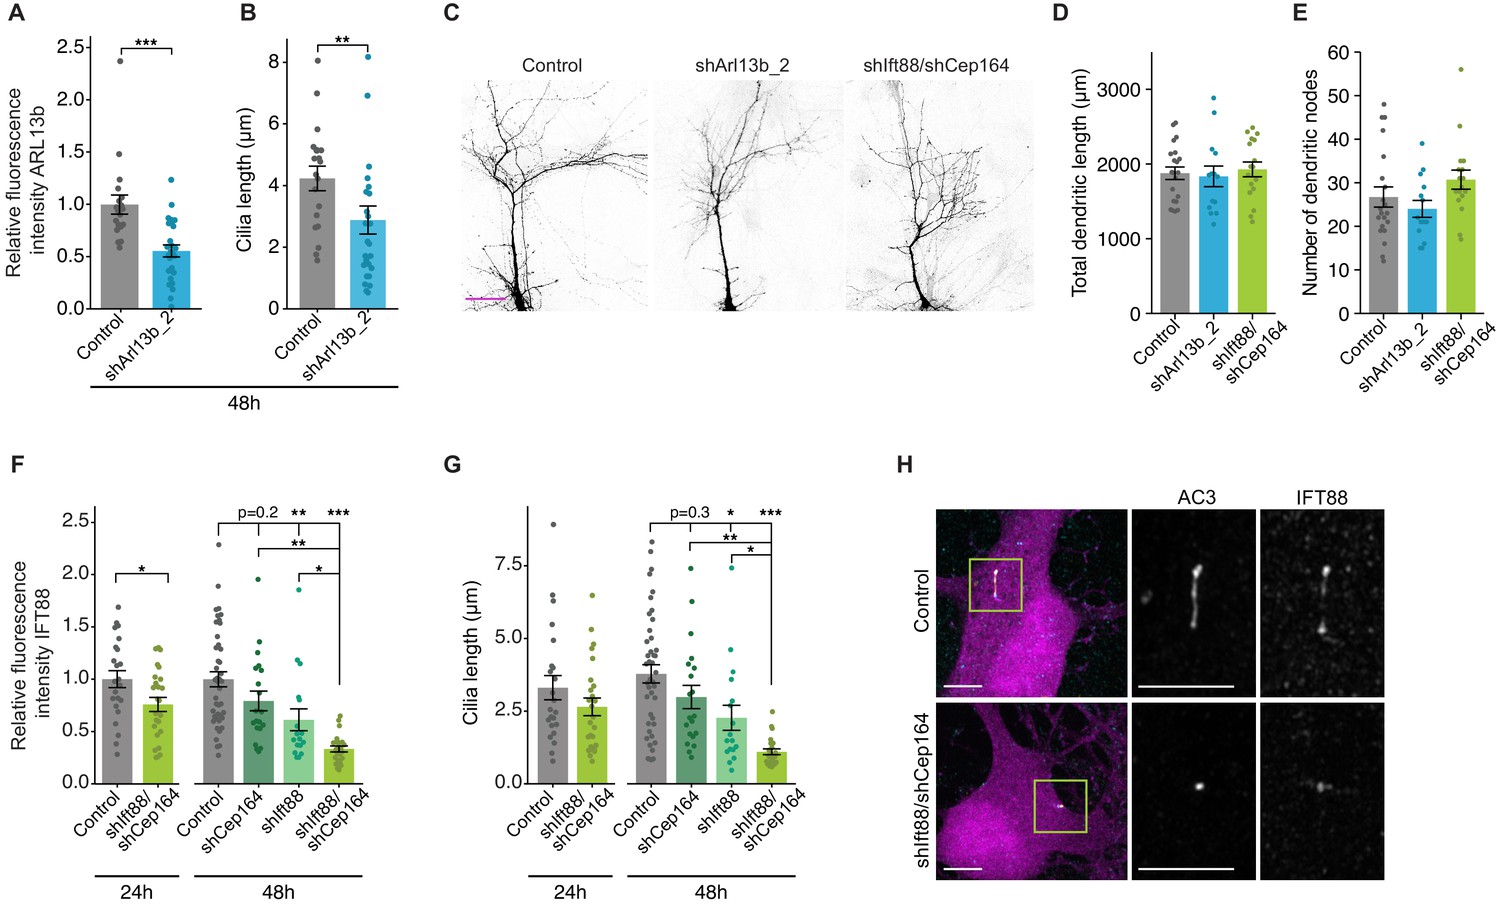
(A and B) Relative fluorescence intensities of immunolabeled ciliary ARL13b (A) and cilia lengths (B) in neurons transfected with the indicated plasmids 48 hr post-transfection. Each dot is a measurement from a single neuron. Values in A are normalized to values in controls. Bars are average ± SEM. ** and *** indicate p<0.01 and 0.001 for the indicated conditions (Wilcoxon rank-sum). n: Control = 19, shARL13b_2 = 26; three dissociations. (C) Representative images of DIV11 pyramidal neurons expressing the indicated plasmids 48 hr post-transfection. Scale bar: 50 μm. (D and E) Total lengths (D) and branch points (E) of apical-like dendritic arbors of cultured pyramidal neurons expressing the indicated constructs at 48 hr post transfection. Each dot is a measurement from a single neuron. Bars are average ± SEM. n: Control = 21, shArl13b_2 = 14, shIft88/shCep164 = 17; three dissociations. (F and G) Relative fluorescence intensities of immunolabeled ciliary IFT88 (F) and cilia lengths (G) in neurons transfected with the indicated plasmids 24 or 48 hr post-transfection. Each dot is a measurement from a single neuron. Values in F are normalized to values in controls. Bars are average ± SEM. *, **, and *** indicate p<0.05, p<0.01, and p<0.001, respectively for the indicated conditions. n: (24 hr) Control = 23, shIft88/shCep164 = 25; three dissociations; (48 hr) Control = 43, shCep164 = 20; shIft88 = 17, shIft88/shCep164 = 23; three dissociations. (H) Representative images of neurons expressing GFP alone (top) or shIft88/shCep164 and GFP (bottom). Cilia were immunolabeled with antibodies against AC3 and IFT88. Images at right show enlarged (2.5×) views of cilia (yellow boxes). Scale bars: 5 μm.
-
Figure 1—figure supplement 1—source data 1
Source data for Figure 1—figure supplement 1.
- https://cdn.elifesciences.org/articles/65427/elife-65427-fig1-figsupp1-data1-v2.xlsx
Figure 2 with 1 supplement
Acute knockdown of ciliary proteins increases the strength and number of excitatory synapses.
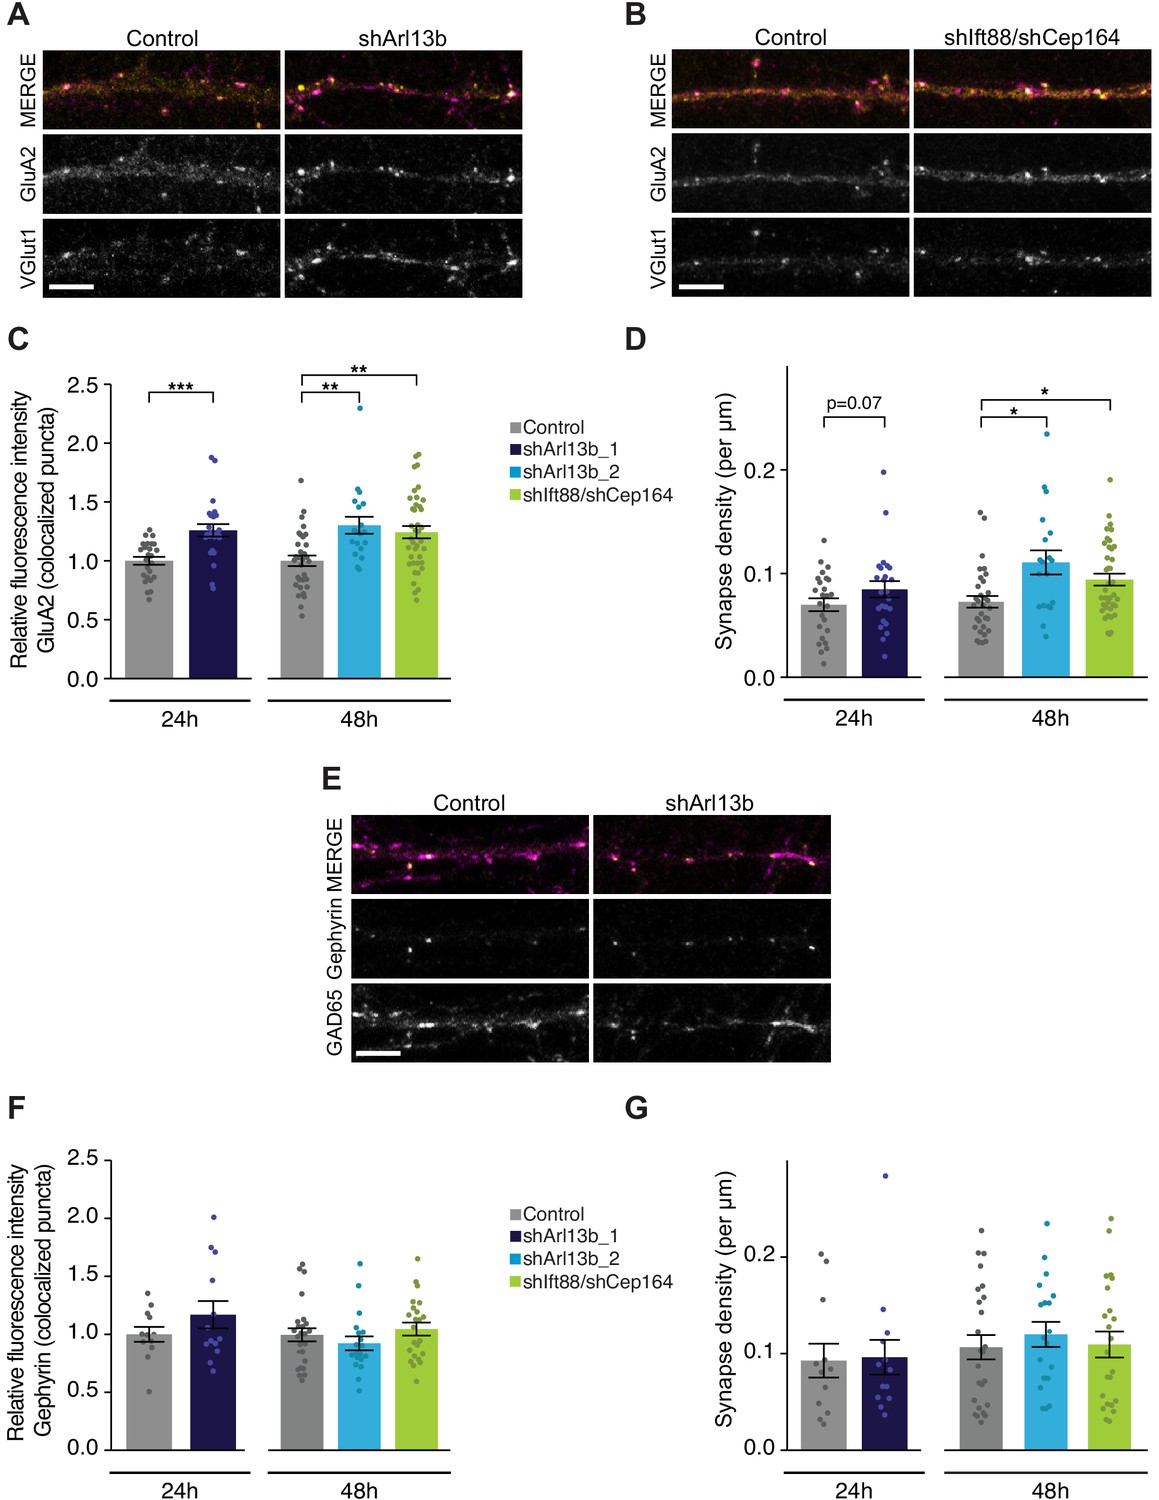
(A, B, and E) Representative images of pyramidal neuron dendrites immunolabeled with antibodies against GluA2 and VGlut1 (A and B), or Gephyrin and GAD65 (E). Cultures were transfected with GFP alone or together with the indicated plasmids. Scale bars: 5 μm. (C) Relative fluorescence intensity of immunolabeled GluA2 at GluA2 /VGlut1 colocalized puncta for indicated conditions at 24 hr or 48 hr following transfection. Intensity values are normalized to controls. Each dot is the average summed pixel value for all measured synapses from a given neuron. Bars are average ± SEM. ** and *** indicate p<0.01 and 0.001, respectively, for the indicated conditions (LMM with Dunnett-type correction for multiple comparisons). n: Control = 25 (24 hr) and 32 (48 hr), shArl13b_1 = 24, shArl13b_2 = 19, shIft88/shCep164 = 39; four dissociations. (D) Number of colocalized GluA2/VGlut1 puncta per μm of dendrite analyzed (density) onto neurons transfected with the indicated plasmids at 24 hr or 48 hr following transfection. Each dot is the density of synapses examined per neuron. Bars are average ± SEM. * indicates p<0.05 for the indicated conditions (LMM with Dunnett-type correction for multiple comparisons); additional p-values are also indicated. n: As in C. (F) Relative fluorescence intensity of immunolabeled Gephyrin at colocalized puncta on neurons transfected with the indicated plasmids at 24 hr or 48 hr following transfection. Intensity values are normalized to values in control neurons. Each dot is the average summed pixel value for all measured synapses from a given neuron. Bars are average ± SEM. n: Control = 17 (24 hr), shArl13b_1 = 22 neurons; four dissociations; and Control = 25 (48 hr), shArl13b_2 = 19, shIft88/shCep164 = 23; three dissociations. (G) Number of colocalized Gephryin/GAD65 puncta per μm of dendrite analyzed (density) onto neurons transfected with the indicated plasmids at 24 hr or 48 hr following transfection. Each dot is the density of synapses examined per neuron. Bars are average ± SEM. n: As in F. Also see Figure 2—figure supplement 1.
-
Figure 2—source data 1
Source data for Figure 2.
- https://cdn.elifesciences.org/articles/65427/elife-65427-fig2-data1-v2.xlsx
Figure 2—figure supplement 1
Presynaptic VGlut1 staining is increased upon acute knockdown of ciliary proteins.
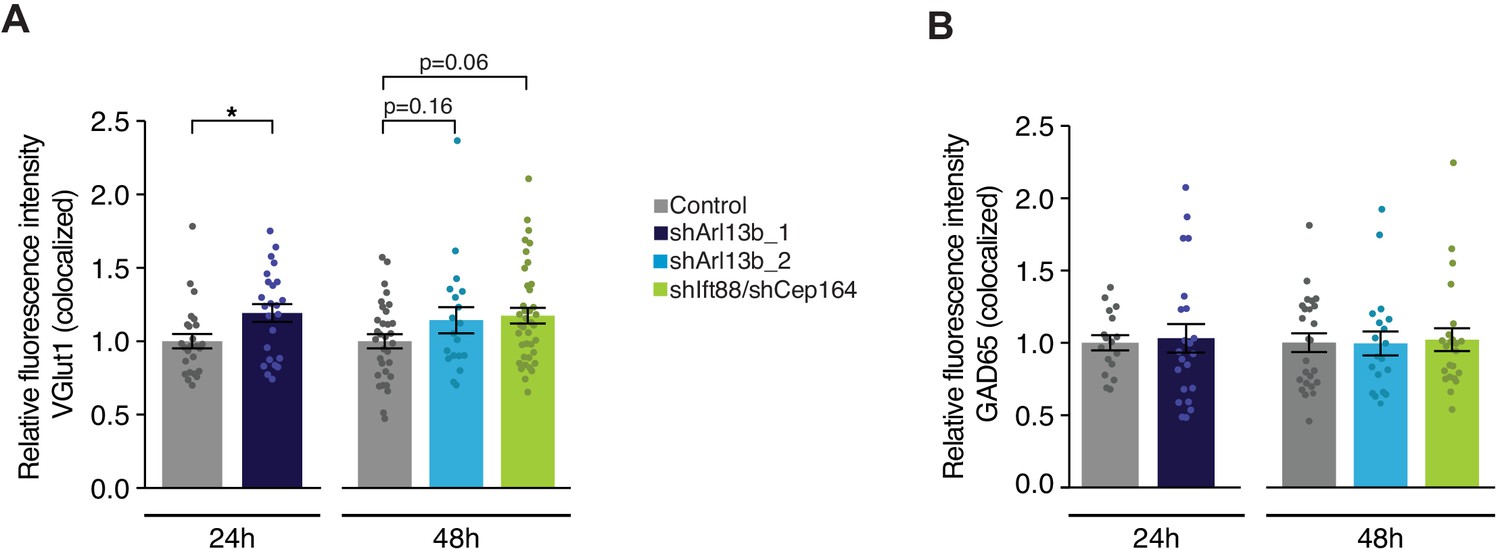
(A and B) Relative fluorescence intensity of immunolabeled VGlut1 (A) or GAD65 (B) at GluA2/VGlut1 or Gephyrin/GAD65 colocalized puncta, respectively, in neurons transfected with the indicated plasmids at 24 hr or 48 hr post transfection. Intensity values are normalized to values in controls. Each dot is the average summed pixel value of examined synapses per neuron. Bars are average ± SEM. * indicates p<0.05 for the indicated conditions; additional p-values are also indicated. (A) n: (24 hr) Control = 25, shArl13b_1 = 24; (48 hr) Control = 32, shArl13b_2 = 19, shIft88/shCep164 = 39; four dissociations. (B) n: (24 hr) Control = 17, shArl13b_1 = 22 neurons; four dissociations; (48 hr) Control = 25, shArl13b_2 = 19, shIft88/shCep164 = 23; three dissociations.
-
Figure 2—figure supplement 1—source data 1
Source data for Figure 2—figure supplement 1.
- https://cdn.elifesciences.org/articles/65427/elife-65427-fig2-figsupp1-data1-v2.xlsx
Figure 3
Mean mEPSC amplitude in pyramidal neurons is increased following acute reduction of ciliary signaling.
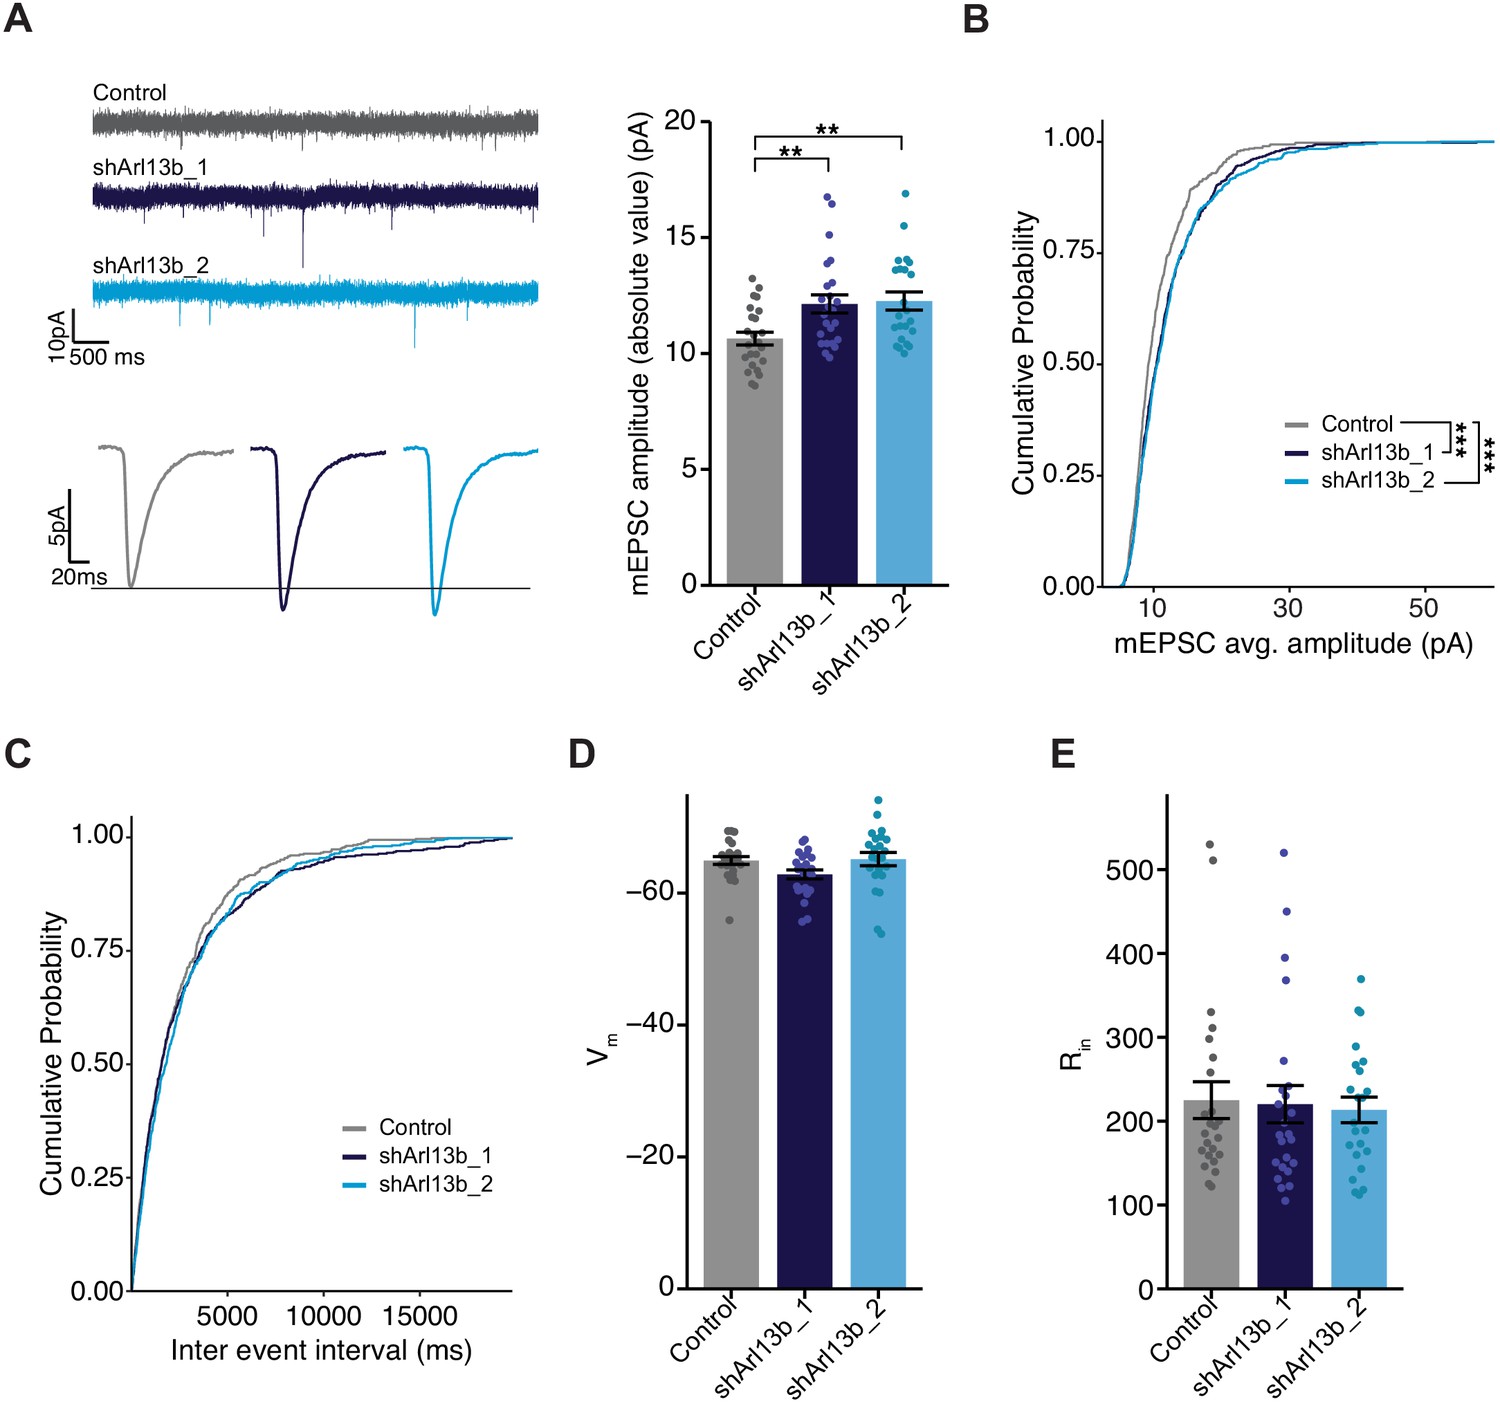
(A) (Left) Representative mEPSC traces (top) and average waveforms (bottom) from neurons transfected with the indicated plasmids. (Right) mEPSC amplitude from neurons transfected with the indicated plasmids. Each dot represents the average amplitude for a given neuron. Bars are average ± SEM. ** indicates the difference between indicated values at p<0.01 (Kruskal–Wallis with Dunn’s multiple comparisons test). n: Control = 24, shArl13b_1 = 24, shArl13b_2 = 23; >5 dissociations. (B and C) Cumulative distribution probabilities of mEPSC amplitudes (B) and inter-event intervals (C) from neurons transfected with the indicated plasmids. *** indicates the difference from control at p<0.001 (Kruskal–Wallis with Bonferroni correction). (D and E) Average resting membrane potential (Vm) (D) and input resistance (Rin) (E) of neurons transfected with the indicated plasmids. Each dot represents a single neuron. Bars are average ± SEM. n: As in A.
-
Figure 3—source data 1
Source data for Figure 3.
- https://cdn.elifesciences.org/articles/65427/elife-65427-fig3-data1-v2.xlsx
Figure 4
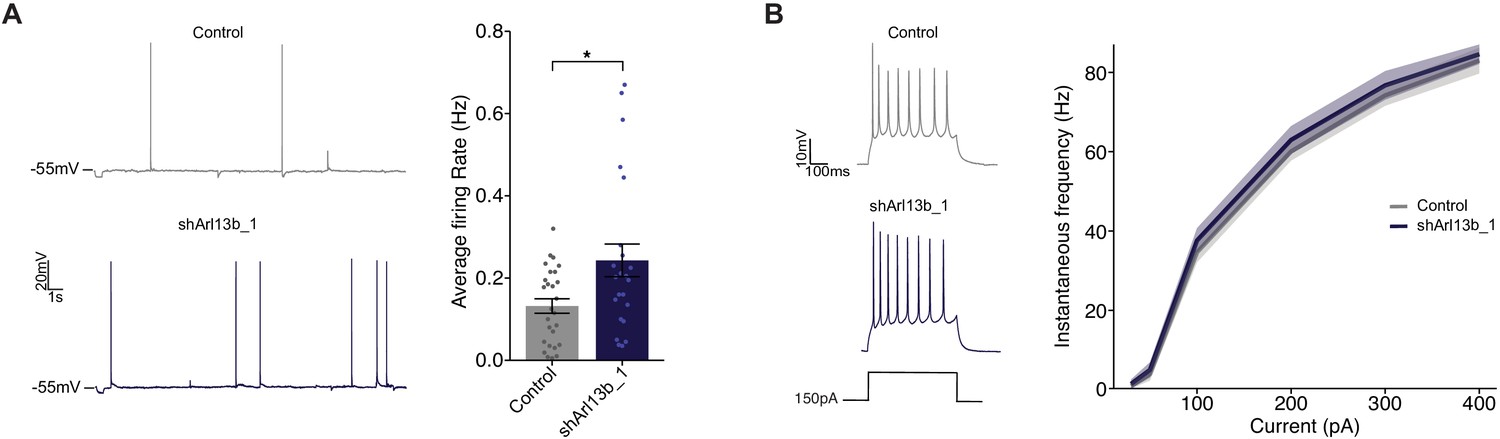
Disruption of ciliary signaling increases spontaneous firing without influencing intrinsic excitability.
(A) (Left) Representative voltage traces of spontaneous activity recorded from pyramidal neurons expressing GFP alone or shArl13b_1 and GFP. (Right) Average spontaneous firing rate for neurons transfected with the indicated plasmids. Each dot represents one neuron. Bars are average ± SEM. * indicates different between indicated values at p<0.05 (Wilcoxon rank-sum test). n: Control = 32, shArl13b_1 = 25; >5 dissociations. (B) (Left) Representative responses of pyramidal neurons expressing GFP or shArl13b_1 and GFP during current injection. (Right) Average instantaneous firing rate vs current curves for neuron transfected with the indicated plasmids. Errors are SEM. n: Control = 18, shArl13b_1 = 20; three dissociations.
-
Figure 4—source data 1
Source data for Figure 4.
- https://cdn.elifesciences.org/articles/65427/elife-65427-fig4-data1-v2.xlsx
Figure 5 with 1 supplement

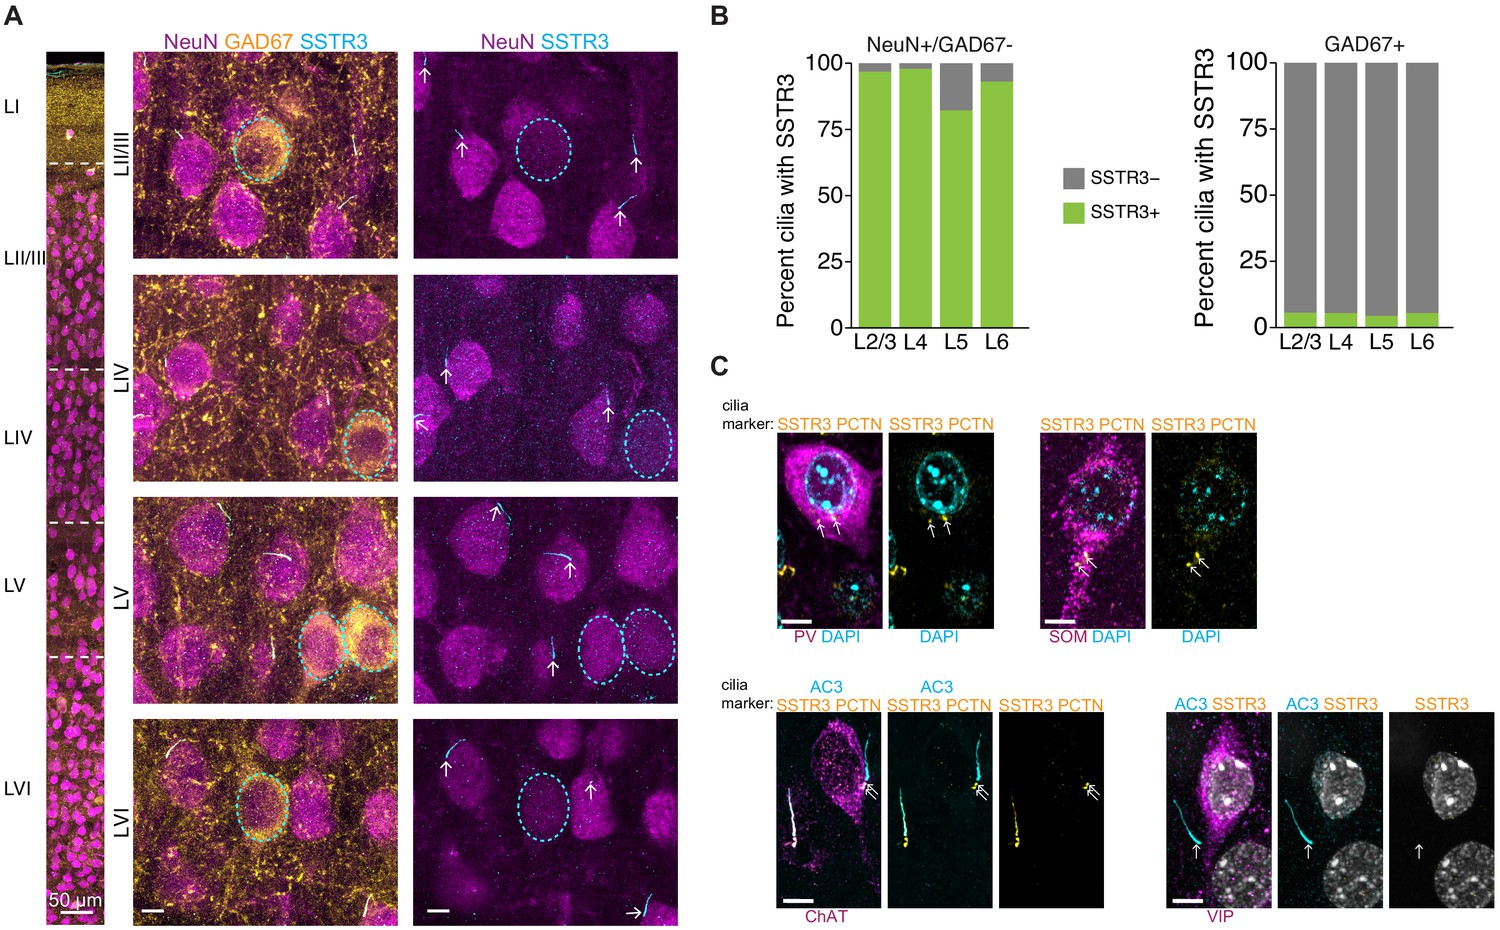
SSTR3 is localized to the cilia of excitatory, but not inhibitory, cortical neurons.
(A) Representative images of primary cilia immunolabeled with antibodies against AC3 and SSTR3 in GFP-expressing neurons in fixed cortical slices from P22 animals. Images at right show enlarged (2.5×) views of cilium (yellow box; arrow). Scale bars: 5 μm. (B) Percentage of GFP-expressing pyramidal neurons with primary cilia co-expressing AC3 and SSTR3 categorized by cortical layer. n = 150 neurons per layer; three animals. (C) Representative images of a GAD67-expressing inhibitory neuron in fixed cortical tissue stained with DAPI. Cilia were immunolabeled with antibodies against AC3 and SSTR3. The cilium is indicated with an arrow. Scale bar: 5 μm. (D) Percentage of inhibitory neurons of the indicated subtype containing SSTR3+ primary cilia in fixed cortical tissue. Cilia were identified via co-immunostaining with anti-AC3 or anti-PCTN antibodies. n: GAD67+ = 115, ChAT+ = 31, PV+ = 100, SOM+ = 110; VIP+ = 150; three animals. (E) Representative images of cultured neurons immunolabeled with antibodies against GAD67, ARL13B, and SSTR3, and co-stained with DAPI. Arrows indicate cilia of GAD− (top) and GAD+ (bottom) neurons. Scale bars: 5 μm. (F) Quantification of cultured neurons immunolabeled with antibodies against GAD67, ARL13B, and SSTR3. n = 515 total; four dissociations. Also see Figure 5—figure supplement 1.
-
Figure 5—source data 1
Source data for Figure 5.
- https://cdn.elifesciences.org/articles/65427/elife-65427-fig5-data1-v2.xlsx
Figure 5—figure supplement 1
SSTR3 is present in the majority of the cilia of NeuN-positive neurons and absent from multiple inhibitory neuron subtypes in the cortex.
(A) Representative images of NeuN, GAD67, and SSTR3 co-labeling in fixed and immunostained cortical tissue. Center and right panels are enlarged representative images from each indicated layer of cortex. GAD67+ neuronal soma are outlined with dashed lines, arrows point to cilia. Scale bars: 50 μm (left panel) and 5 μm (center and right panels). (B) Quantification of the percentage of neurons positive for NeuN and SSTR3 (left), and GAD67 and SSTR3 (right) by cortical layer. n: NeuN+ = 1520, GAD67+ = 253; six animals. (C) Representative images of inhibitory subtypes of neurons in fixed cortical tissue stained with DAPI. Neurons were immunolabeled with antibodies against indicated subtype-specific markers and either PCTN and SSTR3, or with AC3, PCTN, and SSTR3. PCTN was used to identify centrioles and basal bodies (arrows). Scale bar: 5 μm.
-
Figure 5—figure supplement 1—source data 1
Source data for Figure 5—figure supplement 1.
- https://cdn.elifesciences.org/articles/65427/elife-65427-fig5-figsupp1-data1-v2.xlsx
Figure 6 with 1 supplement
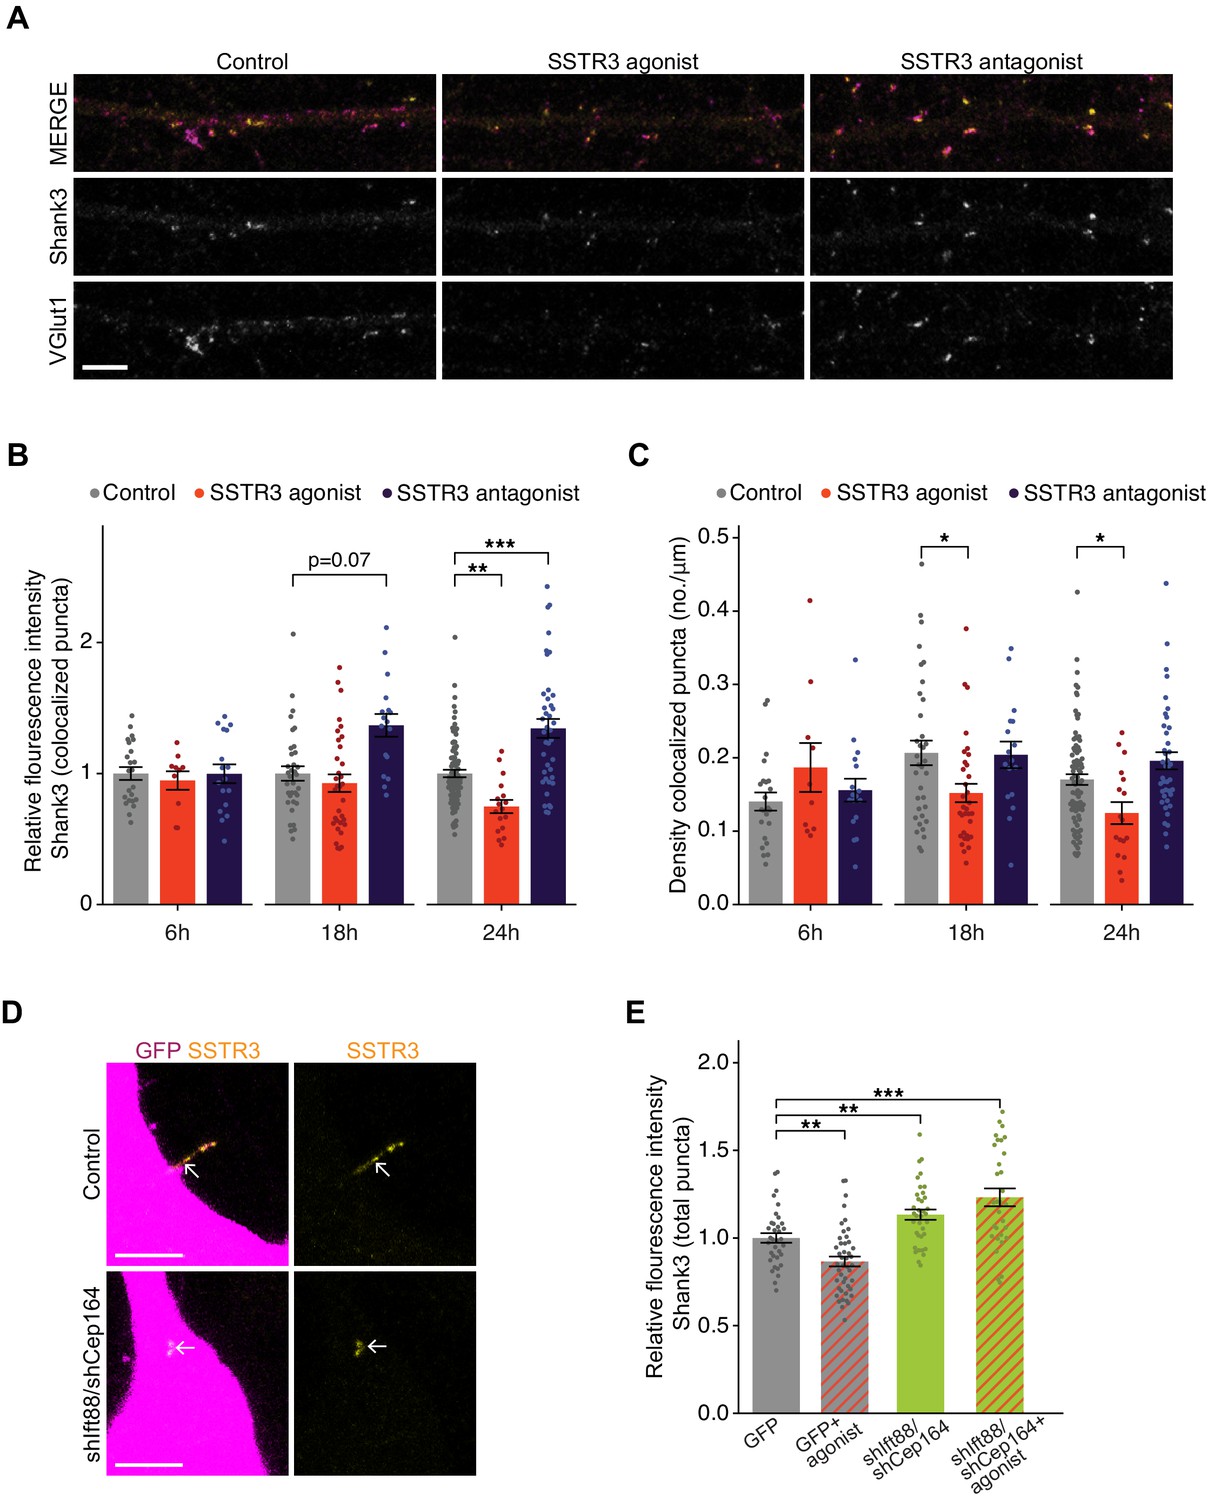
Pharmacological modulation of ciliary SSTR3 bidirectionally regulates excitatory synapses.
(A) Representative images of excitatory neuron dendrites immunolabeled with antibodies against Shank3 (Shk3) and VGlut1. Cultures were treated for 24 hr with 2 μM L-796,798 (SSTR3 agonist; purified – see Materials and methods) or 1 μM MK-4256 (SSTR3 antagonist) prior to staining. Scale bars: 5 μm. (B) Relative fluorescence intensity of Shk3 at colocalized Shk3/VGlut1 puncta on neurons treated with the indicated compounds and fixed and immunostained 6, 18, or 24 hr after addition of drug. Intensity values are normalized to values in control neurons. Each dot is the average summed pixel value of all examined synapses per neuron. Bars are average ± SEM. ** and *** indicate p<0.01 and 0.001, respectively, for the indicated conditions (LMM with Dunnett-type correction for multiple comparisons); additional p-values are also shown. n: (6 hr) Control = 23, agonist = 10, antagonist = 17; (18 hr) Control = 35, agonist = 33, antagonist = 17; (24 hr) Control = 87, agonist = 17, antagonist = 40; ≥3 dissociations. (C) Number of colocalized Shk3/VGlut1 puncta per μm of dendrite analyzed (density) onto neurons treated with the indicated compounds. Cultures were immunostained at the indicated times following addition of the compounds. Each dot is the density of synapses examined per neuron. Bars are average ± SEM. * indicates p<0.05 for the indicated conditions (LMM with Dunnett-type correction for multiple comparisons). n: as in B. (D) Representative images of cilia (arrows) of control or shIft88/shCep164-transfected neurons immunolabeled with antibodies against SSTR3. Scale bars: 5 μm. (E) Relative fluorescence intensity of total Shk3 puncta on neurons transfected with the indicated constructs, then fixed and immunostained 24 hr after addition of DMSO or 2 μM L-796,798 (SSTR3 agonist). Intensity values are normalized to values in GFP+ control neurons. Each dot is the average summed pixel value of all examined puncta per neuron. Bars are average ± SEM. ** and *** indicate p<0.01 and 0.001, respectively, for the indicated conditions (Kruskal–Wallis with Dunn correction for multiple comparisons). n: GFP+ control = 35, GFP + agonist = 46, shIft88/shCep164/GFP = 36, shIft88/shCep164/GFP + agonist = 31; three dissociations. Also see Figure 6—figure supplement 1.
-
Figure 6—source data 1
Source data for Figure 6.
- https://cdn.elifesciences.org/articles/65427/elife-65427-fig6-data1-v2.xlsx
Figure 6—figure supplement 1
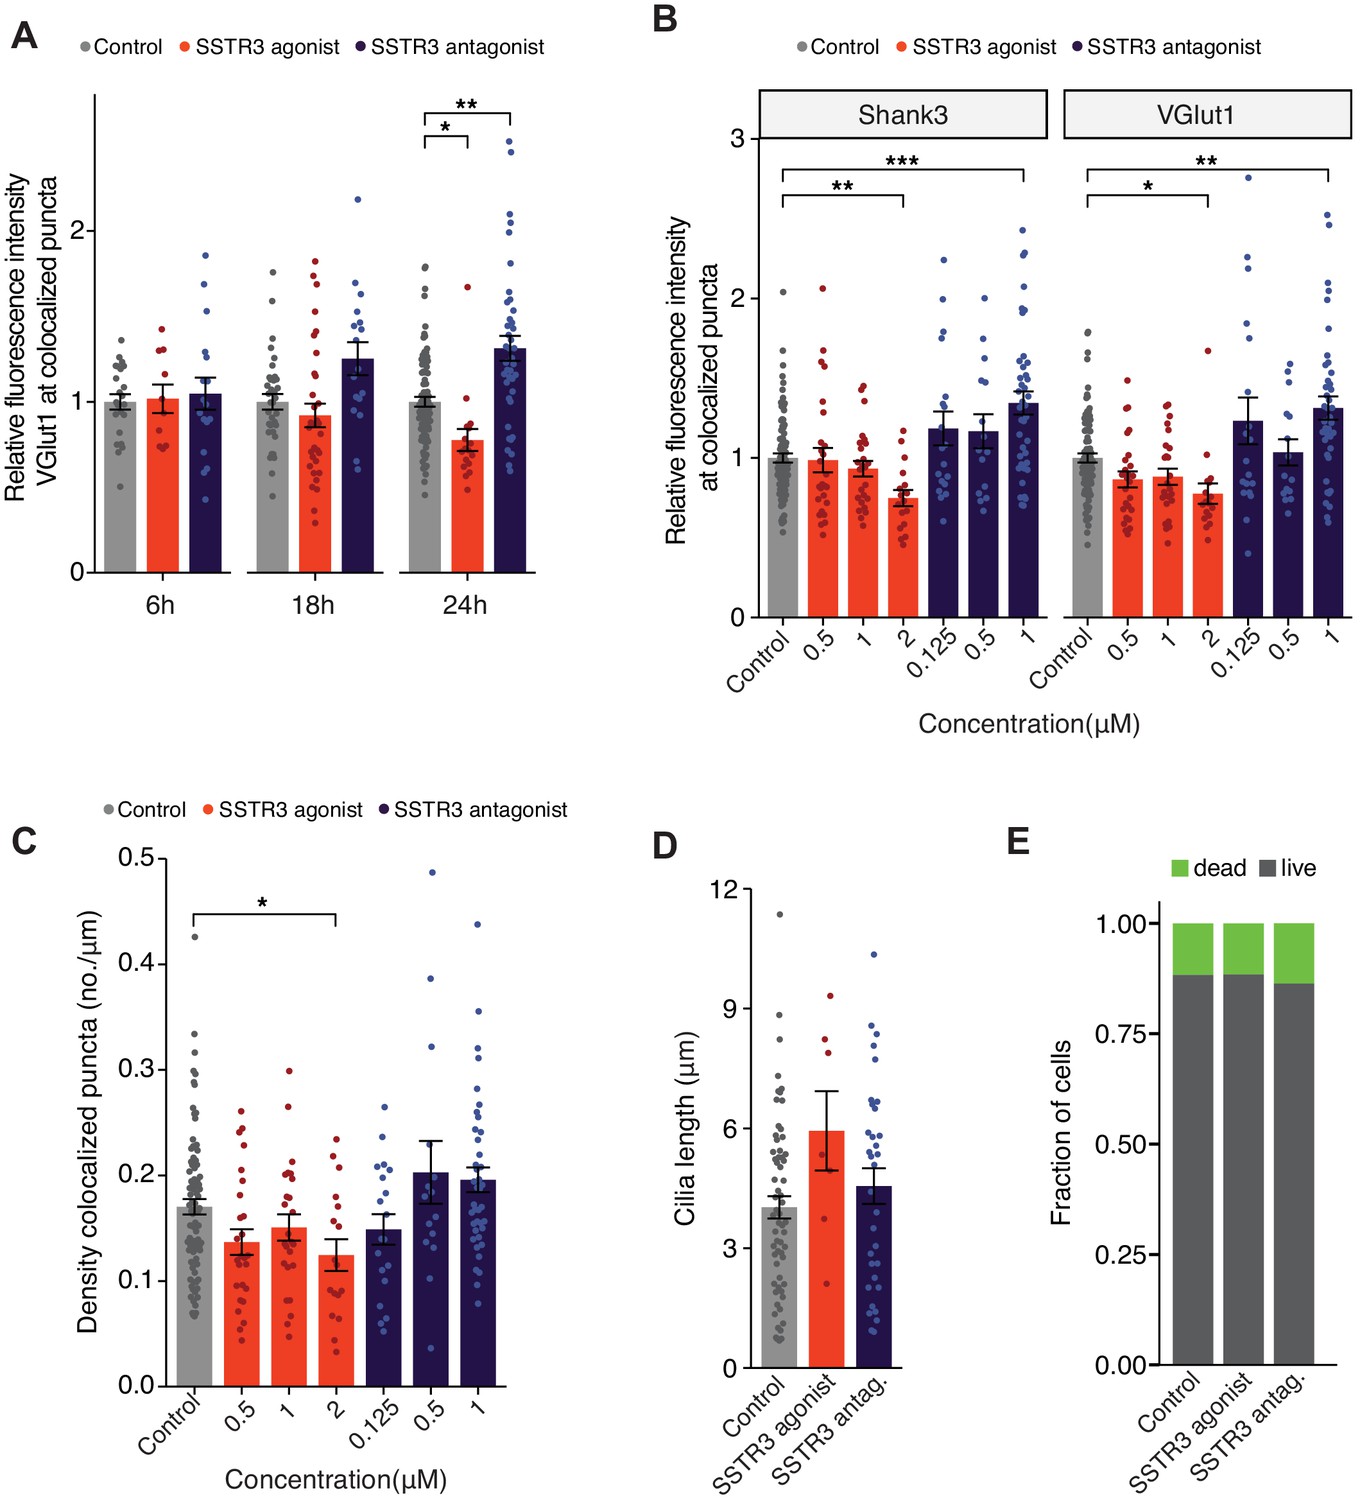
Agonism and antagonism of SSTR3 alter excitatory synaptic strengths.
(A) Relative fluorescence intensity of VGlut1 at colocalized Shk3/VGlut1 puncta on neurons treated with 2 μM SSTR3 agonist L-796,798 or 1 μM MK-4256 SSTR3 antagonist. Cultures were immunostained at the shown times following treatment. Intensity values are normalized to values in control neurons. Each dot is the average summed pixel value of all examined synapses per neuron. Bars are average ± SEM. * and ** indicate p<0.05 and 0.01, respectively, for the indicated conditions (LMM with Dunnett-type correction for multiple comparisons); additional p-values are also shown. n: (6 hr) Control = 23, agonist = 10, antagonist = 17; (18 hr) Control = 35, agonist = 33, antagonist = 17; (24 hr) Control = 87, agonist = 17, antagonist = 40; ≥3 dissociations. (B) Relative fluorescence intensities of immunolabeled Shk3 and VGlut1 at colocalized Shk3/VGlut1 puncta. Neurons were treated with the indicated concentrations of the SSTR3 agonist L-796,778 or antagonist MK-4256 for 24 hr. Each dot is the average summed pixel value of examined synapses per neuron. Bars are average ± SEM. *, **, and *** indicate p<0.05, p<0.01, and 0.001, respectively, for the indicated conditions (LMM with Dunnett-type correction for multiple comparisons). n: Control = 87, 0.5 μM agonist = 26, 1 μM agonist = 25, 2 μM agonist = 17, 0.125 μM antagonist = 19, 0.5 μM antagonist = 15, 1 μM antagonist = 40; ≥3 dissociations. (C) Number of colocalized Shk3/VGlut1 puncta per μm of dendrite analyzed (density) on neurons treated with the indicated concentrations of the SSTR3 agonist L-796,778 or antagonist MK-4256 for 24 hr. Each dot is the density of synapses examined per neuron. Bars are average ± SEM. * indicates p<0.05 for the indicated conditions (LMM with Dunnett-type correction for multiple comparisons). n: As in B. (D) Lengths of cilia in neurons treated with SSTR3 agonist and antagonist 24 hr following treatment. Each dot represents a measurement from a single neuron. Bars are average ± SEM. n: Control = 63, 2 μM agonist = 7, 1 μM antagonist = 33; ≥3 dissociations. (E) Fraction of alive and dead neurons at 24 hr following treatment with SSTR3 agonist or antagonist. Neurons were co-stained with propidium iodide and Zombie Green; cells positive for either or both stain were scored as dead. n: Control = 97, 2 μM agonist = 92, 2 μM antagonist = 33; three dissociations.
-
Figure 6—figure supplement 1—source data 1
Source data for Figure 6—figure supplement 1.
- https://cdn.elifesciences.org/articles/65427/elife-65427-fig6-figsupp1-data1-v2.xlsx
Tables
Key resources table
| Reagent type (species) or resource | Designation | Source or reference | Identifiers | Additional information |
|---|---|---|---|---|
| Strain, strain background (Rattus norvegicus) | Long–Evans | Charles River Laboratories | Strain:006, RRID:RGD_2308852 | |
| Transfected construct (Rattus norvegicus) | pAAV-hSyn-EGFP | Bryan Roth via Addgene | RRID:Addgene_50465 | |
| Antibody | αAC3 (Mouse monoclonal) | Encor | Cat#:MCA-1A12, RRID:AB_2744501 | IF(1:500) |
| Antibody | αAC3 (Rabbit polyclonal) | Encor | Cat#:RPCA-ACIII, RRID:AB_2572219 | IF(1:500) |
| Antibody | αARL13B (Mouse monoclonal) | NeuroMab | Cat#:N295B/66 (75-287), RRID:AB_234154 | IF(1:1000) |
| Antibody | αChAT (Goat polyclonal) | Millipore | Cat#:AB144P, RRID:AB_2079751 | IF(1:100) |
| Antibody | αGAD67 (Goat polyclonal) | R and D Systems | Cat#:AF2086, RRID:AB_2107724 | IF(1:2000) |
| Antibody | αGAD67 (Mouse monoclonal) | Millipore | Cat#:MAB5406, RRID:AB_2278725 | IF(1:2000) |
| Antibody | αGluA2 (Mouse monoclonal) | Gift from Gouaux lab, OHSU | IF(1:1000) | |
| Antibody | αIFT88 (Rabbit polyclonal) | ProteinTech | Cat#:13967–1-AP, RRID:AB_2121979 | IF(1:500) |
| Antibody | αPV (Mouse monoclonal) | Synaptic Systems | Cat#:195 011, RRID:AB_2619884 | IF(1:500) |
| Antibody | αShank3 (Guineapig polyclonal) | Synaptic Systems | Cat#:162 304, RRID:AB_2619863 | IF(1:1000) |
| Antibody | αSOM (Mouse monoclonal) | Thermo Fisher | Cat#:14-9751-82, RRID:AB_2572982 | IF(1:500) |
| Antibody | αSSTR3 (Rabbit polyclonal) | Biotrend-USA | Cat#:SS-830–50, RRID:AB_2196357 | IF(1:2000) |
| Antibody | αVGlut1 (Chicken polyclonal) | Synaptic Systems | Cat#:135 316, RRID:AB_2619822 | IF(1:1000) |
| Antibody | αVGlut1 (Guineapig polyclonal) | Synaptic Systems | Cat#:135 304, RRID:AB_887878 | IF(1:1000) |
| Antibody | αVIP (Guineapig polyclonal) | Synaptic Systems | Cat#:443 005, RRID:AB_2832228 | IF(1:500) |
| Recombinant DNA reagent | pLKO.1 (plasmid) | David Root via Addgene | RRID:Addgene_10878 | |
| Recombinant DNA reagent | pAAV-hSyn-EGFP (plasmid) | Bryan Roth via Addgene | RRID:Addgene_50465 | |
| Recombinant DNA reagent | pSUPER (plasmid) | OligoEngine | Cat#:VEC-PBS-0002 | |
| Recombinant DNA reagent | pSUPER-H1-shCep164 | This paper | pLRT18 | shRNA: 5’-CAACAACCACATCGAACTTA-3’ |
| Recombinant DNA reagent | pLKO-U6-shArl13b_1 | This paper | pLRT19 | shRNA: 5’-CCTGTCAGAAAGGTGACACTT-3’ |
| Recombinant DNA reagent | pSUPER-H1-shIft88 | This paper | pLRT26 | shRNA: 5’-CGAATGGCTTGGAGCTTATTA-3’ |
| Recombinant DNA reagent | pAAV-H1-shArl13b_2-hSyn-EGFP | This paper | pLRT67 | shRNA: 5’-GCTCAGGACATGATCTCATAA-3' |
| Commercial assay or kit | Zombie Green Fixable Viability Kit | BioLegend | Cat#:423111 | Cell viability assessment |
| Chemical compound, drug | L-796,778 | Gift from Merck Pharmaceuticals | SSTR3 selective agonist | |
| Chemical compound, drug | MK-4256 | MedChemExpress | Cat#:HY-13466 | SSTR3 selective antagonist |
| Chemical compound, drug | Propidium iodide | Thermo Fisher | Cat#:P3566 | |
| Software, algorithm | IGOR Pro | Wavemetrics | RRID:SCR_000325 | https://www.wavemetrics.com/products/igorpro/igorpro.htm |
| Software, algorithm | MATLAB | MathWorks | RRID:SCR_001622 | https://www.mathworks.com/products/matlab.html |
| Software, algorithm | Metamorph | Molecular Devices | RRID:SCR_002368 | http://www.moleculardevices.com/Products/Software/Meta-Imaging-Series/MetaMorph.html |
| Software, algorithm | R (version 4.0.3) | R | RRID:SCR_001905 | https://www.R-project.org/ |
| Software, algorithm | RStudio | RStudio | RRID:SCR_000432 | http://www.rstudio.com/ |
Additional files
-
Supplementary file 1
Statistical analyses used.
- https://cdn.elifesciences.org/articles/65427/elife-65427-supp1-v2.docx
-
Transparent reporting form
- https://cdn.elifesciences.org/articles/65427/elife-65427-transrepform-v2.docx
Download links
A two-part list of links to download the article, or parts of the article, in various formats.
Downloads (link to download the article as PDF)
Open citations (links to open the citations from this article in various online reference manager services)
Cite this article (links to download the citations from this article in formats compatible with various reference manager tools)
Ciliary neuropeptidergic signaling dynamically regulates excitatory synapses in postnatal neocortical pyramidal neurons
eLife 10:e65427.
https://doi.org/10.7554/eLife.65427


