Bone marrow adipocytes drive the development of tissue invasive Ly6Chigh monocytes during obesity
- Cell Biology Program, The Hospital for Sick Children, Canada
- Department of Biochemistry, University of Toronto, Canada
- Department of Immunology, University of Toronto, Canada
- Department of Laboratory Medicine and Pathophysiology, University of Toronto, Canada
- Toronto General Hospital Research Institute, Canada
Figures
Figure 1
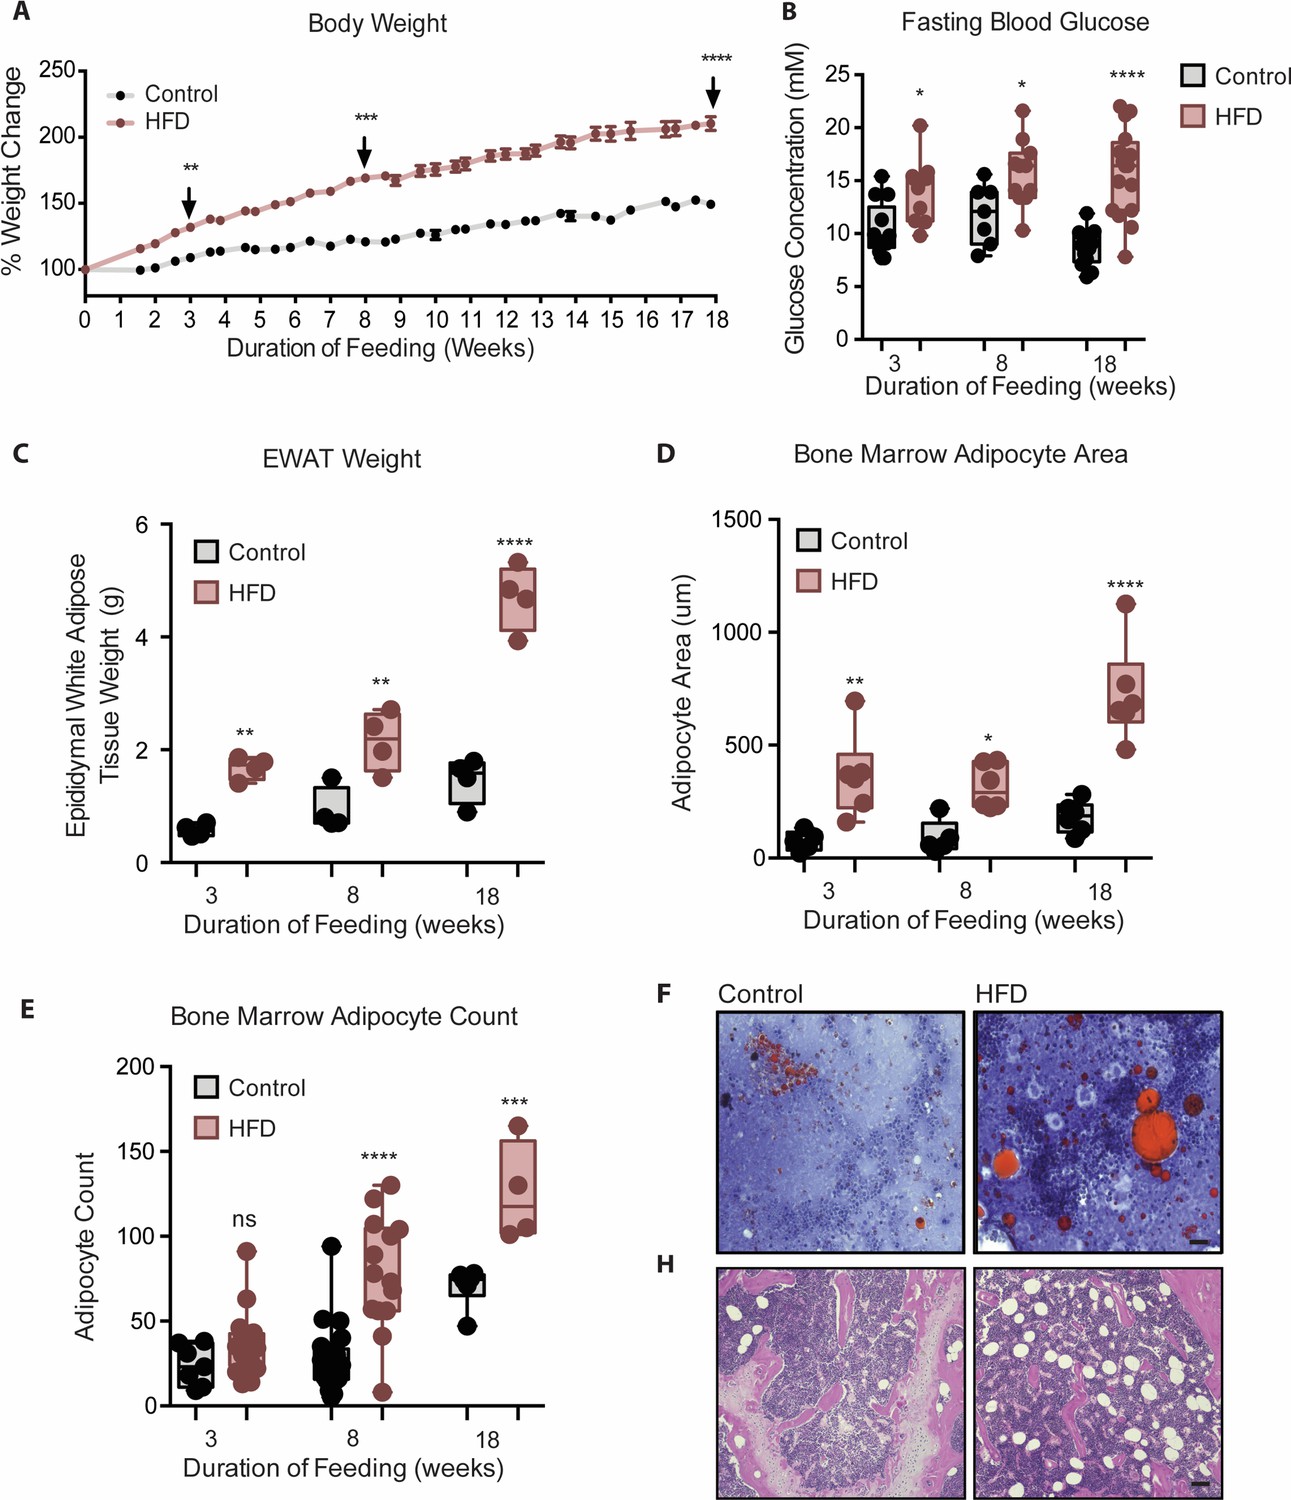
Mice fed HFD increased body weight, fasting blood glucose, visceral and bone marrow adipose tissue.
(A) Body weight was measured twice a week throughout the course of feeding (n=14 per dietary group). (B) Mice were fasted for 4 hr after which fasting blood glucose was measured (n=9–14 per dietary group). (C) EWAT was weighed the day of sacrifice (n=4 per dietary group at each feeding duration). (D) Area covered by BM adipocytes were measured following H&E to visualize adipocyte ghosts using quantified using ImageJ software (n=6 mice in each dietary group at each feeding duration). (E) BM adipocyte numbers per field were blindly counted following H&E staining using ImageJ software version 1.53. (n=4–14 mice in each dietary group per feeding duration). (F) Representative images of femurs from mice fed control and HFD diet for 3 weeks, that were fixed in formalin for 2 days followed by 14 days EDTA decalcification and subsequently stained with Oil Red O (ORO). (G) Representative images of femurs from mice fed control and HFD diet for 8 weeks, that were fixed in formalin for 2 days followed by 14 days EDTA decalcification and subsequently stained with H&E. Scale bar is 25 μm. Results are expressed as mean ± SEM, n=4–14 mice per group. One-way ANOVA was used for statistical analysis at each dietary group and across feeding periods. *p<0.05, **p<0.01, ***p<0.001, ****p<0.0001 and ns = not significant p>0.05.
-
Figure 1—source data 1
Mice fed HFD increased body weight, fasting blood glucose, visceral and bone marrow adipose tissue.
- https://cdn.elifesciences.org/articles/65553/elife-65553-fig1-data1-v2.xlsx
Figure 2 with 2 supplements

Bone marrow monocytes increased prior to adipose tissue macrophages.
Analysis of monocytes and macrophages in the stromal vascular fraction (SVF) of adipose tissue via flow cytometry analysis, identified first by size and granularity through forward and side scatter and then using the following markers: CD11b CD115 F4/80 Ly6C GR1 CD11c (n=7–10 mice in each dietary group at each feeding duration). (A) Monocytes, (B) Total macrophages, (C) Pro-inflammatory macrophages. (D–F) Whole adipose tissue gene expression of the myeloid marker Itgam, macrophage marker Adgre and pro-inflammatory myeloid marker Itgax by RTqPCR. Each symbol represents a biological replicate analyzed in duplicate and normalized to average of a group of housekeeping genes. (n=5 mice in each dietary group at each feeding duration). (G–H) Gene expression analysis of embryonic derived tissue resident macrophage markers Timd4 and Marco by RTqPCR. Each symbol represents a biological replicate analyzed in duplicate and normalized to average of a group of housekeeping genes (n=3–5 mice in each dietary group at each feeding duration). (I) Flow cytometry analysis of total BM monocytes (n=7 mice in each dietary group at each feeding duration). (J) Monocyte subsets in the bone marrow with HFD-feeding (n=7 mice in each dietary group at each feeding duration). Results are expressed as mean ± SEM. One-way ANOVA was used for statistical analysis at each dietary group and across feeding periods. *p<0.05, **p<0.01, ***p<0.001, ****p<0.0001 and ns = not significant p>0.05.
-
Figure 2—source data 1
Bone marrow monocytes increased prior to adipose tissue macrophages.
- https://cdn.elifesciences.org/articles/65553/elife-65553-fig2-data1-v2.xlsx
Figure 2—figure supplement 1

Flow cytometry gating strategy for identification of Ly6Clow and Ly6Chigh monocytes and their progenitor cells.
Following red blood cell lysis, SVF, blood and the BM were washed with FACS buffer (PBS, 1% (v/v) heat-inactivated FBS, 0.2% (w/v) BSA), stained with Aqua Live/Dead Antibody (ThermoFisher, L34957) for 15 min in the dark, washed with FACS buffer again, blocked with anti-mouse CD16/32 antibody (eBioscience, 14-0161-86) for 15 min in the dark following a 30 min incubation with the indicated antibodies on the x or y-axes. (A) Using side and forward scatter to identify singlet cells, CD115 +Gr1 cells were identified that were further analyzed using CD11b and Ly6C. (B) Ly6Clow and Ly6Chigh monocyte gates were drawn using fluorescence minus one (FMO) controls for CD11b and Ly6C. (C) The monocyte Ly6Clow and Ly6Chigh subsets were confirmed positive for CX3CR1 and CCR2, respectively. (D) Stem and progenitor cell analysis: BM-derived, In vitro-generated monocytes were first gated for side scatter and CD45+ cells followed by gating for lineage negative (See Table 1 footnote for LINEAGE defined markers) and CD117+, further broken down into Sca1 +and Sca1– cells. Sca1 + cells were further classified using CD48 and CD150 while Sca1- cells were further characterized via CD16/32 and CD34. Panels showing gating were created using FlowJo software (Becton, Dickinson Company).
Figure 2—figure supplement 2
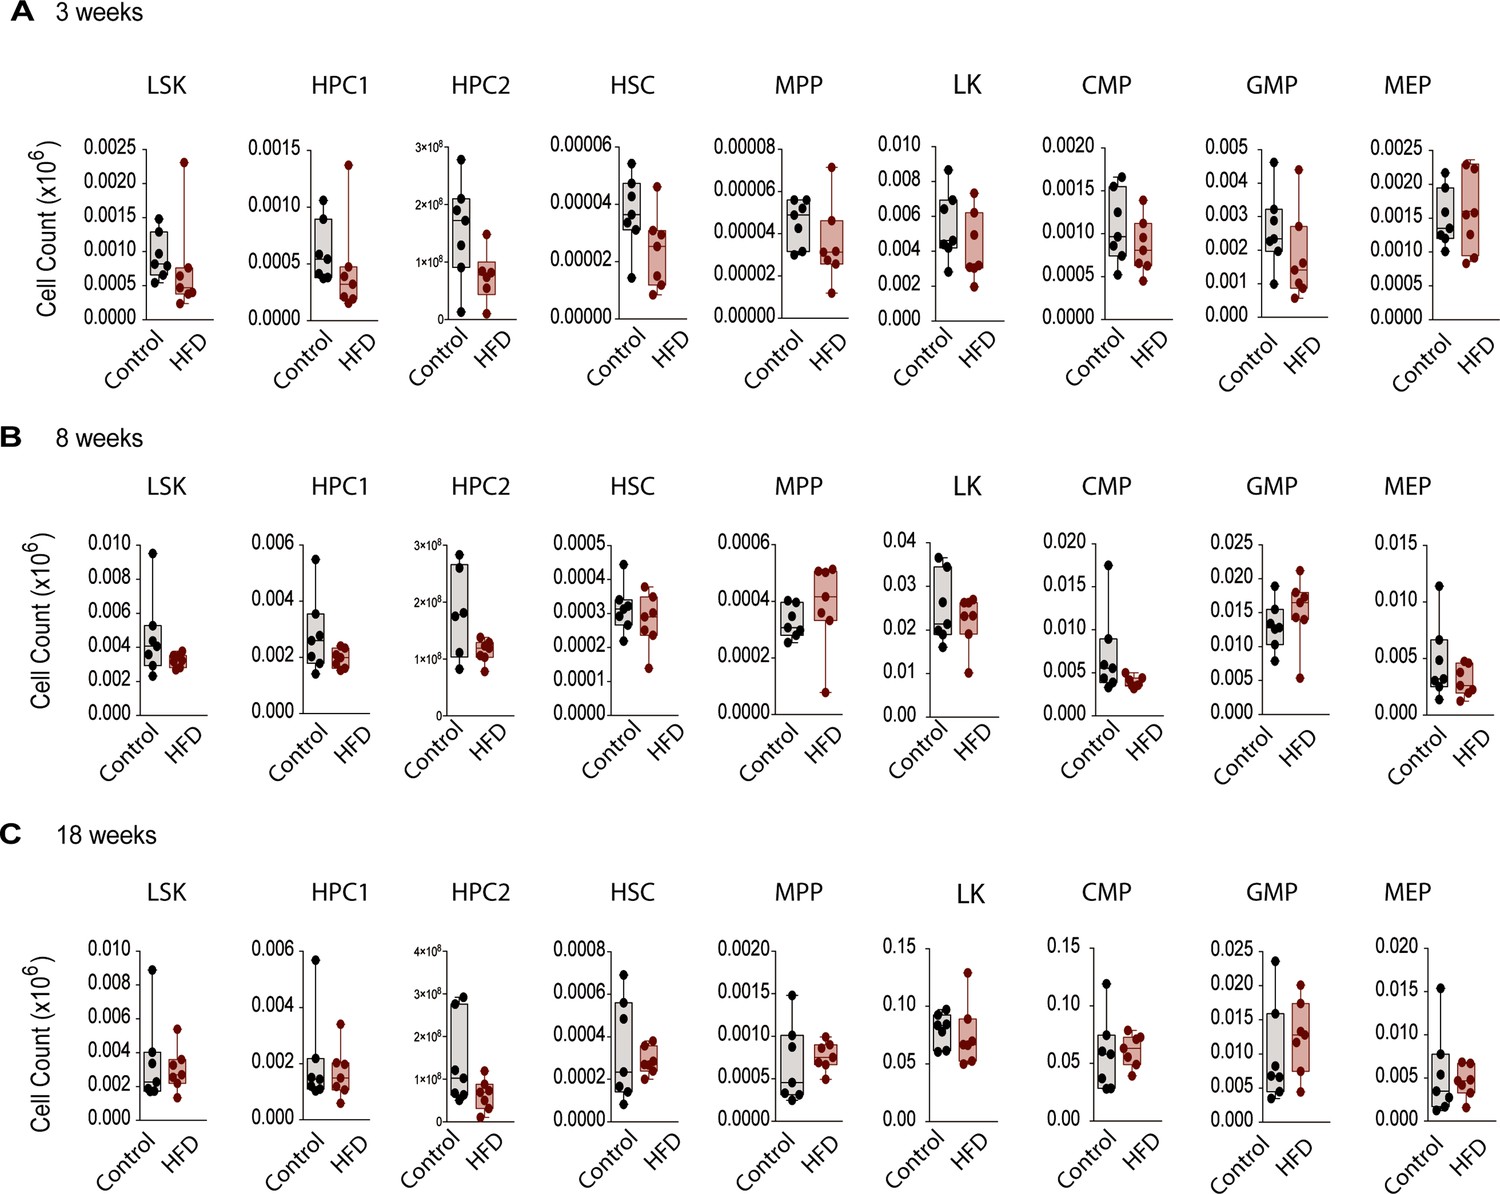
Monocyte progenitors and stem cells were not significantly altered with HFD in vivo.
Flow cytometry analysis of HSC and monocyte progenitor cells (see Figure 2—figure supplement 1 for gating strategy) in mice fed a Control or HFD for (A) 3, (B) 8, and (C) 18 weeks (n=6–7 per dietary group at each feeding duration). Flow cytometry antibodies used are listed in Table 1. Student’s T test was used and no statistical significance was observed (ns = not significant >0.05).
-
Figure 2—figure supplement 2—source data 1
Monocyte progenitors and stem cells were not significantly altered with HFD in vivo.
- https://cdn.elifesciences.org/articles/65553/elife-65553-fig2-figsupp2-data1-v2.xlsx
Figure 3 with 1 supplement
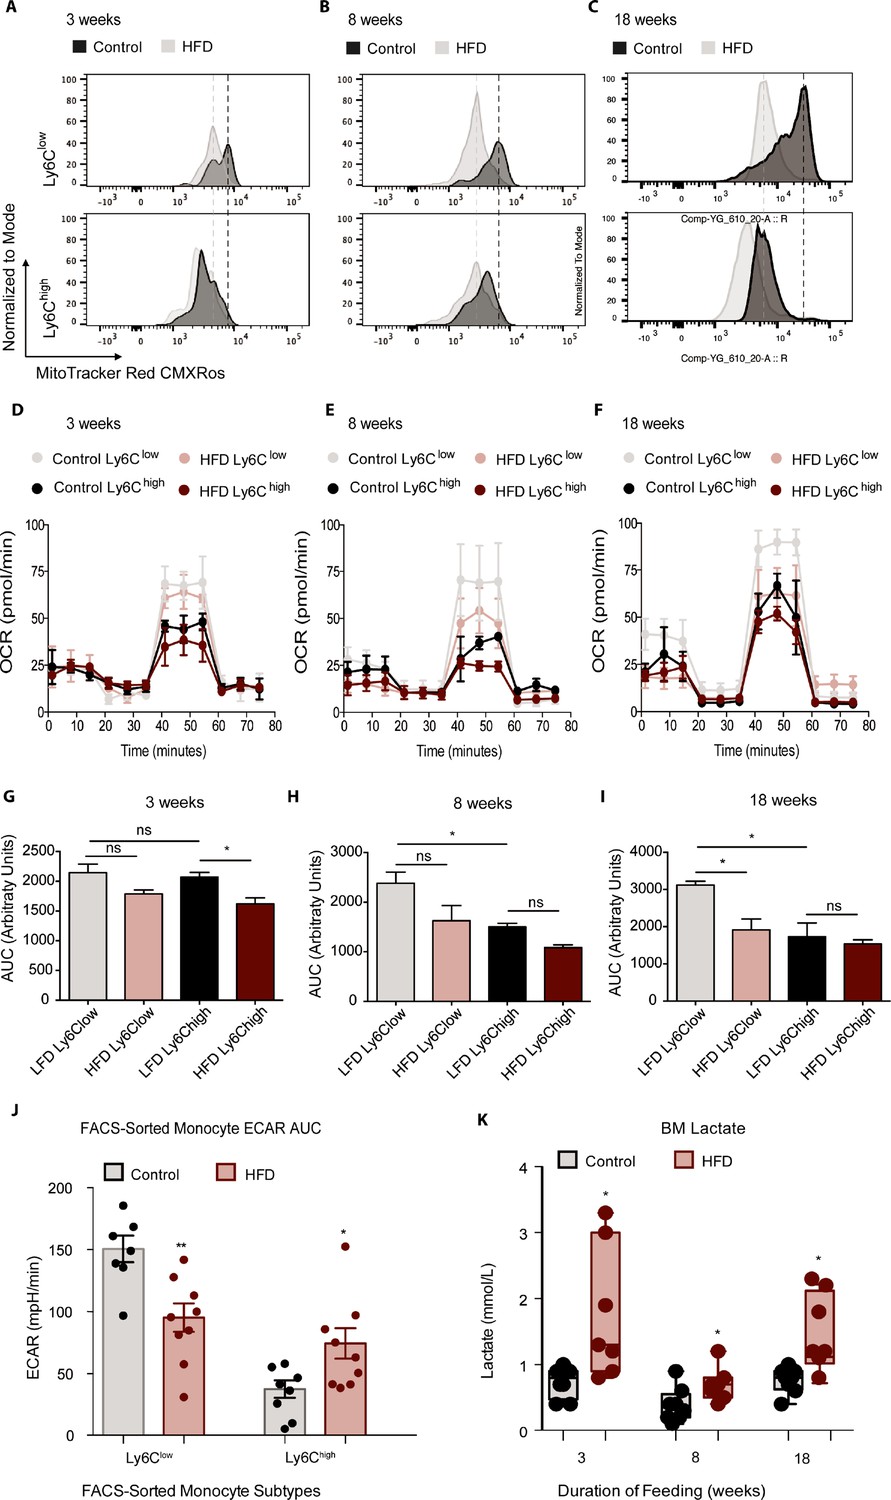
HFD blunted the mitochondrial oxidation of monocyte subsets.
(A–C) Bone marrow cells from mice fed control or HFD for 3, 8, or 18 weeks (n=3 mice per dietary group) were incubated with Mitotracker Red CMXRos for 17 min at 37 °C. This is a fixable red-fluorescent dye that stains mitochondria dependent on their membrane potential. Cells were then fixed, stained with fluorescent antibodies for flow cytometry, and subjected to fluorescent activated cell sorting (FACS) to identify Ly6Clow and Ly6Chigh monocyte populations. (D–F) Ly6Clow and Ly6Chigh monocytes from mice fed control or HFD for 3, 8, or 18 weeks, (n=3 mice per dietary group) were isolated via FACS and plated for metabolic analysis of their Oxygen Consumption Rate (OCR) with a Seahorse XFe96 Analyzer. (G–I) Area under the curve of OCR of FACS-sorted Ly6Clow and Ly6Chigh monocytes from control and HFD-fed mice measured by the Seahorse Assay (n=3 mice per dietary group). (J) Area under the curve of ECAR measurement from FACS-sorted Ly6Clow and Ly6Chigh monocytes of control and HFD-fed mice measured by the Seahorse Assay and pooled from all feeding durations. (K) BM lactate measurement of the supernatant fraction in HFD and control samples quantified using a lactate Plus Meter and normalized to the initial volume of BM isolated from the femur (n=7 mice per dietary group). Results are expressed as mean ± SEM. One-way ANOVA was used for statistical analysis. *p<0.05, **p<0.01 and ns = not significant p>0.05. Graph in panels C was created using FlowJo software (Becton, Dickinson Company).
-
Figure 3—source data 1
HFD blunted the mitochondrial oxidation of monocyte subsets.
- https://cdn.elifesciences.org/articles/65553/elife-65553-fig3-data1-v2.xlsx
Figure 3—figure supplement 1

BM pro-inflammatory factors did not change with HFD.
No changes in pro-inflammatory cytokines were detected in BM supernatant fraction using the ELISA assay in mice fed control or HFD for (A) 3, (B) 8, or (C) 18 weeks (n=3–6 mice in each dietary group at feeding duration). (D) FACS-sorted monocyte subsets were analyzed for changes in pro-inflammatory gene expression; shown in Tnfα gene expression increased with 18 weeks of HFD in Ly6Chigh monocytes, but no other changes were detected (n=3 mice in each dietary group at each feeding duration). Results are expressed as mean ± SEM. One way ANOVA test was used for statistical analysis. *p<0.05, **p<0.01 and ns = not significant p>0.05.
-
Figure 3—figure supplement 1—source data 1
BM pro-inflammatory factors did not change with HFD.
- https://cdn.elifesciences.org/articles/65553/elife-65553-fig3-figsupp1-data1-v2.xlsx
Figure 4
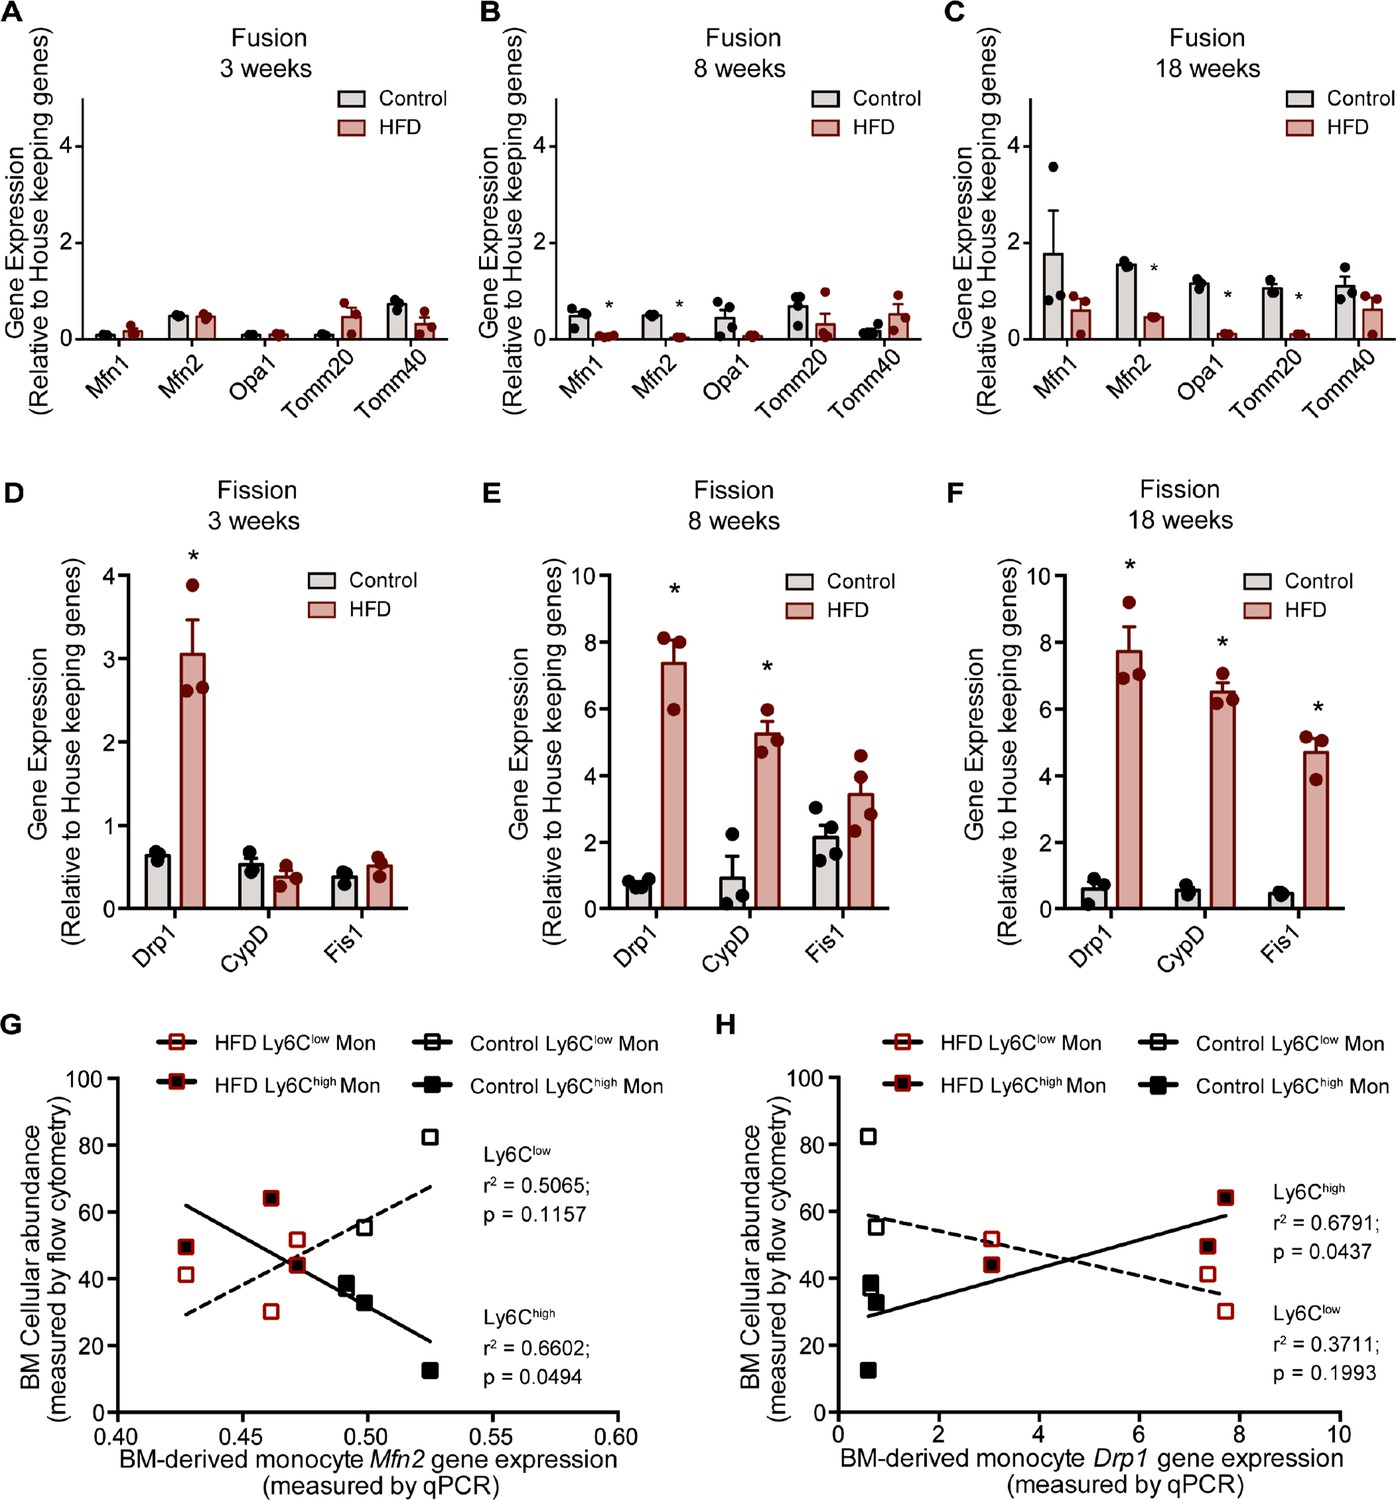
HFD downregulated expression of mitochondrial fusion genes and upregulated mitochondrial fission genes.
Gene expression of mitochondrial fusion genes Mfn1, Mfn2, Opa1, Tomm20, and Tomm40 in monocytes isolated from control and HFD-fed mice for (A) 3, (B) 8, (C) 18 weeks. Gene expression of mitochondrial fission genes Drp1, Ppid and Fis1 in monocytes isolated from control and HFD-fed mice for (D) 3, (E) 8, (F) 18 weeks (n=3 mice per dietary group and samples were analyzed in duplicates). (G) Correlative analysis of monocyte subset BM cellular abundance and BM-derived monocyte Mfn2 gene expression. (H) Correlative analysis of the average of monocyte subset BM cellular abundance (n=8 per dietary group) and BM-derived monocyte Drp1 gene expression (n=3 per dietary group) per dietary group at each time point. Correlative analysis statistics were conducted using the linear regression analysis testing whether slopes and intercepts are significantly different via GraphPad Prism version 6 (GraphPad Software). The r2 represents the goodness of the fit while the P values greater than 0.05 represent whether the slope of the line of best fit is significantly non-zero. Results are expressed as mean ± SEM. One-way ANOVA was used for statistical analysis. *p<0.05 and ns = not significant p>0.05.
-
Figure 4—source data 1
HFD downregulated expression of mitochondrial fusion genes and upregulated mitochondrial fission genes.
- https://cdn.elifesciences.org/articles/65553/elife-65553-fig4-data1-v2.xlsx
Figure 5 with 1 supplement
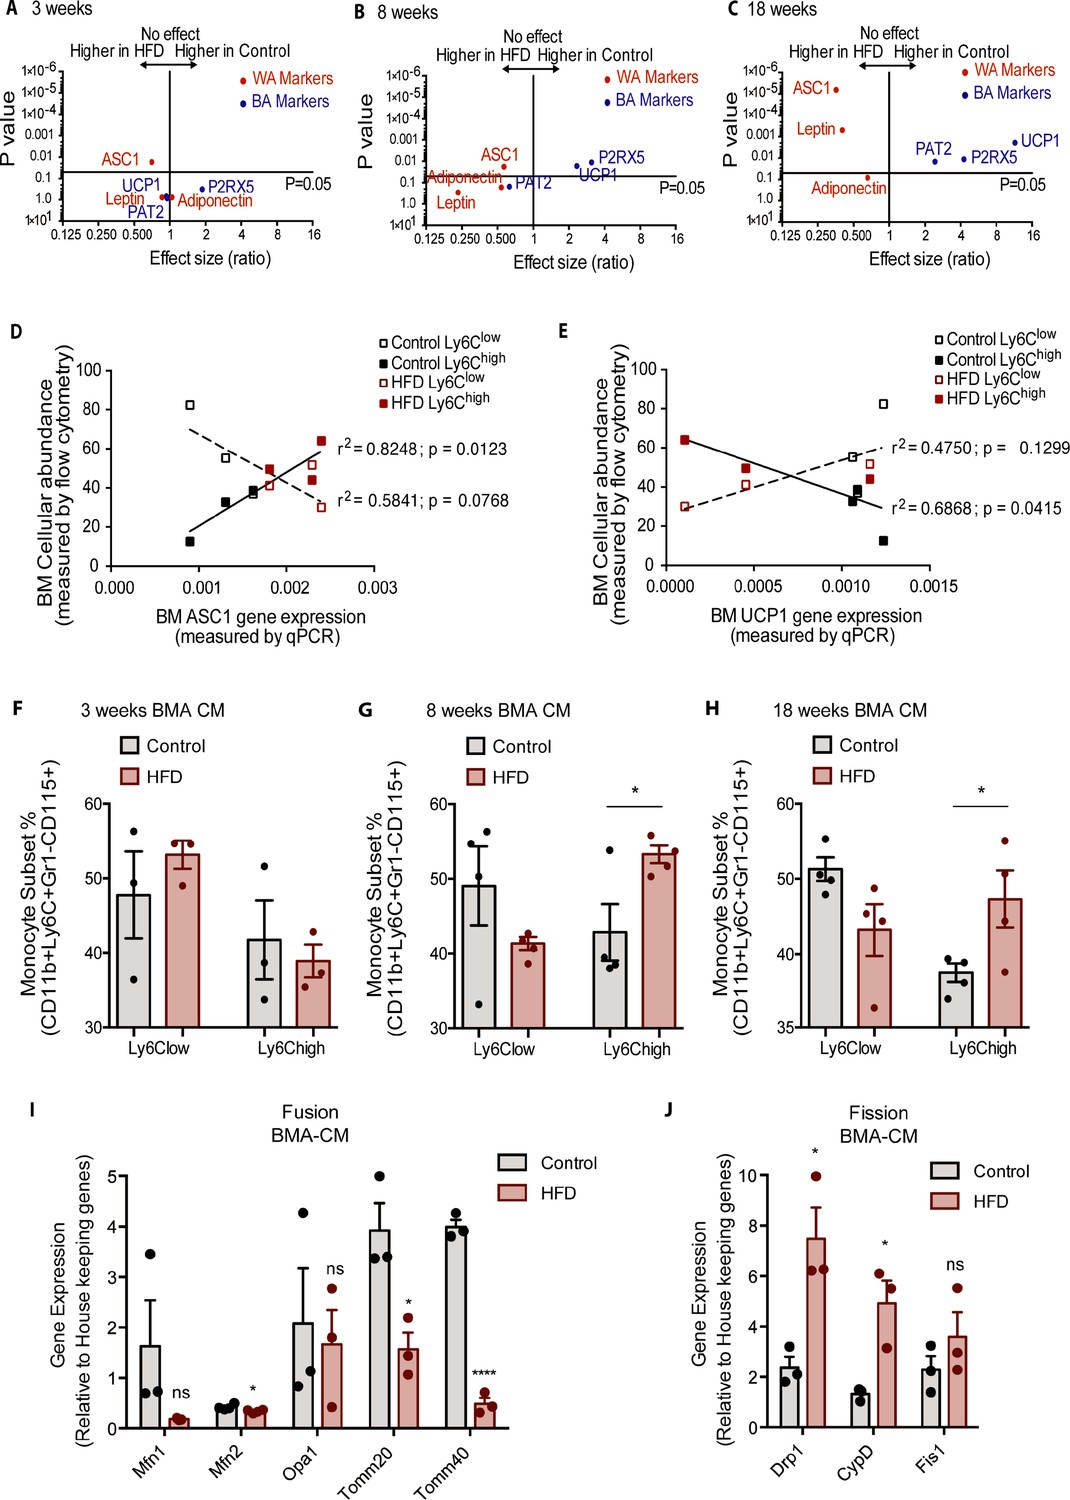
Bone marrow adipocyte whitening detected at 8 and 18 weeks of HFD favours increased bone marrow Ly6Chigh monocytes and induced changes in mitochondrial dynamic gene expression.
Volcano plots showing the gene expression of white and brown adipocyte markers in red and blue respectively (A) at 3, (B) 8, and (C) 18 weeks of HFD (n=3–9 per dietary group). Correlative graphs of the (D) white adipocyte marker ASC1 (n=8–9 per dietary group) and (E) brown adipocyte marker UCP1 (n=6 per dietary group) with Ly6Clow or Ly6Chigh monocyte subset abundance in the BM (n=8). Correlative analysis statistics were conducted using the linear regression analysis testing whether slopes and intercepts are significantly different via GraphPad Prism version 6 (GraphPad Software). The r2 represents the goodness of the fit while the p values greater than 0.05 represent whether the slope of the line of best fit is significantly non-zero. (F–H) Flow cytometry quantification of naïve Ly6Clow and Ly6Chigh monocytes (n=3–4 per dietary group) from in vitro-generated monocytes pre-treated for 18 hr with pooled BMA-CM collected from three mice fed the control and HFD for 3, 8, and 18 weeks. (I) Gene expression of mitochondrial fusion genes Mfn1, Mfn2, Opa1, Tomm20, and Tomm40 in naïve monocytes treated with BMA-CM from control and HFD-fed mice (n=3 per dietary group and samples were run in duplicates). (J) Gene expression of mitochondrial fission genes Drp1, Ppid, and Fis1 in naïve monocytes treated with BMA-CM from control and HFD-fed mice (n=3 per dietary group and samples were run in duplicates). Results are expressed as mean ± SEM. One-way ANOVA was used for statistical analysis at each dietary group and across feeding periods. *p<0.05, ****p<0.0001 and ns = not significant >0.05.
-
Figure 5—source data 1
Bone marrow adipocyte whitening detected at 8 and 18 weeks of HFD favours increased bone marrow Ly6Chigh monocytes and induced changes in mitochondrial dynamic gene expression.
- https://cdn.elifesciences.org/articles/65553/elife-65553-fig5-data1-v2.xlsx
Figure 5—figure supplement 1
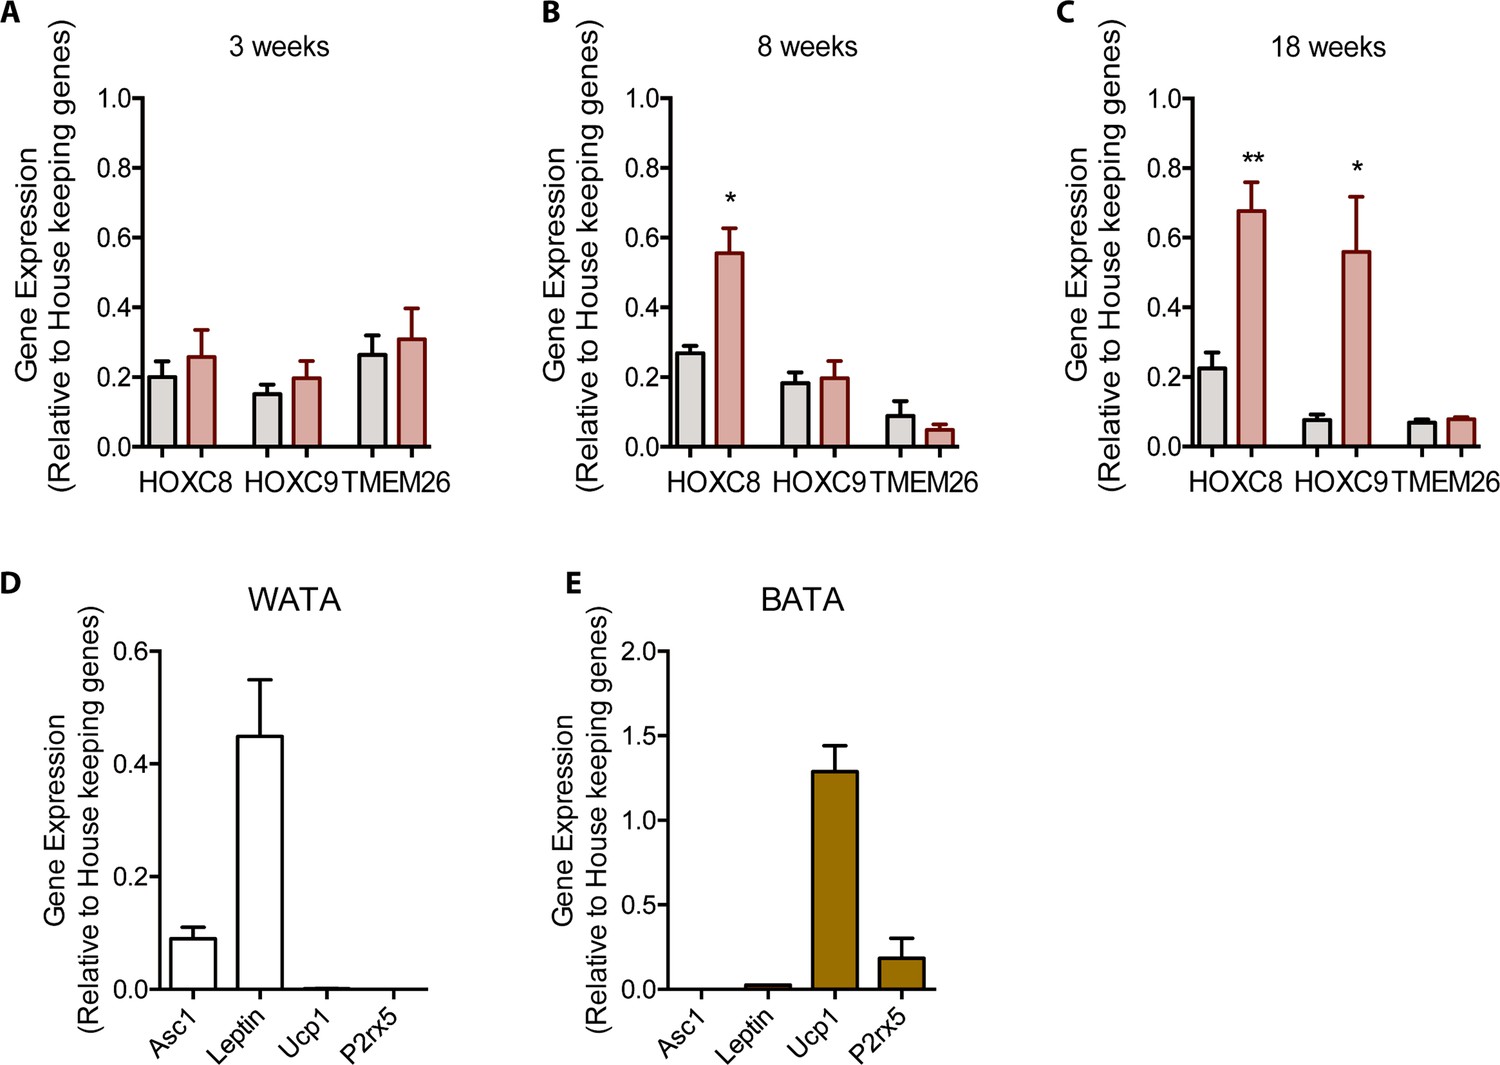
BMA precursor cell markers change with HFD and phenotyping WATA and BATA.
RT qPCR of isolated pelleted fraction were assessed for pre-adipocyte markers of mice fed a Control or HFD for (A) 3, (B) 8, and (C) 18 weeks (n=3 mice per dietary group and samples were analyzed in duplicates). Results are expressed as mean ± SEM. One way ANOVA test was used for statistical analysis. *p<0.05, **p<0.01 and ns = not significant p>0.05. (D) Classical white and brown adipocyte markers were confirmed in isolated WATA and BATA (n=2 mice per tissue and samples were analyzed in duplicates). No statistical analysis was conducted on data presented in panel D as the brown adipocyte genes were undetectable in WATA and vice versa.
-
Figure 5—figure supplement 1—source data 1
BMA precursor cell markers change with HFD and phenotyping WATA and BATA.
- https://cdn.elifesciences.org/articles/65553/elife-65553-fig5-figsupp1-data1-v2.xlsx
Figure 6
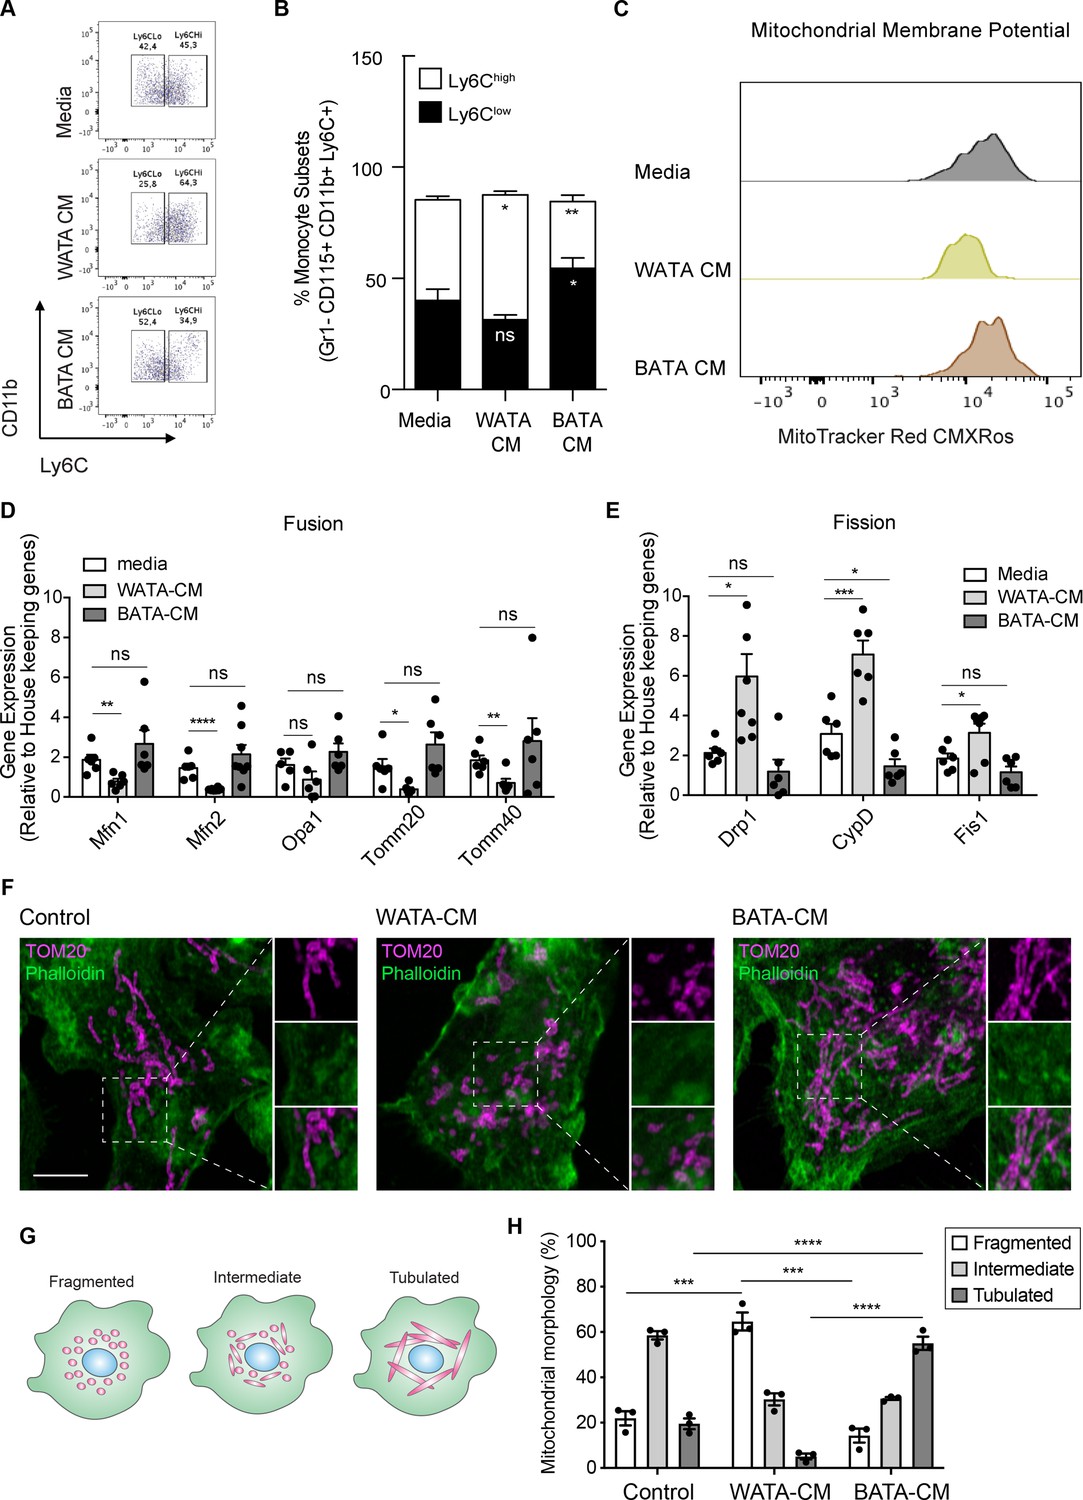
Bona fide white adipocytes favoured Ly6Chigh monocytes preponderance, blunted monocyte mitochondrial membrane potential, and induced mitochondrial fragmentation in vitro.
Naïve BM-derived monocytes were treated with CM from isolated bone fide white and brown adipocytes from EWAT and inter-scapular BAT for 18 hr. (A) Flow cytometry dot plots detecting the effects of 18 hr of treatment with media alone, pooled WATA-CM and BATA-CM from three mice (n=3 technical replicates each time with pooled CM from 3 mice) on monocyte subset abundance. (B) Quantification of the gates drawn for Ly6Clow and Ly6Chigh monocytes (n=9 biological replicates of naïve monocytes treated as indicated). (C) Representative plot of MitoTracker Red CMXRos detected by flow cytometry in Ly6Clow monocytes treated with media alone, pooled WATA-CM and BATA-CM for 18 h. (D) Gene expression of mitochondrial fusion genes Mfn1, Mfn2, Opa1, Tomm20, and Tomm40 in naive BM-derived monocytes treated with control Media, pooled WATA-CM and BATA-CM (n=6 mice in each CM group and samples were analyzed in duplicates). (E) Gene expression of mitochondrial fission genes Drp1, Ppid and Fis1 in naive BM-derived monocytes treated with control Media, WATA-CM and BATA-CM (n=6 mice in each CM group and samples were analyzed in duplicates). Results in (B), (D) and (E) are expressed as mean ± SEM, with one-way ANOVA used for statistical analysis: *p<0.05, **p<0.01 and ***p<0.001, ****p<0.0001 and ns = not significant p>0.05. Graphs in (A) and (C) were created using FlowJo software (Becton, Dickinson Company). (F) Super-resolution microscopy images of mitochondrial morphology via TOM20 staining in BM-derived monocytes treated with control Media, pooled WATA-CM and BATA-CM (representative of n=3 mice in each CM group). Scale bar = 5μm. Images were analyzed in Fiji (version 2.1.0/1.53 c). (G) Schematic illustration of mitochondrial morphologies as fragmented, intermediate, or tubulated. (H) Quantification of the percentage of monocytes with the indicated mitochondrial morphology, in each treatment condition. Values are from three independent experiments; n=3 mice in each CM group; about 40 cells counted for each condition, per experiment. Results are expressed as mean ± SEM. One-way ANOVA was used for statistical analysis. *p<0.05, **p<0.01 and ***p<0.001, ****p<0.0001 and ns = not significant p>0.05.
-
Figure 6—source data 1
Bona fide white adipocytes favoured Ly6Chigh monocytes preponderance, blunted monocyte mitochondrial membrane potential, and induced mitochondrial fragmentation in vitro.
- https://cdn.elifesciences.org/articles/65553/elife-65553-fig6-data1-v2.xlsx
Figure 7 with 1 supplement
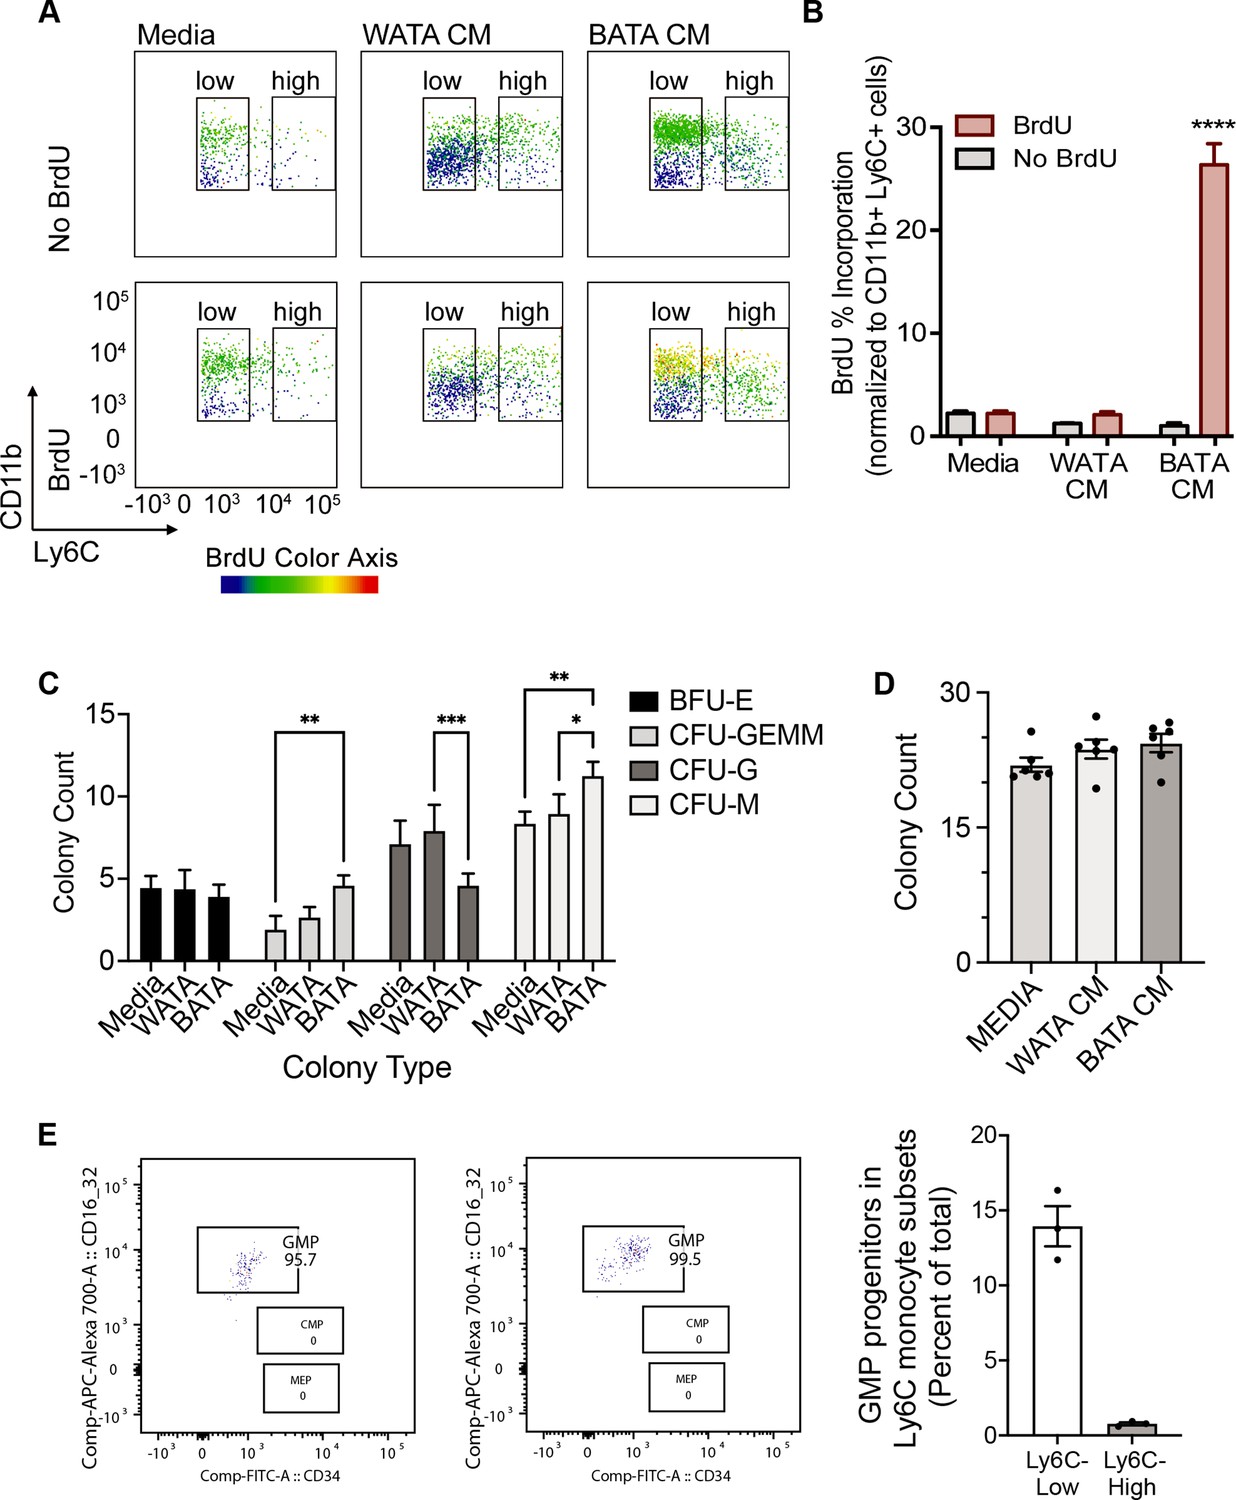
Brown adipocytes favour Ly6Clow monocytes through progenitor cell differentiation and proliferation.
(A) BM-derived, in vitro-generated monocytes were treated with media alone, WATA-CM or BATA-CM in the presence of the pyrimidine analogue BrdU to detect cellular proliferation. (B) Quantification of BrdU abundance in Ly6Clow and Ly6Chigh monocyte subsets with the treatments in panel A, was determined by flow analysis (yellow to red signal, see Methods). Results are expressed as mean ± SEM, n=3–6 individual mice per group. One-way ANOVA test was used for statistical analysis, ****p<0.0005. (C, D) Colony Forming Unit assays were performed as described in Methods using six independent cultures of BM-derived, in vitro-generated monocytes (n=6 individual mice), were treated with WATA-CM, BATA-CM or control adipocyte media (Media) for 18 h prior to mixing with methylcellulose-based media and plating at 20,000 cells/ml to 6-well plates, in triplicate. (C) BATA-CM promoted CFU-GEMM cultures over Media alone (**p<0.01 Two-way ANOVA, Tukey’s multiple comparisons) and skewed granulocyte/macrophage progenitors towards macrophage (CFU-M) over granulocyte (CFU-G) differentiation, relative to Media alone (**p<0.01) or WATA-CM (*p<0.05 or ***p<0.001). (D) The counts of the different colonies for each treatment (Media, WATA-CM or BATA-CM) were totaled and plotted as the mean ± SEM (n=6 individual mice). There was no statistical difference between the media treatments. (E) Isolated BM cells were processed for flow analysis to determine the progenitor cell populations present in the Ly6Clow or Ly6Chigh monocyte subsets. The percent GMP ratio was calculated relative to the total cells detected in either monocyte subset as the mean ± SEM (isolated from n=3 individual mice). Flow analysis panels in A and E were created using FlowJo software (Becton, Dickinson Company).
-
Figure 7—source data 1
Brown adipocytes favour Ly6Clow monocytes through progenitor cell differentiation and proliferation.
- https://cdn.elifesciences.org/articles/65553/elife-65553-fig7-data1-v2.xlsx
Figure 7—figure supplement 1
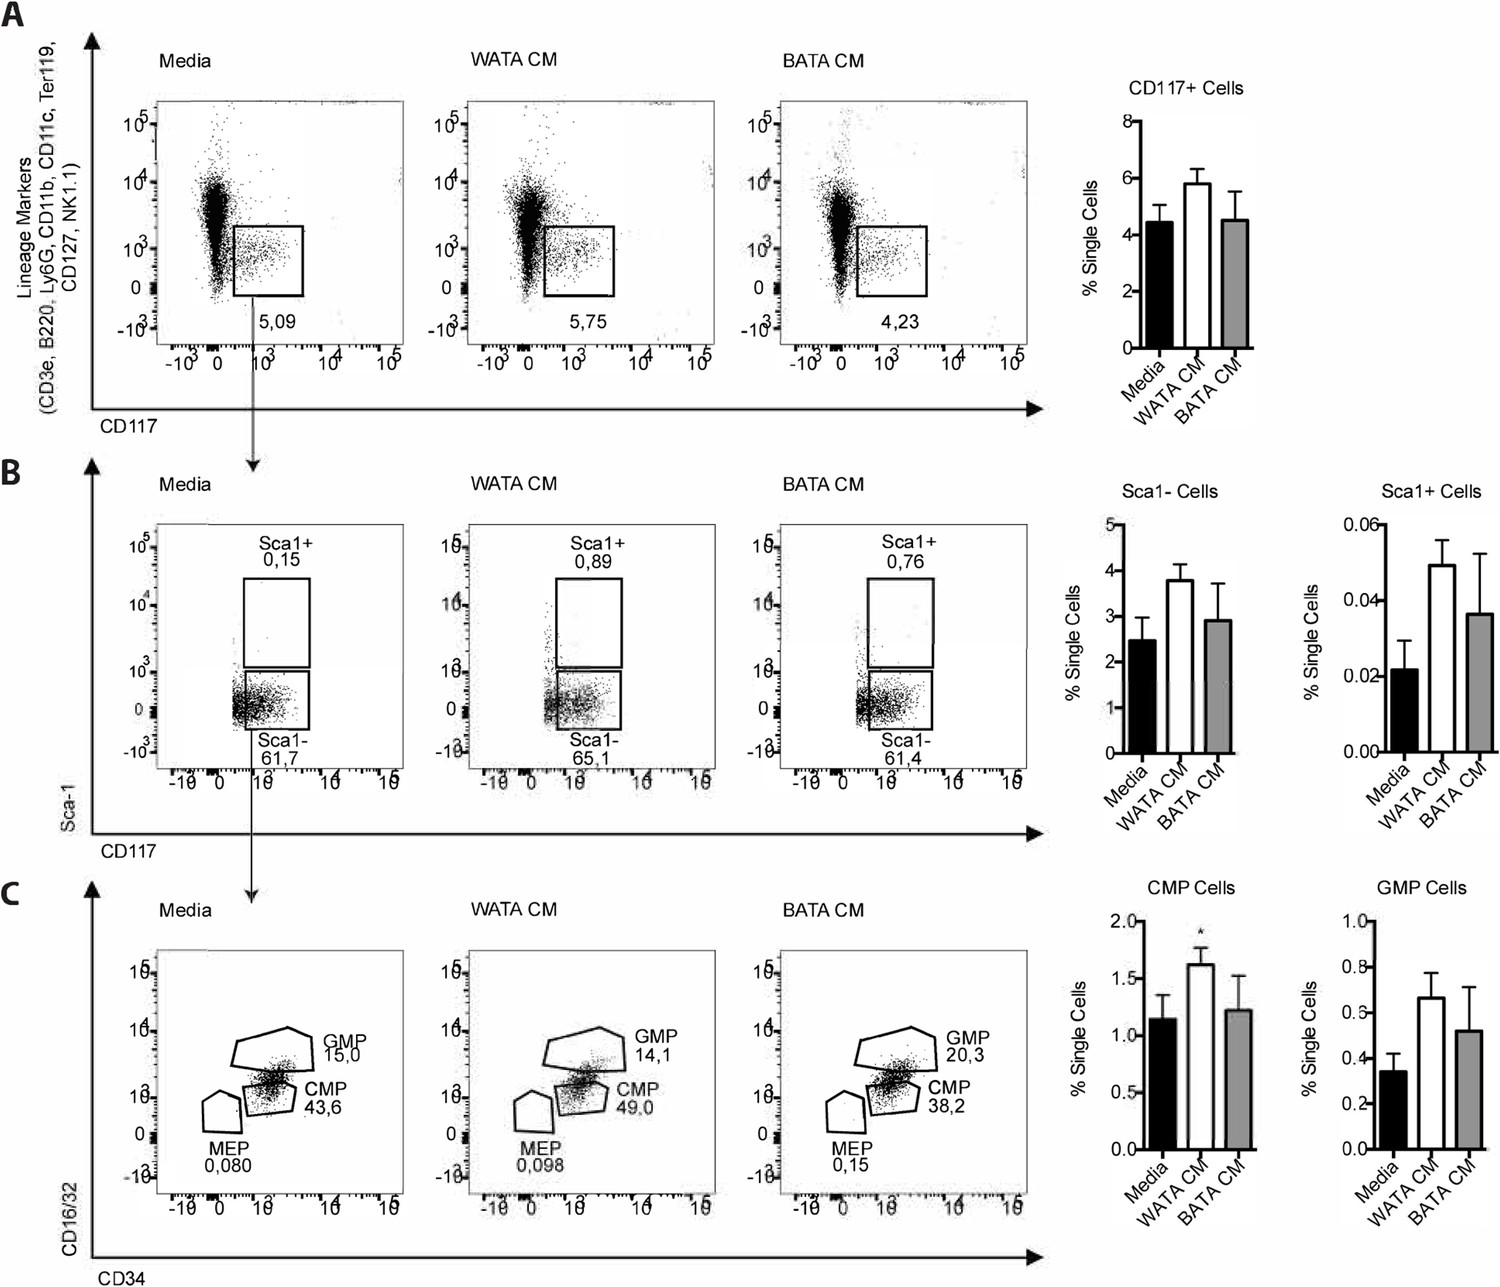
HSC and their progenitors following the white and brown CM treatment for 18 hr.
(A–C) Flow cytometry analysis was used to test for the presence and changes in HSC and monocyte progenitor cells in BM-derived, in vitro-generated BM-derived monocytes treated with media, WATA-CM, and BATA-CM. Flow cytometry antibodies used are listed in Table 1 (n=3 individual mice per CM group). One way ANOVA test was used for statistical analysis. *p<0.05 and ns = not significant p>0.05.
-
Figure 7—figure supplement 1—source data 1
HSC and their progenitors following the white and brown CM treatment for 18 hr.
- https://cdn.elifesciences.org/articles/65553/elife-65553-fig7-figsupp1-data1-v2.xlsx
Figure 8
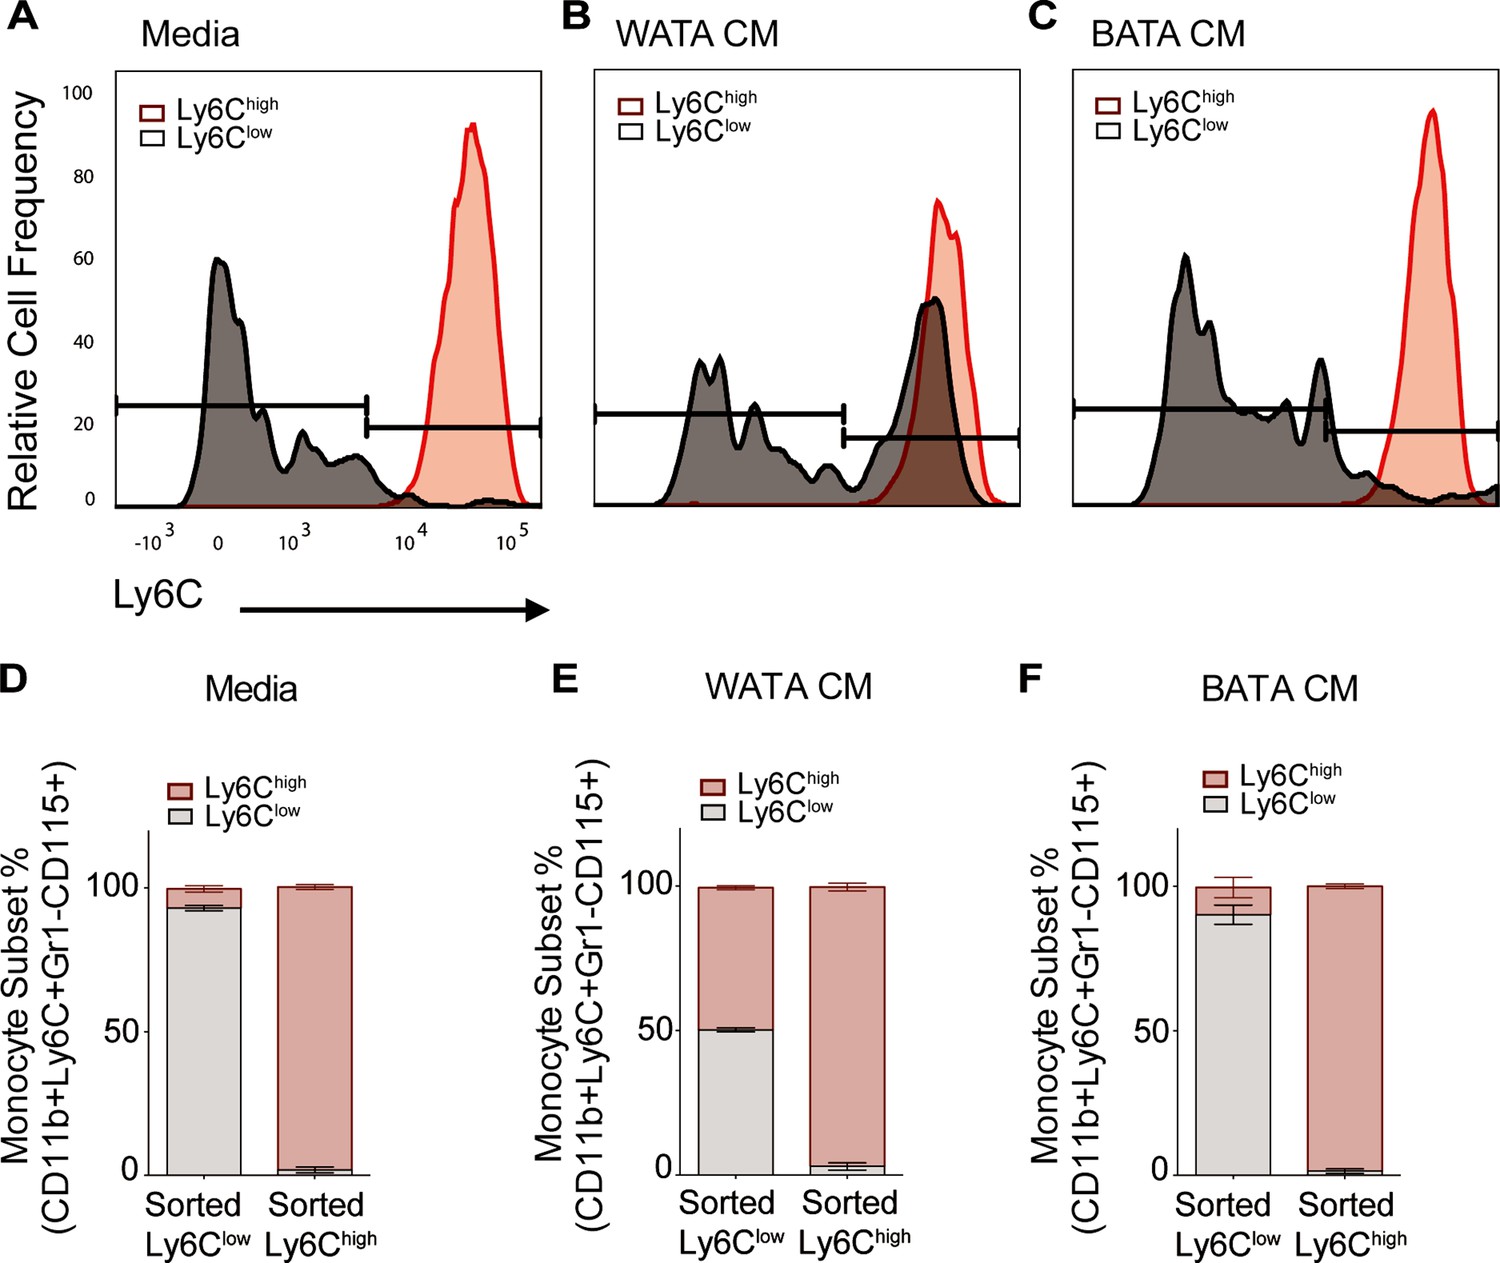
WATA-CM promotes Ly6Clow towards Ly6Chigh shift in BM-derived monocytes.
Representative plots of FACS-sorted Ly6Clow (gray) and Ly6Chigh (red) monocytes from control mice were independently treated with (A) Media alone, (B) WATA-CM, or (C) BATA-CM (n=6 mice per FACS-sorted monocyte group) for 18 hr after which the presence of the alternate monocyte subset was assessed via flow cytometry. (D–F) Quantification of Ly6Clow and Ly6Chigh gates in panels A-C. Flow cytometry panels A-C were created using FlowJo software (Becton, Dickinson Company).
-
Figure 8—source data 1
WATA-CM promotes Ly6Clow towards Ly6Chigh shift in BM-derived monocytes.
- https://cdn.elifesciences.org/articles/65553/elife-65553-fig8-data1-v2.xlsx
Tables
Table 1
List of Antibodies used for flow cytometry analysis.
| Markers | Fluorophore | Manufacturer | Clone | Catalog Number |
|---|---|---|---|---|
| CD11b | APC-eFluor 780 | eBioscience | M1/70 | 47-0112-82 |
| Ly6C | PE-Cy7 | Biolegend | HK1.4 | 128018 |
| Gr-1 | Alexa Fluor 700 | eBioscience | RB6-8C5 | 56-5931-82 |
| CX3CR1 | Brilliant Violet 421 | Biolegend | SA011F11 | 149023 |
| CCR2 | Alexa594 | R&D Systems | 475301 | FAB5538T |
| CD115 | APC | eBioscience | AFS98 | 17-1152-82 |
| F4/80 | PerCP-Cy5.5 | BioLegend | BM8 | 123128 |
| CD11c | FITC | eBioscience | N418 | 11-0114-81 |
| CD34 | FITC | BD Biosciences | RA1434 | 553733 |
| CD16/32 | APC-R700 | BD Biosciences | 2.4G2 | 565502 |
| CD45.2 | BV650 | BD Biosciences | 30-F11 | 563410 |
| CD150 | PEPCP710 | invitrogen | mShad150 | 46-1502-82 |
| CD117 | APC/Fire 750 | BioLegend | 2B8 | 105838 |
| SCA1 | PE-Cy7 | Invitrogen | D7 | 25-5981-82 |
| CD48 | BV605 | BioLegend | MM48-1 | 103441 |
| CD3e* | PE | BD Biosciences | 17A2 | 555725 |
| B220* | PE | BD Biosciences | RA3-6B2 | 553089 |
| Ly6G* | PE | BD Biosciences | 1A8 | 551461 |
| CD11b* | PE | BD Biosciences | M1/70 | 553311 |
| CD11c* | PE | BioLegend | N418 | 117308 |
| Ter119* | PE | BD Biosciences | TER-119 | 553623 |
| CD127* | PE | eBioscience | A7R34 | 12-1271-82 |
| NK1.1* | PE | BD Biosciences | PK138 | 553165 |
-
*
LINEAGE is a cocktail of antibodies containing CD3e, B220, Ly6G, CD11b, CD11c, Ter119, CD127, NK1.1 with the same fluorophore to exclude all terminally differentiated cells.
Additional files
Download links
A two-part list of links to download the article, or parts of the article, in various formats.
Downloads (link to download the article as PDF)
Open citations (links to open the citations from this article in various online reference manager services)
Cite this article (links to download the citations from this article in formats compatible with various reference manager tools)
Bone marrow adipocytes drive the development of tissue invasive Ly6Chigh monocytes during obesity
eLife 11:e65553.
https://doi.org/10.7554/eLife.65553


