IL-33 promotes innate lymphoid cell-dependent IFN-γ production required for innate immunity to Toxoplasma gondii
- Department of Pathobiology, University of Pennsylvania School of Veterinary Medicine, United States
- Kangwon National University College of Veterinary Medicine and Institute of Veterinary Science, Republic of Korea
- Liver Immunology, Department of Biomedicine, University Hospital of Basel and University of Basel, Switzerland
- Department of Respiratory Inflammation and Autoimmunity, AstraZeneca, United States
Figures
Figure 1 with 1 supplement

Toxoplasma gondii infection induces IL-33 expression and release.
Mice were infected i.p. with T. gondii. After 7 days, (A) free IL-33 in the peritoneal cavity was measured by ELISA. (B) Measurements of IL-33 from (A) were plotted against corresponding parasite burden and fit to a linear model. (C) Five millimeter punch biopsies of liver was placed in culture for 24 hr and IL-33 measured in supernatants by ELISA. Each point represents the mean of three biopsies from a single mouse. (D) Cells from omenta of IL-33 GFP reporter mice were analyzed by flow cytometry at 3 days post-infection. Cells shown are live singlets. Data are representative of three mice per group. (E) Whole mount omentum showing IL-33-GFP signal in milky spot. (F) 3D projection of milky spot showing stromal marker ERTR7 and IL-33 GFP signal. (G) Whole mount immunofluorescence of milky spot. NS, not significant (p>0.05); *p<0.05 and ***p<0.001 (one-way ANOVA with Tukey’s multiple comparisons test). Data are pooled from three (A and B) or two (C, D, E, F, and G) independent experiments (mean + s.e.m).
-
Figure 1—source data 1
Excel file containing numerical values collected from IL-33 ELISA and parasite DNA qPCR shown in Figure 1.
- https://cdn.elifesciences.org/articles/65614/elife-65614-fig1-data1-v2.xlsx
Figure 1—figure supplement 1
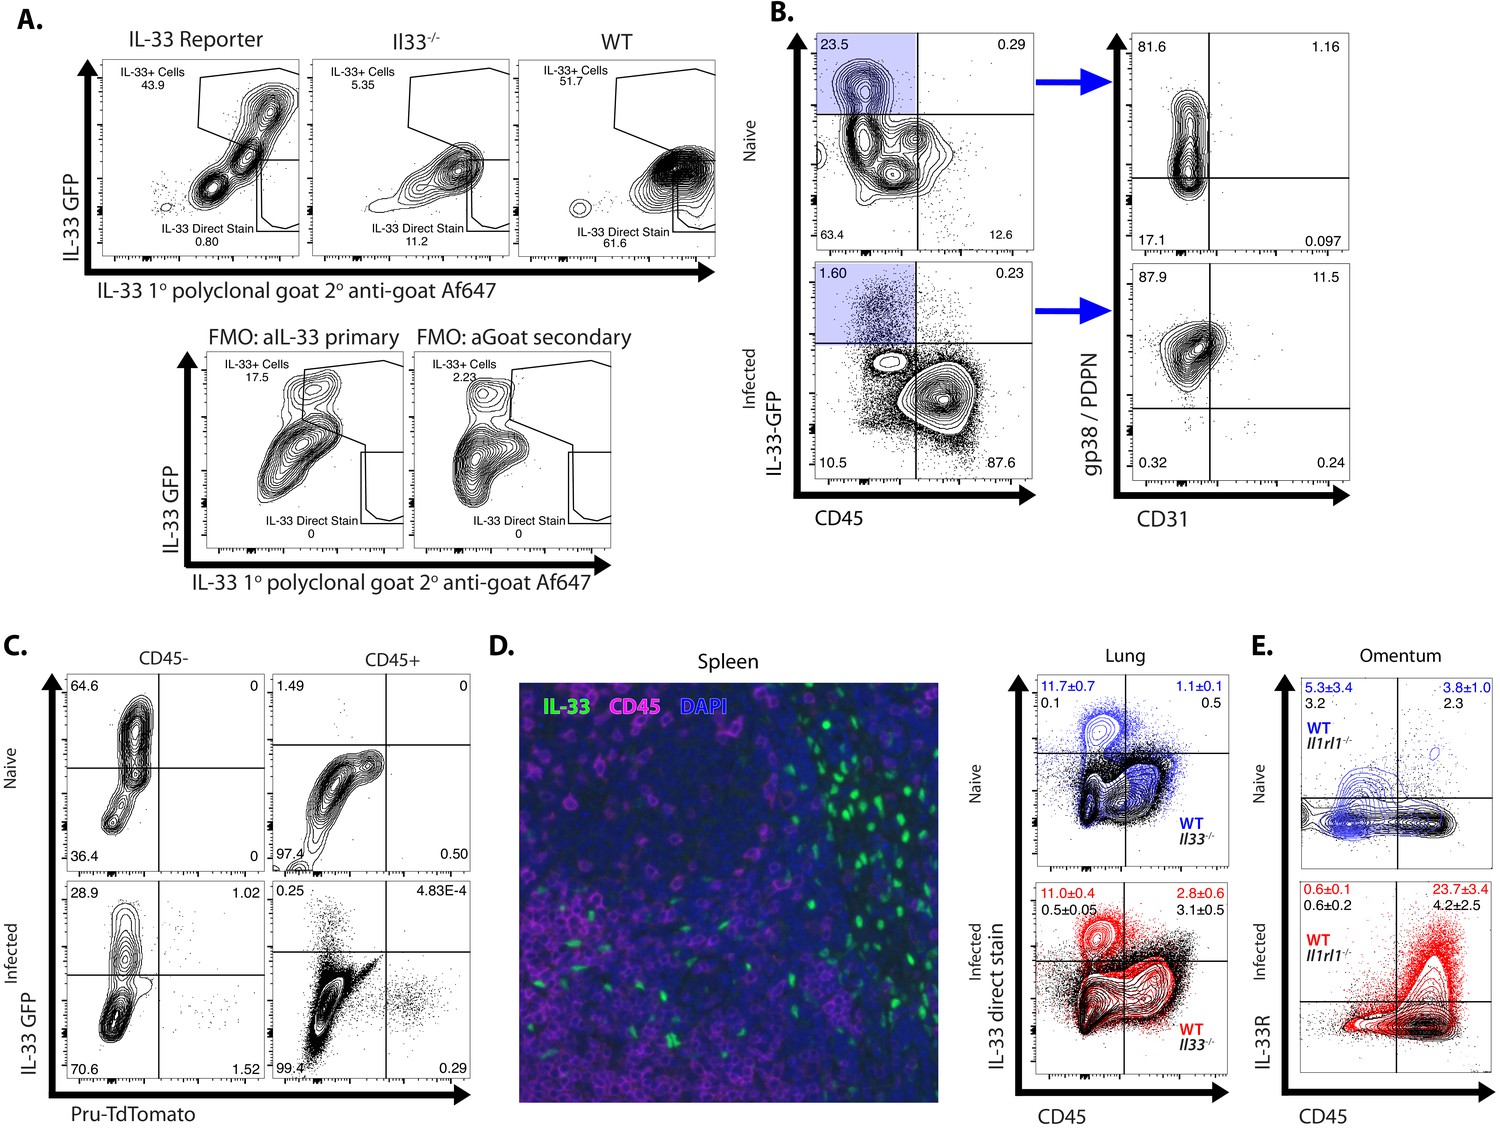
IL-33 is primarily expressed by non-hematopoietic cells.
Mice were infected i.p. with T. gondii. After 7 days, (A–C) Intracellular staining of omenta from infected mice. Data are representative of 3 mice per group, FMO controls are pooled from samples of all genotypes above. (D) Immunofluorescence of spleen sections from naïve mouse and intracellular staining flow cytometry from naïve and infected mouse lungs. Data are representative of 3 mice per condition and genotype (E) Surface staining of omenta from wild type naïve and infected mice. Data are representative of 3 mice per condition and genotype.
Figure 2
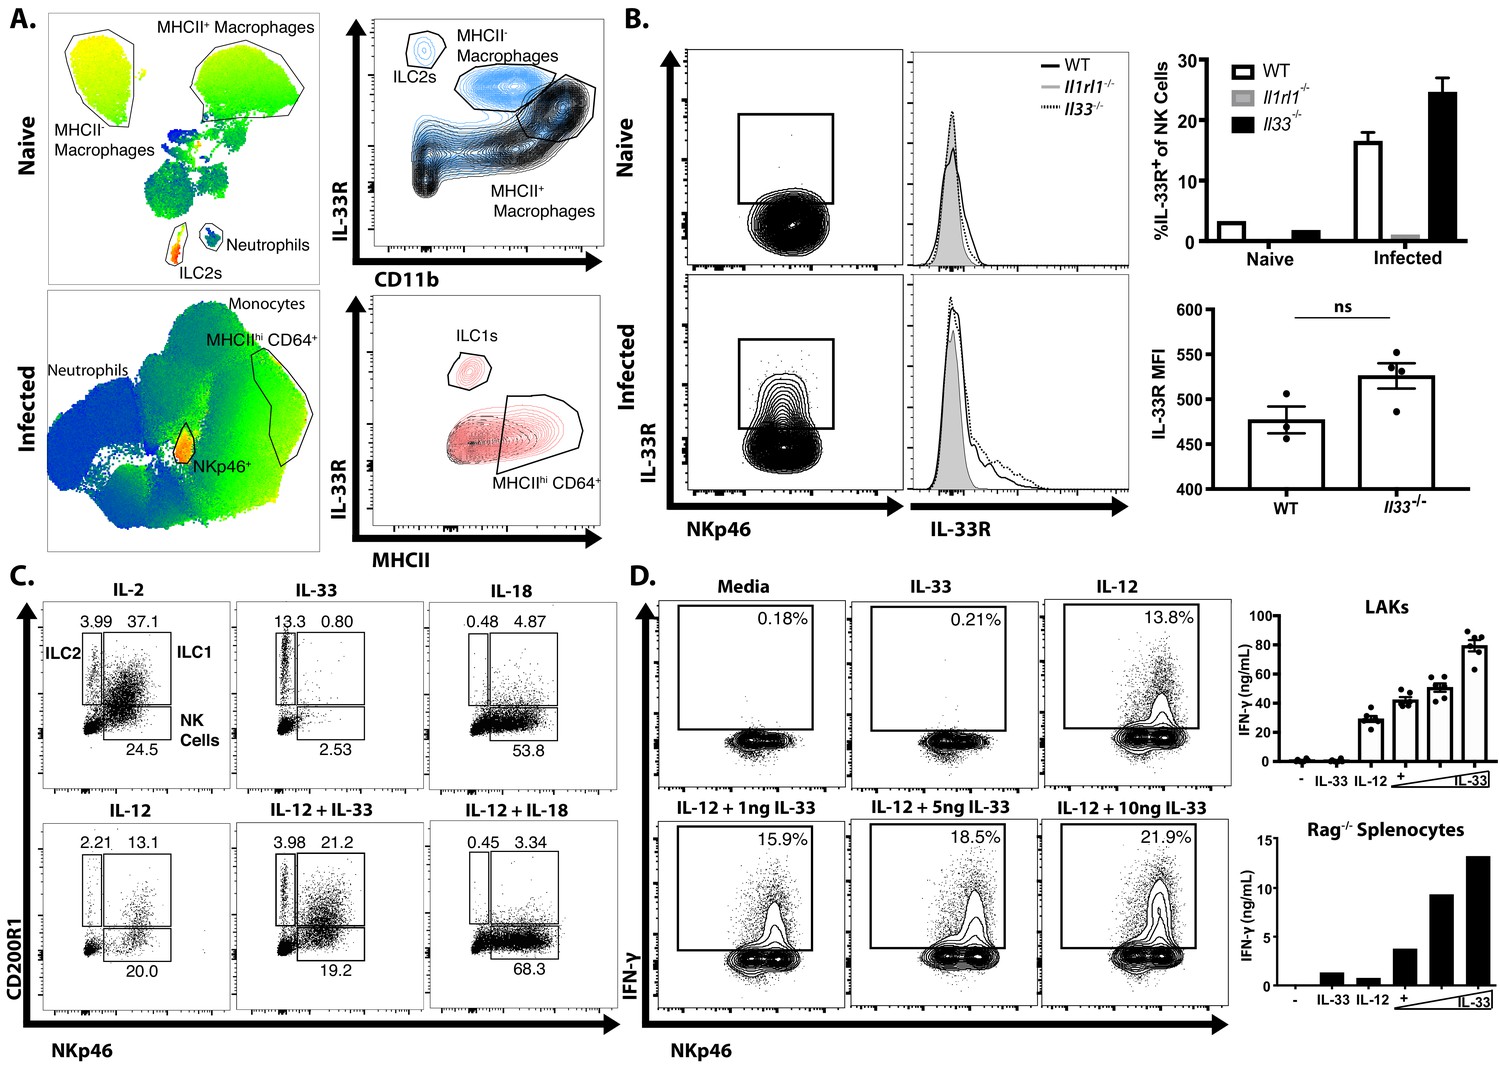
Infection sensitizes NK and ILC to IL-33.
(A) UMAP analysis of peritoneal exudate cells from naïve or 7 dpi i.p. mice, with heatmap for IL-33R expression. Data compiled from four mice per group. (B) Flow cytometry from peritoneal cells showing IL-33R staining on NKp46+ cells. Data are representative of three to four mice per group. (C) Flow cytometry of LAKs showing composition of population based on cytokine stimulation condition. Population shown is pre-gated on live singlets. (D) Intracellular cytokine staining of LAKs after 24 hr cytokine stimulation and 4 hr incubation with Brefeldin A. NS, not significant (p>0.05) (Student’s t-test); data are representative of three independent experiments (A–D).
-
Figure 2—source data 1
Excel file containing numerical values collected from IL-33R staining and IFN-γ ELISA shown in Figure 2.
- https://cdn.elifesciences.org/articles/65614/elife-65614-fig2-data1-v2.xlsx
Figure 3 with 1 supplement
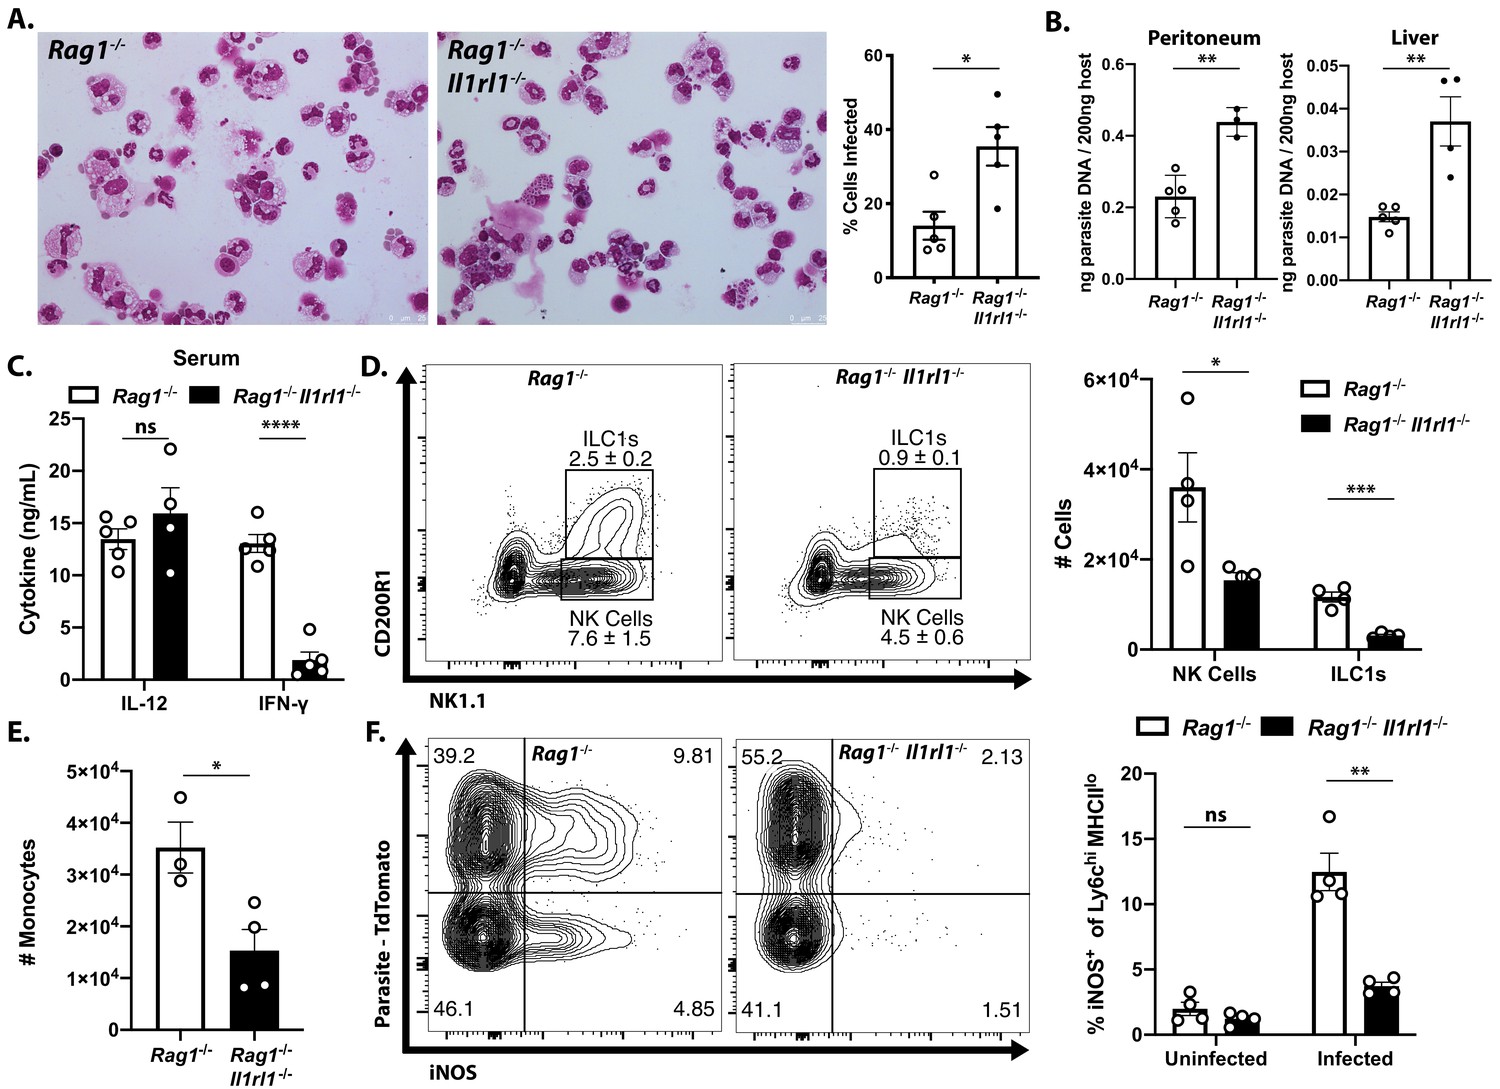
Endogenous IL-33 promotes the anti-parasitic immune response.
(A) Cytospins of peritoneal exudate cells at 7 dpi i.p. (B) qPCR for parasite DNA from indicated tissues. (C) Serum cytokines measured by ELISA at 7 dpi. Representative of four to five mice per group. (D) Flow cytometric analysis and quantification of liver innate lymphoid cells. Populations shown are pre-gated on live singlets that are MHCII−. (E) Quantification of inflammatory monocytes (CD11b+CD64+Ly6 g−) in livers of infected mice at 7 dpi. (F) Intracellular iNOS staining from monocytes in (E), sub-gated on primary iNOS-producing cells (Ly6chi MHCIIlo). NS, not significant (p>0.05); *p<0.05, **p<0.01, ***p<0.001, and ****p<0.0001 (student’s t-test). Data are representative of three independent experiments.
-
Figure 3—source data 1
Excel file containing numerical files collected from cytospin infected cell frequency quantification, parasite DNA qPCR, serum IL-12 and IFN-γ ELISA, and enumeration of cells shown in Figure 3 and Figure 3—figure supplement 1.
- https://cdn.elifesciences.org/articles/65614/elife-65614-fig3-data1-v2.xlsx
Figure 3—figure supplement 1
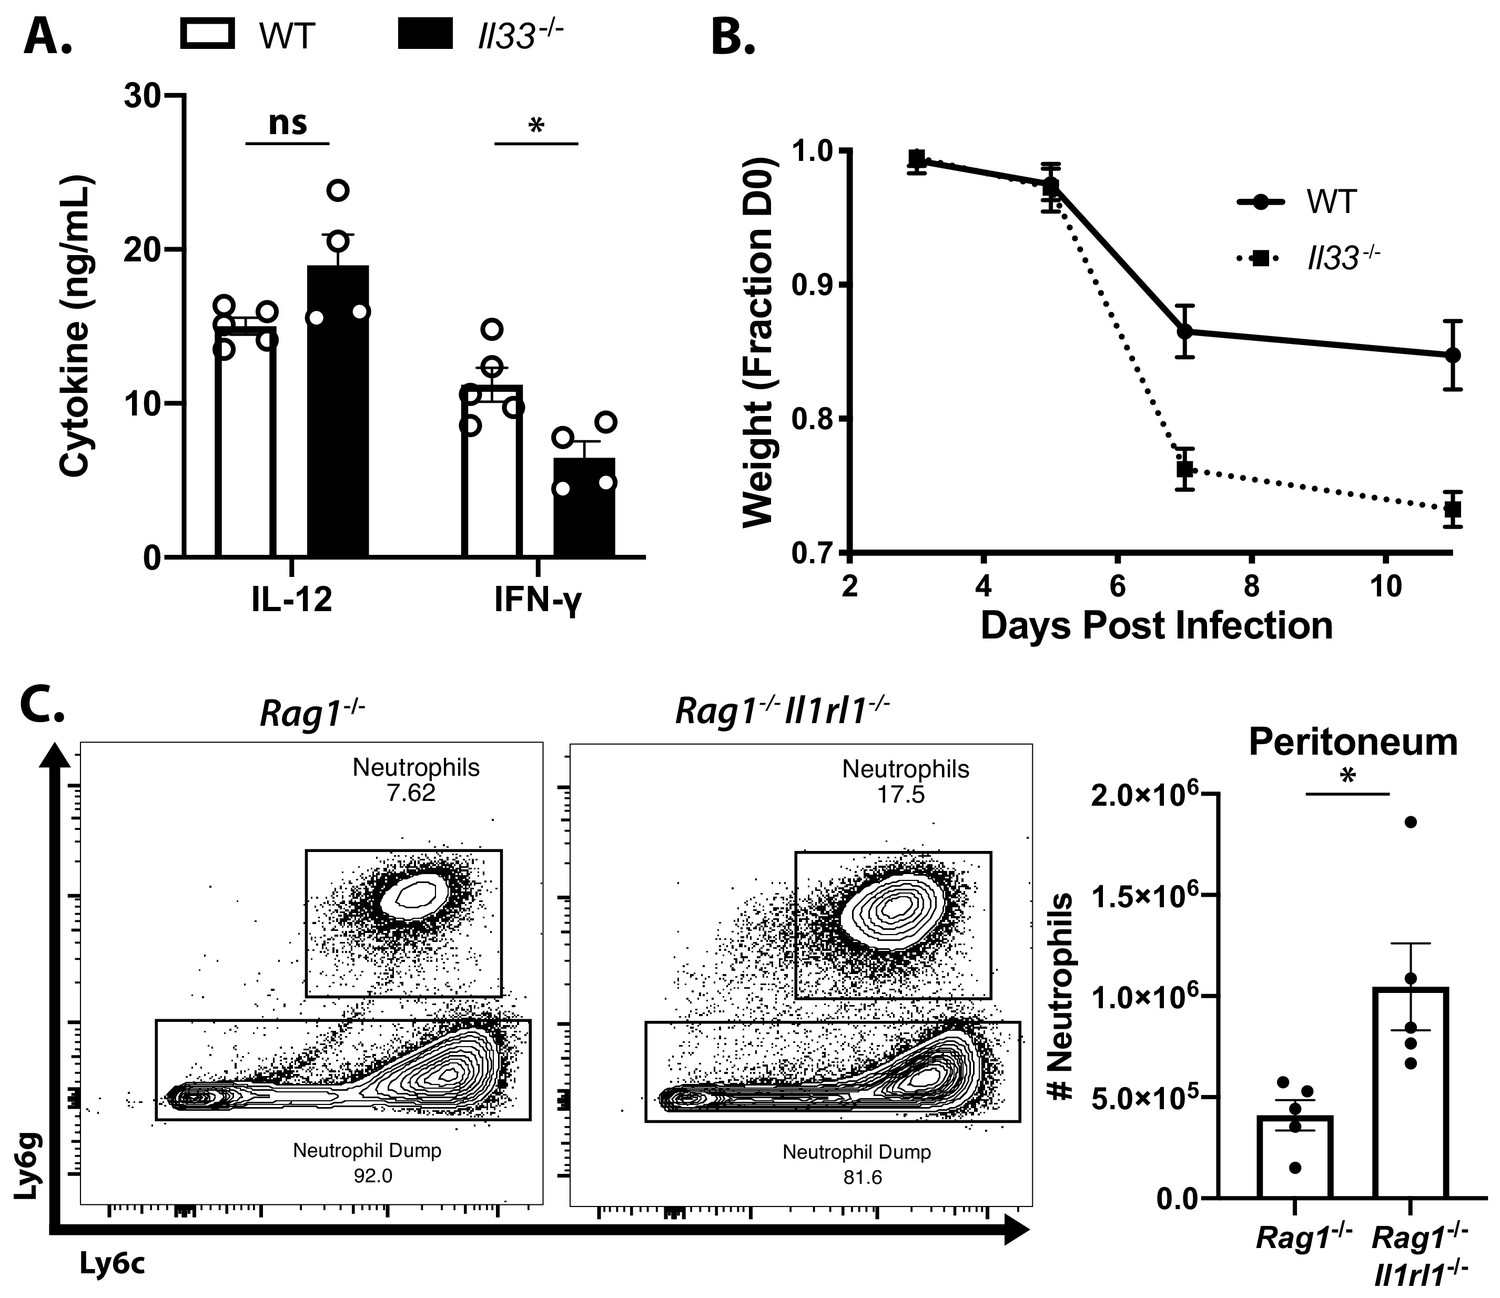
Endogenous IL-33 promotes anti-parasite responses in WT mice.
Mice were infected i.p. with T. gondii. (A) Quantification of serum cytokines from Rag1+/+ mice at 10 dpi. (B) Weight loss curves for mice from (A). (C) Representative flow cytometric analysis (left) and quantification of numbers (right) of neutrophils in the peritoneum at 7 dpi. Data are representative of three independent experiments.
Figure 4

IL-33 treatment boosts IL-12- and IFN-γ-dependent immunity.
(A) Quantification of infected cell frequencies in cytospins at 7 dpi i.p. and qPCR for parasite DNA in indicated tissues. (B) Representative cytospins from peritoneal lavage at 7 dpi. Data are representative of four to six mice per group. (C) Flow cytometric analysis of inflammatory monocytes in the peritoneal exudate at 7 dpi. Populations shown are pre-gated on live Ly6g− singlets. Ly6chi CCR2+ cells are highlighted in black. (D) Representative analysis of Ly6c+ CCR2+ cells at 7 dpi in the liver and quantification of monocyte numbers and iNOS staining. (E) Histology of liver at 7 dpi, H and E showing infiltration of immune cells (left) and DAB iNOS staining (right). Black arrows indicate inflammatory infiltration; blue arrow indicates necrotic lesion. *p<0.05, **p<0.01, and ***p<0.001 (Student’s t-test). Data are representative of five (A–C) or three (D–E) independent experiments.
-
Figure 4—source data 1
Excel file containing numerical values collected from cytospin infected cell frequency quantification, cell counts, and iNOS staining shown in Figure 4.
- https://cdn.elifesciences.org/articles/65614/elife-65614-fig4-data1-v2.xlsx
Figure 5
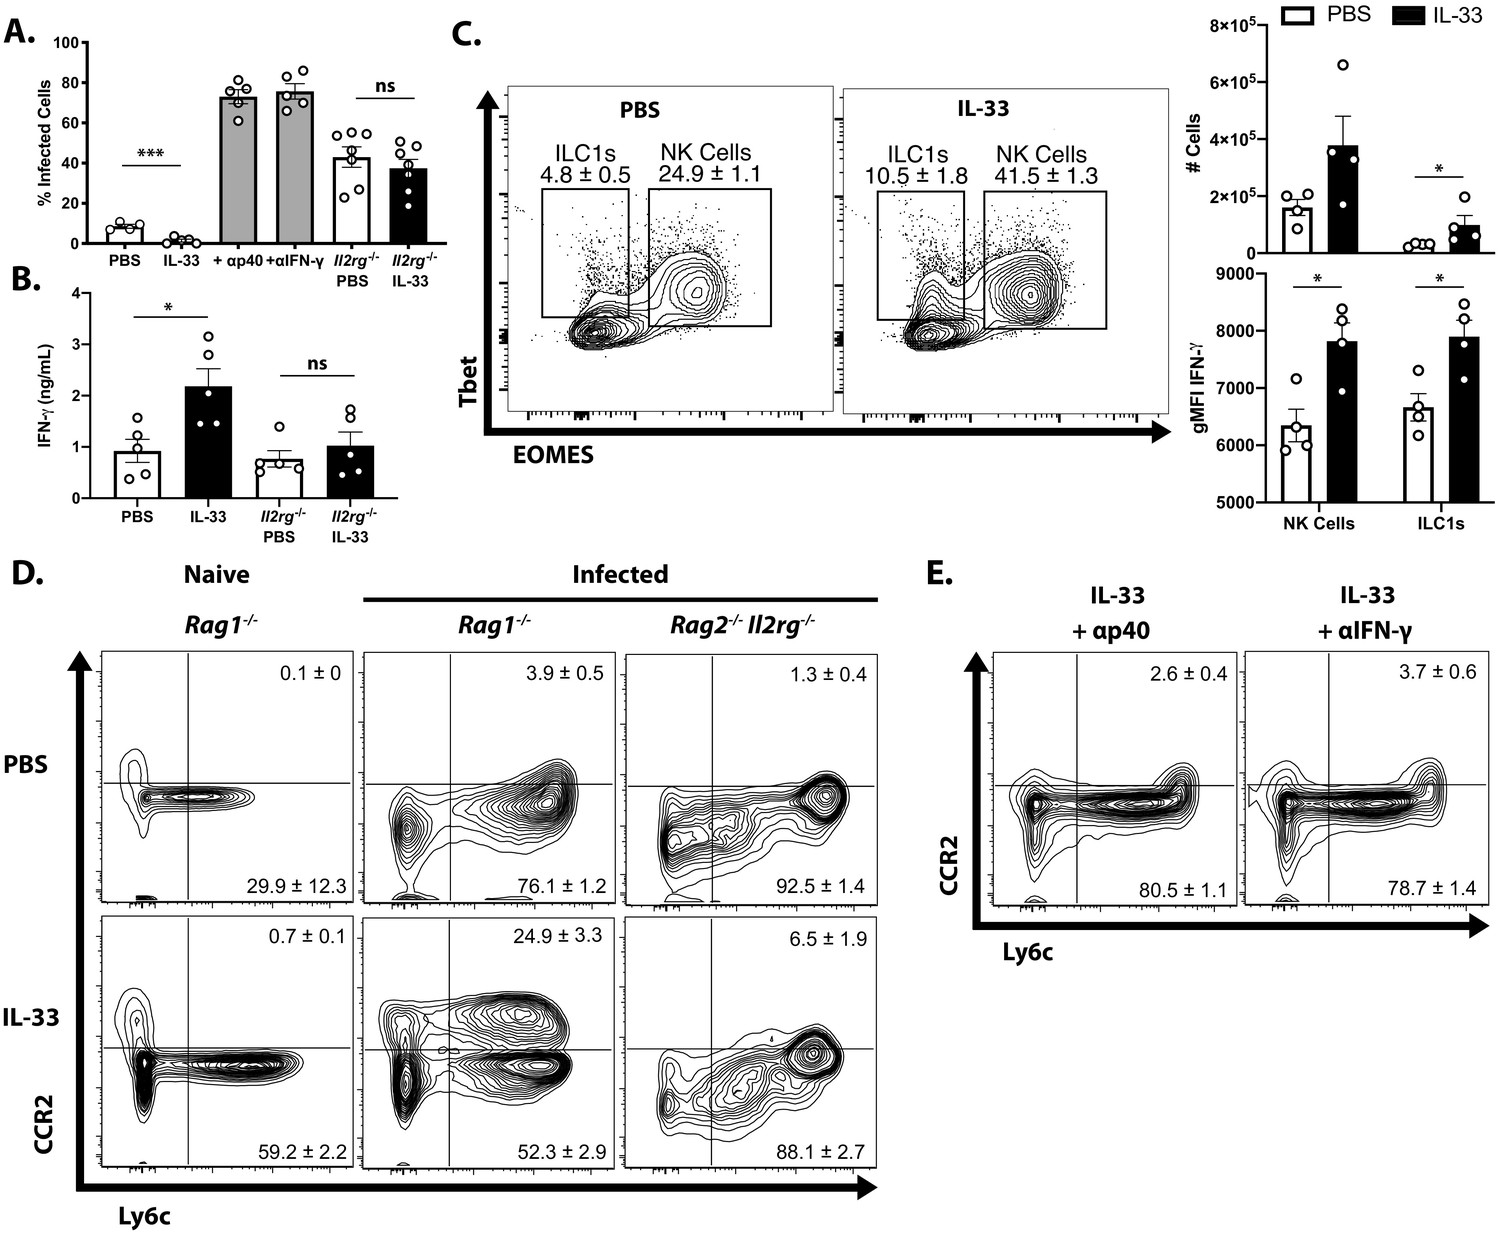
Protective effect of IL-33 is dependent on IL-12, IFN-γ, and ILC.
(A) Quantification of cytospins from peritoneal exudate cells at 7 dpi i.p. (B) Quantification of IFN-γ in peritoneal lavage at 7 dpi. (C) Representative flow cytometric analysis of NK cells and ILC1s (left) and quantification of cell numbers and cytokine production (right) in the peritoneal exudate at 7 dpi. Population shown is pre-gated on live Ly6g- NKp46+ singlets. (D and E) Flow cytometric analysis of inflammatory monocytes in peritoneum at 7 dpi. Data are representative of two independent experiments.
-
Figure 5—source data 1
Excel file containing numerical values collected from cytospin infected cell frequency quantification, IFN-γ ELISA, and enumeration of cells shown in Figure 5.
- https://cdn.elifesciences.org/articles/65614/elife-65614-fig5-data1-v2.xlsx
Figure 6
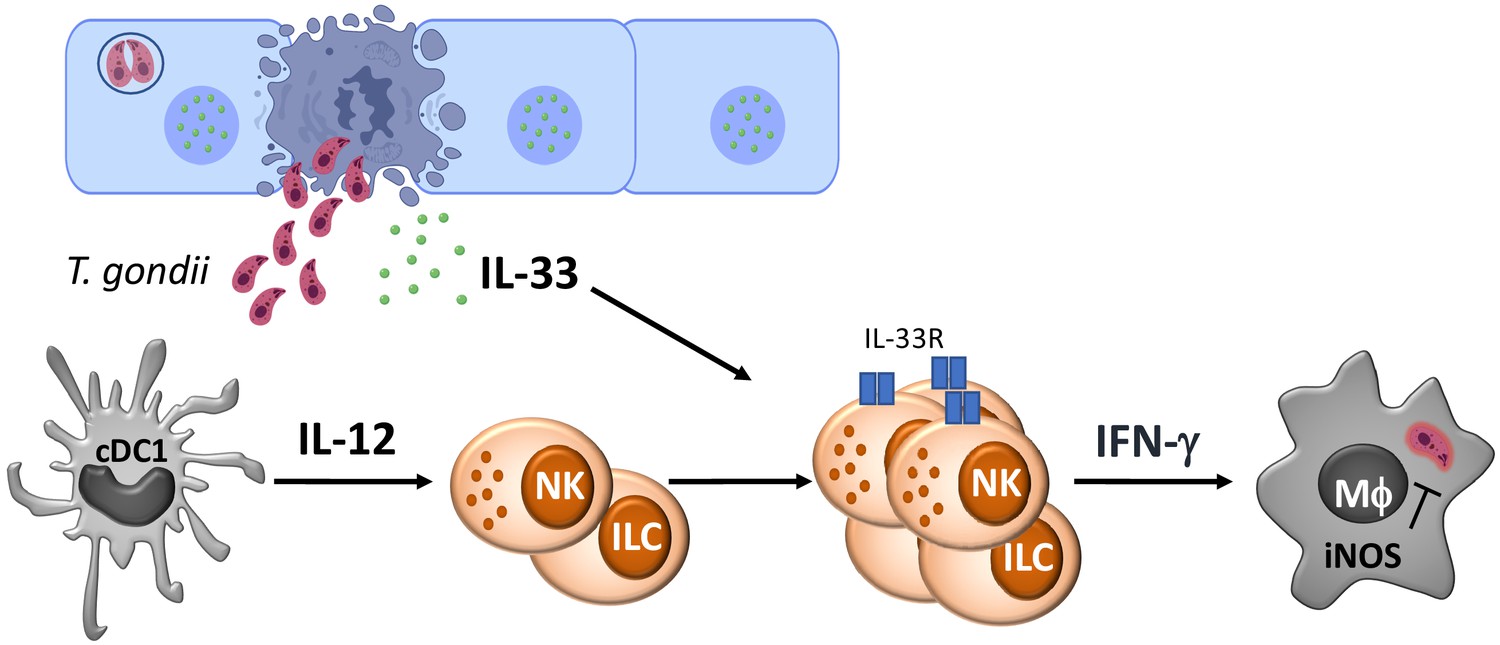
Model for the role of IL-33 in innate immunity to Toxoplasma gondii.
Tables
Key resources table
| Reagent type (species) or resource | Designation | Source or reference | Identifiers | Additional information |
|---|---|---|---|---|
| Gene (Mus musculus) | Il33 | GenBank | MGI:1924375 | https://www.ncbi.nlm.nih.gov/gene/77215 |
| Gene (Mus musculus) | Il1rl1 | GenBank | MGI:98427 | https://www.ncbi.nlm.nih.gov/gene/17082 |
| Strain, strain background (Mus musculus) | C57BL/6NTac | Taconic | RRID:MGI:5658006 | |
| Genetic reagent (Mus musculus) | B6.129S7-Rag1tm1Mom/J | Jackson | RRID:IMSR_JAX:002216 | |
| Genetic reagent (Mus musculus) | C57BL/6NTac.Rag2tm1Fwa;II2rgtm1Wjl | Taconic | Cat # 4111 | |
| Genetic reagent (Mus musculus) | B6(129S4)-Il33tm1.1Bryc/J | Jackson | RRID:IMSR_JAX:030619 | |
| Genetic reagent (Mus musculus) | Il1rl1tm1Anjm | PMID:10727469 Townsend et al., 2000 | MGI:2386675 | http://www.informatics.jax.org/allele/MGI:2386675 |
| Strain, strain background (Toxoplasma gondii) | ME49 | NCBI:txid508771 | ||
| Strain, strain background (Toxoplasma gondii) | Pru-tdTomato | PMID:19578440 John et al., 2009 | ||
| Strain, strain background (Toxoplasma gondii) | CPS | PMID:11859373 Fox and Bzik, 2002 | ||
| Antibody | Toxoplasma gondii Rabbit polyclonal | Collaborator | IHC: 1:100 | |
| Antibody | iNOS Rabbit polyclonal | Abcam | Cat # ab15323, RRID:AB_301857 | IHC 1:50 |
| Antibody | ERTR7 Af647 Rat monoclonal (sc-73355) | Santa Cruz Biotechnology | Cat # sc-73355 RRID:AB_1122890 | IF (1:50) |
| Antibody | F4/80 BV480 Rat monoclonal (T45-2342) | BD | Cat # 565635 RRID:AB_2739313 | IF (1:25) |
| Antibody | CD45 Af700 Rat monoclonal (30-F11) | BioLegend | Cat # 103127, RRID:AB_493714 | IF (1:20) |
| Antibody | CD335 NKp46 PE/Dazzle 594 Rat monoclonal (29A1.4) | BioLegend | Cat # 137629, RRID:AB_2616665 | FC (1:200) |
| Antibody | NK-1.1 BV711 Mouse monoclonal (PK136) | BioLegend | Cat # 108745, RRID:AB_2563286 | FC (1:200) |
| Antibody | IFN gamma Af700 Rat monoclonal (XMG1.2) | Thermo Fisher | Cat # 56-7311-82, RRID:AB_2688063 | FC (1:200) |
| Antibody | CD200 Receptor APC Rat monoclonal (OX110) | Thermo Fisher | Cat # 17-5201-82, RRID:AB_10717289 | FC (1:200) |
| Antibody | T1/ST2 Biotin Rat monoclonal (DJ8) | MD Biosciences | Cat # 101001B, RRID:AB_947551 | FC (1:200) |
| Antibody | T-bet PE-Cy7 Mouse monoclonal (4B10) | BioLegend | Cat # 644823 | FC (1:200) |
| Antibody | EOMES PE Rat monoclonal (Dan11mag) | Thermo Fisher | Cat # 12-4875-82, RRID:AB_1603275 | FC (1:200) |
| Antibody | CD11b ef450 Rat monoclonal (M1/70) | Thermo Fisher | Cat # 48-0112-80, RRID:AB_1582237 | FC (1:1000) |
| Antibody | CD11c APC-ef780 Armenian hamster monoclonal (N418) | Thermo Fisher | Cat# 47-0114-80, RRID:AB_1548663 | FC (1:200) |
| Antibody | Ly-6C BV785 Rat monoclonal (HK1.4) | BioLegend | Cat # 128041, RRID:AB_2565852 | FC (1:200) |
| Antibody | Ly-6G BV711 Rat monoclonal (1A8) | BioLegend | Cat # 127643, RRID:AB_2565971 | FC (1:200) |
| Antibody | CCR2 CD192 APC Rat monoclonal (SA203G11) | BioLegend | Cat # 150628, RRID:AB_2810415 | FC (1:200) |
| Antibody | CD64 FcgammaRI PE-Cy7 Mouse monoclonal (X54-5/7.1) | BioLegend | Cat # 139306, RRID:AB_11219391 | FC (1:200) |
| Antibody | MHC Class II (I-A/I-E) Af700 Rat monoclonal (M5/114.15.2) | Thermo Fisher | Cat # 56-5321-82, RRID:AB_494009 | FC (1:200) |
| Antibody | iNOS APC Rat monoclonal (CXNFT) | Thermo Fisher | Cat # 17-5920-82, RRID:AB_2573244 | FC (1:200) |
| Antibody | Podoplanin gp38 PerCP-ef710 Syrian hamster monoclonal (eBio8.1.1) | Thermo Fisher | Cat # 46-5381-82, RRID:AB_2848339 | FC (1:200) |
| Antibody | CD31 BV605 Rat monoclonal (390) | BioLegend | Cat # 102427, RRID:AB_2563982 | FC (1:200) |
| Peptide, recombinant protein | Recombinant murine IL-33 | Peprotech | Cat # 210–33 | |
| Commercial assay or kit | IL-33 ELISA | R and D Biosystems | Cat # DY3626 |
Additional files
Download links
A two-part list of links to download the article, or parts of the article, in various formats.
Downloads (link to download the article as PDF)
Open citations (links to open the citations from this article in various online reference manager services)
Cite this article (links to download the citations from this article in formats compatible with various reference manager tools)
IL-33 promotes innate lymphoid cell-dependent IFN-γ production required for innate immunity to Toxoplasma gondii
eLife 10:e65614.
https://doi.org/10.7554/eLife.65614


