Endogenous p53 expression in human and mouse is not regulated by its 3′UTR
- Cancer Biology and Genetics Program, Memorial Sloan Kettering Cancer Center, United States
Figures
Figure 1 with 1 supplement
Deletion of the endogenous 3′UTR does not alter TP53 mRNA level in human cells.
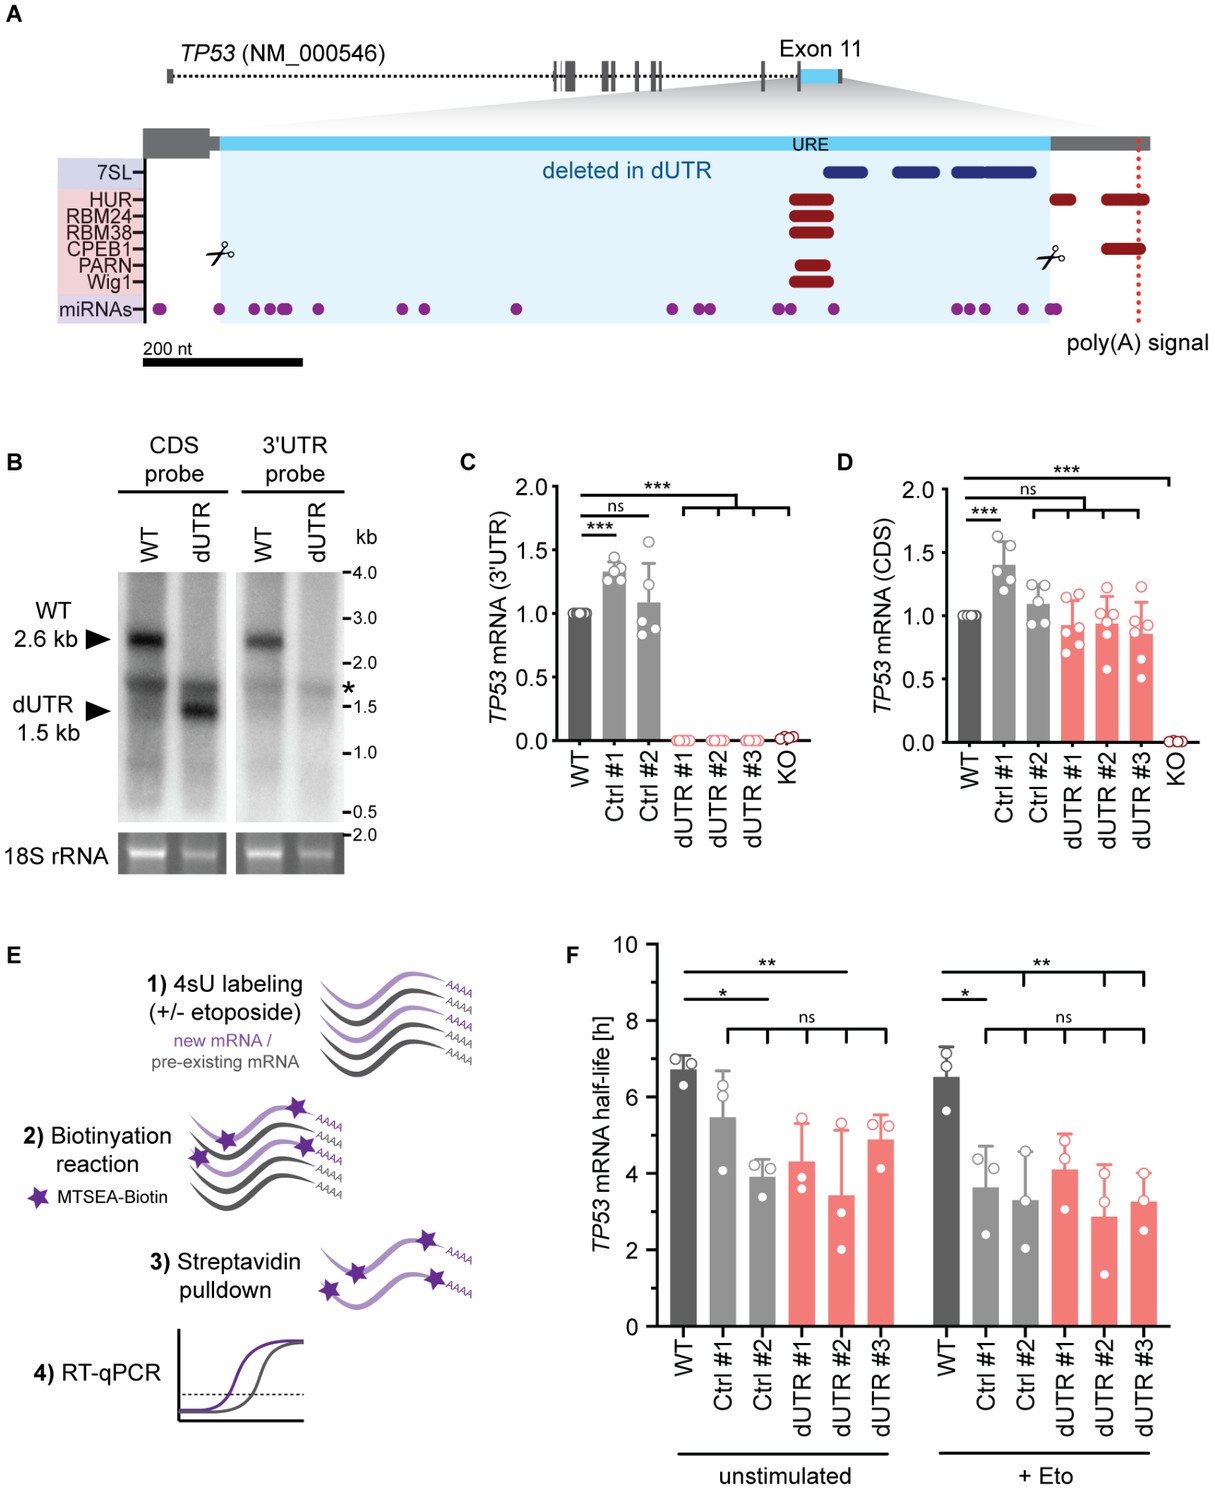
(A) Schematic of the human TP53 gene. The sequence deleted in dUTR cells is shown in blue. Tracks of binding sites for miRNAs, RNA-binding proteins, and lncRNAs are depicted below (see also Table 1). URE, U-rich element. CRISPR/Cas9-mediated deletions at the nucleotide level are shown in Figure 1—figure supplement 1. (B) Northern blot analysis of TP53 mRNA from WT and dUTR HEK293 cells. A probe that hybridizes to the TP53 coding region (CDS) reveals expression of a shortened TP53 mRNA in dUTR cells. The size difference is consistent with the length of the CRISPR/Cas9-induced deletion. A probe designed to bind the TP53 3′UTR does not produce a signal in the mRNA of dUTR cells, confirming deletion of this sequence element. The band of 18S rRNA is used as a loading control. * indicates an unspecific band originating from ribosomal RNA. (C) TP53 mRNA expression measured by RT-qPCR with a primer pair located in the 3′UTR in the indicated samples derived from HCT116 cells. KO, HCT116 TP53-/- cells. Data are shown as mean +s.d. of n = 5 independent experiments after normalization to GAPDH. Statistical analysis using ANOVA and Tukey’s post-hoc test with ***p<0.001, ns, not significant. (D) TP53 mRNA expression measured by RT-qPCR with a primer pair located in the CDS in the indicated samples derived from HCT116 cells. Data are shown as mean +s.d. of n = 5 independent experiments after normalization to GAPDH. Statistical analysis using ANOVA and Tukey’s post-hoc test with ***p<0.001, ns, not significant. (E) Experimental setup to estimate TP53 mRNA half-life. Metabolic labeling with 4-thiouridine (4sU) was used to enrich newly transcribed mRNAs. The newly transcribed RNAs were thiol-alkylated and biotinylated, followed by Streptavidin pull-down. Their relative abundance was measured using RT-qPCR. (F) TP53 mRNA half-life obtained by 4sU labeling as described in (E) is shown for the indicated samples derived from HCT116 cells in the presence or absence of etoposide for 4 hr (Eto, 20 µM). Shown is mean + s.d. from n = 3 independent experiments. Statistical analysis using ANOVA and Tukey’s post-hoc test with *p<0.05, **p<0.01, ns, not significant.
Figure 1—figure supplement 1

Generation and characterization of TP53 dUTR human cell lines.
(A) Sequence alignment of TP53 alleles spanning the deletion sites in WT and dUTR HEK293 and HCT116 cell clones analyzed in this study. Binding sites of gRNAs used to generate the deletion are underlined in the WT reference sequence and predicted cutting sites are marked by a scissor symbol. gRNA dUTR2.2 harboring a specific point mutation relative to the WT allele was used to create homozygous dUTR HCT116 cell lines during a second round of transfection. (B) TP53 mRNA expression was measured by RT-qPCR with a primer pair located in the CDS in the indicated samples derived from HEK293 cells. Shown is mean +s.d. of n = 7 independent experiments after normalization to GAPDH. Statistical analysis using ANOVA and Tukey’s post-hoc test with ***p<0.001; ns, not significant. (C) Immunoblot showing p53 protein level in HEK293 cells, grown under steady-state conditions. (D) Quantification of immunoblot data for steady-state p53 protein level in cells derived from HEK293. Shown is mean +s.d. of n = 4 independent experiments after normalization to Actin and the WT parental cell line. Statistical analysis using ANOVA and Tukey’s post-hoc test with ***p<0.001; ns, not significant.
Figure 2 with 1 supplement
Deletion of the endogenous TP53 3′UTR does not alter p53 protein level in steady state or after genotoxic stress.
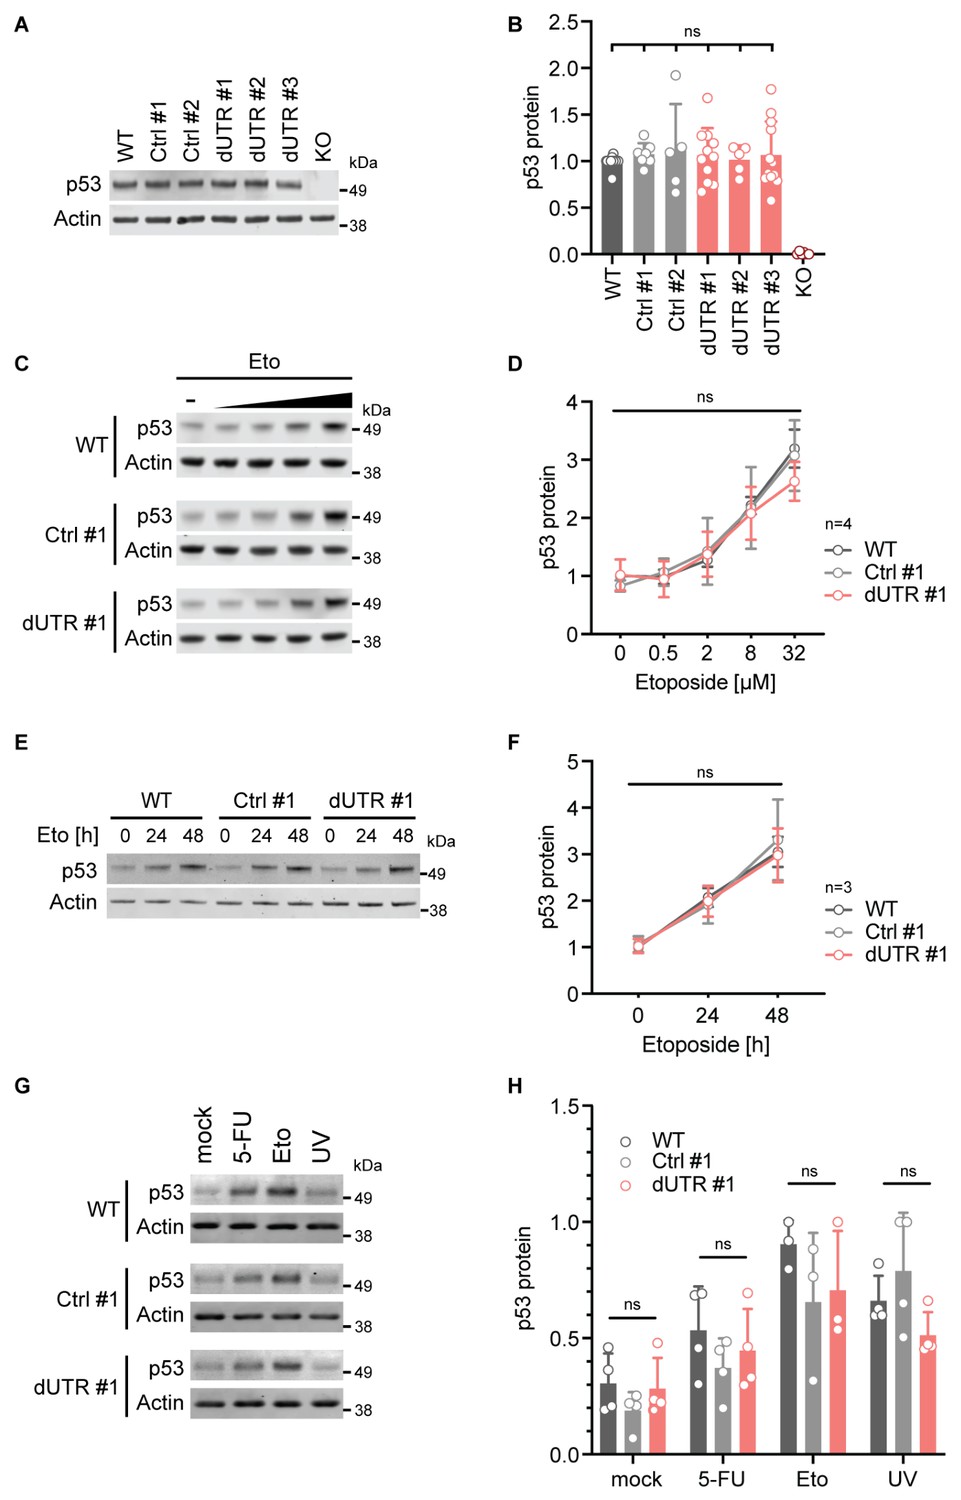
(A) Representative immunoblot showing steady-state p53 protein expression in the indicated samples derived from HCT116 cells. Actin serves as loading control. See Figure 2—figure supplement 1 for additional information on p53 isoform expression. (B) Quantification of immunoblot data for steady-state p53 protein level. p53 expression data were normalized to Actin and the WT parental cell line. For each sample at least five biological replicates were measured. Statistical analysis using ANOVA. ns, not significant. (C) Representative immunoblots showing p53 protein levels after 4 hr of etoposide (Eto) treatment (0–32 µM) in WT, Ctrl clone #1, and dUTR clone #1 derived from HCT116 cells. Actin serves as loading control. (D) As in (C). Quantification of p53 protein expression from n = 4 independent experiments is shown as mean + s.d. Statistical analysis of cell line effect using ANOVA. ns, not significant. See Figure 2—source data 1 for raw data. (E) Representative immunoblot of samples from WT parental, Ctrl clone #1, and dUTR clone #1 derived from HCT116 cells that were treated with 0.5 µM Eto for 0, 24, or 48 hr (h). Actin serves as loading control. (F) As in (E). Quantification of p53 protein expression from n = 3 biological replicates is shown as mean +s.d. Statistical analysis of cell line effect using ANOVA. ns, not significant. See Figure 2—source data 1 for raw data. (G) As in (C), but cells were treated with 20 µM etoposide (Eto), 40 µM 5-fluorouridine (5-FU), or 50 J/m2 UV. Actin serves as loading control. (H) As in (G). Quantification of p53 protein expression after drug treatment. For each drug at least three biological replicates were measured. Shown is mean + s.d. Statistical analysis using ANOVA. ns, not significant.
-
Figure 2—source data 1
Raw values for Figure 2D, F.
- https://cdn.elifesciences.org/articles/65700/elife-65700-fig2-data1-v2.xlsx
Figure 2—figure supplement 1
Analysis of p53 protein isoform expression in TP53 dUTR HCT116 cells.
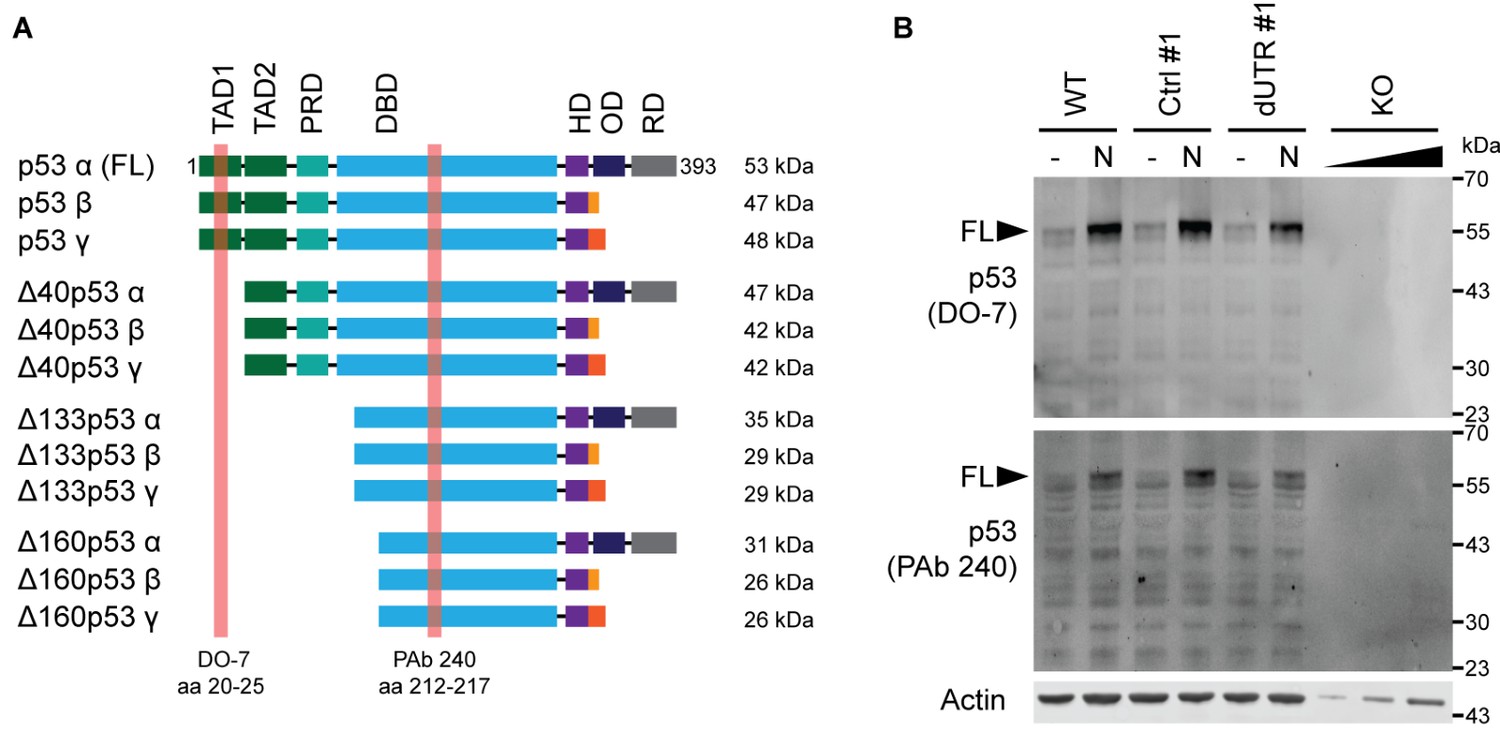
(A) Domain architecture of full-length (FL) p53 and all described alternative p53 protein isoforms. The respective binding epitopes of two antibodies used for isoform expression analysis, shown in (B) are highlighted in red. TAD, transactivation domain; PRD, proline-rich domain; DBD, DNA-binding domain; HR, hinge region; OD, oligomerization domain; RD, regulatory domain. The figure was adapted from Figure 3 from Joruiz and Bourdon, 2016. (B) Western blot analysis of p53 isoform expression pattern in HCT116 cell lines using two different monoclonal p53 antibodies. Increased expression of FL p53 protein was observed in samples treated with 20 µM Nutlin-3 (N) for 4 hr.
Figure 3
The endogenous TP53 3′UTR does not impact p53 protein synthesis and turnover.
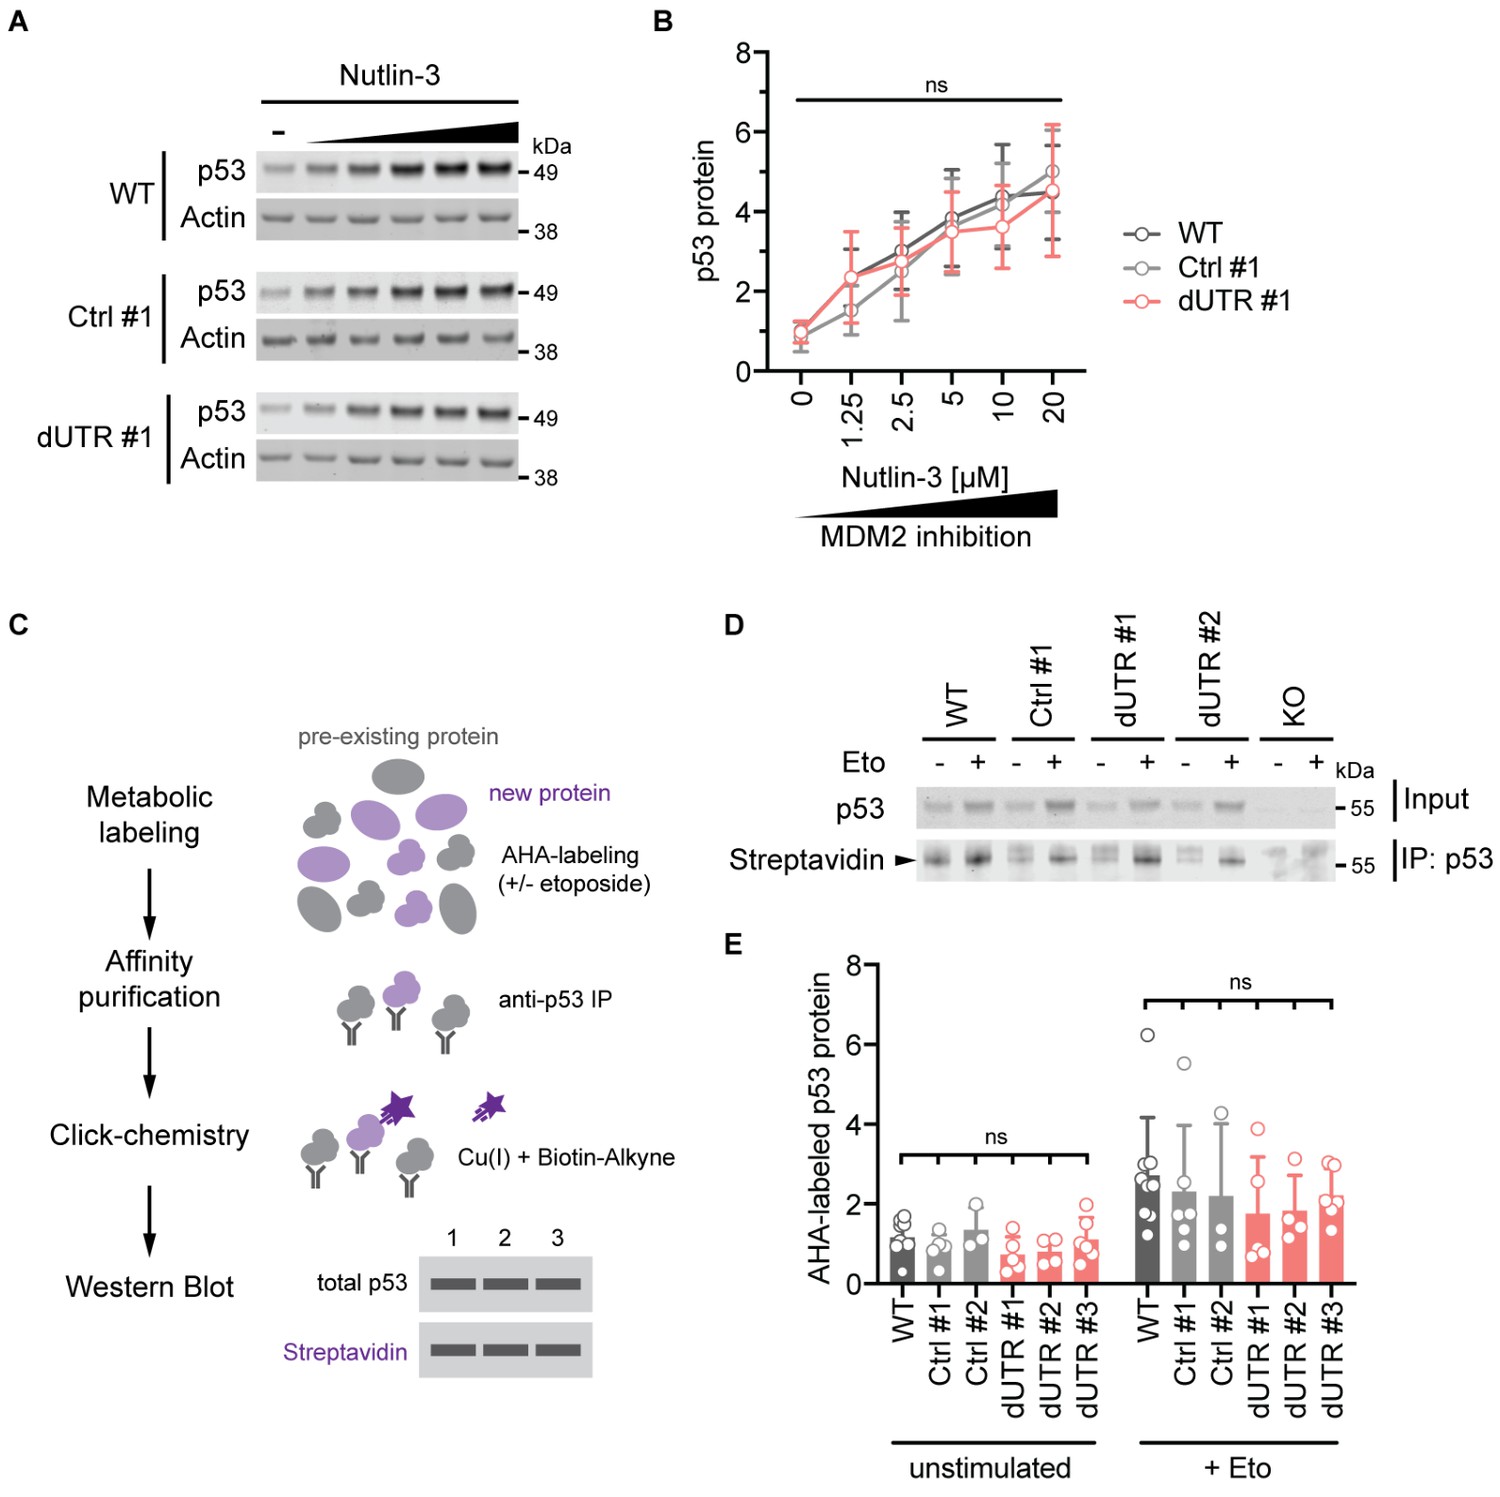
(A) Immunoblot showing p53 protein levels after 4 hr of Nutlin-3 treatment (0–20 µM) in WT, Ctrl clone #1, and dUTR clone #1 derived from HCT116 cells. Actin serves as loading control. (B) As in (A). Quantification of p53 protein expression from n = 4 biological replicates is shown as mean +s.d. Statistical analysis of cell line effect using ANOVA. ns, not significant. See Figure 3—source data 1 for raw data. (C) Experimental setup to analyze p53 protein synthesis by metabolic labeling of proteins using the methionine analog azidohomoalanine (AHA) in the presence or absence of 20 µM etoposide. (D) Representative immunoblot for p53 synthesis assessed by metabolic labeling as shown in (C). The black triangle indicates the signal specific to p53 protein. (E) As in (D). Quantification of newly synthesized p53 protein using AHA-labeling for 2 hr. At least three biological replicates were measured in the presence or absence of 20 µM etoposide. Shown is mean +s.d. Statistical analysis using ANOVA. ns, not significant.
-
Figure 3—source data 1
Raw values for Figure 3B.
- https://cdn.elifesciences.org/articles/65700/elife-65700-fig3-data1-v2.xlsx
Figure 4 with 1 supplement
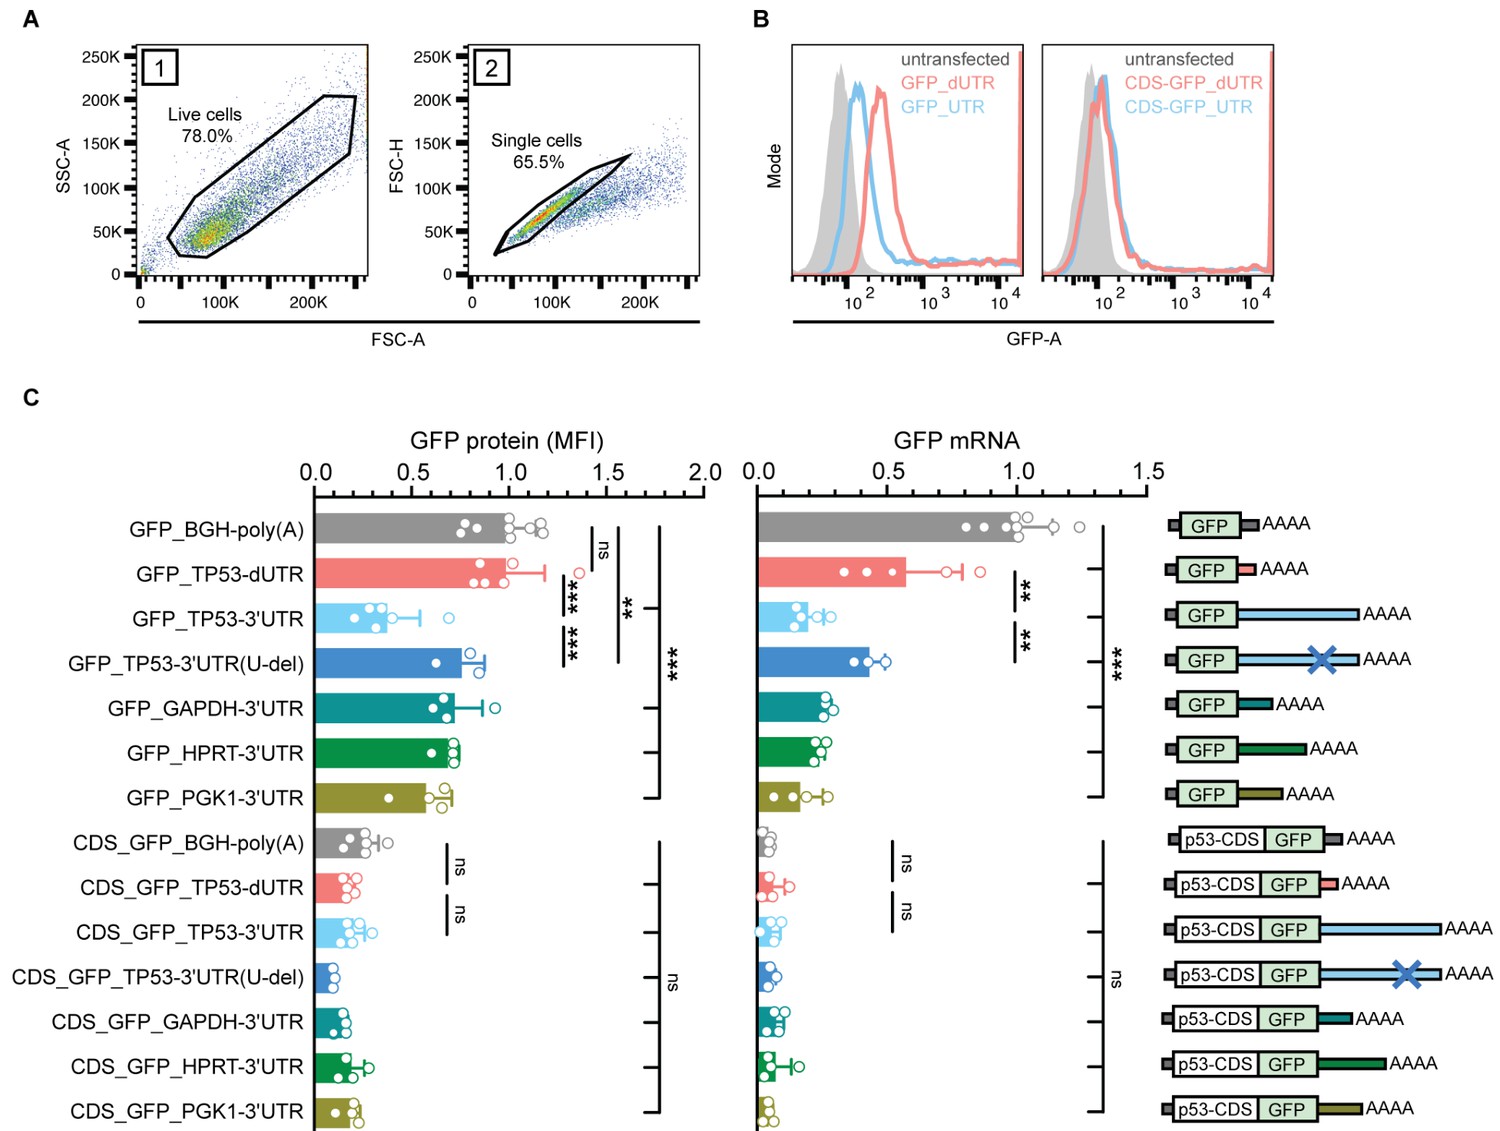
The p53 coding region has a dominant repressive effect on the expression of a reporter gene that overrides the contribution of the 3′UTR.
(A) FACS gating strategy to measure GFP protein expression in TP53-/- HCT116 cells. Live cells and single cells were used for downstream analysis. (B) Histogram plots from a representative FACS experiment. The gray area represents the untransfected, GFP-negative control population. Shown is GFP fluorescence intensity. (C) GFP protein levels were measured as mean fluorescence intensity (MFI) by FACS and GFP mRNA levels were measured by RT-qPCR using GAPDH as housekeeping gene in TP53-/- HCT116 cells. Shown is mean + s.d. of at least n = 3 independent experiments. CDS, coding sequence. Statistical analysis using ANOVA and Tukey’s post-hoc test with *p<0.05, **p<0.01, ***p<0.0001; ns, not significant. See Figure 4—figure supplement 1 for additional information.
Figure 4—figure supplement 1
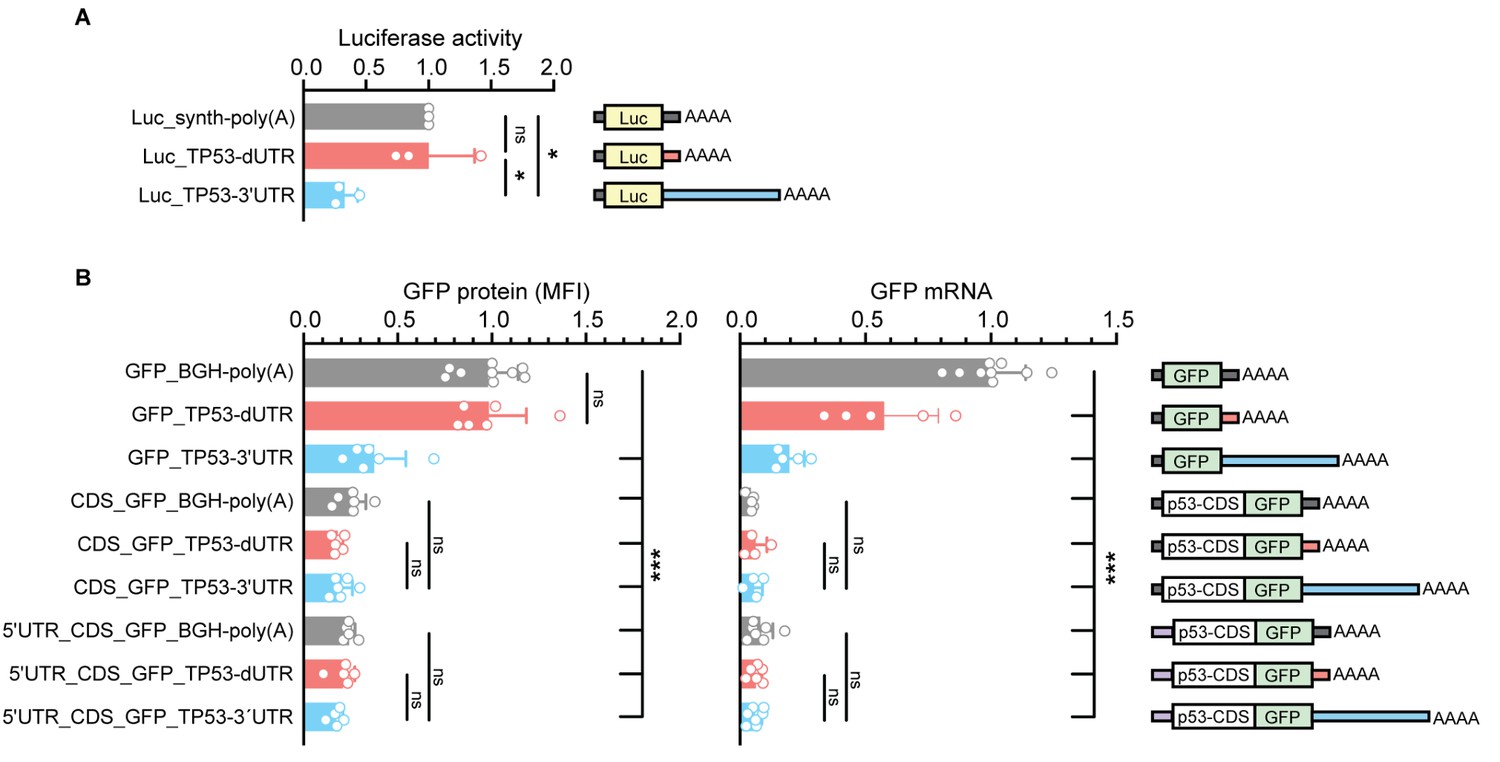
Validation of repressive effects of the TP53 3′UTR in luciferase reporter assays.
(A) Renilla luciferase activity after expression of the indicated constructs containing either the human dUTR fragment or full-length 3′UTR in TP53-/- HCT116 cells. Shown is mean + s.d. of n = 3 independent experiments after normalization to firefly luciferase. (B) As in Figure 4C, but shown are additional constructs. GFP protein levels were quantified by FACS and GFP mRNA levels were measured by RT-qPCR using GAPDH as housekeeping gene in TP53-/- HCT116 cells. Shown is mean + s.d. of at least n = 4 independent experiments. CDS, coding sequence. Statistical analysis using ANOVA and Tukey’s post-hoc test with *p<0.05, **p<0.01, ***p<0.0001; ns, not significant.
Figure 5 with 2 supplements
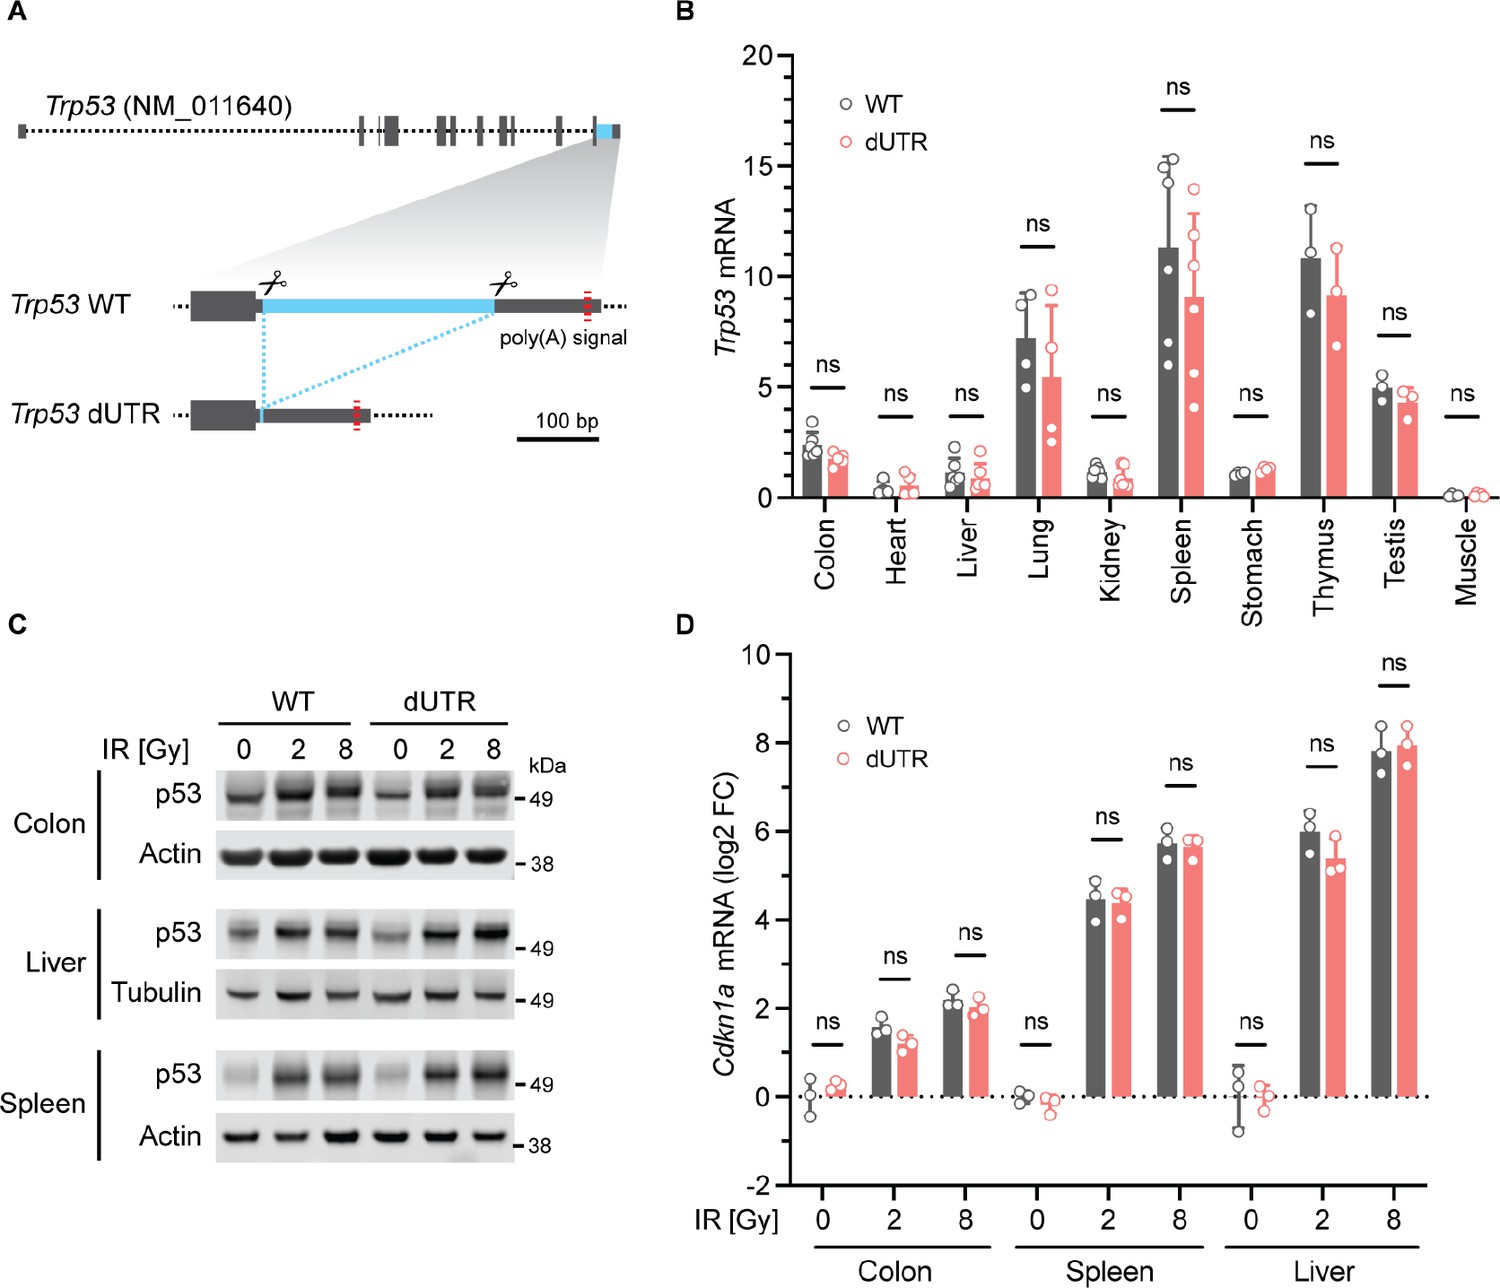
Knockout of the Trp53 3′UTR does not induce aberrant p53 expression in a mouse model.
(A) Schematic of the murine Trp53 gene. The sequence deleted in dUTR cells is shown in blue. (B), Trp53 mRNA in tissues from WT and dUTR mice was normalized to Gapdh. Shown is mean + s.d. from n = 3 independent experiments. Statistical analysis using ANOVA. ns, not significant. CRISPR/Cas9-mediated deletions at the nucleotide level are shown in Figure 5—figure supplement 1C. (C) Representative immunoblots of p53 protein from tissues obtained 4 hr after total body irradiation. Gy, Gray. Tubulin or Actin serve as loading controls. Quantification of p53 protein expression values obtained from n = 3 mice is shown in Figure 5—figure supplement 2. (D) Cdkn1a mRNA expression of samples from (C) was normalized to Gapdh. Shown is mean + s.d. from three mice. Statistical analysis using ANOVA. ns, not significant.
Figure 5—figure supplement 1
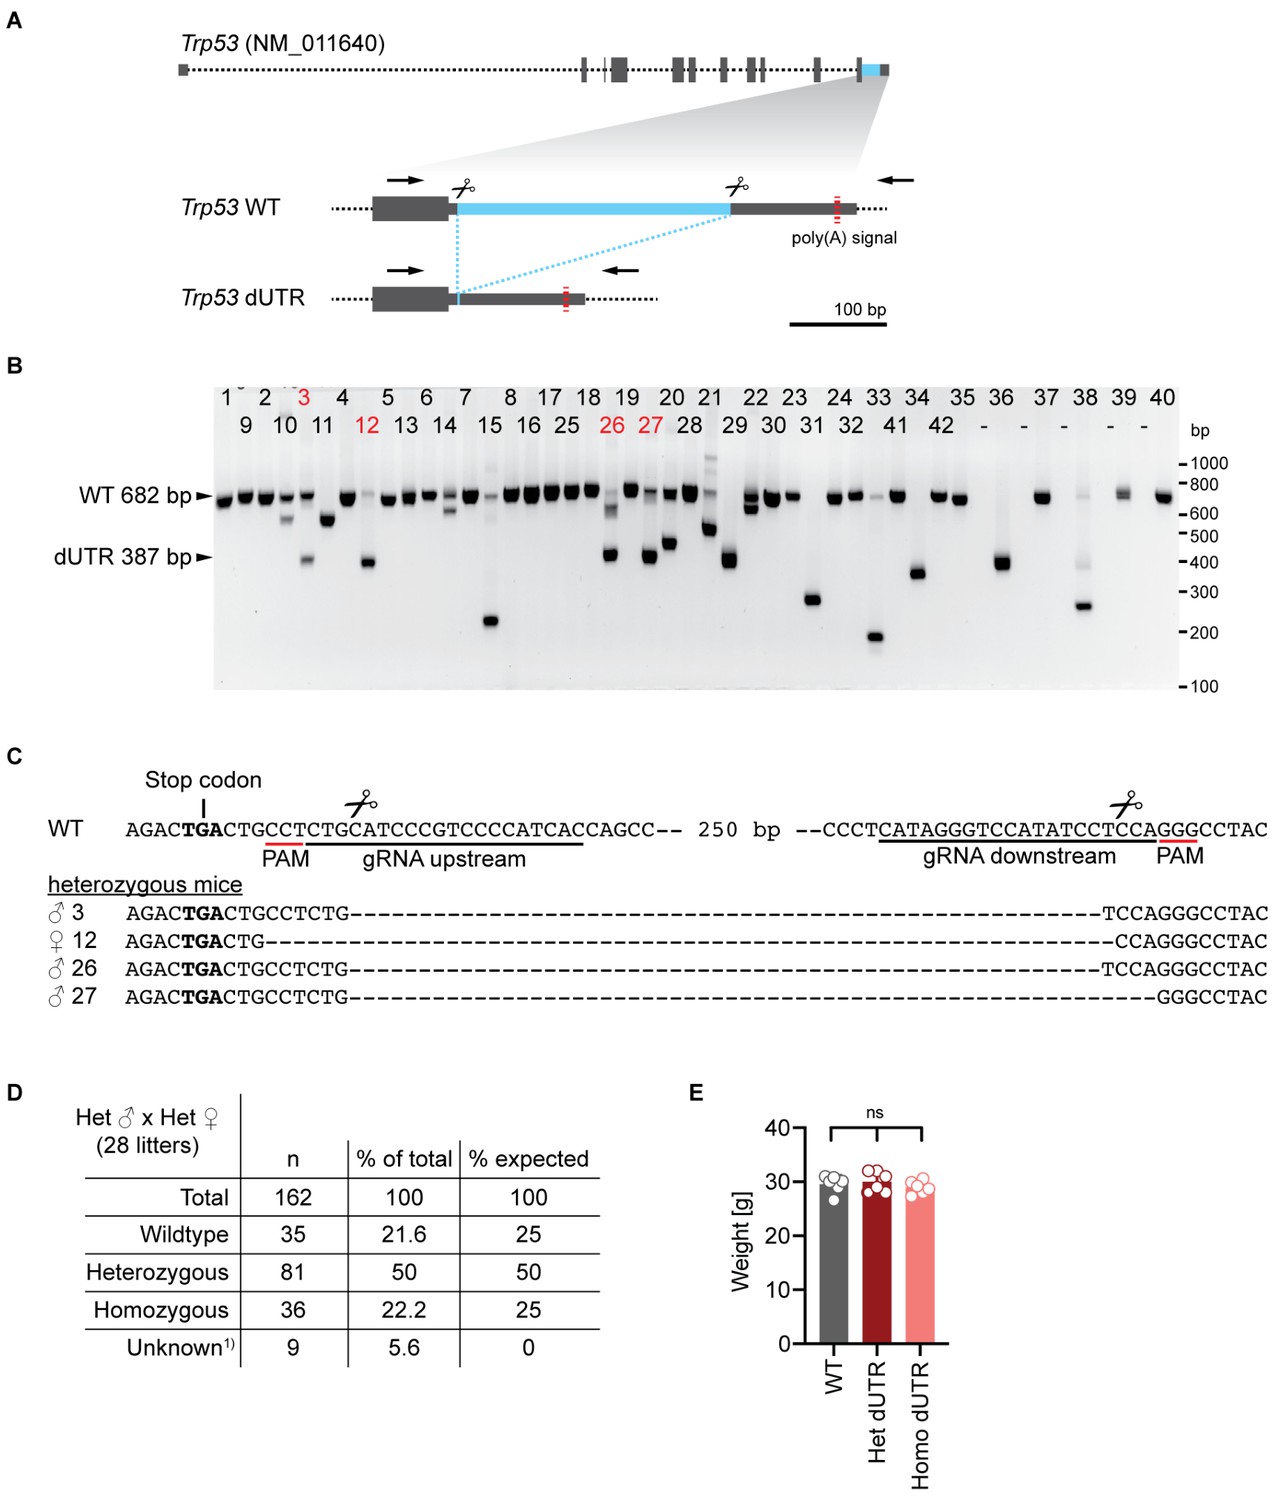
Generation and characterization of Trp53 dUTR mice.
(A) Schematic of the mouse Trp53 gene. The sequence deleted in dUTR cells is shown in blue and binding sites of primers used for PCR screening are marked with arrows. (B) Screening-PCR of mice that were born after zygotic injection of CRISPR/Cas9 RNPs targeting the Trp53 3′UTR. The predicted lengths of the PCR products from WT and dUTR alleles are indicated. Mice that were selected for validation by sequencing are labeled in red. (C) Sequence alignments of Trp53 dUTR alleles of founder select mice shown in (B). Male mice #3 and #26 harboring identical DNA deletions were used to establish a mouse colony. Primer sequences used for screening can be found in Supplementary file 1. (D) Genotypes of pups from 28 Trp53 dUTR heterozygous intercrosses. Unknown refers to mice that died before weening. (E) Weights of mice at 10–11 weeks of age are shown for WT, Trp53 dUTR heterozygous and homozygous males. Data are shown as mean +s.d. with n = 6 in each group. Statistical analysis using ANOVA. ns, not significant.
Figure 5—figure supplement 2
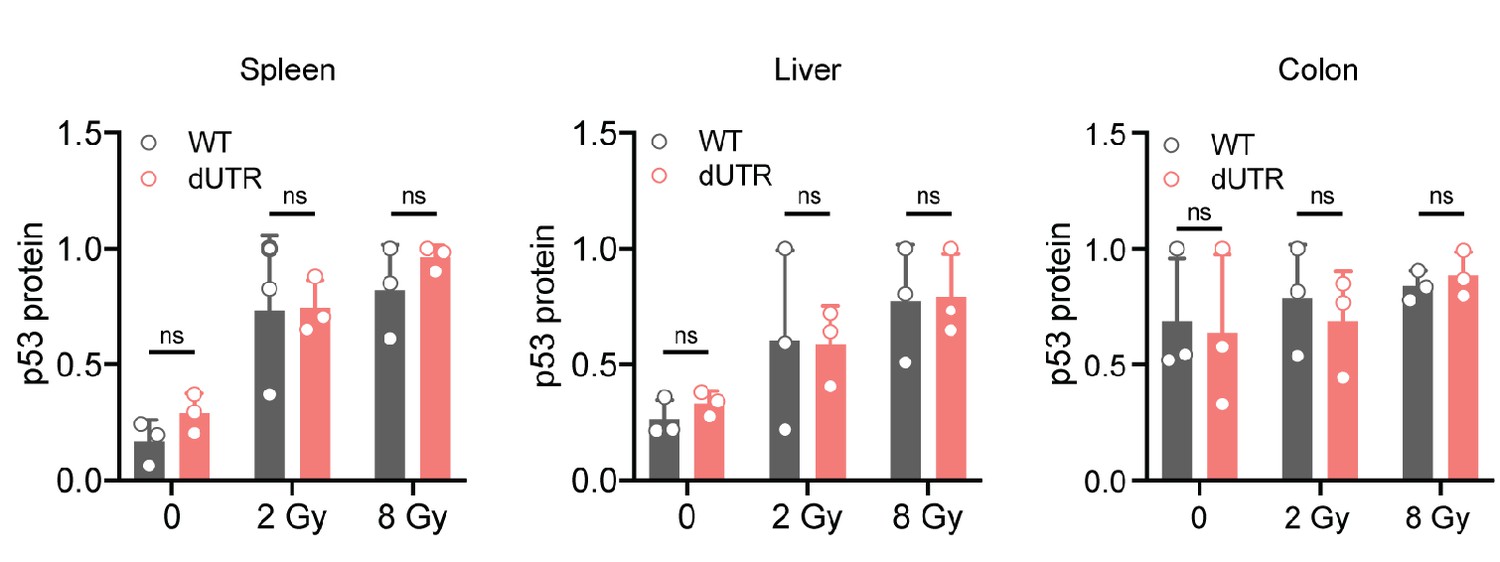
p53 protein expression in tissues of WT and Trp53 dUTR mice after whole body irradiation.
Quantification p53 protein expression levels from immunoblot data in the indicated tissues. Tissue samples were analyzed 4 hr after total body irradiation as shown in Figure 5C. p53 expression levels were normalized to Actin or Tubulin, respectively and normalized to the maximum value within each data set. Data are shown as mean +s.d. from three mice. Gy, Gray. Statistical analysis using ANOVA. ns, not significant.
Author response image 1
mRNA cleavage and polyadenylation requires multiple sequence elements surrounding the cleavage site.
A, Schematic of the multiprotein complex responsible for mRNA cleavage and polyadenylation in humans. B, Sequence context of functional poly(A) sites showing the poly(A) signal hexamer as well as two common auxiliary motifs. The metaplot is aligned to the transcript end in the longest isoform of RefSeq-annotated human genes. C-E, Metagene analysis shows densities of the binding sites of protein components of the cleavage and polyadenylation machinery determined by CLIP: C, Cleavage Factor I complex D, Cleavage and Polyadenylation Specificity Factor complex and E, Cleavage Stimulation Factor complex. Binding sites were retrieved from the POSTAR2 database and aligned to RefSeq (Y. Zhu et al., 2019).
Author response image 2
Tables
Table 1
Previously reported evidence of miRNAs, lncRNAs, and RNA-binding proteins that target the TP53 3′UTR.
| Interactors of the human TP53 mRNA mapping to the last exon | ||||||
|---|---|---|---|---|---|---|
| Name | Type | Binding region (NM_000546.6) | Affected in dUTR allele? | Experiments | References (PMID) | Average PhyloP score |
| miR-1228–3 p | miRNA | 1422–1428 | yes | LRA, RT-qPCR, IHC, WB | 25422913 | 1.003 |
| miR-125a-5p | miRNA | 2044–2063 | yes | LRA, NB, RT-qPCR, WB | 19818772 | −0.120 |
| miR-125b-5p | miRNA | 2043–2064 | yes | LRA, ISH, RT-qPCR, WB | 19293287, 21935352, 27592685 | −0.105 |
| miR-1285–3 p | miRNA | 2113–2134 | yes | LRA, RT-qPCR, WB | 20417621 | −0.061 |
| miR-150–5 p | miRNA | 1568–1580 | yes | LRA, WB | 23747308 | −0.323 |
| miR-151a-5p | miRNA | 2304–2325 | yes | LRA, ChIP-seq, RT-qPCR, WB | 27191259 | −0.053 |
| miR-200a-3p | miRNA | 2269–2291 | yes | LRA, WB | 23144891 | −0.039 |
| miR-24–3 p | miRNA | 2352–2374 | yes | LRA, IHC, RT-qPCR, WB | 27780140 | 0.018 |
| miR-25–3 p | miRNA | 1401–1423 | yes | LRA, RT-qPCR, WB | 20935678 | 0.438 |
| miR-30d-5p | miRNA | 1596–1618 | yes | LRA, RT-qPCR, WB | 20935678 | −0.432 |
| miR-375 | miRNA | 1462–1483 | yes | LRA, Flow, RT-qPCR, WB, IF | 23835407 | −0.595 |
| miR-663a | miRNA | 1260–1281 | no (in CDS) | LRA | 27105517 | 1.520 |
| miR-504 | miRNA | 2059–2066, 2387–2395 | yes, no | LRA, RT-qPCR, WB | 20542001 | 0.130 0.203 |
| miR-92 | miRNA | 1417–1422 | yes | LRA, WB | 21112562 | 0.102 |
| miR-141 | miRNA | 2285–2290 | yes | LRA, WB | 21112562 | −0.031 |
| miR-638 | miRNA | 1381–1404 | yes | LRA, WB, IP | 25088422 | 0.313 |
| miR-3151 | miRNA | 1337–1354 | yes | LRA, WB, RT-qPCR | 24736457 | −0.329 |
| miR-33 | miRNA | 1957–1980 | yes | LRA, WB | 20703086 | 0.138 |
| miR-380–5 p | miRNA | 1909–1936, 1943–1974 | yes, yes | LRA, WB | 20871609 | 0.121 0.089 |
| miR-19b | miRNA | 1712–1734 | yes | LRA, WB | 24742936 | 0.402 |
| miR-15a | miRNA | 2394–2414 | no | LRA, WB | 21205967 | 0.045 |
| miR-16 | miRNA | 2394–2415 | no | LRA, WB | 21205967 | 0.015 |
| miR-584 | miRNA | 1263–1284 | no (in CDS) | LRA, WB, IP | 25088422 | 1.646 |
| WIG1 | RBP | 2064–2106 | yes | LRA, IP, RT-qPCR | 19805223 | −0.071 |
| PARN | RBP | 2071–2102 | yes | LRA, EMSA, IP, RT-qPCR | 23401530 | −0.097 |
| CPEB1 | RBP | 2458–2500 | no | IP, RT-PCR | 19141477 | 1.654 |
| RBM38 (RNPC1) | RBP | 2064–2106 | yes | EMSA, IP, RT-PCR, Polysome gradient | 21764855, 24142875, 25823026 | −0.071 |
| RBM24 | RBP | 2064–2106 | yes | LRA, EMSA, IP, RT-qPCR, | 29358667 | −0.071 |
| HUR | RBP | 2064–2106, 2393–2412, 2458–2505 | yes, yes, no | LRA, EMSA, WB, RT-qPCR | 12821781, 14517280, 16690610, 18680106 | −0.071 0.007 1.496 |
| 7SL | lncRNA | 2107–2149, 2194–2240, 2269–2301, 2307–2362 | yes, yes, yes, yes | LRA, IP, WB | 25123665 | −0.158 −0.110 0.015 −0.015 |
| miR-92a-3p | miRNA | 1646–1666 | yes | LRA, WB | 22451425 | −0.122 |
| TIA1 | RBP | 1426–1442 1702–1731 | yes, no | LRA, iCLIP | 28904350 | 0.066 0.715 |
| Hzf | RBP | 1345–1395 1529–1574 | yes, yes | LRA, EMSA, WB, IP, RT-qPCR, Polysome gradient | 21402775 | −0.450 0.156 |
-
LRA: luciferase reporter assay; WB: western blot; IP: co-immunoprecipitation assay; RT-qPCR: quantitative reverse transcription PCR; NB: northern blot; IHC: immunohistochemistry; ISH: In situ hybridization; EMSA: electromobility shift assay.
Key resources table
| Reagent type (species) or resource | Designation | Source or reference | Identifiers | Additional information |
|---|---|---|---|---|
| Strain, strain background (Mus musculus) | C57Bl/6J | Jackson Laboratory | #000664 RRID:IMSR_JAX:000664 | used to generate TP53 dUTR mouse strain |
| Strain, strain background (Mus musculus) | Trp53 dUTR | This paper | C57Bl/6J background, see Materials and methods Supplementary file 1 | |
| Cell line (Homo sapiens) | FLP In T-REx 293 | From Dr. Thomas Tuschl (Rockefeller University) | RRID:CVCL_U427 | |
| Cell line (Homo sapiens) | FLP In T-REx 293 TP53 dUTR | This paper | see Materials and methods Supplementary file 1 | |
| Cell line (Homo sapiens) | FLP In T-REx 293 TP53-/- | This paper | see Materials and methods Supplementary file 1 | |
| Cell line (Homo sapiens) | HCT116 | ATCC | ATCC CCL-247 RRID:CVCL_0291 | |
| Cell line (Homo sapiens) | HCT116 Ctrl (two clones) | This paper | see Materials and methods Supplementary file 1 | |
| Cell line (Homo sapiens) | HCT116 TP53 dUTR (three clones) | This paper | see Materials and methods Supplementary file 1 | |
| Cell line (Homo sapiens) | HCT116 TP53-/- | This paper | see Materials and methods Supplementary file 1 | |
| Peptide, recombinant protein | Cas9 protein with NLS | PNA Bio | CP01-20 | |
| Sequence-based reagent | Costum Alt-R CRISPR Cas9 crRNA (Trp53_gRNA upstream) | IDT | GTGATGGGGACGGGATGCAG | used for CRISPR RNP formation |
| Sequence-based reagent | Costum Alt-R CRISPR Cas9crRNA (Trp53_gRNA downstream) | IDT | CATAGGGTCCATATC CTCCA | used for CRISPR RNP formation |
| Sequence-based reagent | Alt-R CRISPR-Cas9 tracrRNA | IDT | 1072532 | |
| Antibody | Anti-p53 clone DO-7 (mouse monoclonal) | Santa Cruz | sc-47698 RRID:AB_628083 | (1:250) |
| Antibody | Anti-p53 clone PAb240 (mouse monoclonal) | Santa Cruz | sc-99 RRID:AB_628086 | (1:250) |
| Antibody | Anti-p53 clone 1C12 (mouse monoclonal) | Cell Signaling | #2524 RRID:AB_331743 | (1:500) |
| Antibody | Anti-Actin (rabbit polyclonal) | Sigma | A2066 RRID:AB_476693 | (1:1,000) |
| Antibody | Anti-Tubulin (mouse monoclonal) | Sigma | T9026 RRID:AB_477593 | (1:1,000) |
| Antibody | IRDye 800CW anti-Mouse (goat polyclonal) | LI-COR | 926–32210 RRID:AB_621842 | (1:10,000) |
| Antibody | IRDye 680RD anti-Rabbit (goat polyclonal) | LI-COR | 926–68071 RRID:AB_10956166 | (1:10,000) |
| Transfected construct (synthetic) | pX330-U6-Chimeric_BB-CBh-hSpCas9 | Addgene | RRID:Addgene_42230 | |
| Transfected construct (Homo sapiens) | pX330-gRNA dUTR1 | This paper | see Materials and methods Supplementary file 1 | |
| Transfected construct (Homo sapiens) | pX330-gRNA dUTR2.1 | This paper | see Materials and methods Supplementary file 1 | |
| Transfected construct (Homo sapiens) | pX330-gRNA dUTR2.2 | This paper | see Materials and methods Supplementary file 1 | |
| Transfected construct (synthetic) | pCDNA3-puro eGFP | PMID:30449617 | ||
| Transfected construct (Homo sapiens) | pCDNA3-puro p53(CDS)-eGFP | This paper | see Materials and methods Supplementary file 1 | |
| Transfected construct (Homo sapiens) | pCDNA3-puro eGFP_TP53-3UTR | This paper | see Materials and methods Supplementary file 1 | |
| Transfected construct (Homo sapiens) | pCDNA3-puro p53(CDS)-eGFP_TP53-3UTR | This paper | see Materials and methods Supplementary file 1 | |
| Transfected construct (Homo sapiens) | pCDNA3-puro eGFP_dUTR | This paper | see Materials and methods Supplementary file 1 | |
| Transfected construct (Homo sapiens) | pCDNA3-puro p53(CDS)-eGFP_dUTR | This paper | see Materials and methods Supplementary file 1 | |
| Transfected construct (Homo sapiens) | pCDNA3-puro eGFP_TP53-3UTR(U-del) | This paper | see Materials and methods Supplementary file 1 | |
| Transfected construct (Homo sapiens) | pCDNA3-puro p53(CDS)-eGFP_TP53-3UTR(U-del) | This paper | see Materials and methods Supplementary file 1 | |
| Transfected construct (Homo sapiens) | pCDNA3-puro eGFP_GAPDH-3UTR | This paper | see Materials and methods Supplementary file 1 | |
| Transfected construct (Homo sapiens) | pCDNA3-puro p53(CDS)-eGFP_GAPDH-3UTR | This paper | see Materials and methods Supplementary file 1 | |
| Transfected construct (Homo sapiens) | pCDNA3-puro eGFP_HPRT-3UTR | This paper | see Materials and methods Supplementary file 1 | |
| Transfected construct (Homo sapiens) | pCDNA3-puro p53(CDS)-eGFP_HPRT-3UTR | This paper | see Materials and methods Supplementary file 1 | |
| Transfected construct (Homo sapiens) | pCDNA3-puro eGFP_PGK1-3UTR | This paper | see Materials and methods Supplementary file 1 | |
| Transfected construct (Homo sapiens) | pCDNA3-puro p53(CDS)-eGFP_PGK1-3UTR | This paper | see Materials and methods Supplementary file 1 | |
| Transfected construct (Homo sapiens) | pCDNA3-puro 5UTR_p53(CDS)-eGFP | This paper | see Materials and methods Supplementary file 1 | |
| Transfected construct (Homo sapiens) | pCDNA3-puro 5UTR_p53(CDS)-eGFP_dUTR | This paper | see Materials and methods Supplementary file 1 | |
| Transfected construct (Homo sapiens) | pCDNA3-puro 5UTR_p53(CDS)-eGFP_TP53-3UTR | This paper | see Materials and methods Supplementary file 1 | |
| Transfected construct (synthetic) | psiCHECK-2 | Promega | C8021 | |
| Transfected construct (Homo sapiens) | psiCHECK-2_TP53-3UTR | This paper | see Materials and methods Supplementary file 1 | |
| Transfected construct (Homo sapiens) | psiCHECK-2_dUTR | This paper | see Materials and methods Supplementary file 1 | |
| Chemical compound, drug | IRDye 680LT Streptavidin | LI-COR | 926–68031 | (1:2,000) |
| Chemical compound, drug | Nutlin-3 | Seleckchem | S1061 | |
| Chemical compound, drug | Etoposide | Sigma | 341205–25 MG | |
| Chemical compound, drug | 5-Fluorouracil | Sigma | F6627 | |
| Chemical compound, drug | MTSEA-biotin-XX | Biotium | 900661 | |
| Chemical compound, drug | Biotin Alkyne (PEG4 carboxamide-Propargyl Biotin) | This paper | B10185 | |
| Chemical compound, drug | 4-Thiouridine | MP Biomedicals | MP215213425 | |
| Chemical compound, drug | Yeast tRNA | Invitrogen | 15401029 | |
| Chemical compound, drug | dCTP [α−32P] | Perkin Elmer | NEG013H100UC | |
| Commercial assay or kit | Click-iT Protein Reaction Buffer Kit | Invitrogen | C10276 | |
| Commercial assay or kit | Click-iT AHA (L-Azidohomoalanine) | Invitrogen | C10102 | |
| Commercial assay or kit | SuperScript IV Vilo Master Mix | Invitrogen | 11756050 | |
| Commercial assay or kit | Dual-Glo Luciferase Assay System | Promega | E2940 | |
| Commercial assay or kit | Megaprime DNA labeling system, dCTP | Cytiva | RPN1606 | |
| Commercial assay or kit | Lipofectmaine LTX Reagent with PLUS Reagent | Invitrogen | A12621 | |
| Commercial assay or kit | Dynabeads Protein G for Immunoprecipitation | Invitrogen | 10004D | |
| Commercial assay or kit | Dynabeads MyOne Streptavidin C1 | Invitrogen | 65001 | |
| Commercial assay or kit | Oligotex mRNA mini Kit | Quiagen | 70022 | |
| Commercial assay or kit | ULTRAhyb Ultrasensistive Hybridization buffer | Invitrogen | AM8670 | |
| Commercial assay or kit | QuickExtract DNA Extraction Solution | Lucigen | QE09050 | |
| Commercial assay or kit | RNAlater-ICE Frozen Tissue Transition Solution | Invitrogen | AM7030 | |
| Commercial assay or kit | SuperScript IV VILO Master Mix with ezDNAse Enzyme | Invitrogen | 11766050 | |
| Commercial assay or kit | FastStart Universal SYBR Green Master (ROX) | Roche/Sigma | 4913850001 | |
| Software, algorithm | FlowJo (Version 10.5.3) | FlowJo, LLC | ||
| Software, algorithm | Prism 8 for OS X (Version 8.4.3) | Graph Pad Software, LLC | ||
| Software, algorithm | Image Studio (Version 5.2) | LI-COR Biosciences |
Additional files
-
Supplementary file 1
Primer sequences.
- https://cdn.elifesciences.org/articles/65700/elife-65700-supp1-v2.xlsx
-
Transparent reporting form
- https://cdn.elifesciences.org/articles/65700/elife-65700-transrepform-v2.pdf
Download links
A two-part list of links to download the article, or parts of the article, in various formats.
Downloads (link to download the article as PDF)
Open citations (links to open the citations from this article in various online reference manager services)
Cite this article (links to download the citations from this article in formats compatible with various reference manager tools)
Endogenous p53 expression in human and mouse is not regulated by its 3′UTR
eLife 10:e65700.
https://doi.org/10.7554/eLife.65700


