Insulin-producing β-cells regenerate ectopically from a mesodermal origin under the perturbation of hemato-endothelial specification
- Department of Cell and Molecular Biology, Karolinska Institutet, Sweden
- Department of Developmental Genetics, Max Planck Institute for Heart and Lung Research, Germany
- Department of Neuroscience, Karolinska Institutet, Sweden
- Dermatology and Venereology Division, Department of Medicine (Solna), Karolinska Institutet, Sweden
- Department of Cardiovascular and Metabolic Sciences, Lerner Research Institute, Cleveland Clinic, United States
- Cardio-Pulmonary Institute, Frankfurt, Germany; Medical Clinic I, (Cardiology/Angiology) and Campus Kerckhoff, Justus-Liebig-University Giessen, Germany
Figures
Figure 1 with 1 supplement
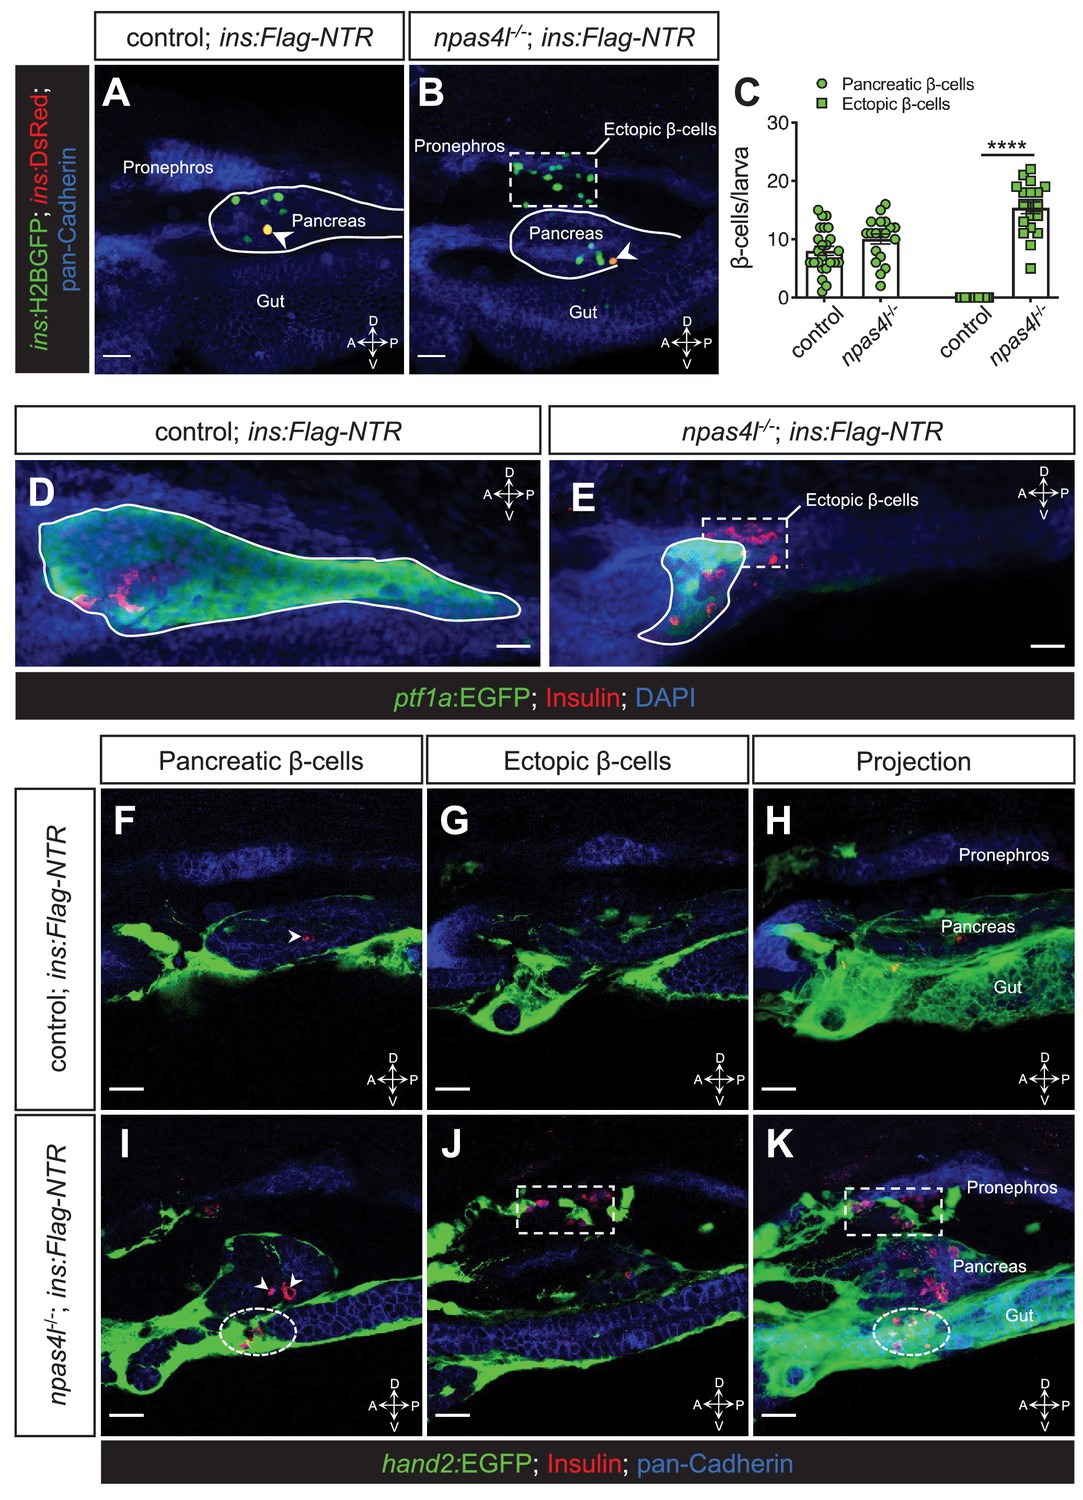
Ectopic β-cell formation in npas4l mutants.
(A, B) Representative confocal projections of the pancreas and neighbouring tissues of control siblings and npas4l−/− Tg(ins:Flag-NTR);Tg(ins:H2BGFP;ins:DsRed) zebrafish larvae at 3 dpf after β-cell ablation by MTZ at 1–2 dpf, displaying regenerated β-cells in green and older β-cells that likely survived the ablation in yellow overlap as the DsRed fluorescence driven by the insulin promoter remained in these cells, at the same time as DsRed had not had enough time to mature in the regenerated β-cells (arrowheads). The ectopic β-cells are indicated by white dashed rectangle. Pancreata are outlined by solid white lines. (C) Quantification of the pancreatic or ectopic β-cells per larva at 3 dpf. ****p<0.0001 (Šidák’s multiple comparisons test); n = 24 (control) and 19 (npas4l−/−). Quantification data are represented as the mean ± SEM. (D, E) Representative image projections of the pancreas and neighbouring tissues in control siblings and npas4l-/- Tg(ins:Flag-NTR);Tg(ptf1a:EGFP) larvae at 3 dpf after β-cell ablation by MTZ at 1–2 dpf, displaying β-cells in red with immunostaining for insulin and ptf1a:EGFP+ exocrine pancreas in green. Pancreata are outlined by solid white lines. Dashed line outlines ectopic β-cells in the mesenchyme (E). (F–K) Representative images and projections of the pancreas and neighbouring mesenchyme of control siblings and npas4l-/- Tg(ins:Flag-NTR);Tg(hand2:EGFP) zebrafish larvae at 3 dpf after β-cell ablation by MTZ at 1–2 dpf, displaying β-cells in red with immunostaining for insulin and hand2:EGFP+ mesenchyme in green. White arrowheads point to β-cells in the pancreas (F, I). Dashed rectangles indicate the ectopic β-cells intermingling with the mesenchyme between the pronephros and the pancreas, without co-expressing insulin and hand2:EGFP (J, K). Selected area in dashed ovals shows other ectopic β-cells intermingling with the mesenchyme ventral to the pancreas (I, K). Scale bars = 20 μm. Anatomical axes: D (dorsal), V (ventral), A (anterior), and P (posterior).
Figure 1—figure supplement 1
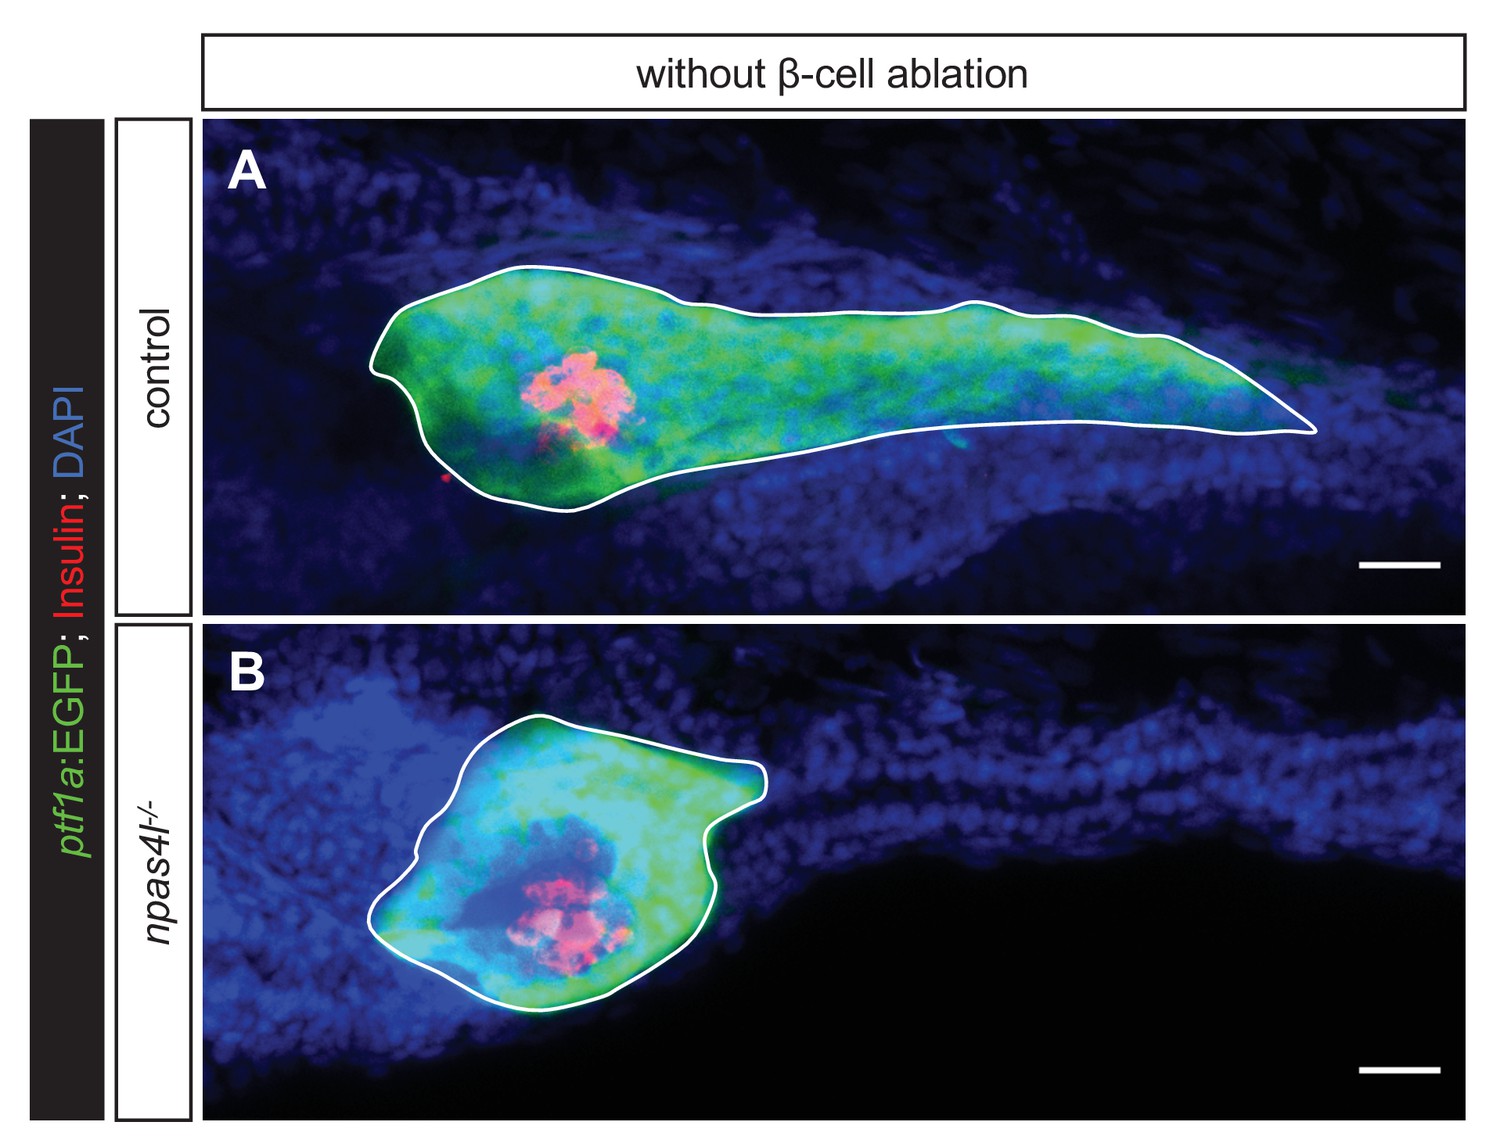
Mutation of npas4l suppresses the development of exocrine pancreas.
(A, B) Representative image projections of the pancreas in control siblings and npas4l−/− Tg(ptf1a:EGFP) larvae, without carrying the ins:Flag-NTR transgene, that is during regular development. These larvae were controls for the β-cell ablation, that is still treated with MTZ from 1 to 2 dpf (not leading to β-cell ablation due to the absence of ins:Flag-NTR). Insulin-expressing β-cells are displayed in red with immunostaining for insulin and ptf1a:EGFP+ exocrine pancreas in green. Pancreata are outlined by solid white lines. Scale bars = 20 μm.
Figure 2 with 1 supplement
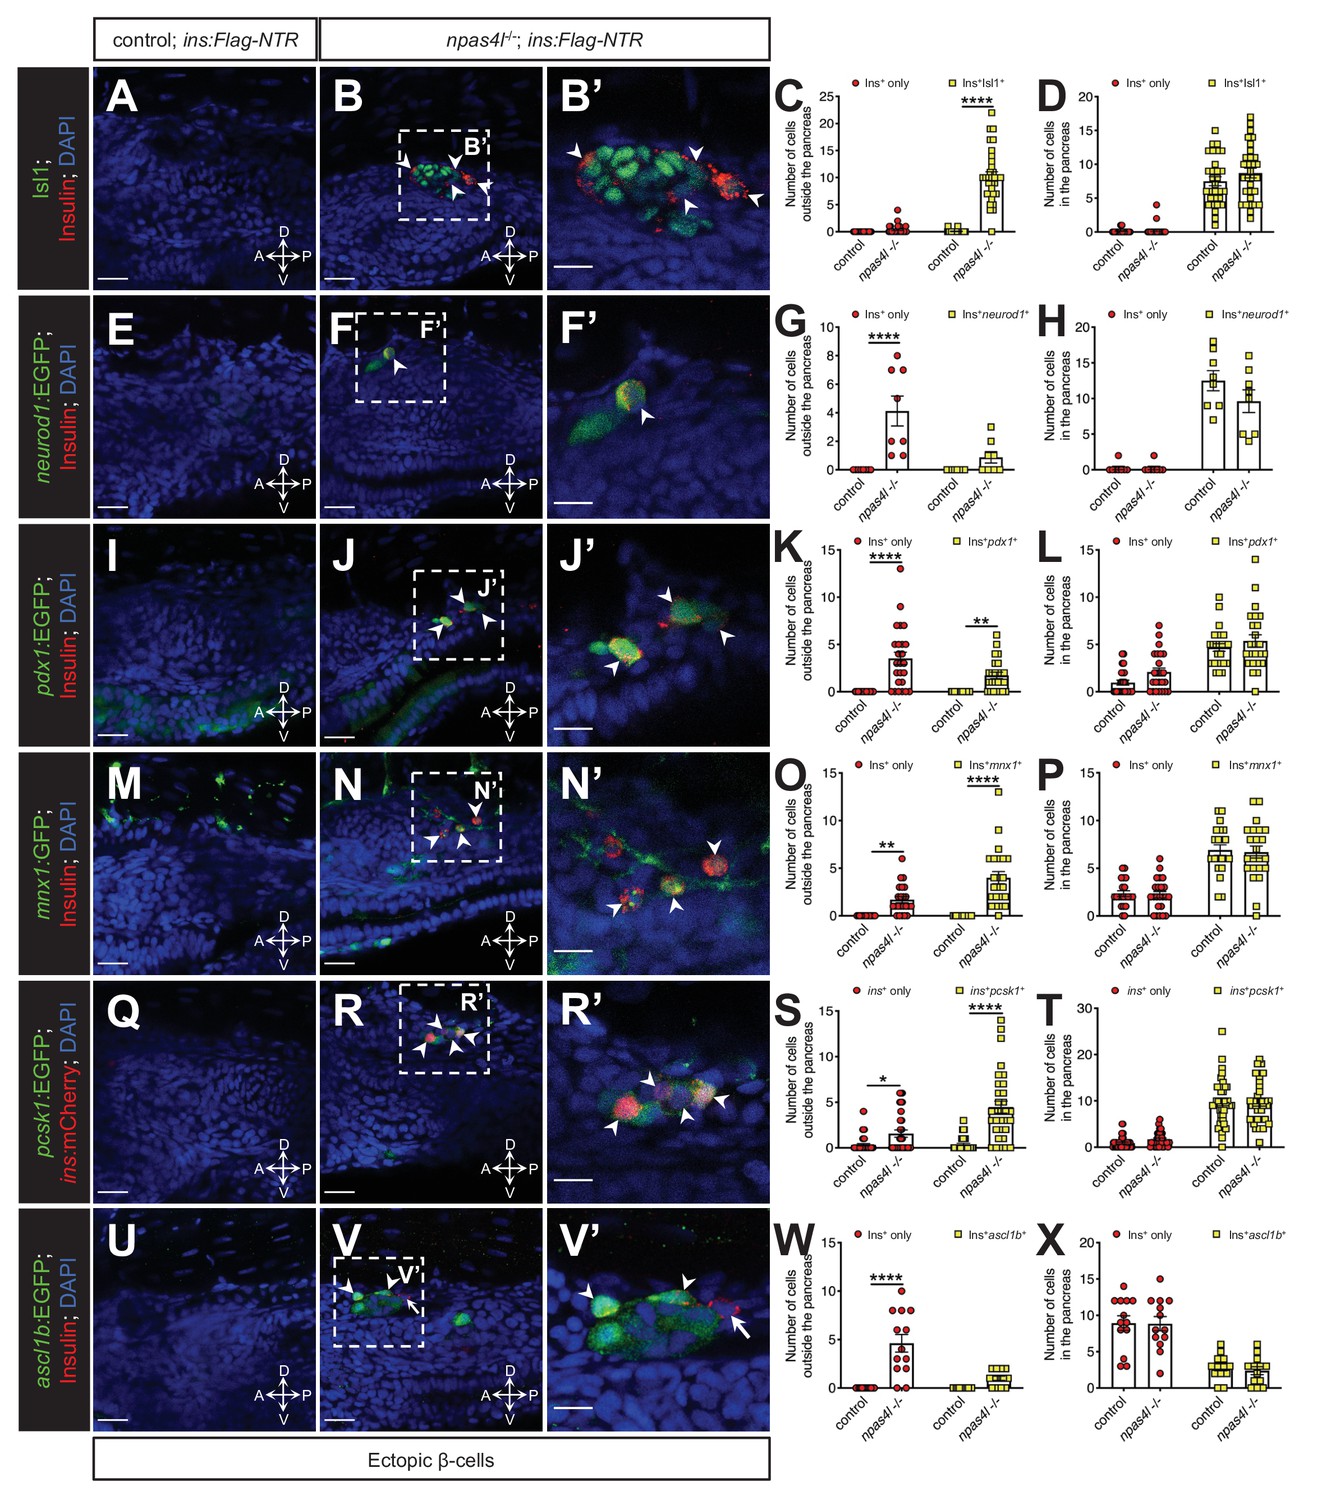
The ectopic β-cells co-express insulin and endocrine markers in npas4l mutants.
Representative confocal images of the tissues adjacent to the pancreas of control siblings and npas4l−/− Tg(ins:Flag-NTR) zebrafish larvae at 3 dpf after β-cell ablation by MTZ at 1–2 dpf, displaying cells expressing pancreatic endocrine cell markers Isl1 (A–B’), neurod1 (E–F’), pdx1 (I–J’), mnx1 (M–N’), pcsk1 (Q–R’), and ascl1b (U–V’) in green, and ectopic β-cells in red with immunostaining for insulin (except Q–R’ with the mCherry fluorescence driven by the insulin promoter). Arrowheads point to ectopic β-cells that express corresponding markers. Arrows point to β-cells that do not express ascl1b (V and V’). B’, F’, J’, N’, R’, and V’ are magnified from the areas indicated by the white dashed square in B, F, J, N, R, and V, respectively. Quantification of β-cells with or without corresponding marker expression in the ectopic location (C, G, K, O, S, and W) or in the pancreas (D, H, L, P, T, and X) per larva at 3 dpf. *p=0.0310, **p=0.0039, and ****p<0.0001 (Šidák’s multiple comparisons test); (C, D) n = 30 (control) and 31 (npas4l−/−); (G, H) n = 8 (control) and 8 (npas4l−/−); (K, L) n = 25 (control) and 24 (npas4l−/−); (O, P) n = 21 (control) and 23 (npas4l−/−); (S, T) n = 40 (control) and 32 (npas4l−/−); (W and X) n = 13 (control) and 13 (npas4l−/−). Data are represented as the mean ± SEM. Scale bars = 20 μm except B’, F’, J’, N’, R’, and V’ (10 μm). Anatomical axes: D (dorsal), V (ventral), A (anterior), and P (posterior).
Figure 2—figure supplement 1
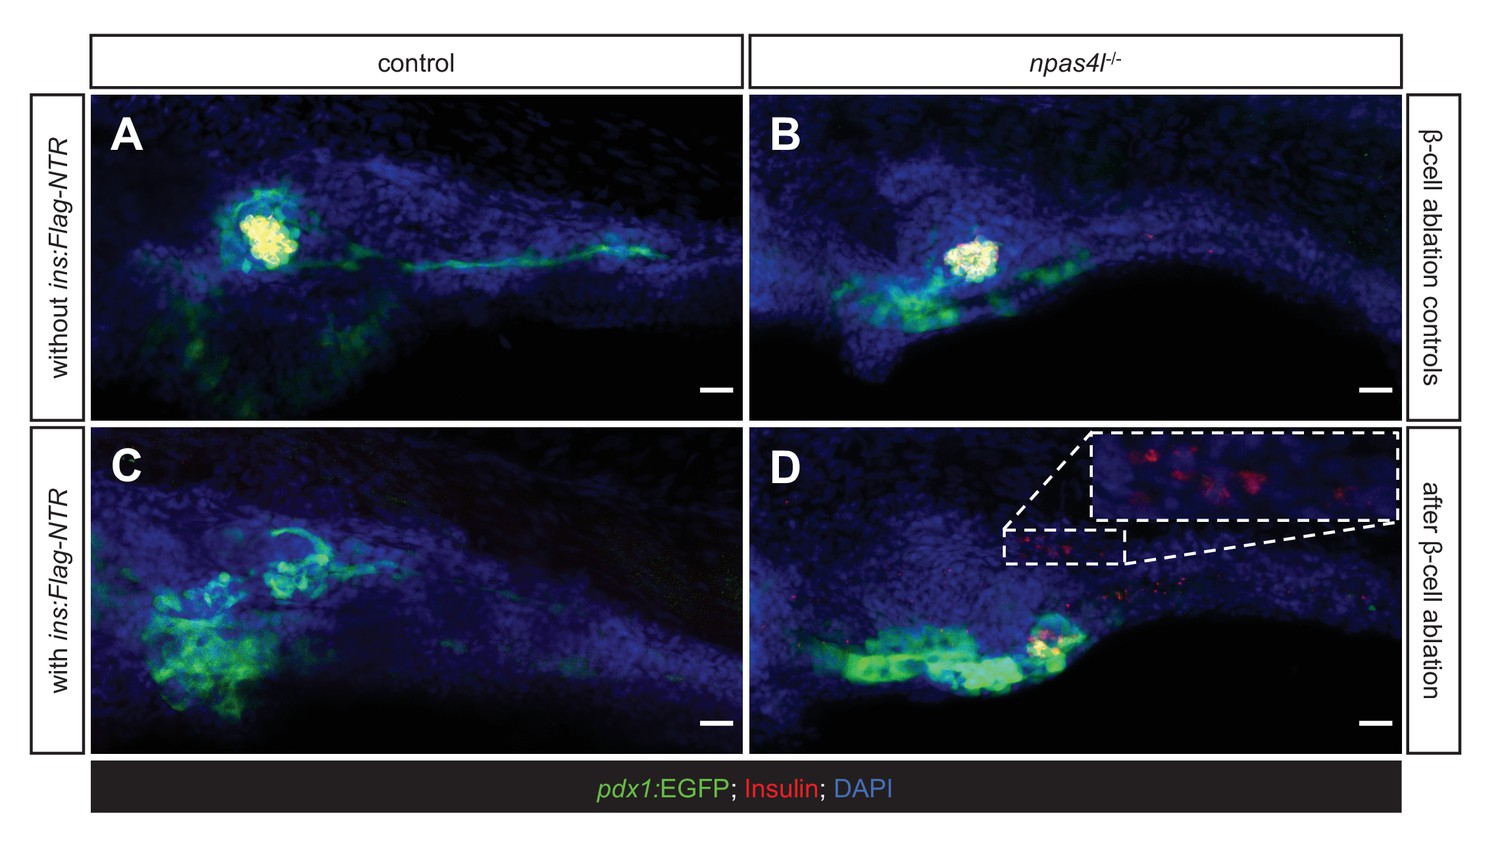
Mutation of npas4l inhibits pdx1-expressing pancreatic duct formation.
(A–D) Representative image projections of the pancreas and the surrounding tissues in control siblings and npas4l−/− Tg(pdx1:EGFP) zebrafish larvae without (A, B) or with (C, D) ins:Flag-NTR expression at 3 dpf after treatment with MTZ at 1–2 dpf. Hence (A and B) were β-cell ablation controls while the β-cells in (C and D) had been ablated. Insulin-expressing β-cells are displayed in red with immunostaining for insulin and pdx1-expressing cells (including pancreatic ductal cells and upper intestine) in green. The dashed rectangle indicates that the ectopic β-cells were distant from the pdx1-expressing pancreatic ducts. Scale bars = 20 μm.
Figure 3

Ectopic β-cells can respond to glucose by displaying calcium oscillations.
Representative images captured from a live calcium imaging video of npas4l−/−Tg(ins:GCaMP6s);Tg(ins:mCherry);Tg(ins:Flag-NTR) zebrafish larvae at 3 dpf after β-cell ablation by MTZ from 1 to 2 dpf, showing β-cells expressing ins:mCherry in red and displaying calcium activity in green in the pancreatic (A, B) or ectopic (C, D) domain at the baseline (A, C) or after the addition of 200 mM of glucose to the E3 medium (B, D). (E) Sequential images captured from a live calcium imaging video to show the oscillation of calcium signalling at the baseline and after the glucose treatment, displaying the GCaMP6s signal in green. (F) Quantification of pancreatic or ectopic β-cells displaying calcium activity at the baseline or after glucose treatment in 11 (pancreatic) or 17 (ectopic) npas4l zebrafish mutants. Scale bars = 10 μm.
Figure 4 with 4 supplements
The ectopic β-cells are of mesodermal origin in npas4l mutants and etsrp morphants.
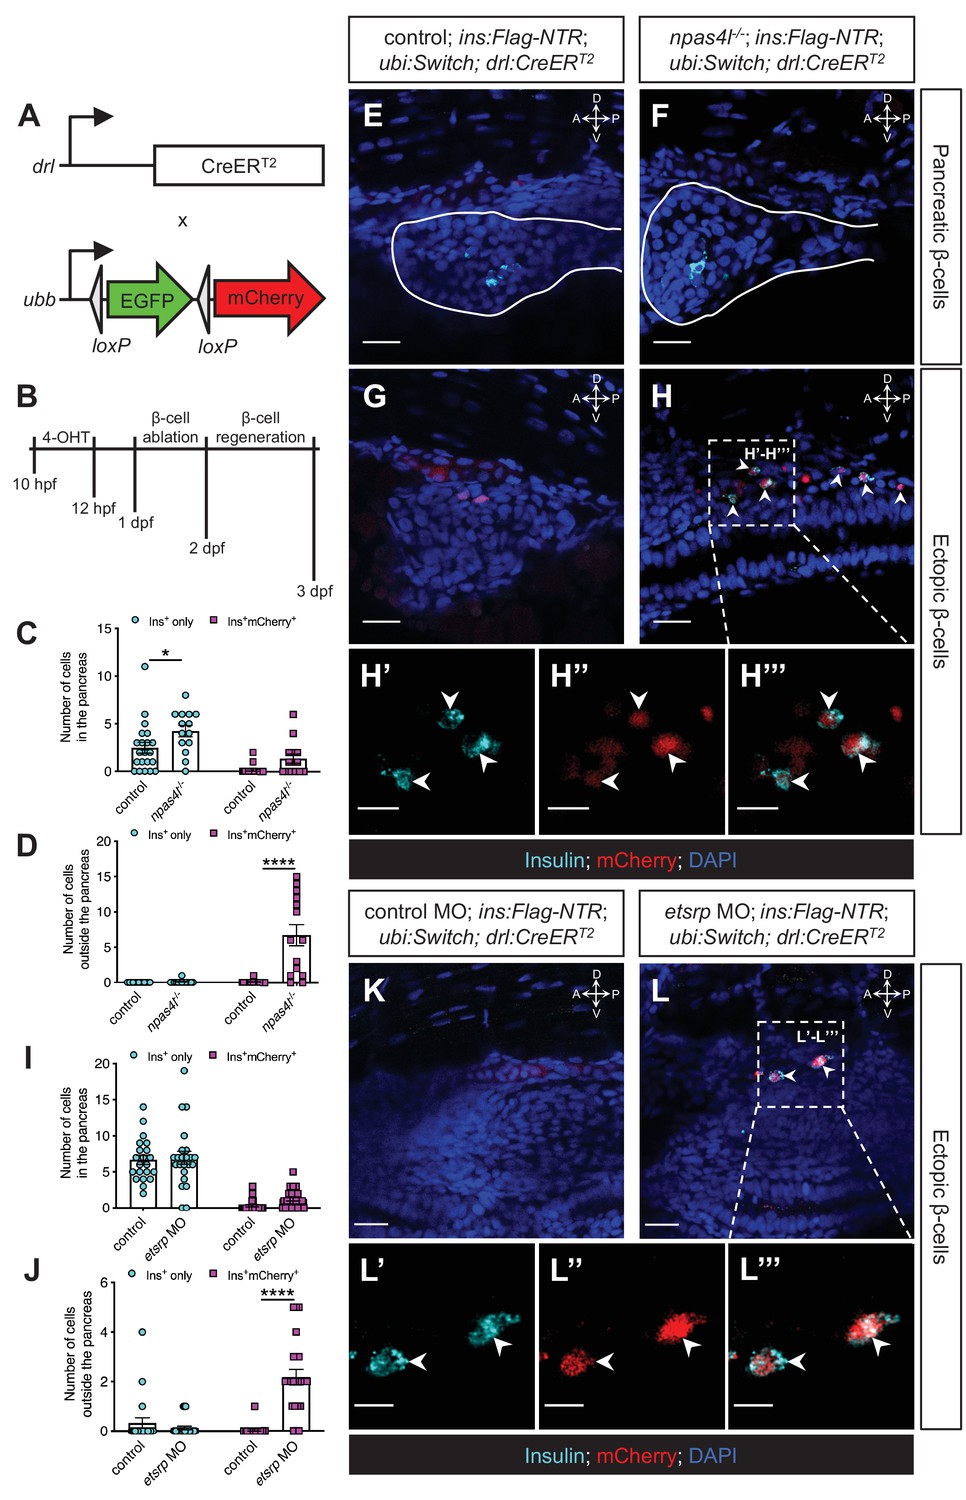
(A) Constructs of −6.35drl:Cre-ERT2 (drl:CreERT2) and −3.5ubb:LOXP-EGFP-LOXP-mCherry (ubi:Switch). Upon 4-OHT induction between 10 and 12 hpf, Cre recombinase expressed by the drl promoter cleave the loxP sites to allow ubb:mCherry expression in the cells that once expressed drl. (B) Scheme for tracing the mesodermal lineage of ectopic β-cells in control siblings and npas4l−/− Tg(ins:Flag-NTR);Tg(ubi:Switch);Tg(drl:CreERT2) zebrafish larvae. (C, D, I, and J) Quantification of the pancreatic or ectopic β-cells with or without mesodermal lineage in npas4l mutants (C, D) or etsrp morpholino (MO)-injected larvae (I, J) at 3 dpf. *p=0.0227 and ****p<0.0001 (Šidák’s multiple comparisons test); (C, D) n = 21 (control) and 14 (npas4l−/−) or (I, J) n = 21 (control) and 23 (etsrp MO). Data are represented as the mean ± SEM. Standard control MO (4 ng) and etsrp MO2 (4 ng) were injected to the control group and etsrp MO group respectively at the one-cell stage (I, J, K–L’’’). (E–H’’’ and K–L’’’) Representative confocal images of pancreatic (E, F) or ectopic β-cells (G, H) of control siblings and npas4l−/−, or ectopic β-cells in control or etsrp MO-injected (K, L) Tg(ins:Flag-NTR);Tg(ubi:Switch);Tg(drl:CreERT2) zebrafish larvae at 3 dpf after β-cell ablation by MTZ at 1–2 dpf, displaying β-cells in cyan with immunostaining for insulin and lineage-traced cells derived from drl-expressing mesodermal cells in red from the Cre-recombined ubi:Switch. Pancreata are outlined by solid white lines (E, F). Arrowheads point to ectopic β-cells derived from the mesoderm (H–H’’’ and L–L’’’). Selected areas in dashed squares in (H) and (L) are magnified in split (H’, H’’, L’ and L’’) and merged (H’’’ and L’’’) channels, respectively. Scale bars = 20 μm (E–H, K, and L) or 10 μm (H’–H’’’ and L’–L’’). Anatomical axes: D (dorsal), V (ventral), A (anterior), and P (posterior).
Figure 4—figure supplement 1

Cell population with reduced npas4l expression remains in the lateral plate mesoderm before β-cell ablation.
(A, B) Representative images of in situ hybridisation against npas4l expression in control siblings and npas4l−/− zebrafish embryos at 20 hpf after a 45 min incubation to develop the expression signal. Inset (B’) displays a representative npas4l−/− zebrafish embryo incubated overnight to further develop the signal. Red arrowheads point to lateral plate mesoderm expressing npas4l. (C–J) Representative images of in situ hybridisation against foxa2 (C, D), gsc (E, F), mixl1 (G, H), and ascl1b (I, J) expression in control siblings and npas4l−/− zebrafish embryos at 20 hpf.
Figure 4—figure supplement 2
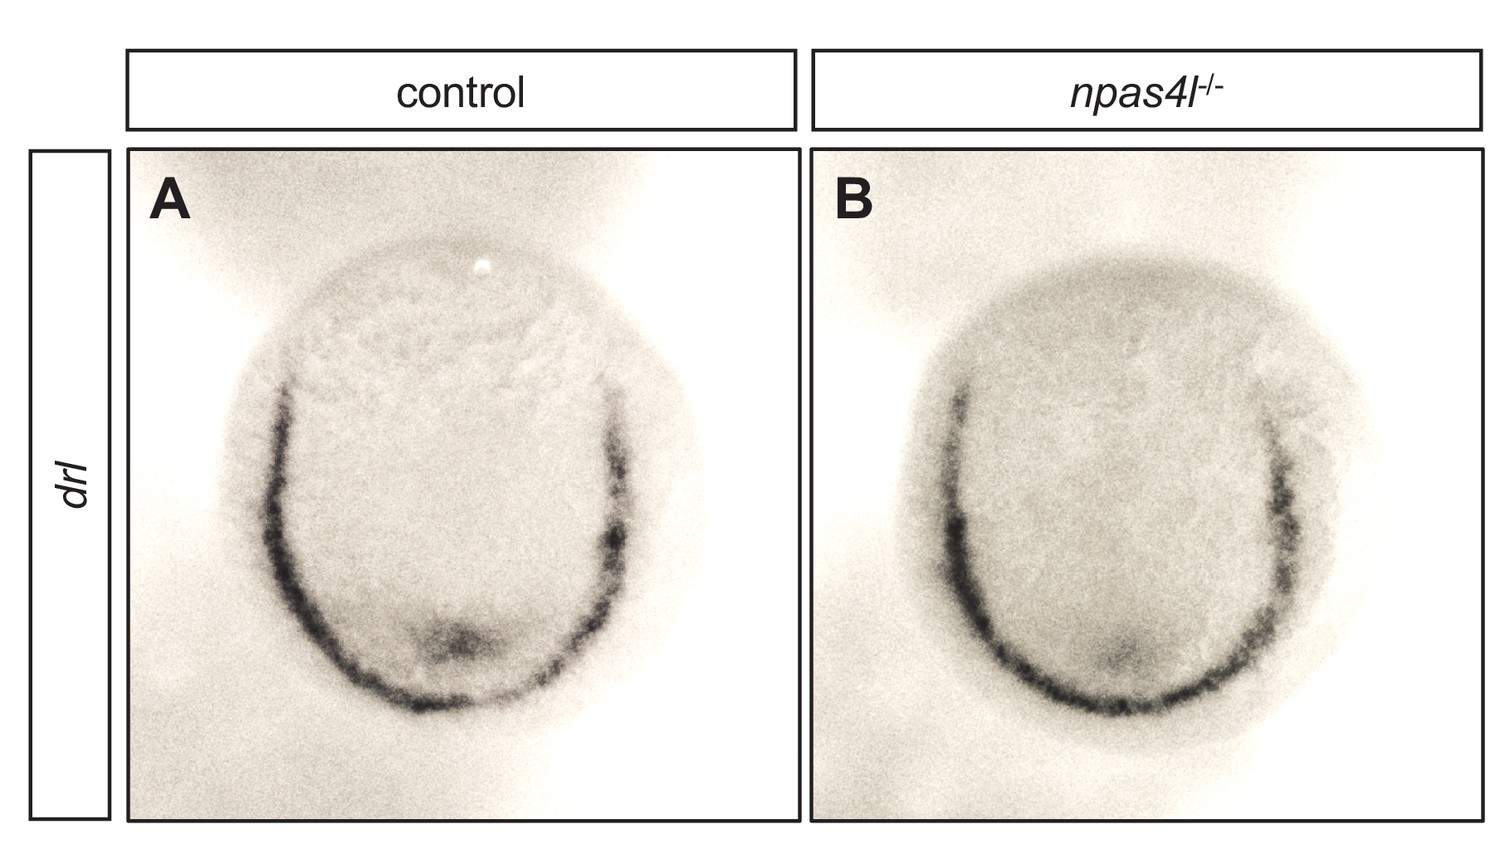
The npas4l mutant does not display altered expression of drl in the lateral plate mesoderm.
(A, B) Representative images of in situ hybridisation against drl expression in control siblings and npas4l−/− zebrafish embryos at 10 hpf.
Figure 4—figure supplement 3
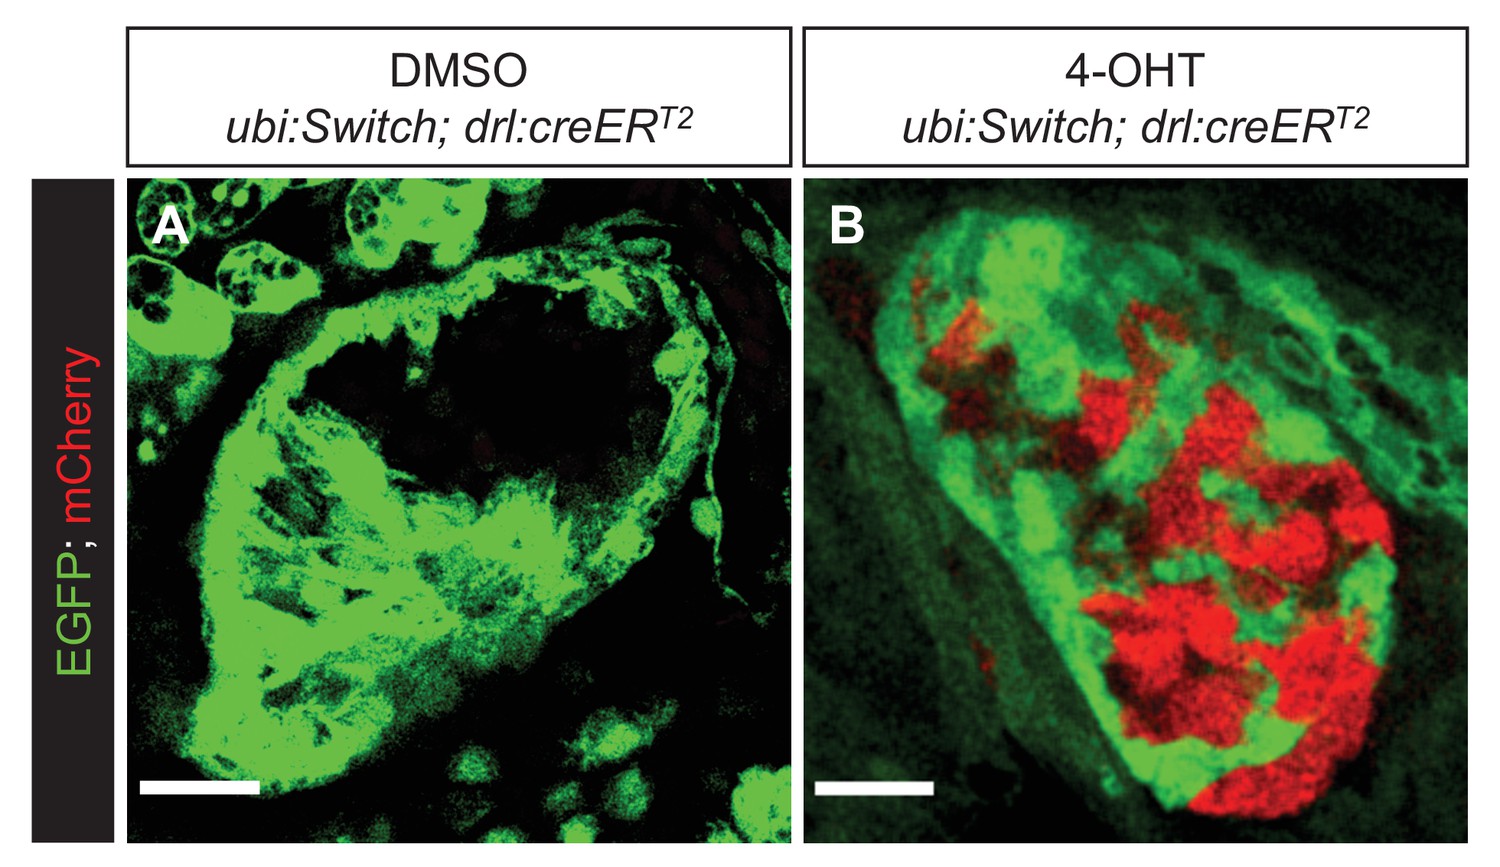
Lateral plate mesoderm-derived cardiomyocytes are traced back to a drl-expressing lineage.
(A, B) Representative confocal images of hearts of Tg(drl:CreERT2);Tg(ubi:Switch) zebrafish larvae at three dpf after DMSO (A) or 4-OHT (B) treatment from 10 to 12 hpf. Cells with or without tamoxifen-inducible Cre recombination are shown in red and green respectively from ubi:Switch. Scale bars = 20 μm.
Figure 4—figure supplement 4
Validation of etsrp morpholinos.
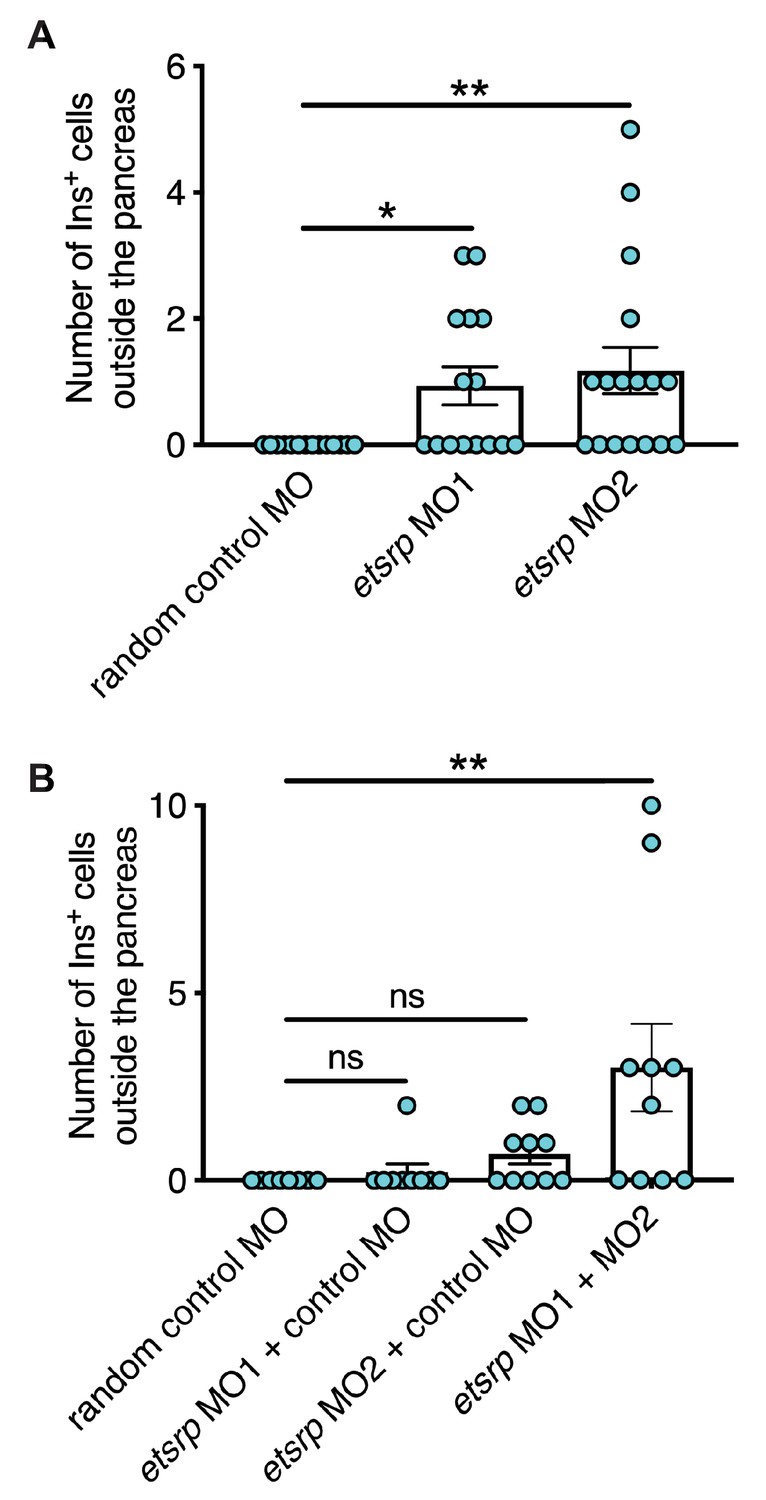
(A) Quantification of ectopic β-cells in Tg(ins:Flag-NTR) zebrafish larvae at 3 dpf after injection of random control MO (4 ng), etsrp MO1 (4 ng), or etsrp MO2 (4 ng) at one-cell stage, followed by MTZ treatment at 1–2 dpf. n = 14 (random control MO), 15 (etsrp MO1), and 17 (etsrp MO2). *p=0.0197 and **p=0.0031 (Dunn’s multiple comparisons test). (B) Quantification of ectopic β-cells in Tg(ins:Flag-NTR) zebrafish larvae at 3 dpf after injection of random control MO (3 ng), etsrp MO1 (2 ng), etsrp MO2 (1 ng), or etsrp MO1 + etsrp MO2 at the one-cell stage, followed by MTZ treatment at 1–2 dpf. n=8 (random control MO), 9 (etsrp MO1), 10 (etsrp MO2), and 10 (etsrp MO1 + etsrp MO2). **P=0.0084 (Dunn’s multiple comparisons test). Data are represented as the mean ± SEM.
Figure 5
The mesodermal cells lose npas4l expression after differentiating into ectopic β-cells.
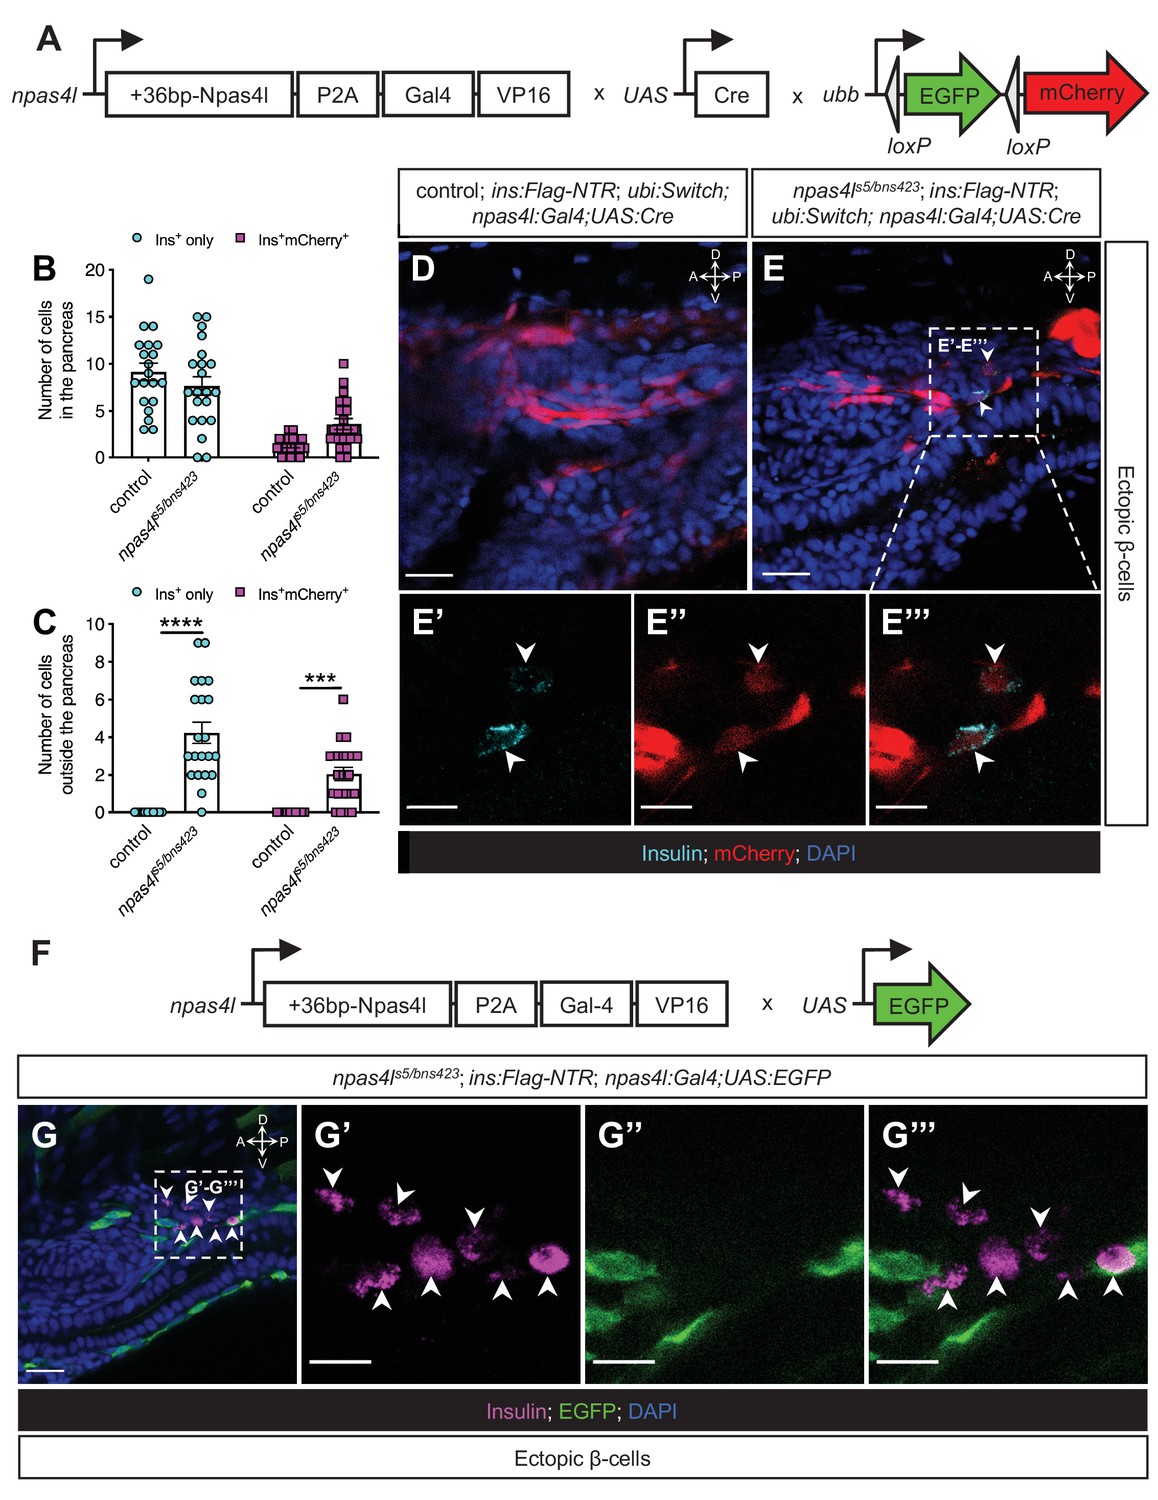
(A) Schematics of npas4lPt(+36-npas4l-p2a-Gal4-VP16)bns423 (npas4l:Gal4), UAS:Cre and −3.5ubb:LOXP-EGFP-LOXP-mCherry (ubi:Switch). (B, C) Quantification of the pancreatic or ectopic β-cells with or without npas4l-positive mesodermal origin in control or transheterozygous npas4ls5/bns423 mutants at 3 dpf. ***p=0.0001 and ****P<0.0001 (Šidák’s multiple comparisons test); n = 20 (control) and 21 (npas4ls5/bns423). Data are represented as the mean ± SEM. (D–E’’’) Representative confocal images of ectopic β-cells and npas4l-positive lineage-traced cells in control siblings and npas4ls5/bns423 Tg(ins:Flag-NTR);Tg(ubi:Switch);Tg(npas4l:Gal4);Tg(UAS:Cre) zebrafish larvae at 3 dpf after β-cell ablation by MTZ from 1 to 2 dpf, displaying β-cells in cyan with immunostaining for insulin and lineage-traced cells derived from npas4l-expressing mesodermal cells in red from the Cre-recombined ubi:Switch. The selected area in a dashed square in (E) is magnified in split (E’ and E’’) and merged (E’’’) channels, respectively. Arrowheads point to ectopic β-cells derived from the mesoderm (E–E’’’). (F) Schematics of npas4lPt(+36-npas4l-p2a-Gal4-VP16)bns423 (npas4l:Gal4) and UAS:EGFP. (G–G’’’) Representative confocal images of ectopic β-cells losing npas4l expression in npas4ls5/bns423 Tg(ins:Flag-NTR); Tg(npas4l:Gal4);Tg(UAS:EGFP) zebrafish larvae at 3 dpf after β-cell ablation by MTZ from 1 to 2 dpf, displaying β-cells in magenta with immunostaining for insulin and cells expressing npas4l in green. The selected area in a dashed square in (G) is magnified in split (G’ and G’’) and merged (G’’’) channels, respectively. Arrowheads point to ectopic β-cells without npas4l expression (G–G’’’). Scale bars = 20 μm (D, E, and G) or 10 μm (E’–E’’’ and G’–G’’). Anatomical axes: D (dorsal), V (ventral), A (anterior), and P (posterior).
Figure 6 with 1 supplement
The ectopic β-cells derive from the etsrp-expressing mesodermal lineage in etsrp morphants.
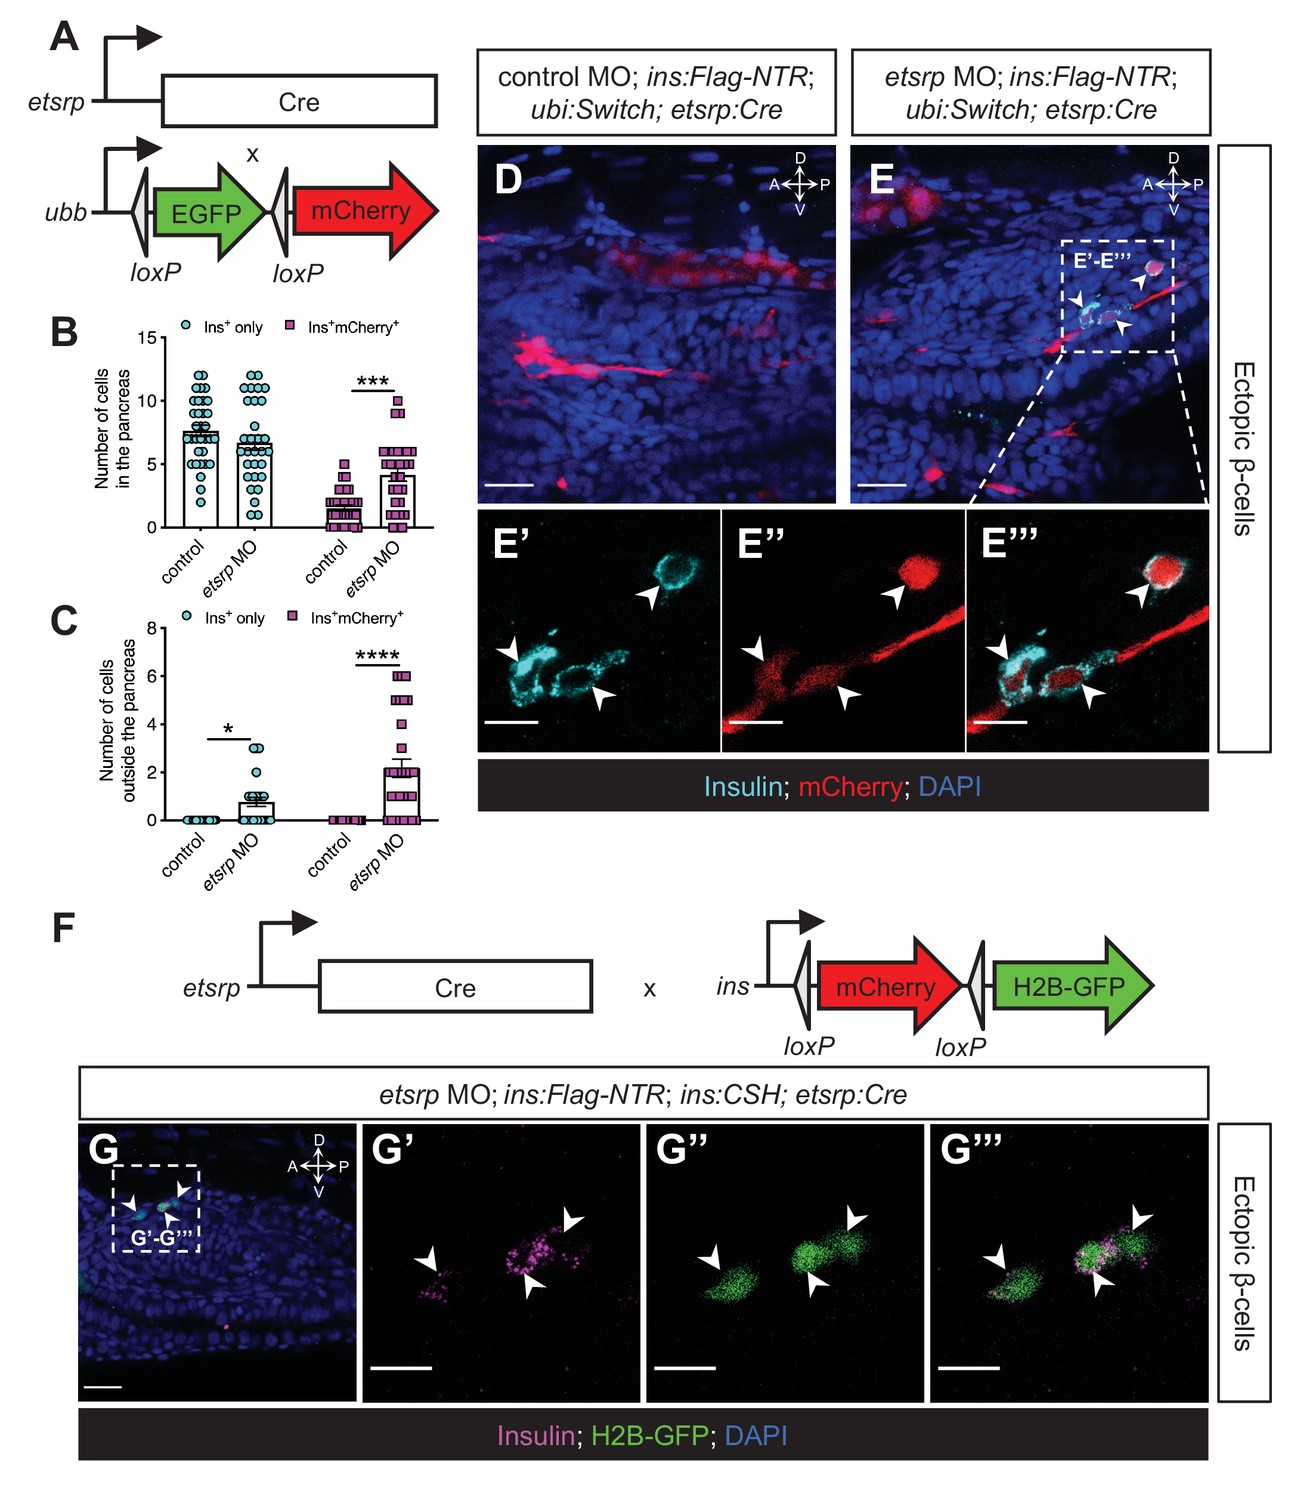
(A) Constructs of etsrp:Cre and −3.5ubb:LOXP-EGFP-LOXP-mCherry (ubi:Switch). (B, C) Quantification of the pancreatic or ectopic β-cells with or without etsrp-positive mesodermal origin in control or etsrp morpholino (MO)-injected larvae at 3 dpf. *p=0.0169, ***p=0.0002, and ****p<0.0001 (Šidák’s multiple comparisons test); n=33 (control) and 30 (etsrp MO). Data are represented as the mean ± SEM. (D–E’’’) Representative confocal images of ectopic β-cells and etsrp-positive lineage-traced cells in control or etsrp MO-injected Tg(ins:Flag-NTR);Tg(ubi:Switch);Tg(etsrp:Cre) zebrafish larvae at 3 dpf after β-cell ablation by MTZ at 1–2 dpf, displaying β-cells in cyan with immunostaining for insulin and lineage-traced cells derived from etsrp-expressing mesodermal cells in red from the Cre-recombined ubi:Switch. The selected area in a dashed square in (E) is magnified in split (E’, E’’) and merged (E’’’) channels, respectively. Arrowheads point to ectopic β-cells derived from the mesoderm (E–E’’’). (F) Constructs of etsrp:Cre and ins:LOXP-mCherry-LOXP-Hsa.HIST1H2BJ-GFP (ins:CSH). (G–G’’’) Representative confocal images of ectopic β-cells derived from the etsrp-expressing lineage in etsrp MO-injected Tg(ins:Flag-NTR);Tg(ins:CSH);Tg(etsrp:Cre) zebrafish larvae at 3 dpf after β-cell ablation by MTZ at 1–2 dpf, displaying β-cells in magenta with immunostaining for insulin and lineage-traced cells derived from etsrp-expressing mesodermal cells in nuclear green from the Cre-recombined ins:CSH. The selected area in a dashed square in (G) is magnified in split (G’ and G’’) and merged (G’’’) channels, respectively. Scale bars = 20 μm (D, E, and G) or 10 μm (E’–E’’’ and G’–G’’’). Anatomical axes: D (dorsal), V (ventral), A (anterior), and P (posterior).
Figure 6—figure supplement 1
Most of the kdrl-expressing endothelial cells are traced back to an etsrp lineage.
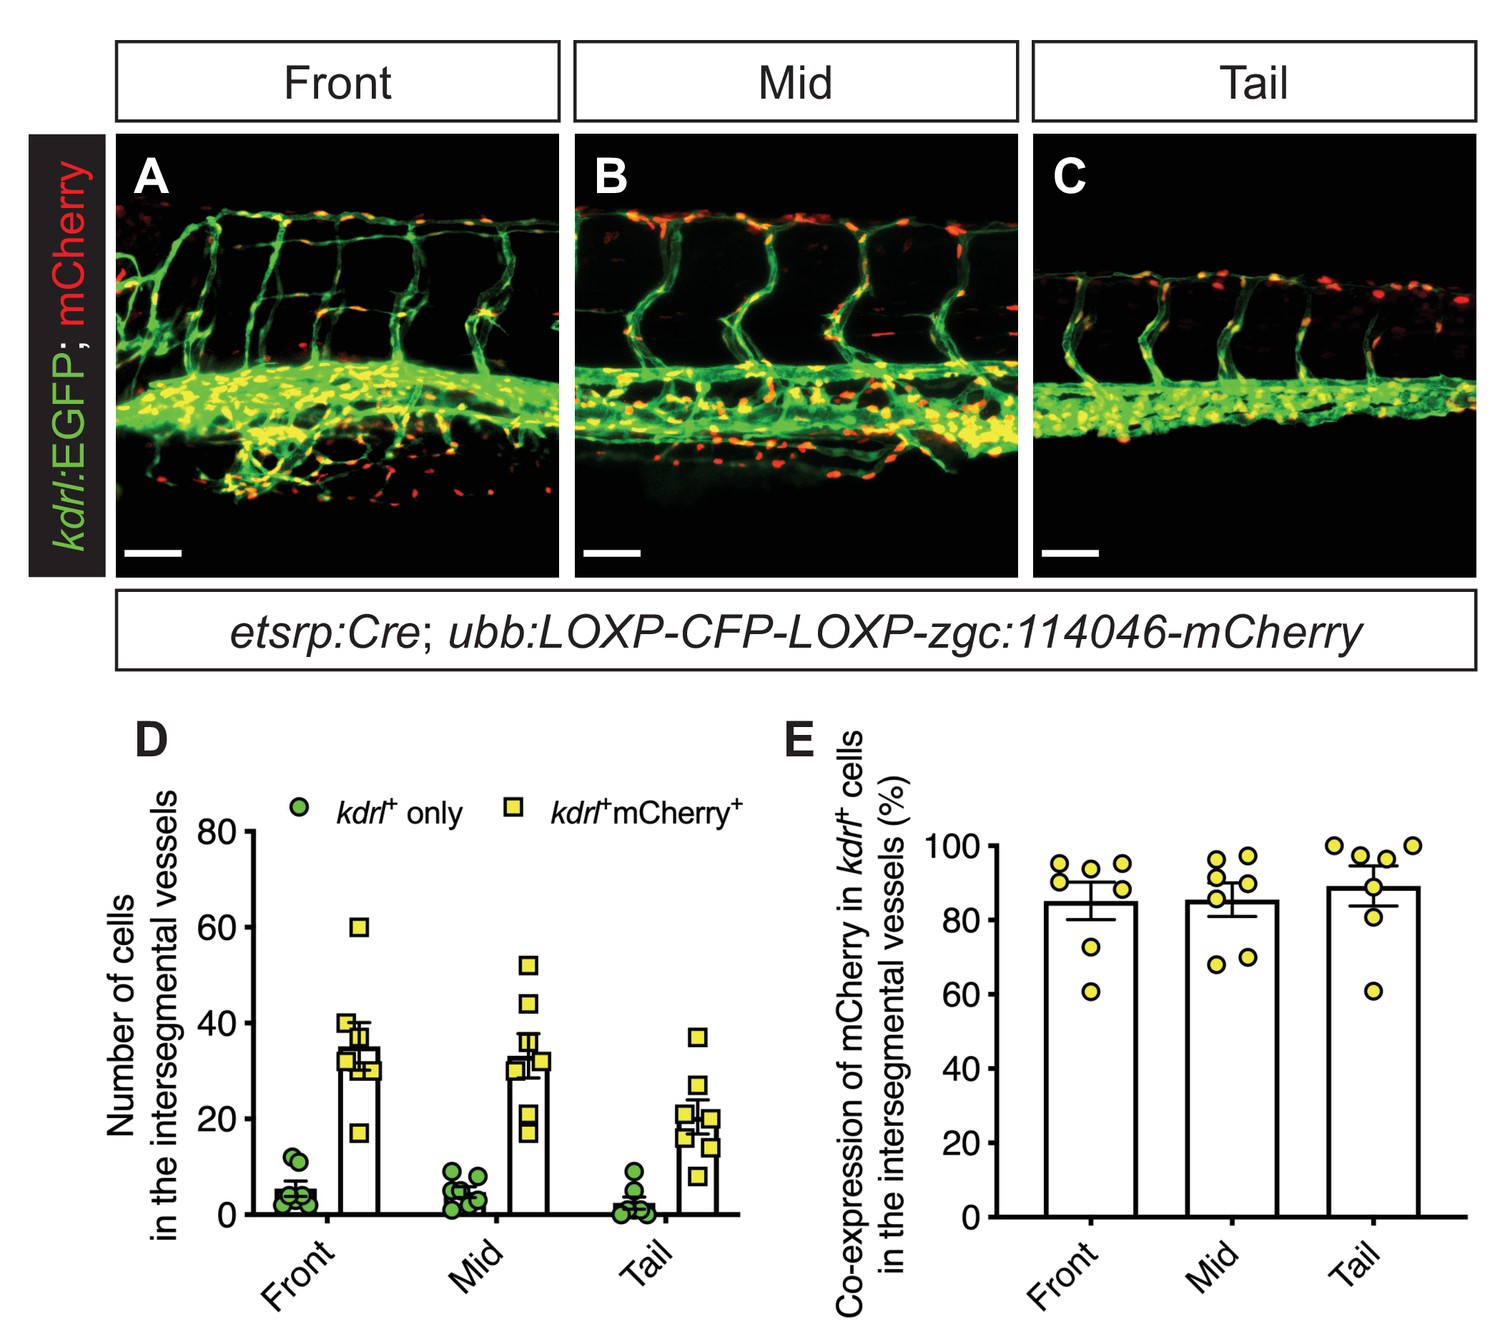
(A–C) Representative confocal images of intersegmental vessels and other vasculatures in different body regions (front, mid, or tail) of Tg(etsrp:Cre);Tg(ubb:LOXP-CFP-LOXP-zgc:114046-mCherry) zebrafish larvae at 3 dpf, displaying kdrl-expressing endothelial cells in green and cells of etsrp-positive origin in nuclear red. Scale bars = 50 μm. (D, E) Quantifications of kdrl-expressing endothelial cells traced back to the etsrp lineage in the intersegmental vessels per larva at 3 dpf. n = 7; Data are represented as the mean ± SEM.
Figure 7

Npas4l/Etsrp restricts the plasticity of the mesoderm.
Mesoderm and endoderm normally follow Waddington’s landscape model to further differentiate into cells with mesodermal fates and endodermal fates, respectively, during development. However, mutating npas4l or knocking down etsrp not only abolishes the endothelial/myeloid specification but also induces plasticity of mesodermal cells to enable their differentiation into β-cells across the germ layer boundary.
Videos
Video 1
Live calcium imaging of β-cells in a npas4l mutant.
An example video of live calcium imaging of both pancreatic and ectopic β-cells in a Tg(ins:GCaMP6s);Tg(ins:mCherry);Tg(ins:Flag-NTR) npas4l mutant at 3 dpf after β-cell ablation from 1 to 2 dpf, displaying GCaMP6s signal in green. Glucose (200 mM) was added to the E3 media at around 9 min in the video.
Tables
Table 1
Percentages of pancreatic or ectopic cells co-expressing insulin and corresponding marker gene or protein in npas4l mutants.
| Marker gene/protein | Pancreatic co-expression (%) | Ectopic co-expression (%) |
|---|---|---|
| Isl1 | 97.9 | 96.8 |
| neurod1 | 97.5 | 17.5 |
| pdx1 | 72.1 | 32.8 |
| mnx1 | 75.3 | 70.2 |
| pcsk1 | 85.1 | 74.1 |
| ascl1b | 21.2 | 17.8 |
Key resources table
| Reagent type (species) or resource | Designation | Source or reference | Identifiers | Additional information |
|---|---|---|---|---|
| Genetic reagent (Danio rerio) | npas4ls5 | PMID:7588049 | ZFIN: ZDB-ALT-010426–6 | |
| Genetic reagent (Danio rerio) | npas4lPt(+36-npas4l-p2a-Gal4-VP16)bns423 | Other | Will be described in detail elsewhere (K.M. and D.Y.R.S., Manuscript in preparation) | |
| Genetic reagent (Danio rerio) | Tg(ins:Hsa.HIST1H2BJ-GFP;ins:DsRed)s960 | PMID:25117518 | ZFIN: ZDB-ALT-131001–6 | |
| Genetic reagent (Danio rerio) | Tg(ins:FLAG-NTR,cryaa:mCherry)s950 | PMID:22608007 | ZFIN: ZDB-ALT-130930–5 | |
| Genetic reagent (Danio rerio) | Tg(ptf1a:EGFP)jh1 | PMID:16258076 | ZFIN: ZDB-ALT-070531–2 | |
| Genetic reagent (Danio rerio) | TgBAC(hand2:EGFP)pd24 | PMID:21397850 | ZFIN: ZDB-ALT-110128–40 | |
| Genetic reagent (Danio rerio) | TgBAC(neurod1:EGFP)nl1 | PMID:18305245 | ZFIN: ZDB-ALT-080701–1 | |
| Genetic reagent (Danio rerio) | TgBAC(pdx1:EGFP)bns13 | PMID:31142539 | ZFIN: ZDB-ALT-191212–6 | |
| Genetic reagent (Danio rerio) | Tg(mnx1:GFP)ml2 | PMID:16162647 | ZFIN: ZDB-ALT-051025–4 | |
| Genetic reagent (Danio rerio) | Tg(pcsk1:EGFP)KI106 | PMID:27516442 | ZFIN: ZDB-ALT-161115–10 | |
| Genetic reagent (Danio rerio) | TgBAC(ascl1b:EGFP-2A-Cre-ERT2)ulg006 | PMID:26329351 | ZFIN: ZDB-ALT-160205–2 | |
| Genetic reagent (Danio rerio) | Tg(ins:GCaMP6s,cryaa:RFP) | PMID:28939870 | ZFIN: ZDB-ALT-181221–2 | |
| Genetic reagent (Danio rerio) | Tg(−3.5ubb:LOXP-EGFP-LOXP-mCherry)cz1701 | PMID:21138979 | ZFIN: ZDB-ALT-110124–1 | |
| Genetic reagent (Danio rerio) | Tg(−6.35drl:Cre-ERT2,cryaa:Venus)cz3333 | PMID:26306682 | ZFIN: ZDB-ALT-160129–4 | |
| Genetic reagent (Danio rerio) | Tg(5xUAS:EGFP)nkuasgfp1a | PMID:18202183 | ZFIN: ZDB-ALT-080528–1 | |
| Genetic reagent (Danio rerio) | Tg(kdrl:EGFP)s843 | PMID:16251212 | ZFIN: ZDB-ALT-050916–14 | |
| Genetic reagent (Danio rerio) | Tg(ubb:LOXP-CFP-LOXP-zgc:114046-mCherry)jh63 | PMID:25773748 | ZFIN: ZDB-ALT-151007–31 | |
| Genetic reagent (Danio rerio) | Tg(ins:LOXP-mCherry-LOXP-Hsa.HIST1H2BJ-GFP,cryaa:Cerulean)s934 | PMID:21497092 | ZFIN: ZDB-ALT-111031–2 | |
| Genetic reagent (Danio rerio) | Tg(etsrp:iCre;cryaa:Venus)KI114 | This paper | See Materials and methods, section Zebrafish | |
| Genetic reagent (Danio rerio) | Tg(UAS:Cre, cryaa:Cerulean)bns382 | This paper | See Materials and methods, section Zebrafish | |
| Antibody | Anti-GFP (chicken polyclonal) | Aves Labs | GFP-1020 | (1:500) |
| Antibody | Anti-RFP (rabbit polyclonal) | Abcam | ab62341 | (1:500) |
| Antibody | Anti-tdTomato (goat polyclonal) | MyBioSource | MBS448092 | (1:500) |
| Antibody | Anti-insulin (rabbit polyclonal) | Cambridge Research Biochemicals | Customised | (1:100) |
| Antibody | Anti-pan-cadherin (rabbit polyclonal) | Sigma-Aldrich | C3678 | (1:5000) |
| Antibody | Anti-islet-1-homeobox (mouse monoclonal) | DSHB | 40.3A4 supernatant | (1:10) |
| Recombinant DNA reagent | p5E-MCS (plasmid) | Tol2kit | 228 | |
| Recombinant DNA reagent | p5E-etsrp (plasmid) | This paper | −2.3etsrp promoter inserted into p5E-MCS | |
| Recombinant DNA reagent | pME-iCre (plasmid) | Other | From Kristen M. Kwan’s lab | |
| Recombinant DNA reagent | p3E-polyA (plasmid) | Tol2kit | 302 | |
| Recombinant DNA reagent | pDestTol2gY (plasmid) | Other | From Naoki Tsuji | |
| Recombinant DNA reagent | −2.3etsrp:iCre,cryaa:Venus (plasmid) | This paper | See Materials and methods, section Zebrafish | |
| Sequence-based reagent | −2.3etsrp_FWD | This paper | PCR primer | TATAGGGCGAATTGggtaccTTCAGTAAGCAGACTCCTTCAATCA |
| Sequence-based reagent | −2.3etsrp_REV | This paper | PCR primer | AGCTGGAGCTCCAccgcggTTCGGCATACTGCTGTTGGAC |
| Sequence-based reagent | Standard control morpholino | Gene Tools | Morpholino | CCTCTTACCTCAGTTACAATTTATA |
| Sequence-based reagent | Random control morpholino | Gene Tools | Morpholino | Mixture of many oligo sequences |
| Sequence-based reagent | etsrp morpholino MO1 | Gene Tools | Morpholino ZFIN: ZDB-MRPHLNO-060407–2 | TTGGTACATTTCCATATCTTAAAGT |
| Sequence-based reagent | etsrp morpholino MO2 | Gene Tools | Morpholino ZFIN: ZDB-MRPHLNO-060407–3 | CACTGAGTCCTTATTTCACTATATC |
| Sequence-based reagent | npas4l_ISH_FWD | This paper | PCR primer | ACTCGGGCATCAGGAGGATC |
| Sequence-based reagent | npas4l_ISH_REV | This paper | PCR primer | (CCTAATACGACTCACTATAGGG)GACACCAGCATACGACACACAAC |
| Sequence-based reagent | drl_ISH_FWD | This paper | PCR primer | ATGAAGAATACAACAAAACCC |
| Sequence-based reagent | drl_ISH_REV | This paper | PCR primer | (CCTAATACGACTCACTATAGGG)TGAGAAGCTCTGGCCGC |
| Sequence-based reagent | npas4ls5_FWD | PMID:27411634 | PCR primer | TTCCATCTTCTGAATCCTCCA |
| Sequence-based reagent | npas4ls5_REV | PMID:27411634 | PCR primer | GGACAGACCCAGATACTCGT |
| Sequence-based reagent | npas4ls5_SEQ | This paper | Sequencing primer | TTTCTGCCGTGAATGGATGTG |
| Commercial assay or kit | Gateway LR Clonase II Enzyme Mix | Invitrogen | 11791–020 | |
| Commercial assay or kit | Phusion High-Fidelity DNA Polymerase | Thermo Scientific | F-530L | |
| Commercial assay or kit | In-Fusion HD Cloning Kit | Takara Bio | 639648 | |
| Commercial assay or kit | MAXIscript T7/T3 Transcription Kit | Invitrogen | AM1324 | |
| Chemical compound, drug | Metronidazole | Sigma-Aldrich | M3761 | |
| Chemical compound, drug | 4-Hydroxytamoxifen | Sigma-Aldrich | H7904 | |
| Software, algorithm | ImageJ | PMID:22930834 | ||
| Software, algorithm | Fiji | PMID:22743772 | ||
| Software, algorithm | LAS X Version 3.5.5.19976 | Leica | ||
| Software, algorithm | ZEN 3.1 | Zeiss | ||
| Software, algorithm | GraphPad Prism 9 | GraphPad Software | ||
| Other | DAPI | ThermoFisher Scientific | D1306 | (1 µg/mL) |
Additional files
-
Source data 1
Source data for all Figures.
- https://cdn.elifesciences.org/articles/65758/elife-65758-data1-v1.xlsx
-
Transparent reporting form
- https://cdn.elifesciences.org/articles/65758/elife-65758-transrepform-v1.pdf
Download links
A two-part list of links to download the article, or parts of the article, in various formats.
Downloads (link to download the article as PDF)
Open citations (links to open the citations from this article in various online reference manager services)
Cite this article (links to download the citations from this article in formats compatible with various reference manager tools)
Insulin-producing β-cells regenerate ectopically from a mesodermal origin under the perturbation of hemato-endothelial specification
eLife 10:e65758.
https://doi.org/10.7554/eLife.65758


