Calibration of cell-intrinsic interleukin-2 response thresholds guides design of a regulatory T cell biased agonist
- Department of Molecular and Cellular Physiology, Stanford University School of Medicine, United States
- Immunology Graduate Program, Stanford University School of Medicine, United States
- Department of Structural Biology, Stanford University School of Medicine, United States
- Department of Biology, University of Osnabrück, Germany
- Laboratory of Molecular Immunology and Immunology Center, National Heart, Lung, and Blood Institute, NIH, United States
- Division of Blood and Marrow Transplantation, Department of Medicine, Stanford University School of Medicine, United States
- Department of Neurology and Neurological Sciences, Stanford University, United States
- Division of Infectious Diseases and Geographic Medicine, Department of Medicine, Stanford University, United States
- Laboratory of Tumor Immunology, Institute of Microbiology of Czech Academy of Sciences, Czech Republic
- Department of Pediatrics, Stanford University, United States
- Howard Hughes Medical Institute, Stanford University School of Medicine, United States
Figures
Figure 1 with 1 supplement
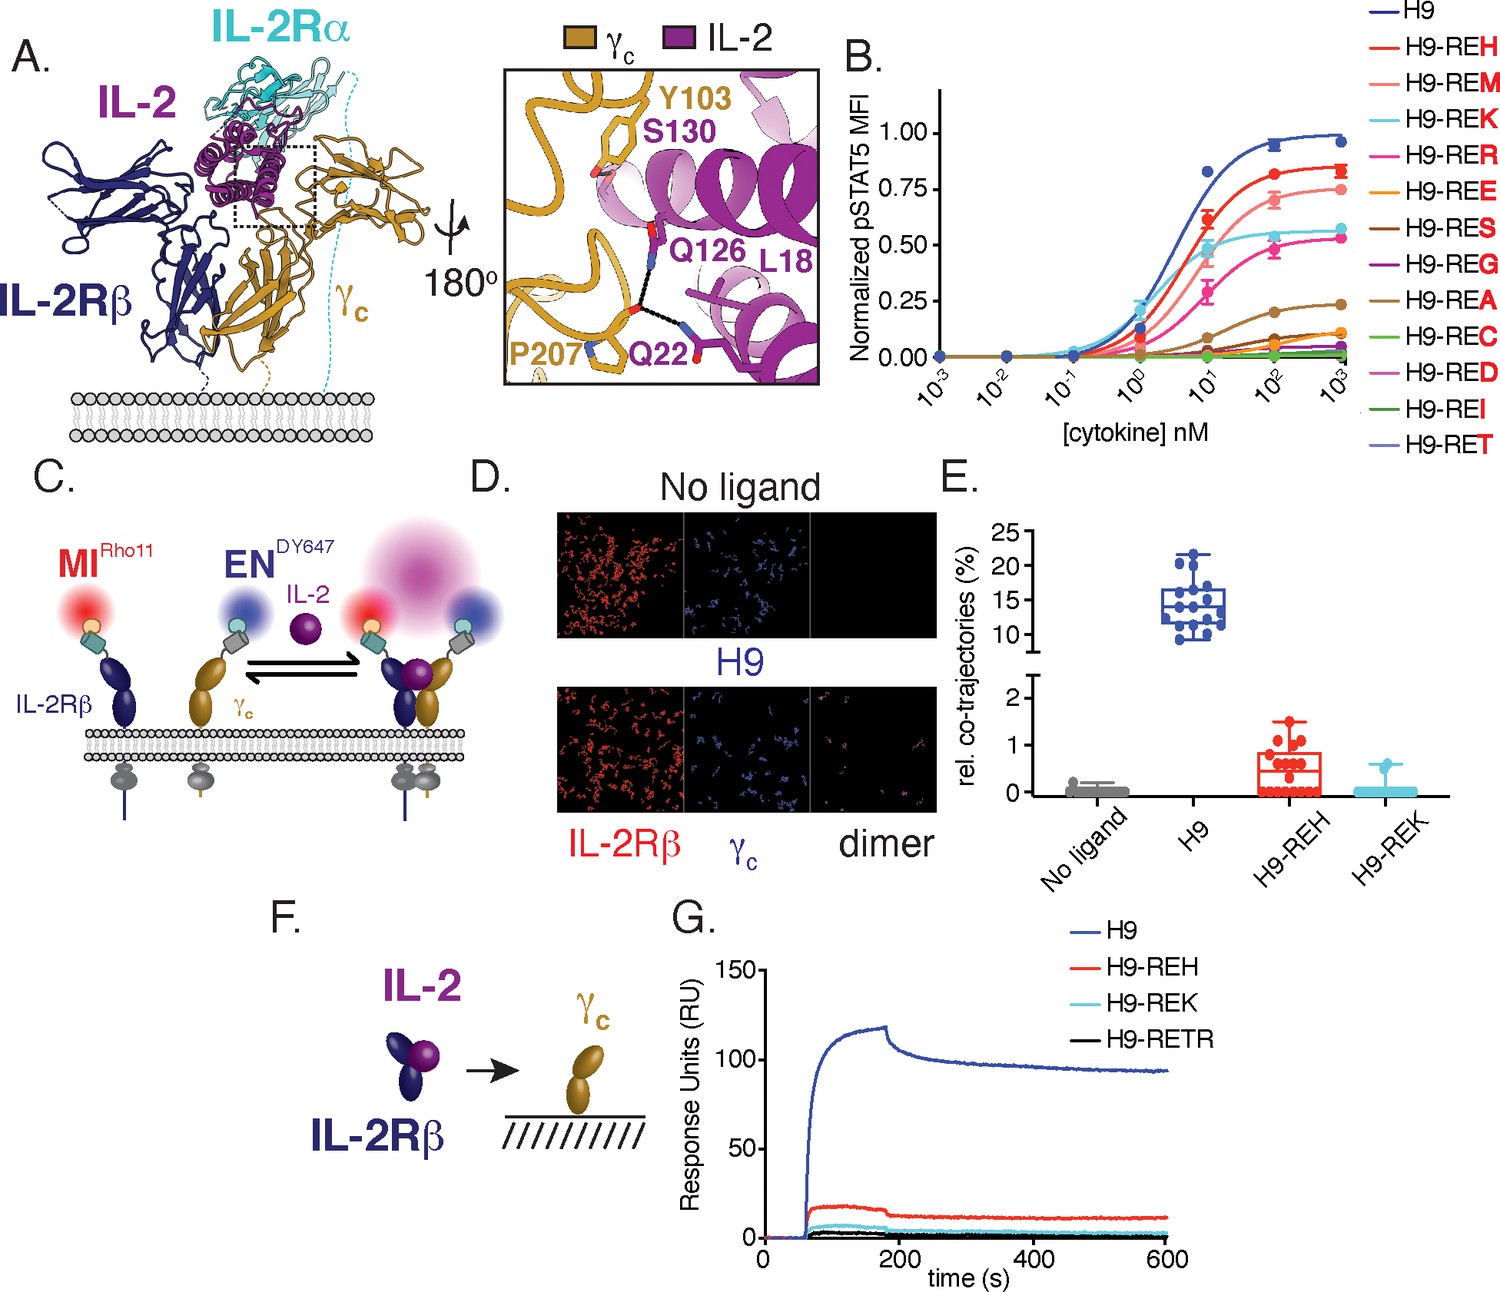
Structure-based design and biophysical characterization of IL-2 receptor partial agonists.
(A) Cartoon representation of the human interleukin-2 (IL-2) receptor complex (PDB: 2B5I). IL-2 is shown in magenta, IL-2 receptor beta (IL-2Rβ) is shown in blue, common gamma (γc) is shown in gold, IL-2 receptor alpha (IL-2Rα) is shown in teal. Insert shows IL-2 residues targeted for mutagenesis. (B) Amino acid substitution at IL-2 Q126 tune cytokine activity. IL-2 variants were expressed on the super-2 H9 background (L80F, R81D, L85V, I86V, I92F), an IL-2 variant with high affinity for IL-2Rβ, and assayed for dose-dependent phosphorylation of STAT5 (pSTAT5) by phosphoflow cytometry in YT cells following a 15 min stimulation. MFI, mean fluorescence intensity. Data are shown as mean ± standard deviation of duplicate wells and are representative of two independent experiments. (C–E) Mutations in IL-2 at the γc binding interface impair receptor dimerization in the context of live cell membranes. (C) Schematic of single-molecule particle tracking experiment. HeLa cells expressing IL-2Rβ and γc with an N-terminal mXFPm and mXFPe were labeled with anti-GFP nanobodies ‘minimizer’ (MI) and 'enhancer’ (EN), conjugated to Rho11 and DY647, respectively. Cells were stimulated with 100 nM H9 or variants as indicated and dual-color single-molecule images were captured by total internal reflection fluorescence microscopy (TIRFM). (D) Representative fields showing single-molecule trajectories of Rho11, DY647 and co-trajectories. (E) Quantification of IL-2Rβ and γc heterodimerization via the fraction of co-trajectories of Rho11 and DY647. Each dot represents a single cell. (F–G) IL-2 partial agonists have impaired binding to γc in solution. (F) Schematic of surface plasmon resonance (SPR) binding experiment. (G) SPR curves showing binding of pre-complexed human IL-2Rβ with H9 or variants (1:1) to human γc immobilized on a streptavidin sensor chip. Measurements were made with 5 μM analyte and reference subtracted for binding to an irrelevant biotinylated target. RU = response unit.
Figure 1—figure supplement 1
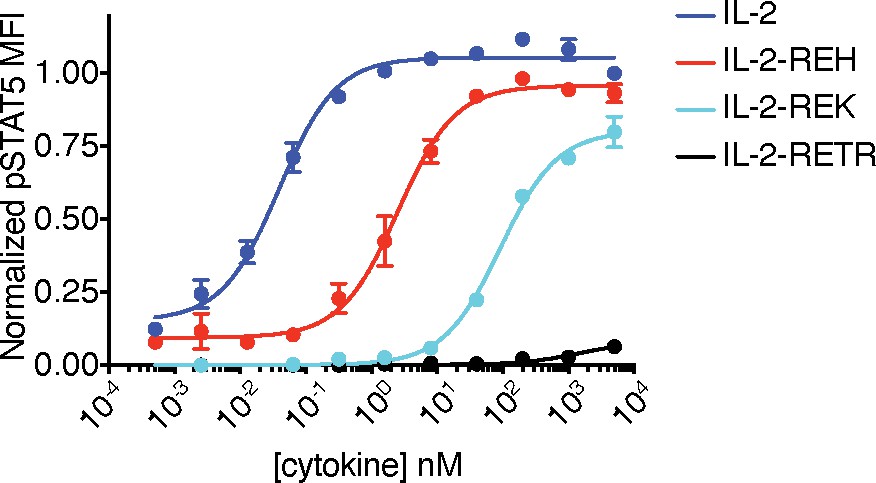
IL-2 variants with reduced binding to γc modulate effective concentration 50 (EC50) and maximal responsiveness (Emax) of pSTAT5 signaling in the context of human IL-2.
YT cells were stimulated for 15 min prior to fixation, permeabilization, and analysis of pSTAT5 by phosphoflow cytometry. Data show mean ± standard deviation of two replicates and are representative of two independent experiments. MFI, mean fluorescence intensity.
Figure 2 with 3 supplements
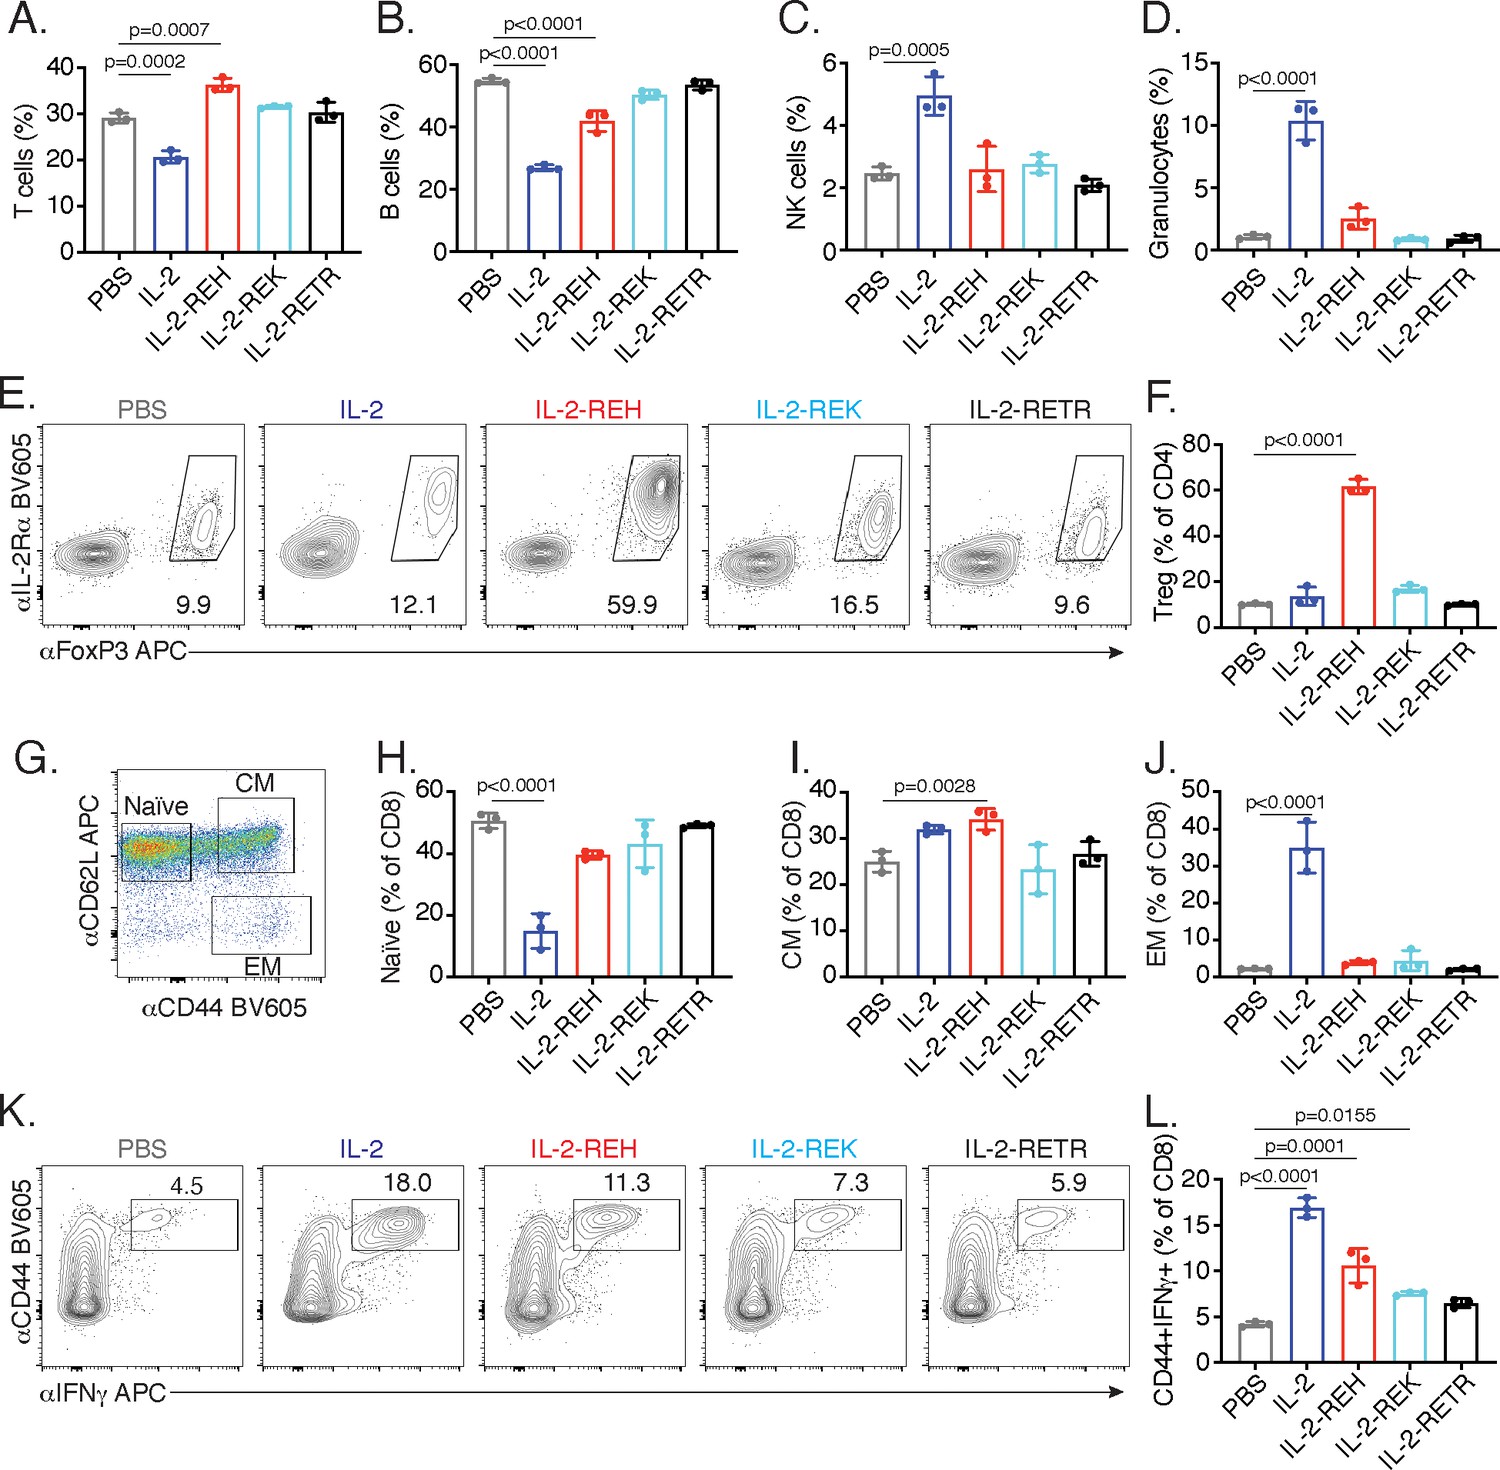
IL-2 receptor partial agonists elicit cell type-specific responses in vivo.
C57BL/6J mice were dosed with three 30 μg intraperitoneal injections of mouse serum albumin (MSA)-conjugated IL-2 or muteins diluted in PBS on day 0, 3, and 6. On day 7, spleen and lymph nodes were harvested for immune cell profiling. (A-D) IL-2 treatment decreases the frequency of T and B cells while increasing the frequency of NK cells and granulocytes in spleen. T cells were gated as CD3+, B cells were defined as CD3-CD19+, NK cells were analyzed as CD3-NK1.1+, and granulocytes were defined as CD3-Ly6G+SSChi. All populations were expressed as a percentage of live CD45+ cells. For absolute numbers and gating, see Figure 2—figure supplement 1. (E) IL-2-REH increases the frequency of regulatory T cells in spleen. Tregs were defined as IL-2Rα+Foxp3+ and expressed as a percentage of liveCD3+CD4+. Similar results were observed in lymph nodes. For absolute numbers, see Figure 2—figure supplement 2A. For gating, see Figure 2—figure supplement 2B. (G-J) IL-2 increases the frequency of effector memory CD8+ T cells with a decrease in naïve CD8+ T cells while IL-2-REH increases the frequency of central memory CD8+ T cells. (G) Gating scheme to identify naïve, central memory (CM), and effector memory (EM) CD8+ T cells. (H-J) Quantification of memory cell frequency in spleen expressed as a percent of liveCD3+CD8+ T cells. For absolute numbers, see Figure 2—figure supplement 3A–C. For gating, see Figure 2—figure supplement 3D. (K-L) IL-2, IL-2-REH, and IL-2-REK enhance IFNγ producing CD8+ T cells in proportion to their agonist activity. For cytokine recall, lymph node cells were restimulated with phorbol 12-myristate 13-acetate (PMA) and ionomycin in the presence of Monensin (GolgiStop) for 4 hr. For gating, see Figure 2—figure supplement 3E. Bar graphs show mean ± standard deviation of n = 3 mice per group. Data were analyzed by one-way ANOVA with Tukey’s multiple comparisons and are representative of two or more independent experiments.
Figure 2—figure supplement 1

In vivo characterization of IL-2 partial agonists.
(A) Spleens from C57BL/6J mice after 30 μg injections of cytokine on day 0, 3, and 6 followed by analysis on day 7. (B) Quantification of spleen weights following cytokine administration. (C–F) Absolute cell counts from spleens of cytokine-treated mice. Data were analyzed by one-way ANOVA with Tukey’s multiple comparison relative to PBS, n = 3 mice per group. (G) Gating of cell surface staining to identify T cells, B cells, NK cells, and granulocytes.
Figure 2—figure supplement 2
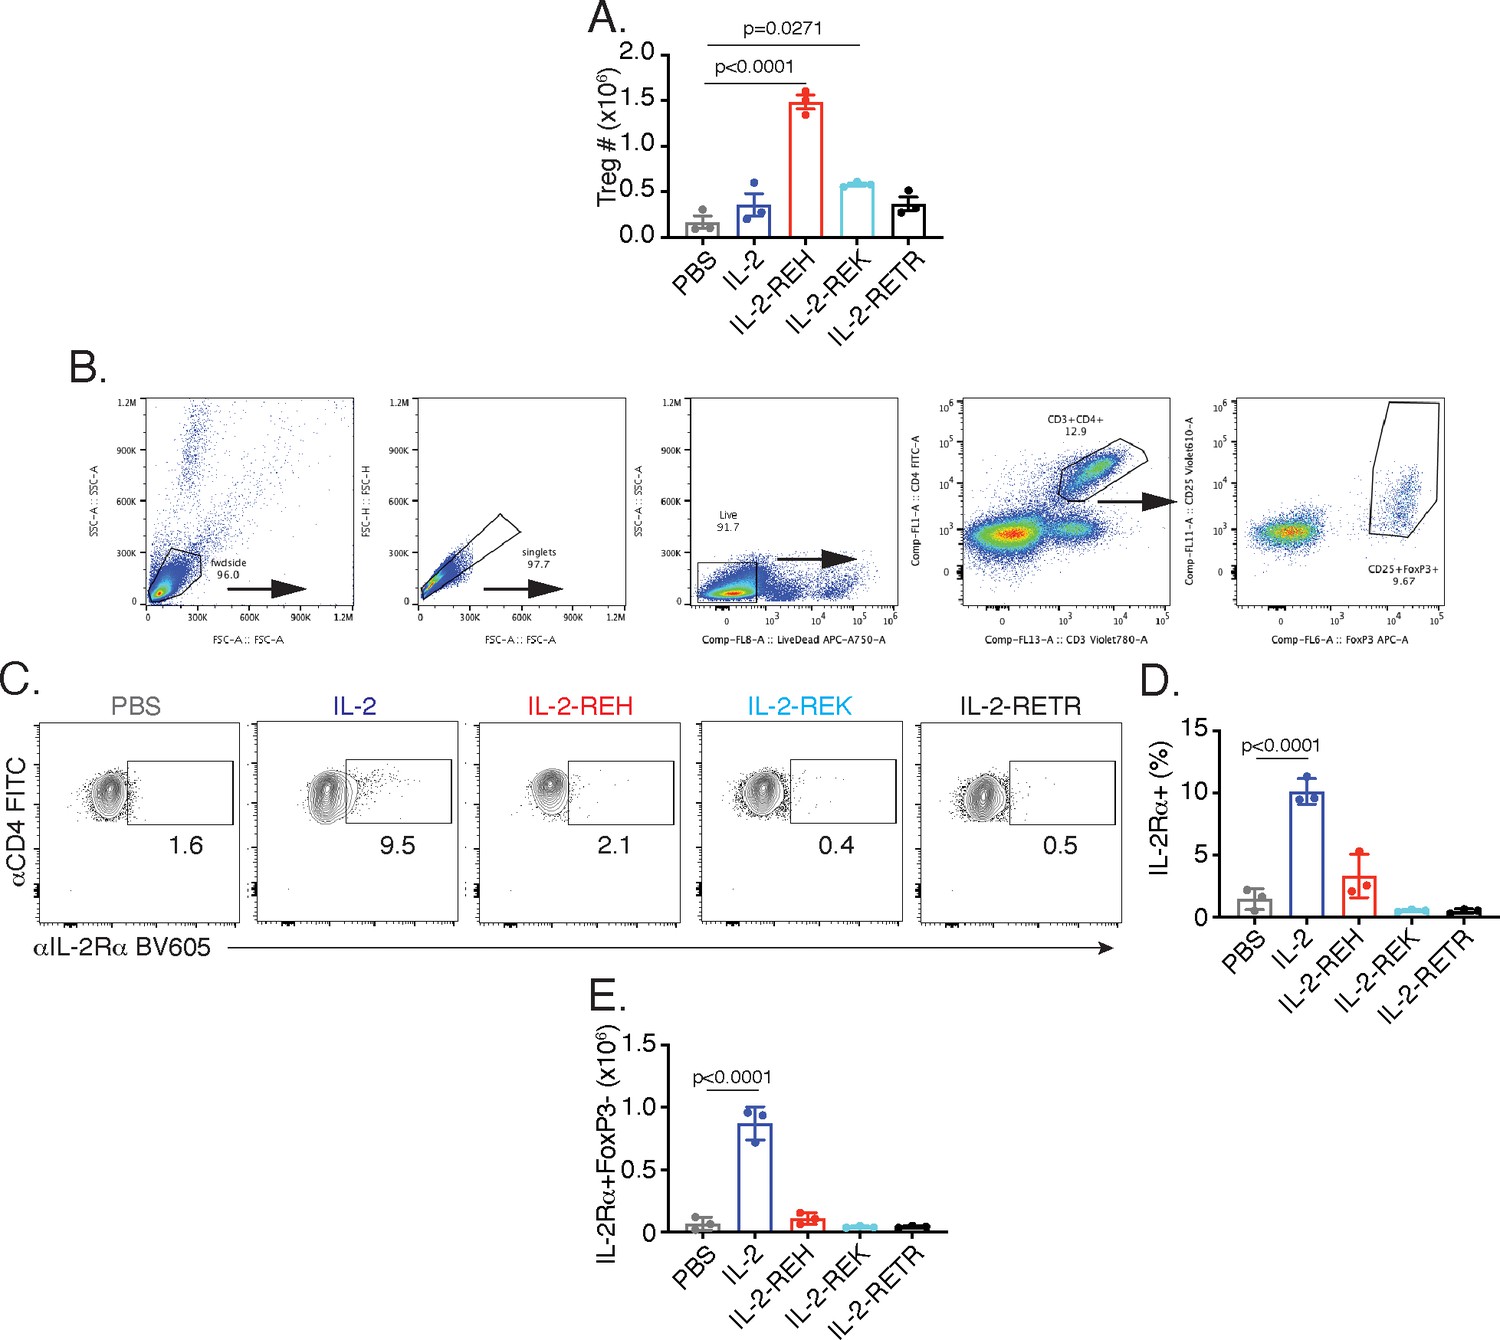
Quantification of CD4+ T cells following cytokine administration.
(A) Quantification of absolute Treg numbers in spleen. (B) Gating scheme to identify regulatory T cells. (C–E) IL-2 administration increases the frequency and number of IL-2Rα+ conventional T cells in spleen. (C) Representative flow cytometry plots showing IL-2Rα expression in CD4+FoxP3- T cells. (D) Quantification of data in C. (E) Absolute numbers of CD4+FoxP3-IL-2Rα+ T cells in spleen. Data are expressed as mean ± standard deviation and were analyzed by one-way ANOVA with Tukey’s multiple comparison relative to PBS, n = 3 mice per group.
Figure 2—figure supplement 3
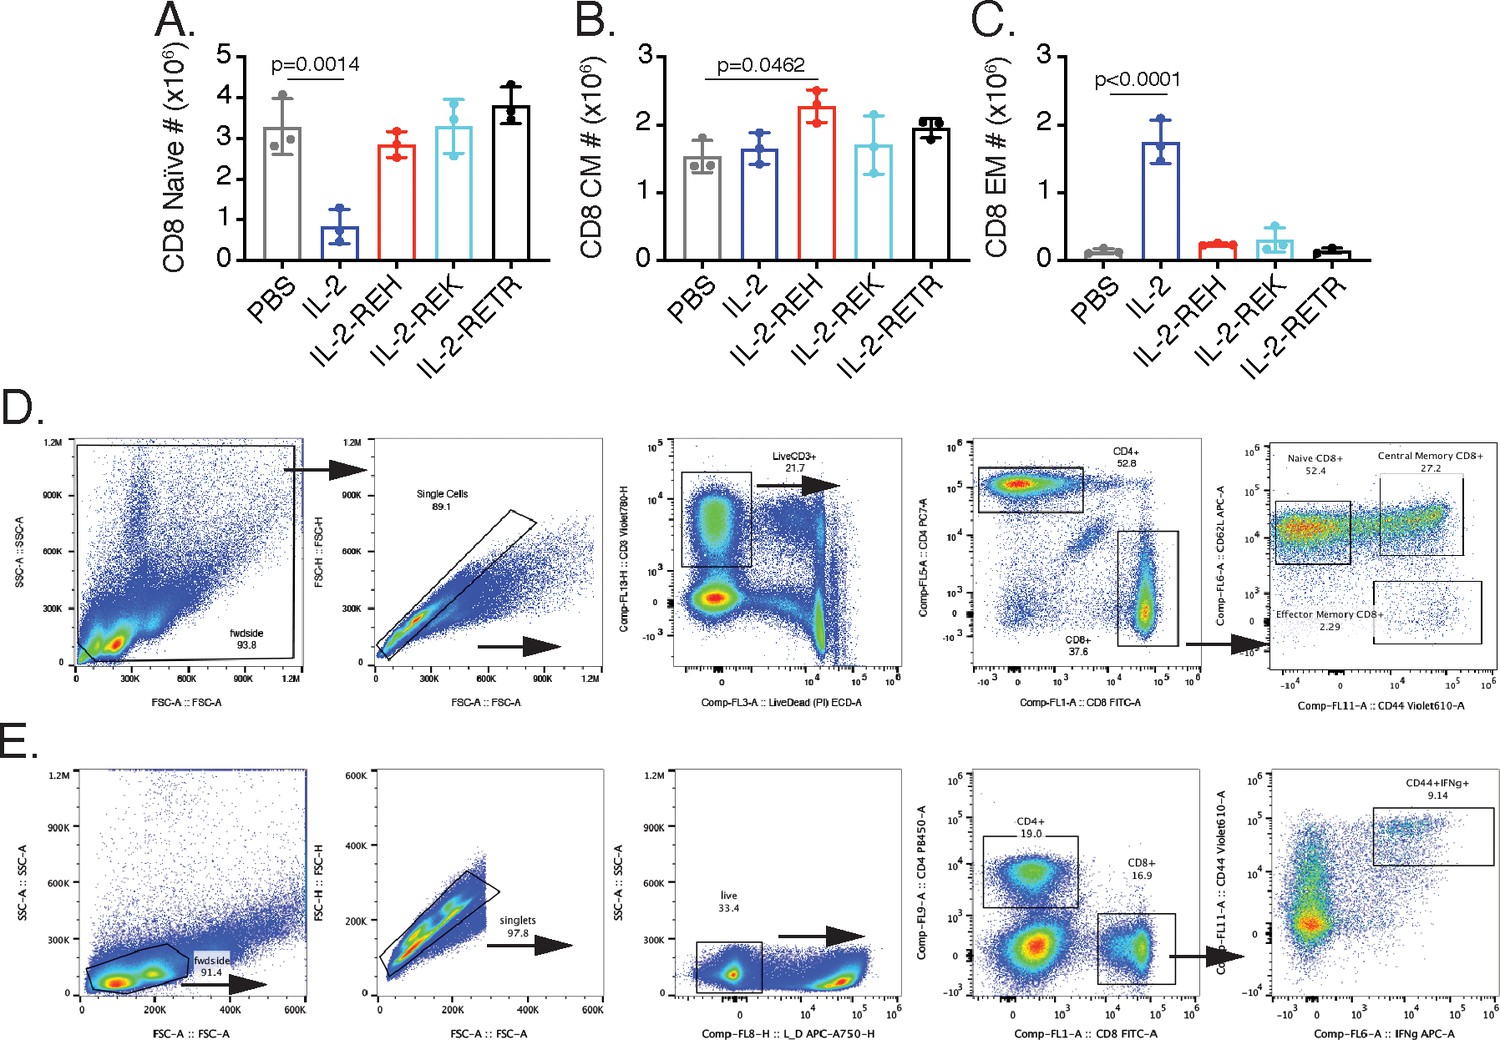
Analysis of CD8+ T cell phenotype and IFNγ production following cytokine treatment.
(A–C) Quantification of absolute numbers for naïve, central memory (CM), and effector memory (EM) CD8+ T cells following cytokine treatment. Data were analyzed by one-way ANOVA with Tukey’s multiple comparison relative to PBS, n = 3 mice per group. (D) Gating scheme for CD8+ T cell memory phenotype analysis. (E) Gating scheme to identify IFNγ producing CD8+ T cells from lymph nodes following phorbol 12-myristate 13-acetate (PMA)-ionomycin recall.
Figure 3 with 1 supplement
IL-2-REH increases Treg frequency via selective proliferation of Foxp3+ cells.
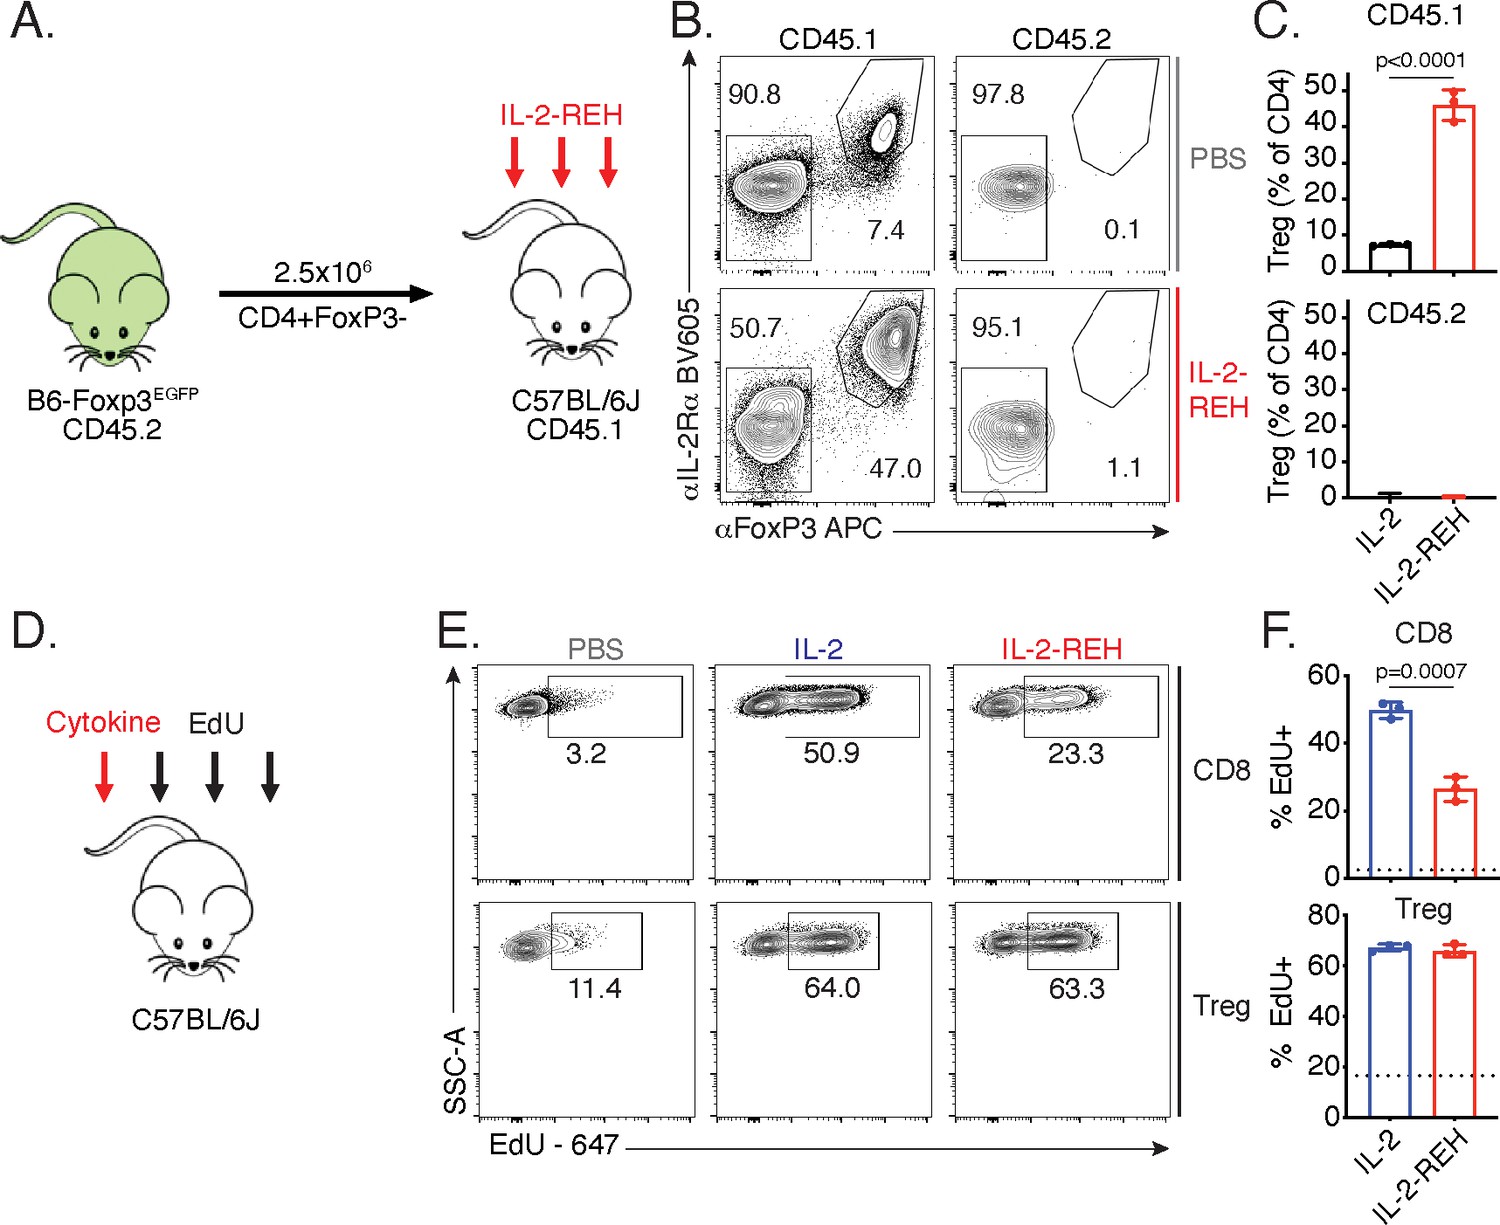
(A–C) Increased frequency of Tregs in IL-2-REH-treated mice is not the result of differentiation from conventional CD4+ T cells. (A) Schematic of experimental design. Conventional CD4+ T cells from B6-Foxp3EGFP mice (CD45.2) were transferred to congenic recipients (CD45.1). Mice were treated with three 30 μg injections of IL-2-REH or PBS control on day 0, 3, and 6 prior to analysis on day 7. Flow cytometry plots (B) and quantification (C) of Treg frequencies. Tregs were defined as IL-2Rα+Foxp3+ and expressed as a percent of CD3+CD4+ T cells. For gating, see Figure 3—figure supplement 1A. (D–F) IL-2-REH induces proliferation of Tregs with reduced activity on CD8+ T cells relative to IL-2. (D) Schematic of proliferation tracking experiment. C57BL/6J mice were treated with a single 30 μg injection of cytokine on day 0 followed by EdU injections on day 0, 1, and 2 prior to analysis on day 3. Flow cytometry plots (E) and quantification (F) of EdU incorporation in Tregs (CD3+CD4+Foxp3+) and CD8+ T cells (CD3+CD8+). Dashed line indicates EdU incorporation in PBS-treated mice. For gating, see Figure 3—figure supplement 1B. Bar graphs show mean ± standard deviation of n = 3 mice per group. Groups were compared by unpaired t-test and data are representative of two independent experiments.
Figure 3—figure supplement 1
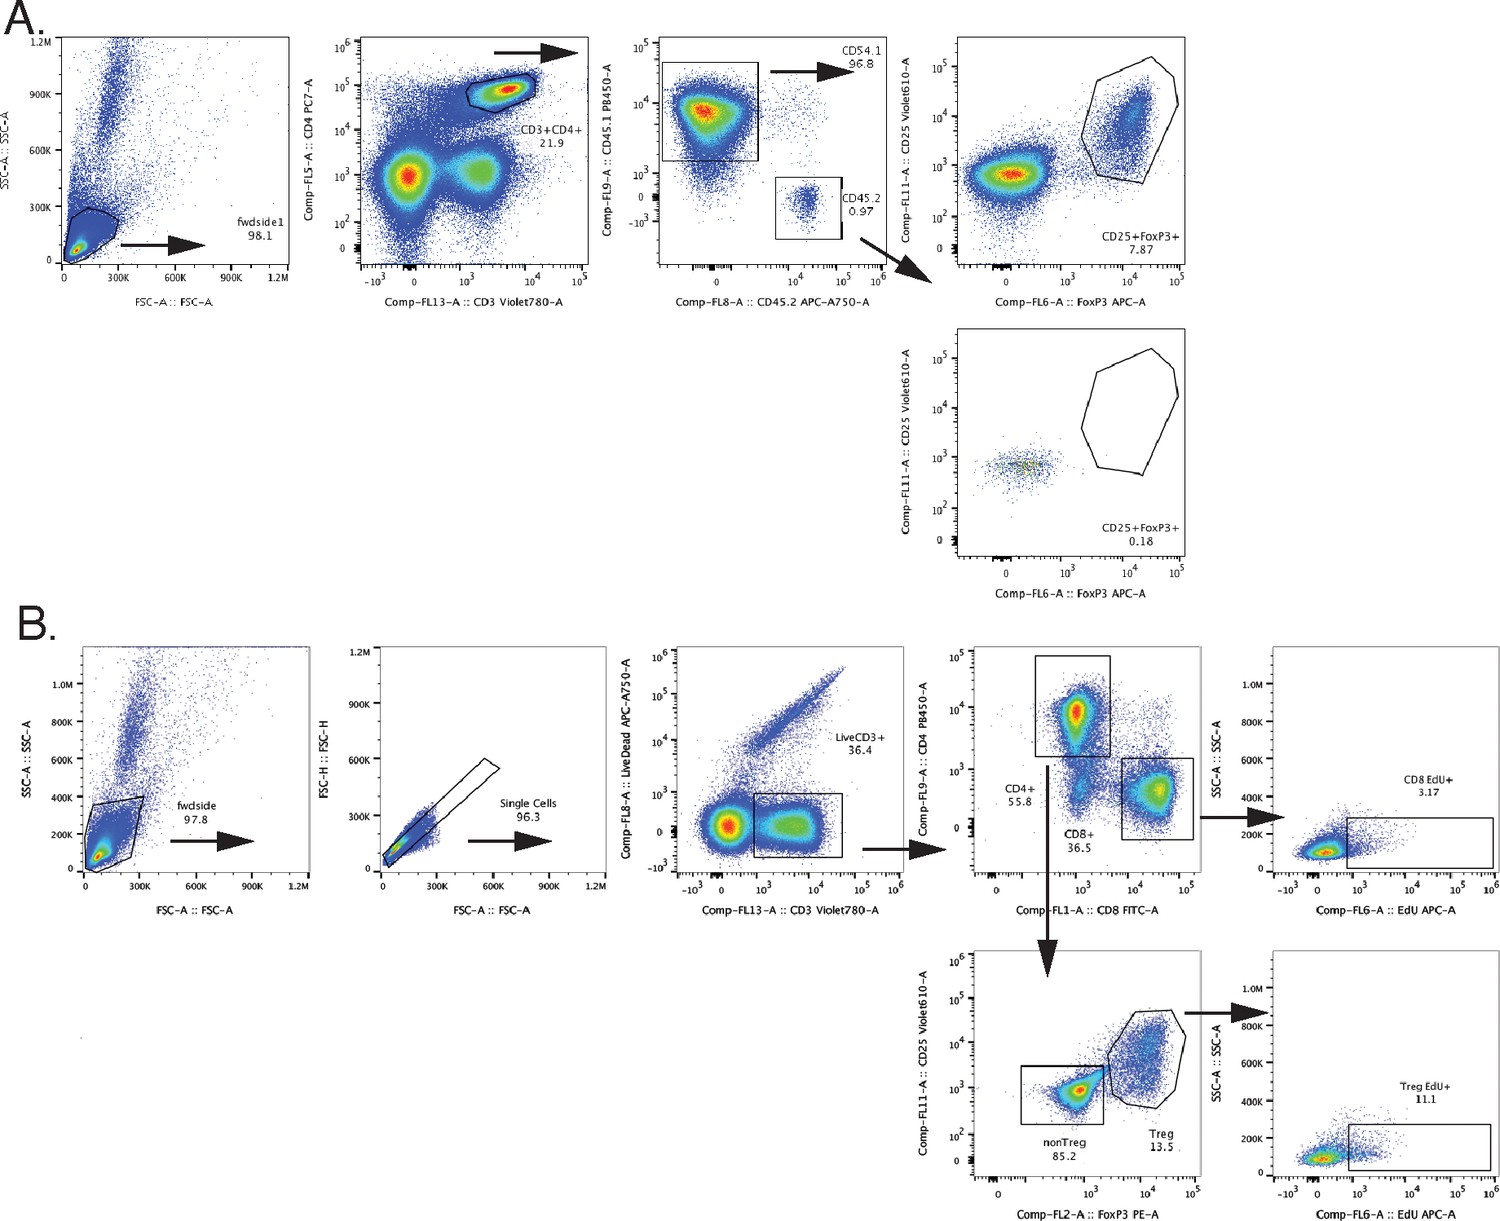
Representative gating schemes for adoptive transfer and proliferation tracking experiments.
(A) Adoptive transfer gating scheme to identify Tregs in recipient (CD45.1) and donor (CD45.2) compartments. (B) Gating schematic to assess EdU incorporation in CD8+ T cells and Tregs.
Figure 4
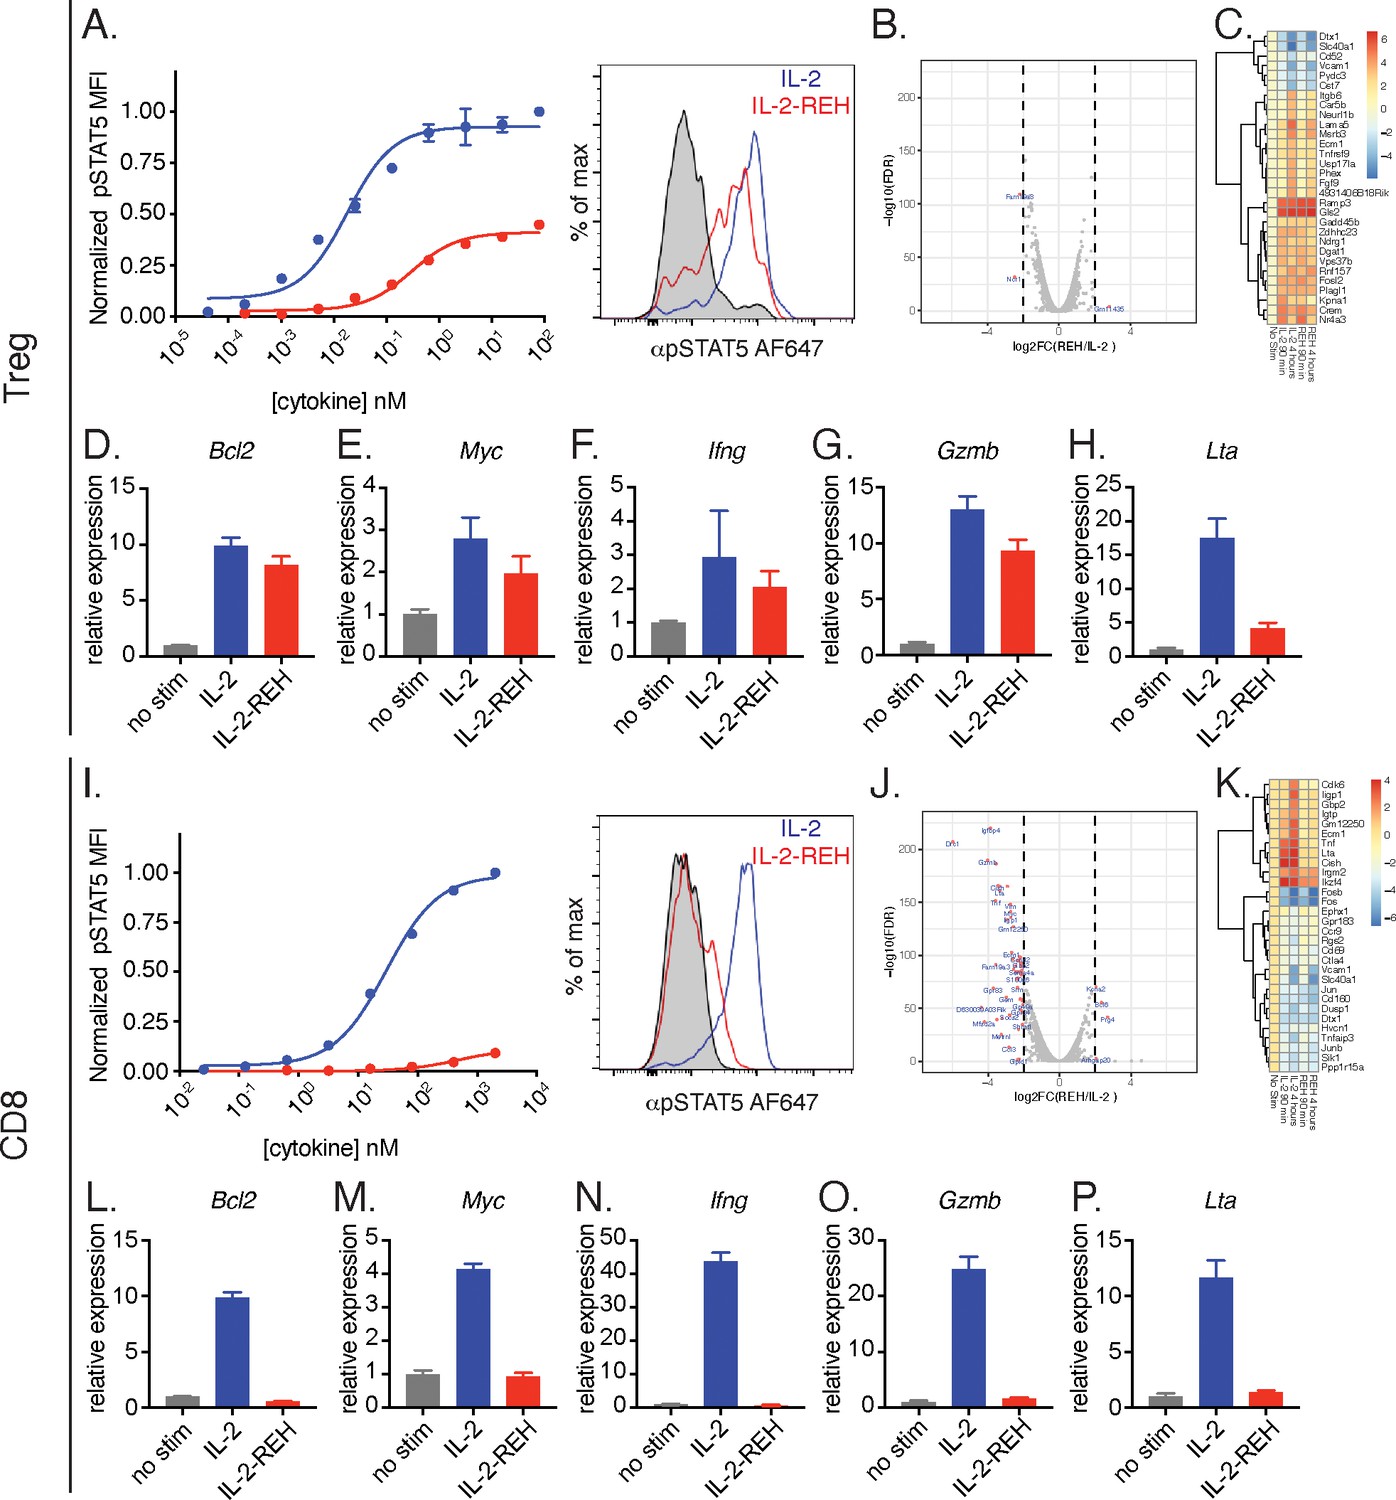
IL-2-REH selectively promotes signaling in Tregs with reduced activity on CD8+ T cells relative to IL-2.
(A) IL-2-REH promotes STAT5 phosphorylation in regulatory T cells. Dose-response curve (left) and histogram at 80 nM (right) showing STAT5 phosphorylation in Tregs following a 20 min cytokine stimulation. Dose-response curves show mean ± standard deviation of duplicate wells. MFI, mean fluorescence intensity. (B–C) IL-2 and IL-2-REH produce similar transcriptional profiles in regulatory T cells. Purified Tregs from B6-Foxp3EGFP mice were stimulated with 200 nM cytokine for 90 min or 4 hr prior to RNA-seq. (B) Volcano plot of differentially expressed genes in Tregs following 4 hr stimulation with IL-2 or IL-2-REH. (C) Heatmap showing the top 30 differentially regulated genes (sorted by FDR) between unstimulated and IL-2-treated Tregs. Expression was normalized to that of unstimulated Tregs to show cytokine-induced changes. (D–H) Quantitative polymerase chain reaction (qPCR) of IL-2 regulated genes in Tregs following a 4 hr stimulation with 200 nM cytokine. For quantification, cycle threshold (Ct) values were normalized to expression of Gapdh and expressed as fold change relative to unstimulated cells. Bar graphs show mean ± standard deviation of triplicate measurements. (I) IL-2-REH fails to induce STAT5 phosphorylation in CD8+ T cells. Dose-response (left) and histogram at 2 μM (right) of STAT5 phosphorylation in ex vivo CD8+ T cells following a 20 min cytokine stimulation. Dose-response curves show mean ± standard deviation of duplicate wells. (J–K) IL-2 and IL-2-REH induce distinct transcriptional profiles in CD8+ T cells. Purified CD8+ T cells were stimulated with 200 nM cytokine for 90 min or 4 hr prior to RNA-seq. (J) Volcano plot showing differentially expressed genes in CD8+ T cells following 4 hr stimulation with IL-2 or IL-2-REH. (K) Heatmap showing the top 30 differentially regulated genes between unstimulated and IL-2-treated CD8+ T cells. Expression was normalized to that of unstimulated CD8+ T cells. (L–P) qPCR of IL-2 regulated genes in CD8+ T cells following a 4 hr stimulation with 200 nM cytokine. Data were analyzed as in D-H. Results are representative of two or more independent experiments.
Figure 5 with 1 supplement
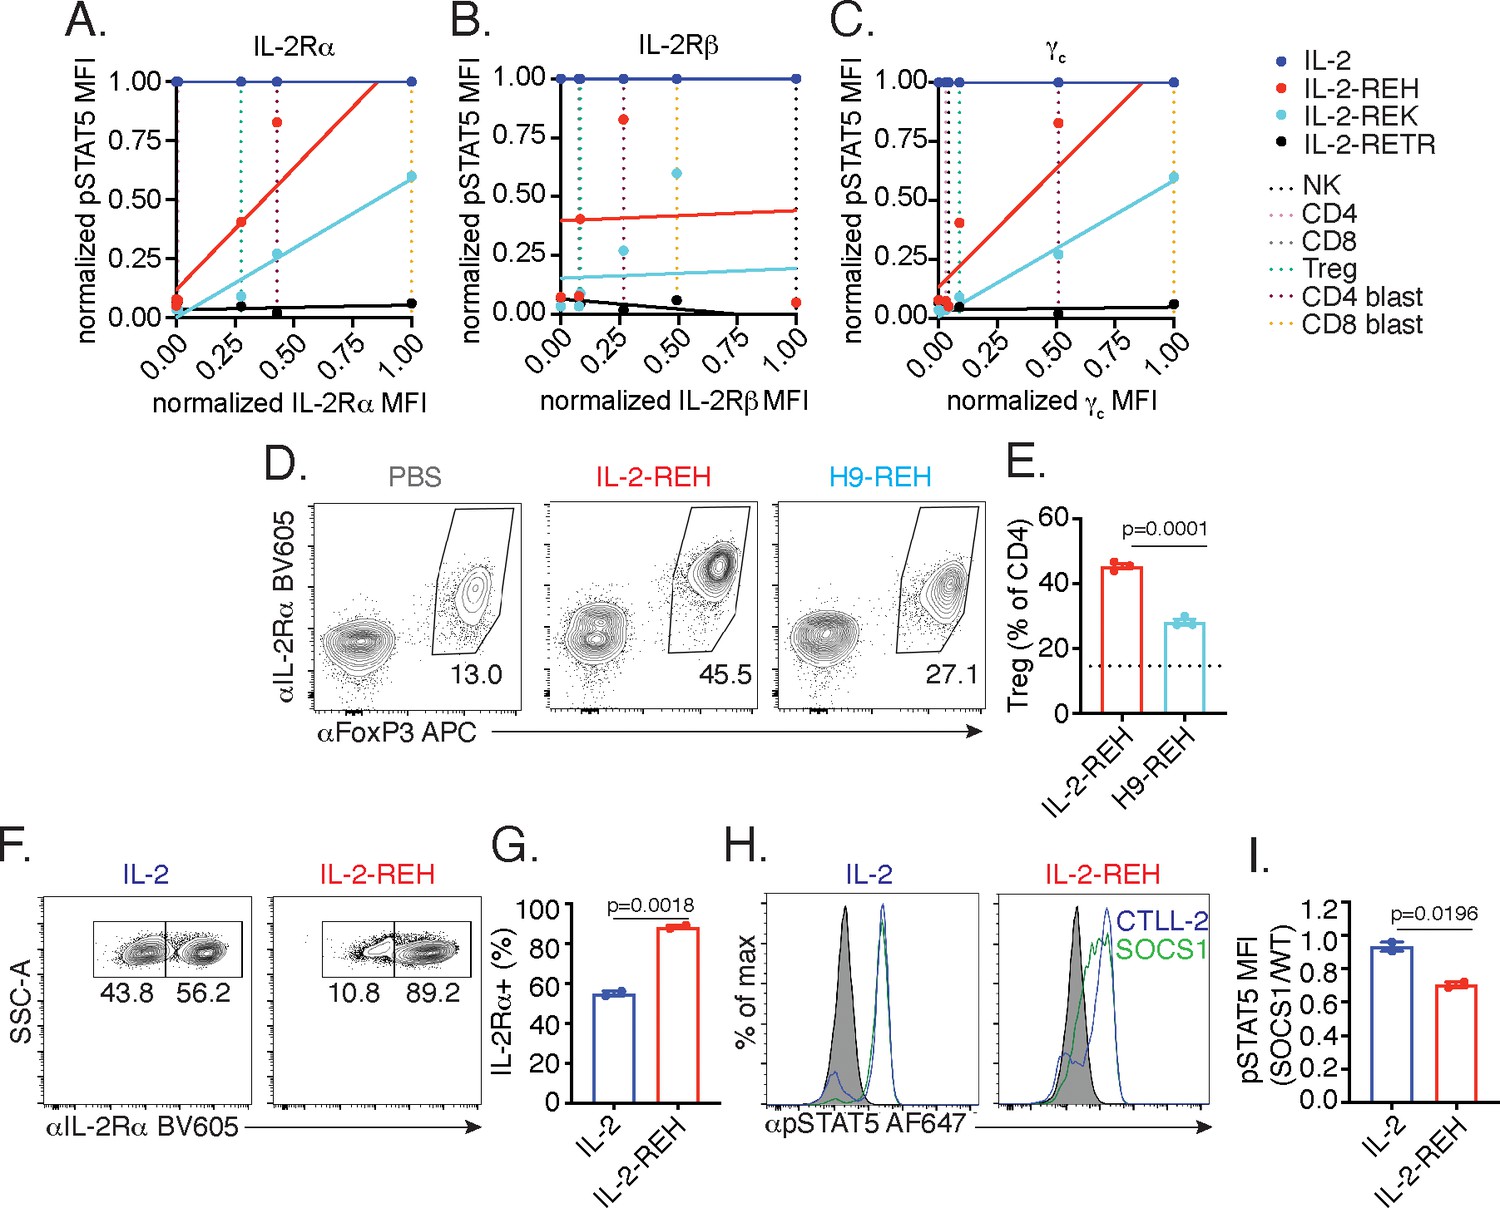
IL-2-REH exploits intrinsic differences in IL-2 signaling to elicit cell type-specific activity.
(A–C) IL-2 partial agonist activity depends on IL-2Rα and γc expression. Correlation plots showing STAT5 phosphorylation and receptor expression in NK cells, CD4+ T cells, CD8+ T cells, and Tregs. Dashed lines represent receptor expression normalized to the highest and lowest expressing cell types. pSTAT5 MFI at saturating cytokine concentration was normalized to stimulation with IL-2. See also Figure 5—figure supplement 1. (D–E) IL-2Rβ affinity regulates cell type selectivity of IL-2-REH. C57BL/6J mice were dosed with three 30 μg intraperitoneal injections of IL-2-REH or H9-REH diluted in PBS on day 0, 3, and 6 followed by analysis on day 7. Flow cytometry plots (D) and quantification (E) of Treg frequency expressed as a percent of CD3+CD4+ T cells. Bar graphs show mean ± standard deviation of n = 3 mice per group. Dashed line represents Treg frequency in PBS-treated mice. Groups were compared using an unpaired t-test. (F–G) IL-2Rα expression controls proliferation in response to IL-2-REH. Wild-type and IL-2Rα-/- CTLL-2 cells were mixed at 1:1 ratio and cultured in the presence of 200 nM IL-2 or IL-2-REH for three days prior to quantification of IL-2Rα expression by flow cytometry. Bar graph shows mean ± standard deviation of duplicate wells. Groups were compared using an unpaired t-test. (H–I) IL-2-REH signaling is more sensitive to negative regulation by suppressor of cytokine signaling 1 (SOCS1). SOCS1-p2a-eGFP expressing CTLL-2s were mixed with wild-type CTLL-2 cells, rested overnight, and stimulated with 1 μM IL-2 or IL-2-REH for 30 min prior to fixation, permeabilization, and detection of pSTAT5 by phosphoflow cytometry. Wild-type and SOCS1 overexpressing cells were gated on the basis of GFP expression. (H) Histograms showing pSTAT5 staining in wild-type (blue) and SOCS1 expressing (green) CTLL-2 cells. (I) pSTAT5 staining in SOCS1 expressing cells expressed as a ratio to pSTAT5 staining in wild-type CTLL-2s. Bar graph shows mean ± standard deviation of duplicate wells. Groups were compared using an unpaired t-test. MFI, mean fluorescence intensity. Results are representative of at least two independent experiments.
Figure 5—figure supplement 1
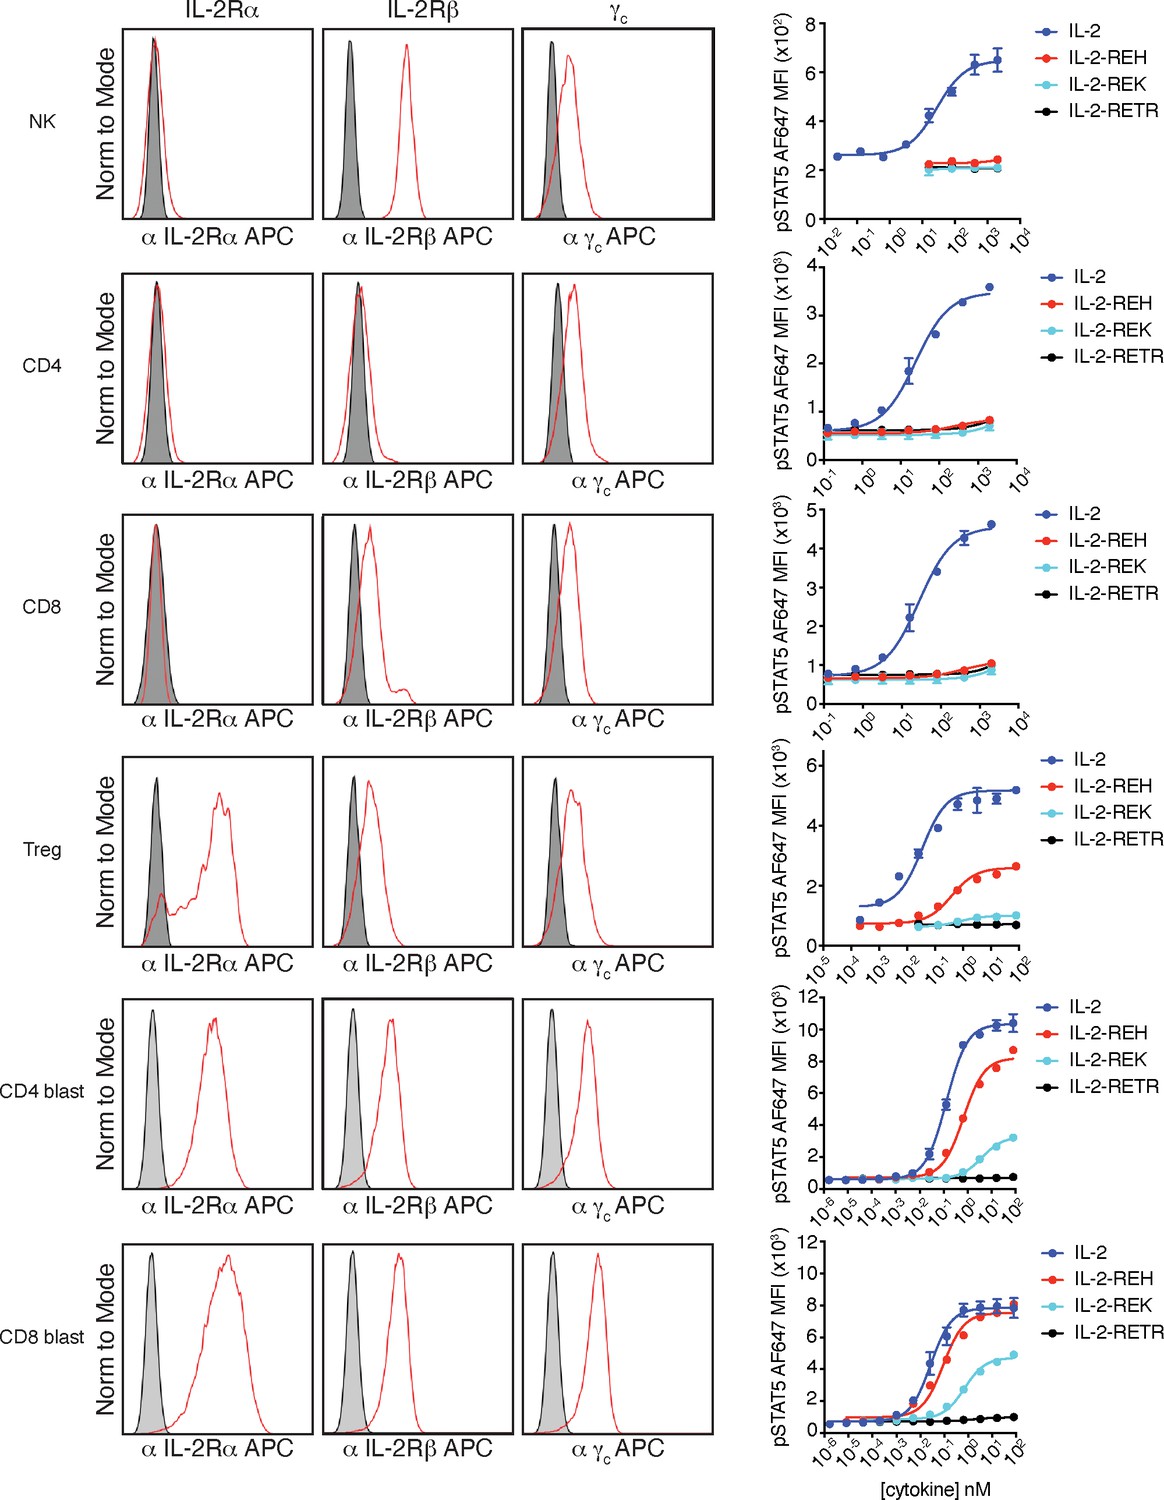
IL-2 receptor staining and signaling in NK cells and T cells.
Analysis of IL-2 receptor expression on NK cells and T cells. Histograms of IL-2Rα (CD25), IL-2Rβ (CD122), and γc (CD132) expression in red compared to fluorescence minus one (FMO) control shown in gray. For receptor staining, a single cell suspension of spleen and lymph nodes from B6-Foxp3EGFP mice was stained with a cell surface panel to identify NK cells (CD3-NK1.1+), CD4+ T cells (CD3+CD4+Foxp3-), CD8+ T cells (CD3+CD8+), and Tregs (CD3+CD4+Foxp3+). For blasts, a single cell suspension of spleen and lymph nodes from B6-Foxp3EGFP mice was stimulated with 2.5 μg/mL plate bound αCD3, 5 μg/mL αCD28, and 100 IU/mL IL-2 for 2 days and rested overnight in complete media without IL-2. For NK cell signaling, magnetic-activated cell sorting (MACS) isolated NK cells from C57BL/6J mice were combined with CellTrace Violet (CTV) loaded carrier cells, stimulated for 20 min with cytokine prior to fixation, permeabilization, and staining for pSTAT5. NK cells were gated as CTV–. For T cell signaling, spleen and lymph nodes from B6-Foxp3EGFP mice were pre-stained with a T cell phenotyping panel. Cells were stimulated for 20 min before fixation, permeabilization, and staining for pSTAT5. T cells were gated as CD4+ (CD3+CD4+Foxp3–), CD8+ (CD3+CD8+), or Treg (CD3+CD4+Foxp3+) based on cell surface markers and GFP expression. Data are representative of two or more independent experiments.
Figure 6 with 3 supplements
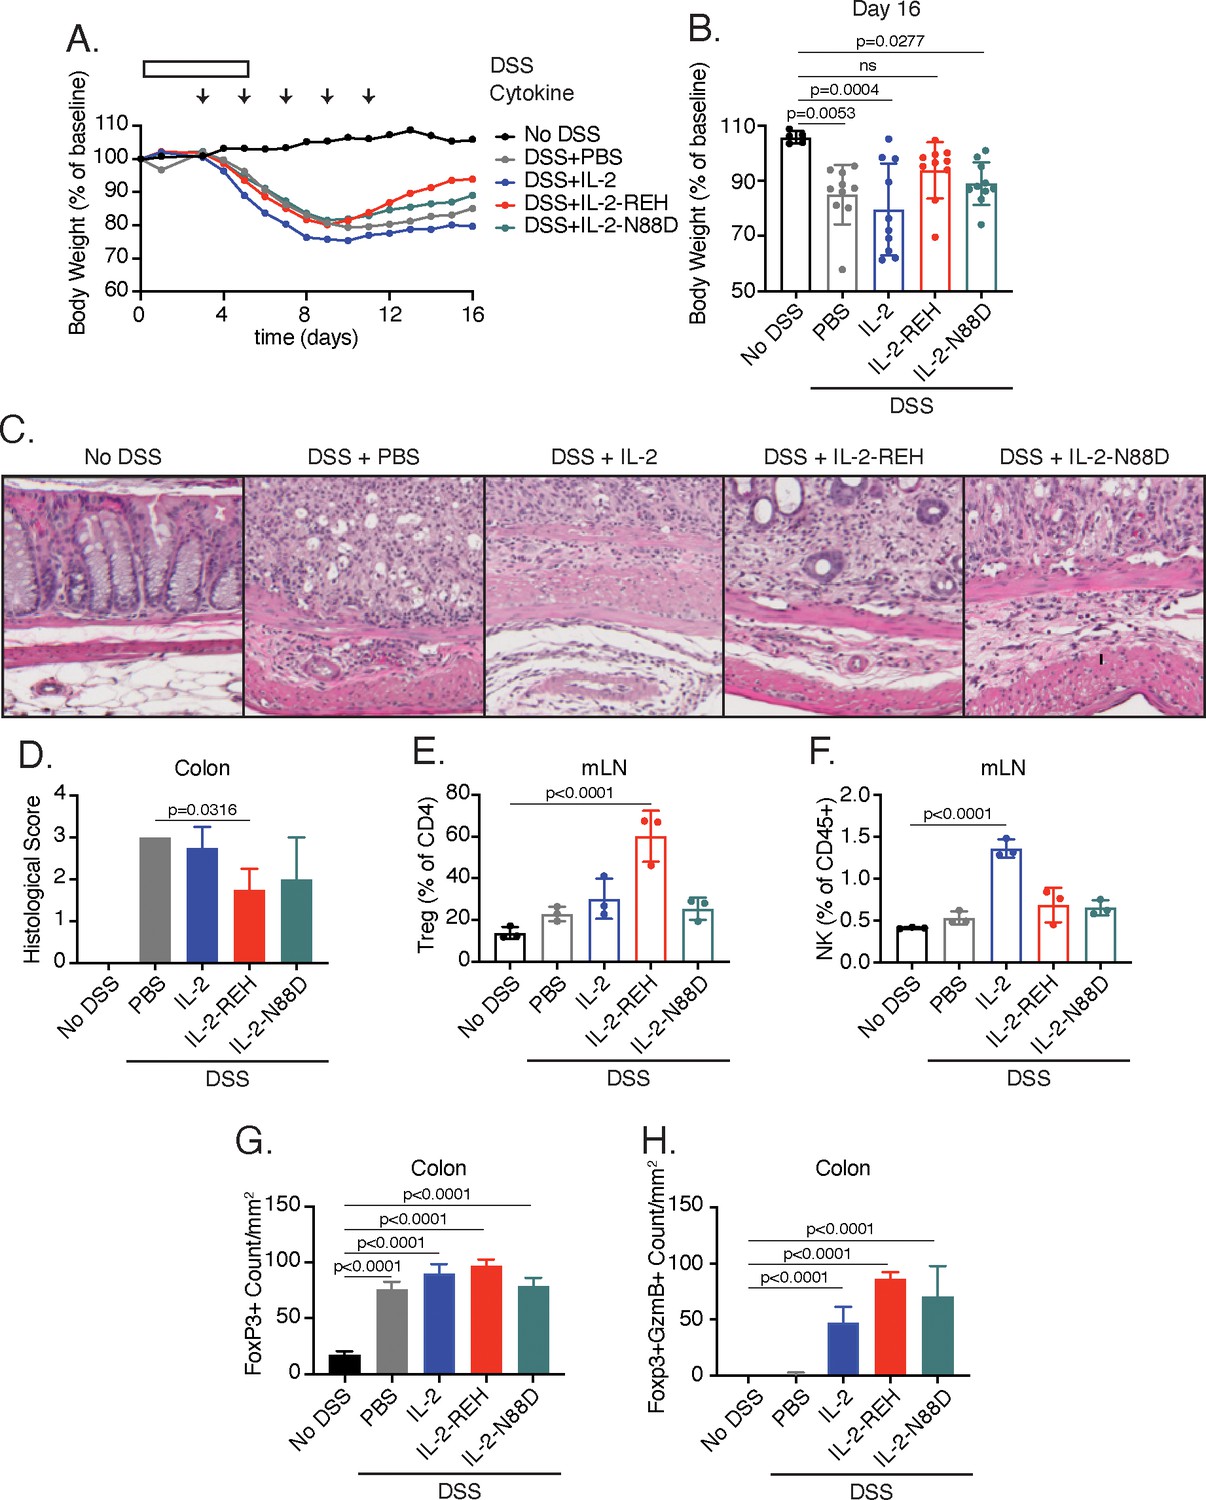
IL-2-REH enhances recovery from DSS-induced colitis.
C57BL/6J mice were placed on 3–3.5% dextran sulfate sodium (DSS in drinking water for 6 days. Starting on day 3, mice received subcutaneous injections of PBS (n = 10), 5 μg IL-2 (n = 10), 5 μg IL-2-REH (n = 10) or 5.3 μg IL-2-N88D (n = 10) every other day for 10 days. Data were compared to mice maintained on drinking water without DSS (n = 5). (A) Mean body weight measurements following 3% DSS induction. Weights were normalized to body weight on day 0. For body weight curves of individual mice, see Figure 6—figure supplement 3A–E. (B) IL-2-REH enhances recovery from DSS-induced colitis. Comparison of body weights on day 16. If mice died prior to day 16, the final body weight measurement was used for analysis. For survival curve, see Figure 6—figure supplement 3F. Bar graphs show mean ± standard deviation and were analyzed by one-way ANOVA relative to no DSS condition, multiple comparisons were corrected using Dunnett’s test. Data are representative of two independent experiments. (C-D) IL-2-REH attenuates DSS-induced colon damage. (C) Representative hematoxylin and eosin (H and E) staining of distal colon sections on day 13. (D) Quantification of disease score from H&E staining of distal colon. Mice received no DSS (n = 3) or 3.5% DSS with PBS (n = 4), 5 μg IL-2 (n = 4), 5 μg IL-2-REH (n = 4), or 5.3 μg IL-2-N88D (n = 3). Groups were compared by one-way ANOVA with Tukey’s multiple comparisons. (E) IL-2-REH treatment increases the frequency of regulatory T cells in mesenteric lymph nodes (mLNs). Flow cytometry analysis of mLN cellularity was performed 10 days post 3% DSS induction. Bar graphs show mean ± standard deviation of n = 3 mice per group. Data were analyzed by one-way ANOVA with Tukey’s multiple comparisons. (F) IL-2 increases NK cell frequency in the mesenteric lymph nodes, analyzed as in E. (G-H) Quantification of colon infiltrating Tregs by immunohistochemistry (IHC). Bar graphs show mean ± standard deviation of colon sections from n = 3 mice per group. (G) DSS increases Treg infiltration in colon. Quantification of Tregs by IHC staining for Foxp3 in colon. (H) Cytokine treatment enhances Treg activation in colon. Quantification of Foxp3+GzmB+ cells by IHC. Groups were compared using one-way ANOVA with Tukey’s multiple comparisons relative to untreated mice.
Figure 6—figure supplement 1
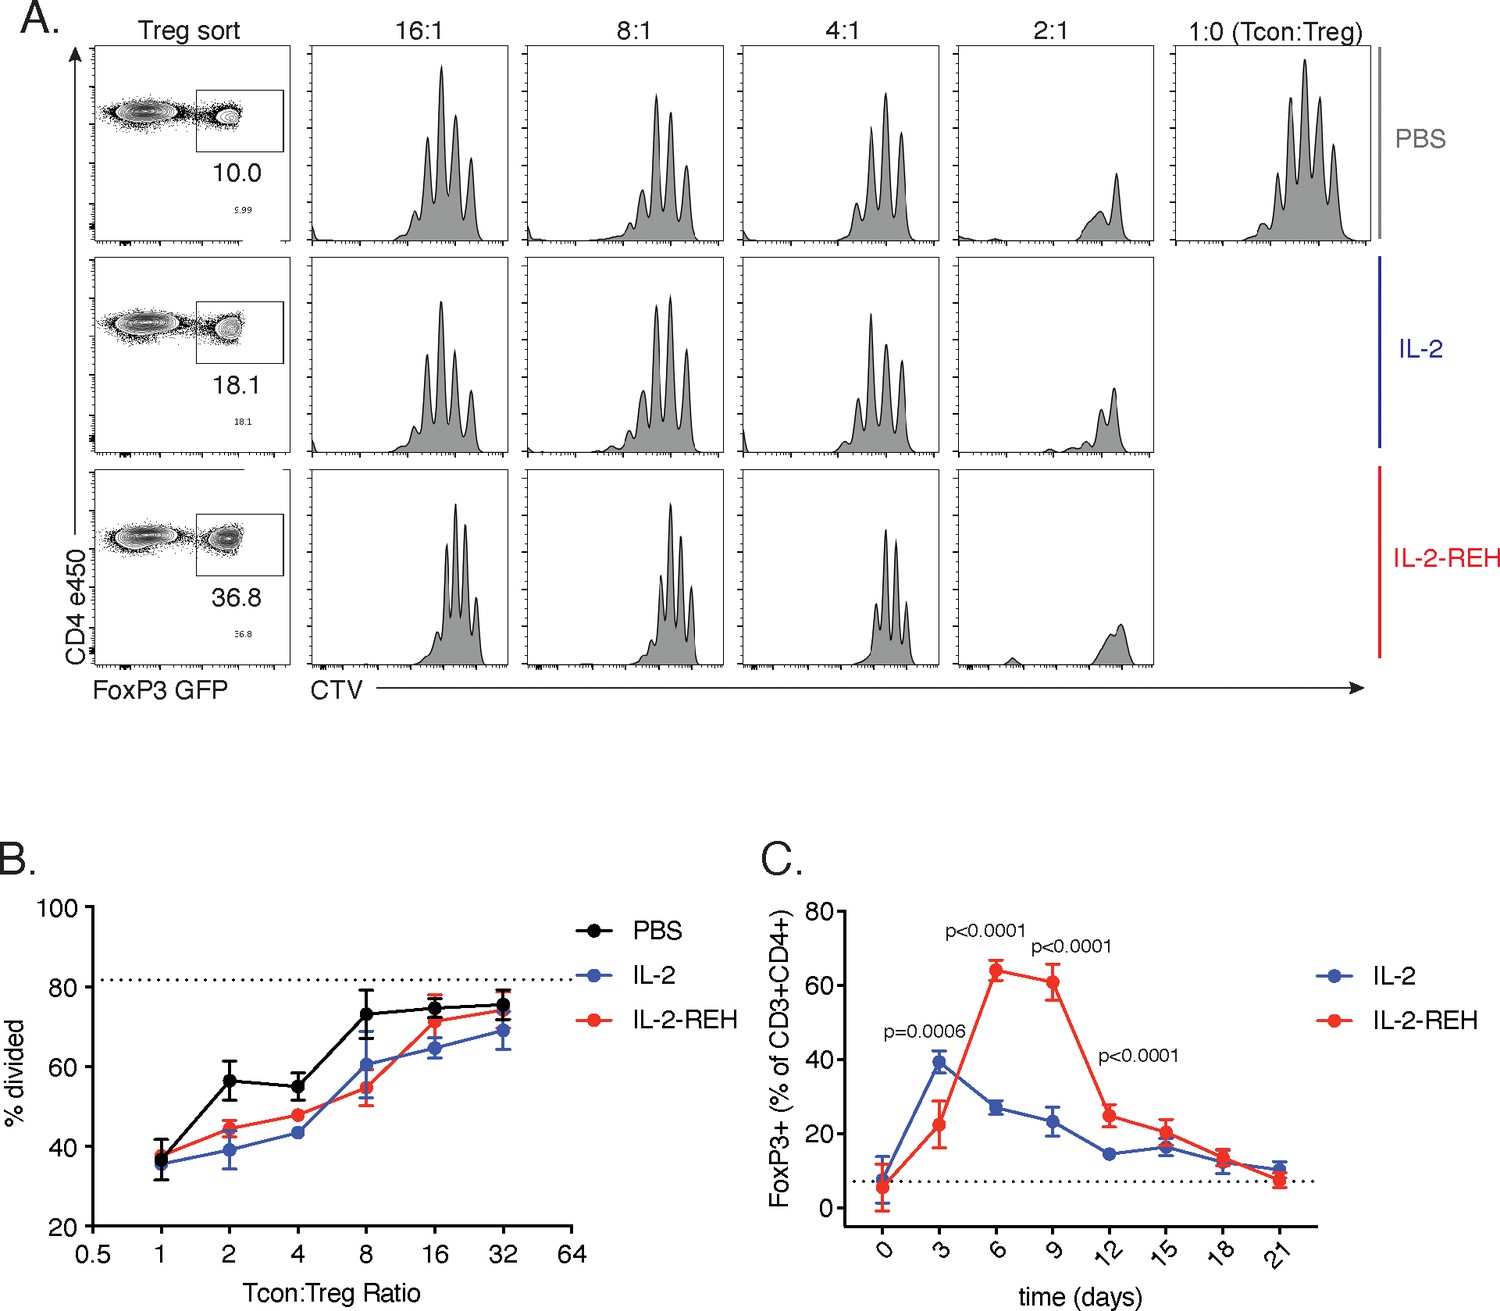
In vitro suppression and kinetic analysis of IL-2-REH expanded Tregs.
(A-B) Suppression of conventional CD4+ T cell proliferation by Tregs from cytokine-treated mice. Tregs from PBS, IL-2, or IL-2-REH-treated B6-Foxp3EGFP mice were isolated by fluorescence-activated cell sorting (FACS) and co-cultured with CellTrace Violet (CTV) labeled CD4+ conventional T cells from PBS-treated mice in the presence of αCD3αCD28 coated beads for 3 days. Proliferation of conventional cells was assessed by CTV dilution. (A) Contour plots of Treg sorting scheme. Histograms of CTV dilution in Tcons cultured with varying ratios of Tregs as indicated. (B) Quantification of Tcon proliferation. The dashed line represents the frequency of divided cells in the absence of Tregs. Data are shown as mean ± standard deviation of triplicate wells. Data are representative of two independent experiments. (C) Kinetics of Treg expansion in response to cytokine treatment. B6-Foxp3EGFP mice were administered 30 μg of MSA-IL-2 or MSA-IL-2-REH on day 0, 3, and 6. The frequency of Foxp3EGFP+ cells was tracked every three days in blood. Dashed line represents Foxp3EGFP+ frequency in untreated mice. Data were analyzed by unpaired t-test with multiple corrections using the Holm-Šidák method. Data are expressed as mean ± standard deviation of n = 5 mice per group and are representative of a single experiment.
Figure 6—figure supplement 2
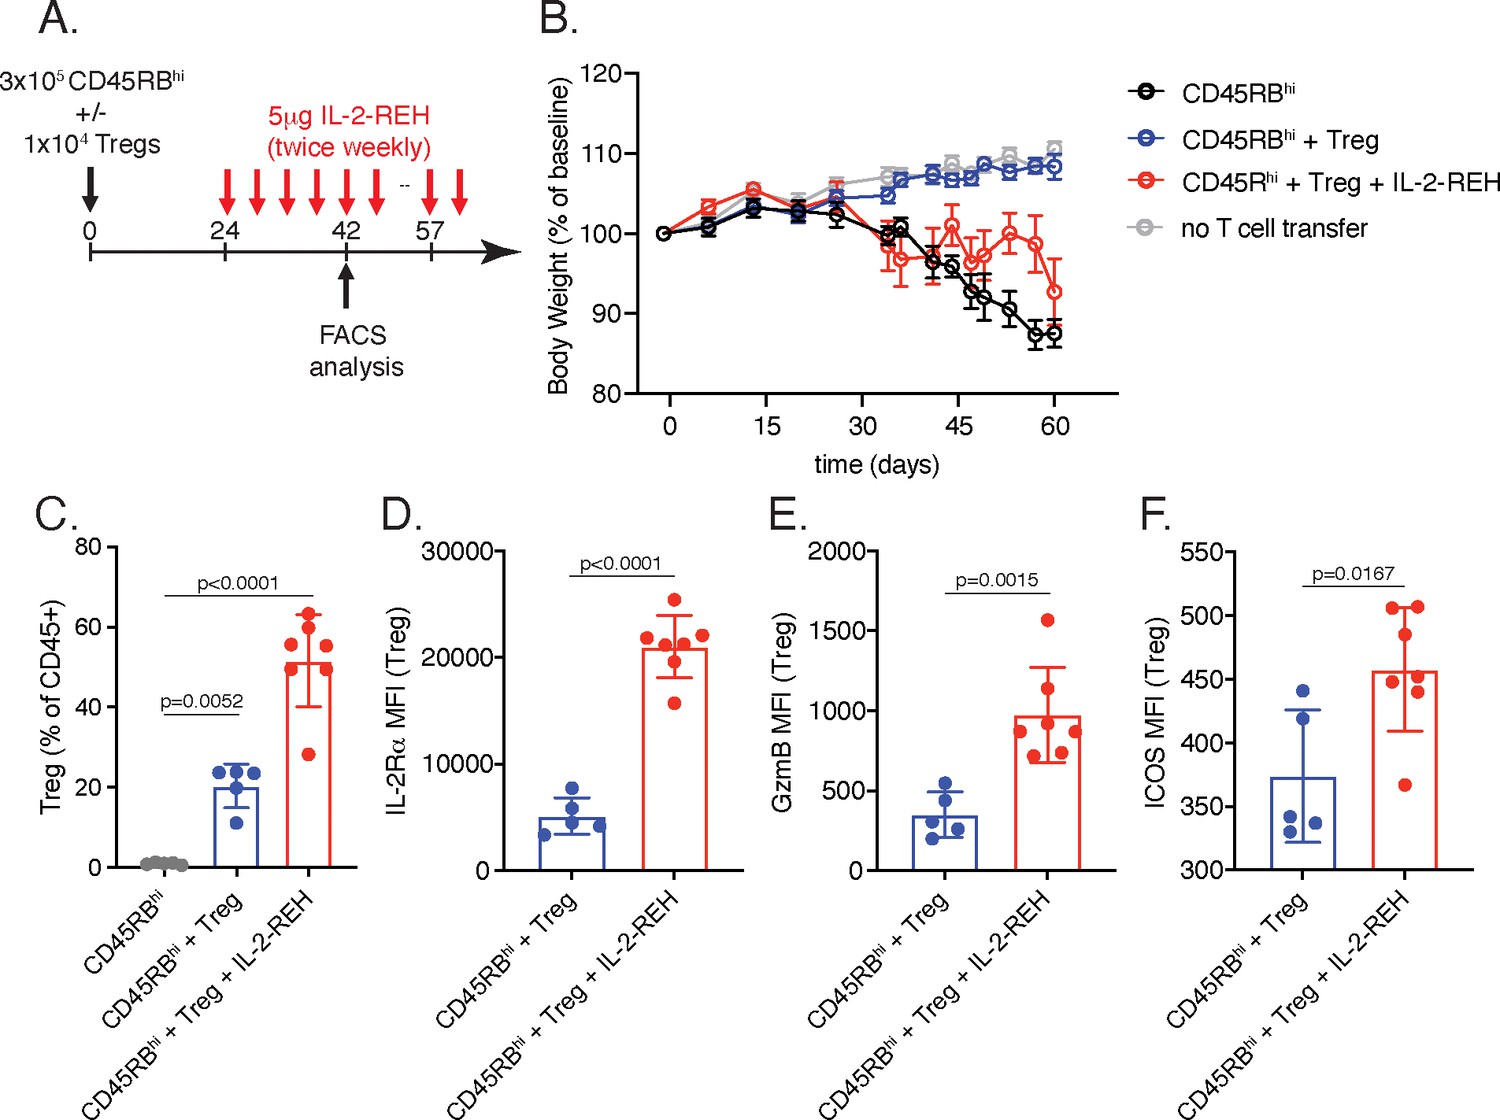
Effects of IL-2-REH on T cell transfer colitis.
(A) Schematic of T cell transfer colitis. On day 0, 3 × 10⁵ naïve CD4+CD45 RBhi T cells were transferred into C.B-17 scid mice with or without 1 × 10⁴ Tregs. Starting on day 24 at the onset of weight loss, mice were administered 5 μg IL-2-REH twice weekly for 3 weeks. Treg frequency and activation status was monitored in blood on day 42 and a final week of cytokine treatment was begun on day 57. (B) Body weight measurements from T cell transfer recipients. Body weight was monitored weekly and expressed as mean ± standard error for n = 8 (CD45RBhi and CD45RBhi+Treg), n = 7 (CD45RBhi+Treg+IL-2-REH), and n = 5 (negative control) mice, respectively. (C) IL-2-REH expands Tregs in the context of T cell colitis. (C) Frequency of Foxp3+Tregs in blood on day 42. Data are shown as mean ± standard deviation and were compared by one-way ANVOA with Tukey’s post hoc test. (D–F) IL-2-REH enhances activation of Tregs during T cell colitis. Expression of IL-2Rα (D), GzmB (E), and ICOS (F) in Tregs was monitored by flow cytometry in the blood on day 42. Data are shown as mean ± standard deviation and were compared by unpaired t-test.
Figure 6—figure supplement 3

Weight loss and survival in DSS-induced colitis.
(A–E) Weight loss plots for individual mice following DSS treatment. (F) Survival curves for mice administered DSS and cytokine as indicated.
Author response image 1
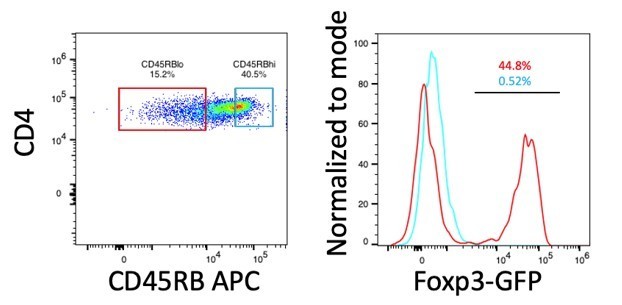
Expression of Foxp3 in CD45RBhi and CD45RBlo cells.
CD4+ T cells (CD3+CD4+) from spleen of B6-Foxp3EGFP mice were gated on CD45RB expression based on a previously established protocol (Ostanin et al., 2009). Histograms and frequencies for CD45RBhi cells are shown in cyan, histograms and frequencies for CD45RBlo cells are shown in red.
Author response image 2
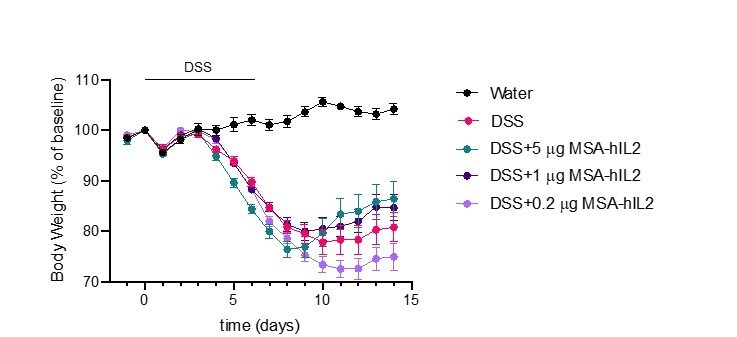
Effects of IL-2 dose on DSS-induced colitis.
C57BL/6J mice were placed on 3.5% DSS in drinking water for 6 days. Starting on day 4, mice received subcutaneous injections of PBS (n=10), 5mg IL-2 (n=10), 1mg IL-2 (n=10) or 0.2mg IL-2 (n=10) every other day for 3 doses. Data were compared to mice maintained on drinking water without DSS (n=5). Data are expressed as mean +/- SEM.
Author response image 3
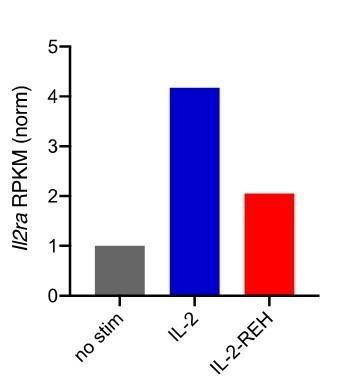
Expression of Il2ra in CD8+ T cells following 4-hour stimulation with 200nM cytokine.
Reads per kilobase per million (RPKM) were normalized to unstimulated CD8+ T cells.
Author response image 4

Expression of Socs1 in Tregs and CD8+ T cells following 4-hour stimulation with 200nM cytokine.
Reads per kilobase per million (RPKM) were normalized to unstimulated cells.
Tables
Appendix 1—key resources table
| Reagent type (species) or resource | Designation | Source or reference | Identifiers | Additional information |
|---|---|---|---|---|
| Gene (M. musculus) | Serum Albumin | Uniprot | P07724 | |
| Gene (Homo-sapiens) | Interleukin 2 (IL-2) | Uniprot | P60568 | |
| Gene (Homo-sapiens) | Interleukin two receptor beta (IL-2Rβ) | Uniprot | P14784 | |
| Gene (Homo-sapiens) | Common gamma chain (γc) | Uniprot | P31785 | |
| Gene (M. musculus) | Suppressor of cytokine signaling 1 (SOCS1) | Uniprot | O35716 | |
| Strain, strain background (M. musculus) | Female C57BL/6J | The Jackson Laboratory | JAX:000664 | |
| Strain, strain background (M. musculus) | Female B6.SJL-Ptprca Pepcb/BoyJ | The Jackson Laboratory | JAX:002014 | |
| Strain, strain background (M. musculus) | Female B6.Cg-Foxp3tm2Tch/J | The Jackson Laboratory | JAX:006772 | |
| Strain, strain background (M. musculus) | Female C57BL/6 | Taconic | C57BL/6NTac | |
| Strain, strain background (M. musculus) | Female BALB/c | Taconic | BALB/cAnNTac | |
| Strain, strain background (M. musculus) | Female C.B-17 scid | Taconic | C.B-Igh-1b/IcrTac-Prkdcscid | |
| Cell line (M. musculus) | Mouse T Cell line (CTLL-2) | ATCC | TIB-214 | |
| Cell line (Homo-sapiens) | Human NK Cell line (YT) | Yodoi et al., 1985 | ||
| Cell line (Spodoptera frugiperda) | Insect ovarian Cell line | ATCC | Cat#CRL-1711 | |
| Cell line (Trichoplusia ni) | Insect ovarian Cell line | Expression Systems | Cat#94–002F | |
| Cell line (Homo-sapiens) | Expi293F | Gibco | Cat#A14527 | |
| Cell line (Homo-sapiens) | Human adenocarcinoma Cell line (Hela) | ATCC | Cat#CCL-2 | |
| Antibody | Anti-mouse CD16/32 TruStain FcX (93) rat monoclonal | BioLegend | Cat#101320 | (1:100) |
| Antibody | Anti-mouse CD3ε (145–2 c11) Armenian hamster monoclonal | BioLegend | Cat#100340 | (2.5 μg/mL) plate bound |
| Antibody | Anti-mouse CD28 (37.51) Syrian hamster monoclonal | Bio X Cell | Cat#BE0015-1 | (5 μg/mL) |
| Antibody | Anti-mouse CD45.1 e450 (A20) mouse monoclonal | eBioscience | Cat#48-0453-82 | (1:100) |
| Antibody | Anti-mouse CD45.2 APC-eF780 (104) mouse monoclonal | eBioscience | Cat#47-0454-82 | (1:100) |
| Antibody | Anti-mouse CD45.2 APC (104) mouse monoclonal | eBioscience | Cat#17-0454-82 | (1:100) |
| Antibody | Anti-mouse CD3ε BV785 (17A2) rat monoclonal | BioLegend | Cat#100232 | (1:100) |
| Antibody | Anti-mouse CD3ε AF700 (eBio500A2) Syrian hamster monoclonal | eBioscience | Cat#56-0033-82 | (1:100) |
| Antibody | Anti-mouse CD3ε PerCP-Cy5.5 (145–2 C11) Armenian hamster monoclonal | eBioscience | Cat#44-0031-82 | (1:100) |
| Antibody | Anti-mouse CD19 PE-Cy7 (1D3) rat monoclonal | eBioscience | Cat#25-0193-81 | (1:100) |
| Antibody | Anti-mouse NK1.1 FITC (PK136) mouse monoclonal | eBioscience | Cat#11-5941-85 | (1:100) |
| Antibody | Anti-mouse NK1.1 PE (PK136) mouse monoclonal | eBioscience | Cat#12-5941-82 | (1:100) |
| Antibody | Anti-mouse Ly6G eF450 (RB6-8C5) rat monoclonal | eBioscience | Cat#48-5931-82 | (1:100) |
| Antibody | Anti-mouse CD25 BV605 (PC61) rat monoclonal | BioLegend | Cat# 102035 | (1:100) |
| Antibody | Anti-mouse CD25 APC (PC61) rat monoclonal | BioLegend | Cat#102011 | (1:100) |
| Antibody | Anti-mouse CD122 APC (TM-β1) rat monoclonal | BioLegend | Cat#123214 | (1:100) |
| Antibody | Anti-mouse CD132 APC (TUGm2) rat monoclonal | BioLegend | Cat#132308 | (1:100) |
| Antibody | Anti-mouse Foxp3 APC (FJK-16S) rat monoclonal | eBioscience | Cat#17-5773-82 | (1:100) |
| Antibody | Anti-mouse Foxp3 PE (FJK-16s) rat monoclonal | eBioscience | Cat#12-5773-82 | (1:100) |
| Antibody | Anti-mouse CD4 FITC (RM4.5) rat monoclonal | eBioscience | Cat#11-0042-85 | (1:100) |
| Antibody | Anti-mouse CD4 PE-Cy7 (GK1.5) rat monoclonal | eBioscience | Cat#25-0041-82 | (1:100) |
| Antibody | Anti-mouse CD4 Pacific Blue (GK1.5) rat monoclonal | BioLegend | Cat# 100427 | (1:100) |
| Antibody | Anti-mouse CD8 Alexa Fluor 488 (53–6.7) rat monoclonal | BioLegend | Cat#100726 | (1:100) |
| Antibody | Anti-mouse CD8 BV785 (53–6.7) rat monoclonal | BioLegend | Cat#100750 | (1:100) |
| Antibody | Anti-mouse CD62L (MEL-14) rat monoclonal | BioLegend | Cat# 104411 | (1:100) |
| Antibody | Anti-mouse CD44 (IM7) rat monoclonal | BioLegend | Cat#103047 | (1:100) |
| Antibody | Anti-mouse IFNγ AF647 (XMG1.2) rat monoclonal | BD | Cat#557735 | (1:100) |
| Antibody | Anti-pSTAT5 AF647 (47/Stat5 pY694) mouse monoclonal | BD | Cat#612599 | (1:100) |
| Recombinant DNA reagent | LeGO mSOCS1-p2a-eGFP | This study | Modified from Weber et al., 2010 mSOCS1 1–212 AS linker p2a cleavage peptide eGFP (UniProt C5MKY7) | |
| Recombinant DNA reagent | lentiCRISPR v2 sgIL2RA | This study | Modified from Sanjana et al., 2014, see gRNA seq below | |
| Recombinant DNA reagent | pSEMS leader-mXFPm IL-2Rβ | This study | mECFP (W67F, E143K) hIL-2Rβ 27–551 | |
| Recombinant DNA reagent | pSEMS leader-mXFPe γc | This study | mEGFP (Y67F, N199D, Y201F) hγc23–369 | |
| Sequence-based reagent | mouse IL-2Rα gRNA | This study | gRNA | ACAACTTACCCAGAAATCGG |
| Sequence-based reagent | Gapdh_F | IDT | PCR primer | GTGGAGTCATACTGGAACATGTAG |
| Sequence-based reagent | Gapdh_R | IDT | PCR primer | AATGGTGAAGGTCGGTGTG |
| Sequence-based reagent | Bcl2_F | IDT | PCR primer | CCAGGAGAAATCAAACAGAGGT |
| Sequence-based reagent | Bcl2_R | IDT | PCR primer | GATGACTGAGTACCTGAACCG |
| Sequence-based reagent | Ifng_F | IDT | PCR primer | TCCACATCTATGCCACTTGAG |
| Sequence-based reagent | Ifng_R | IDT | PCR primer | CTGAGACAATGAACGCTACACA |
| Sequence-based reagent | Gzmb_F | IDT | PCR primer | CATGTCCCCCGATGATCTC |
| Sequence-based reagent | Gzmb_R | IDT | PCR primer | AAGAGAGCAAGGACAACACTC |
| Sequence-based reagent | Lta_F | IDT | PCR primer | TCTCCAGAGCAGTGAGTTCT |
| Sequence-based reagent | Lta_R | IDT | PCR primer | CTCAGAAGCACTTGACCCAT |
| Sequence-based reagent | Myc_F | IDT | PCR primer | GTCGTAGTCGAGGTCATAGTTC |
| Sequence-based reagent | Myc_R | IDT | PCR primer | CTGTTTGAAGGCTGGATTTCC |
| Peptide, recombinant protein | MSA-IL-2 and variants | This study | MSA aa19-608, GGGSGS linker, human IL-2 aa21-153, 6xHis | |
| Peptide, recombinant protein | MSA-H9 and variants | This study | MSA aa19-608, GGGSGS linker, human IL-2 (L80F, R81D, L85V, I86V, I92F) aa21-153, 6xHis | |
| Peptide, recombinant protein | Fc-IL-2-N88D | This study | hIgG1-P329G LALA IL-2-N88D (T3A, C125A), 6xHis | |
| Peptide, recombinant protein | Anti-GFP minimizer Rho11 | Kirchhofer et al., 2010 | ||
| Peptide, recombinant protein | Anti-GFP enhancer DY647 | Kirchhofer et al., 2010 | ||
| Peptide, recombinant protein | Human IL-2Rβ extracellular domain | This study | aa27-240, 6xHis | |
| Peptide, recombinant protein | Human γc extracellular domain, biotin | This study | aa23-254, Biotin Acceptor Peptide, 6xHis | |
| Commercial assay or kit | CD4+T Cell Isolation Kit, mouse | Miltenyi Biotec | Cat#130-104-454 | |
| Commercial assay or kit | Mouse CD8α + T cell isolation kit | Miltenyi Biotec | Cat#130-104-075 | |
| Commercial assay or kit | Mouse NK cell Isolation Kit | Miltenyi Biotec | Cat#130-115-818 | |
| Commercial assay or kit | LS magnetic selection column | Miltenyi Biotec | Cat#130-042-401 | |
| Commercial assay or kit | High Capacity NoEndo Columns | Protein Ark | Cat#Gen-NoE48HC | |
| Commercial assay or kit | Chromogenic Endotoxin Quant Kit | Pierce | Cat#A39552 | |
| Commercial assay or kit | RNeasy Plus Mini Kit | Qiagen | Cat#74134 | |
| Commercial assay or kit | iScript Reverse Transcription Supermix | BioRad | Cat#1708840 | |
| Commercial assay or kit | PowerTrack SYBR Green | Applied Biosystems | Cat#A46109 | |
| Commercial assay or kit | CellTrace Violet Cell Proliferation Kit | Invitrogen | Cat# C34557 | |
| Commercial assay or kit | Click-iT EdU Alexa Fluor 647 Flow Cytometry Assay Kit | Invitrogen | Cat#C10424 | |
| Commercial assay or kit | Propidium Iodide | BD | Cat#556463 | |
| Commercial assay or kit | Fixable Viability Dye eFluor 780 | eBioscience | Cat#65-0865-14 | |
| Commercial assay or kit | Foxp3/Transcription Factor Staining Buffer Set | eBioscience | Cat#00-5523-00 | |
| Commercial assay or kit | Cytofix/Cytoperm Fixation/Permeablization Kit | BD | Cat#554714 | |
| Commercial assay or kit | GolgiStop | BD | Cat#554724 | |
| Commercial assay or kit | Cellfectin II | Gibco | Cat#10362100 | |
| Commercial assay or kit | Sapphire Baculovirus DNA | Allele | Cat#ABP-BVD-10002 | |
| Commercial assay or kit | FixLyse Buffer | BD | Cat#558049 | |
| Commercial assay or kit | Perm Buffer III | BD | Cat#558050 | |
| Commercial assay or kit | Dynabeads Mouse T-Activator CD3/CD28 for T-Cell Expansion and Activation | Gibco | Cat#11456D | |
| Commercial assay or kit | SA sensor chip | Cytiva | Cat#BR-1005–31 | |
| Commercial assay or kit | Zymo RNA miniprep kit | Zymo Research | Cat#R2051 | |
| Commercial assay or kit | Kapa mRNA HyperPrep Kit | Roche | Cat#08098093702 | |
| Commercial assay or kit | MycoAlert PLUS Mycoplasma Detection Kit (50 Tests) | Lonza | Cat#LT07-705 | |
| Chemical compound, drug | Ionomycin | Sigma | Cat#I9657-1MG | |
| Chemical compound, drug | Phorbol 12-myristate 13-acetate (PMA) | Sigma | Cat#P8139-5MG | |
| Chemical compound, drug | Dextran Sulfate Sodium Salt (36,000–50,000 M.Wt) | MP biomedical | SKU#02160110-CF | |
| Software, algorithm | FlowJo v10.5 | Tree Star | RRID:SCR_008520 | |
| Software, algorithm | GraphPad Prism 8.3.0 | GraphPad Software | RRID:SCR_002798 | |
| Software, algorithm | BIAevaluation software | Cytiva | RRID:SCR_015936 | |
| Software, algorithm | StepOne Software | Applied Biosystems | RRID:SCR_014281 | |
| Software, algorithm | MATLAB | MathWorks | RRID:SCR_001622 | |
| Software, algorithm | Illumina CASAVA pipeline | Illumina | RRID:SCR_001802 | |
| Software, algorithm | Bowtie2 | RRID:SCR_016368 | ||
| Software, algorithm | Tophat2 | RRID:SCR_013035 | ||
| Software, algorithm | edgeR | RRID:SCR_012802 | ||
| Software, algorithm | pheatmap | RRID:SCR_016418 |
Additional files
Download links
A two-part list of links to download the article, or parts of the article, in various formats.
Downloads (link to download the article as PDF)
Open citations (links to open the citations from this article in various online reference manager services)
Cite this article (links to download the citations from this article in formats compatible with various reference manager tools)
Calibration of cell-intrinsic interleukin-2 response thresholds guides design of a regulatory T cell biased agonist
eLife 10:e65777.
https://doi.org/10.7554/eLife.65777


