Rapid mechanical stimulation of inner-ear hair cells by photonic pressure
- Laboratoryof Auditory Neuroscience and Biophysics, Department of Bioengineering, Imperial College London, United Kingdom
- Howard Hughes Medical Institute andLaboratory of Sensory Neuroscience, The Rockefeller University, United States
Figures
Figure 1
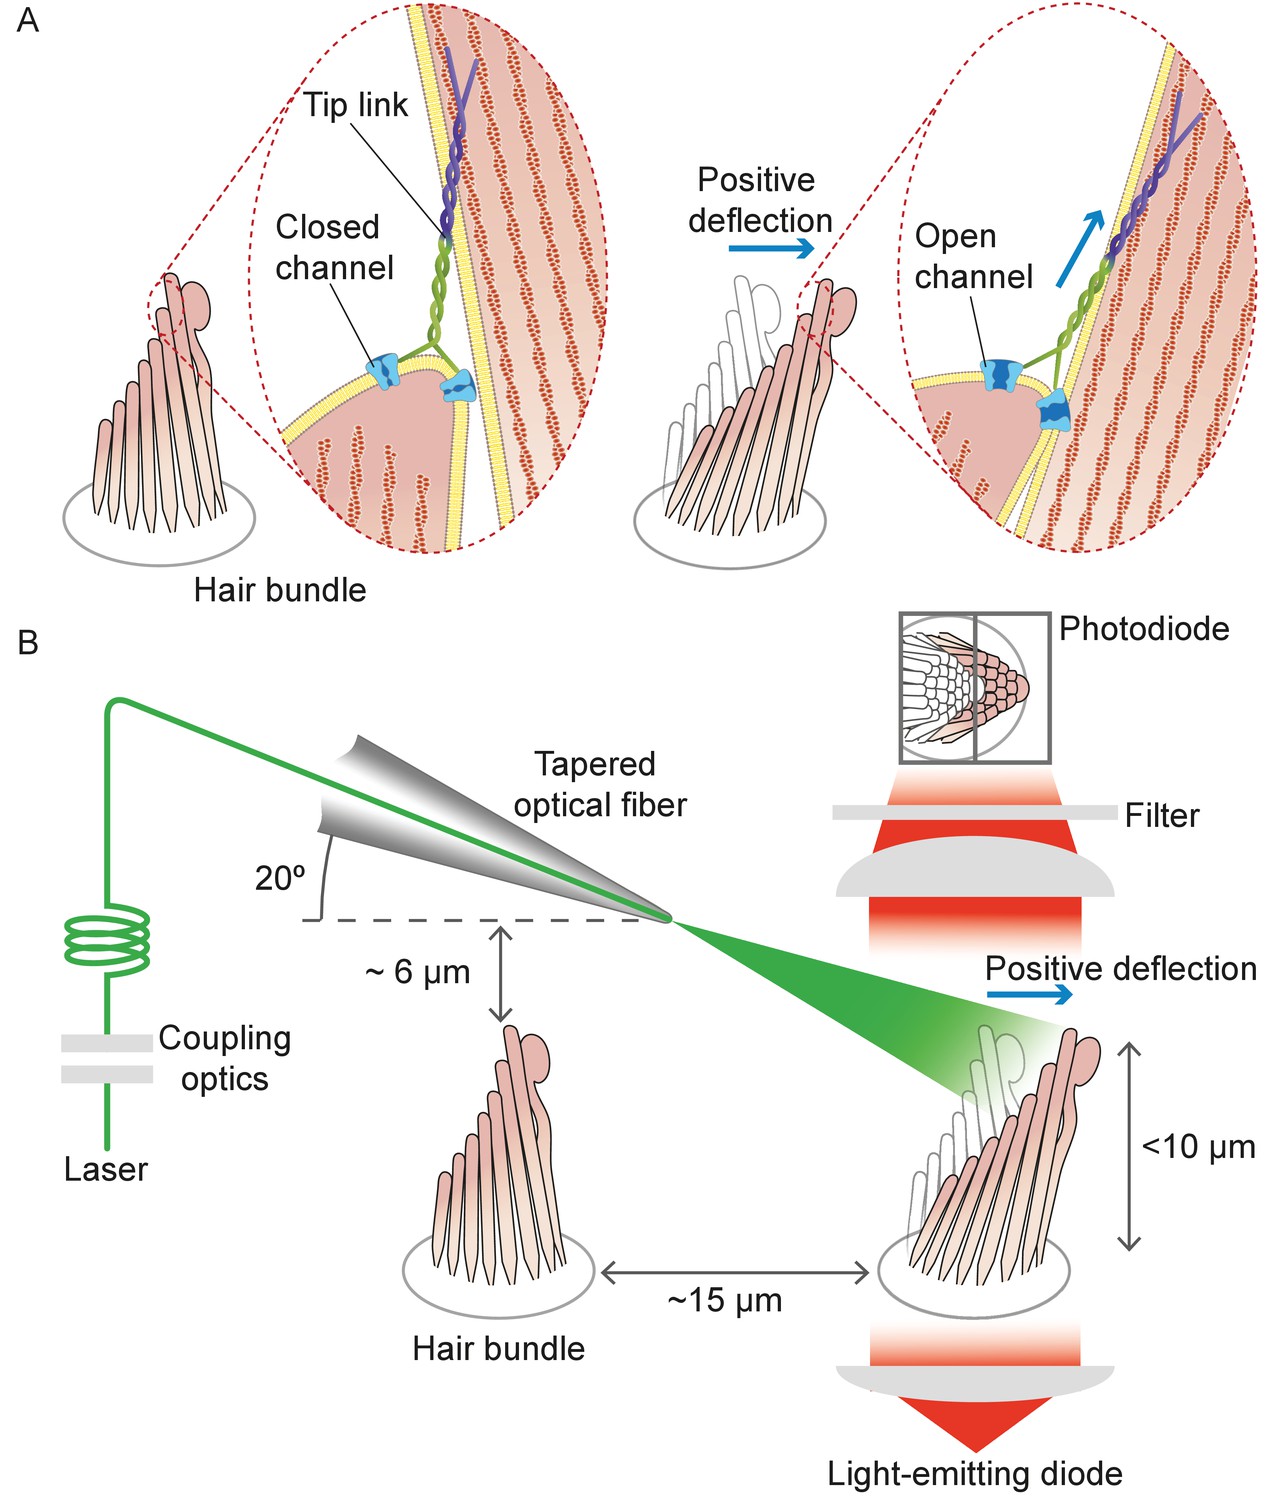
Structure of the hair bundle and configuration of the experiments.
(A) A schematic illustration portrays a hair bundle, in this instance that from the bullfrog’s sacculus, at rest (left) and when deflected towards its tall edge (right). The bundle is formed by rows of stereocilia that increase in height along the axis of sensitivity and are interlinked by molecular filaments, the tip links, that stretch as the bundle moves forward. The tip links project the stimulus force onto mechanosensitive ion channels. (B) A tapered optical fiber with a spherical lens at its tip is brought within a few tens of micrometers of a hair bundle. The fiber's angle of approximately 20 from the horizontal allows it to pass beneath the microscope’s objective lens without impinging upon other nearby hair bundles. An image of the hair bundle is projected through the microscope and onto a dual photodiode, which permits measurement of bundle motion with a precision in the nanometer range. Note that the extent of hair-bundle movement in this and the subsequent figures is greatly exaggerated for didactic purposes: the largest displacements move the bundle’s top by less than the diameter of a single stereocilium.
Figure 2
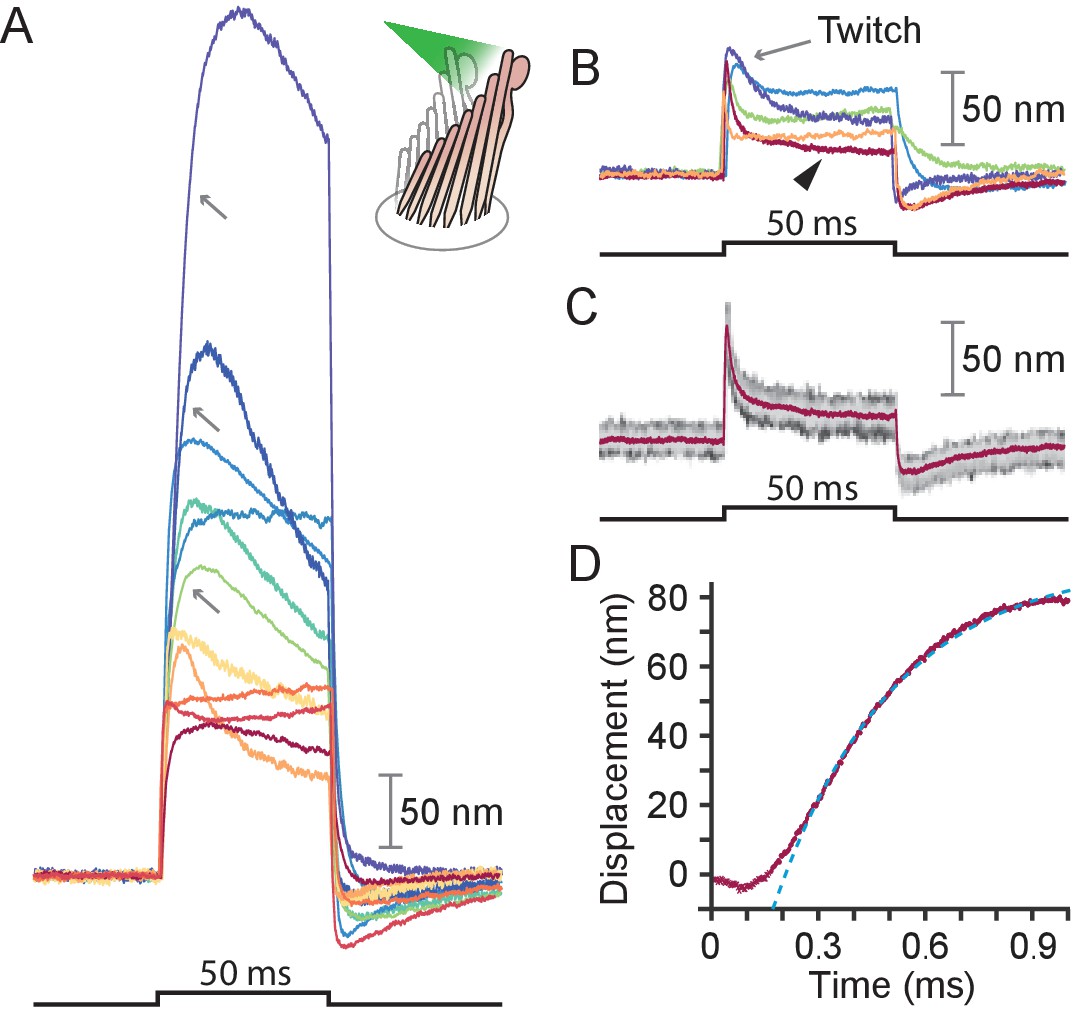
Responses of hair bundles from the bullfrog’s sacculus.
(A) Although all hair bundles displayed rapid movements at the onset and conclusion of photonic stimulation, some exhibited relatively slow approaches to their peaks and slow relaxations. Eleven hair bundles were stimulated in the positive direction with 561 nm light with 30 mW at the fiber’s entrance, or about 15 mW at the fiber’s output; each trace is the average of 25 responses. The schematic diagram here and in the subsequent figures shows the experimental configuration. (B) Five of the other hair bundles displayed moved rapidly at the onset of irradiation, then relaxed to plateau displacements. (C) A representative trace, marked by an arrowhead in panel B, portrays the decay of a response to a plateau level and the undershoot after stimulation characteristic of slow adaptation. The 25 individual traces that combine into the average (red) are shown in gray scale. (D) The rising phase of the same response is fitted with to an exponential with time constant 335 s (dashed blue line). The data at times below 250 μs were not included in the fit.
Figure 3
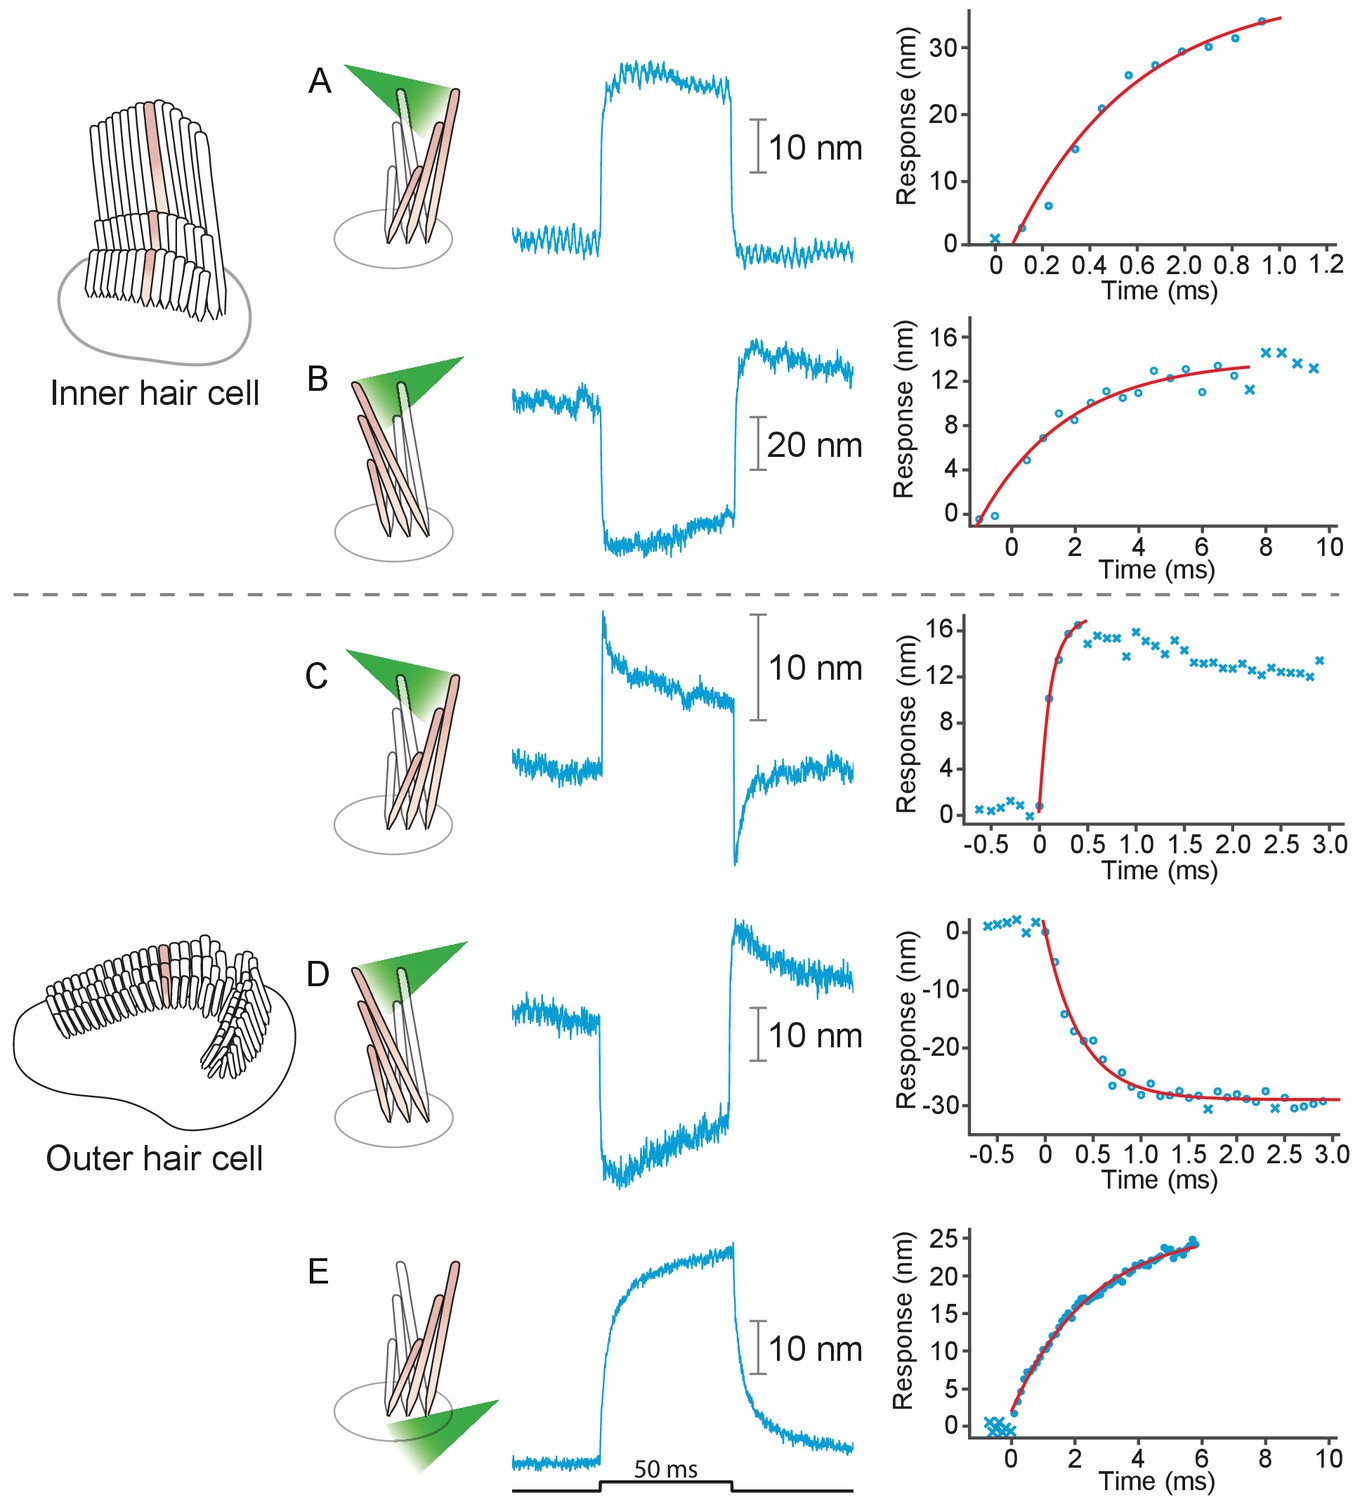
Responses of hair bundles from the rat’s cochlea.
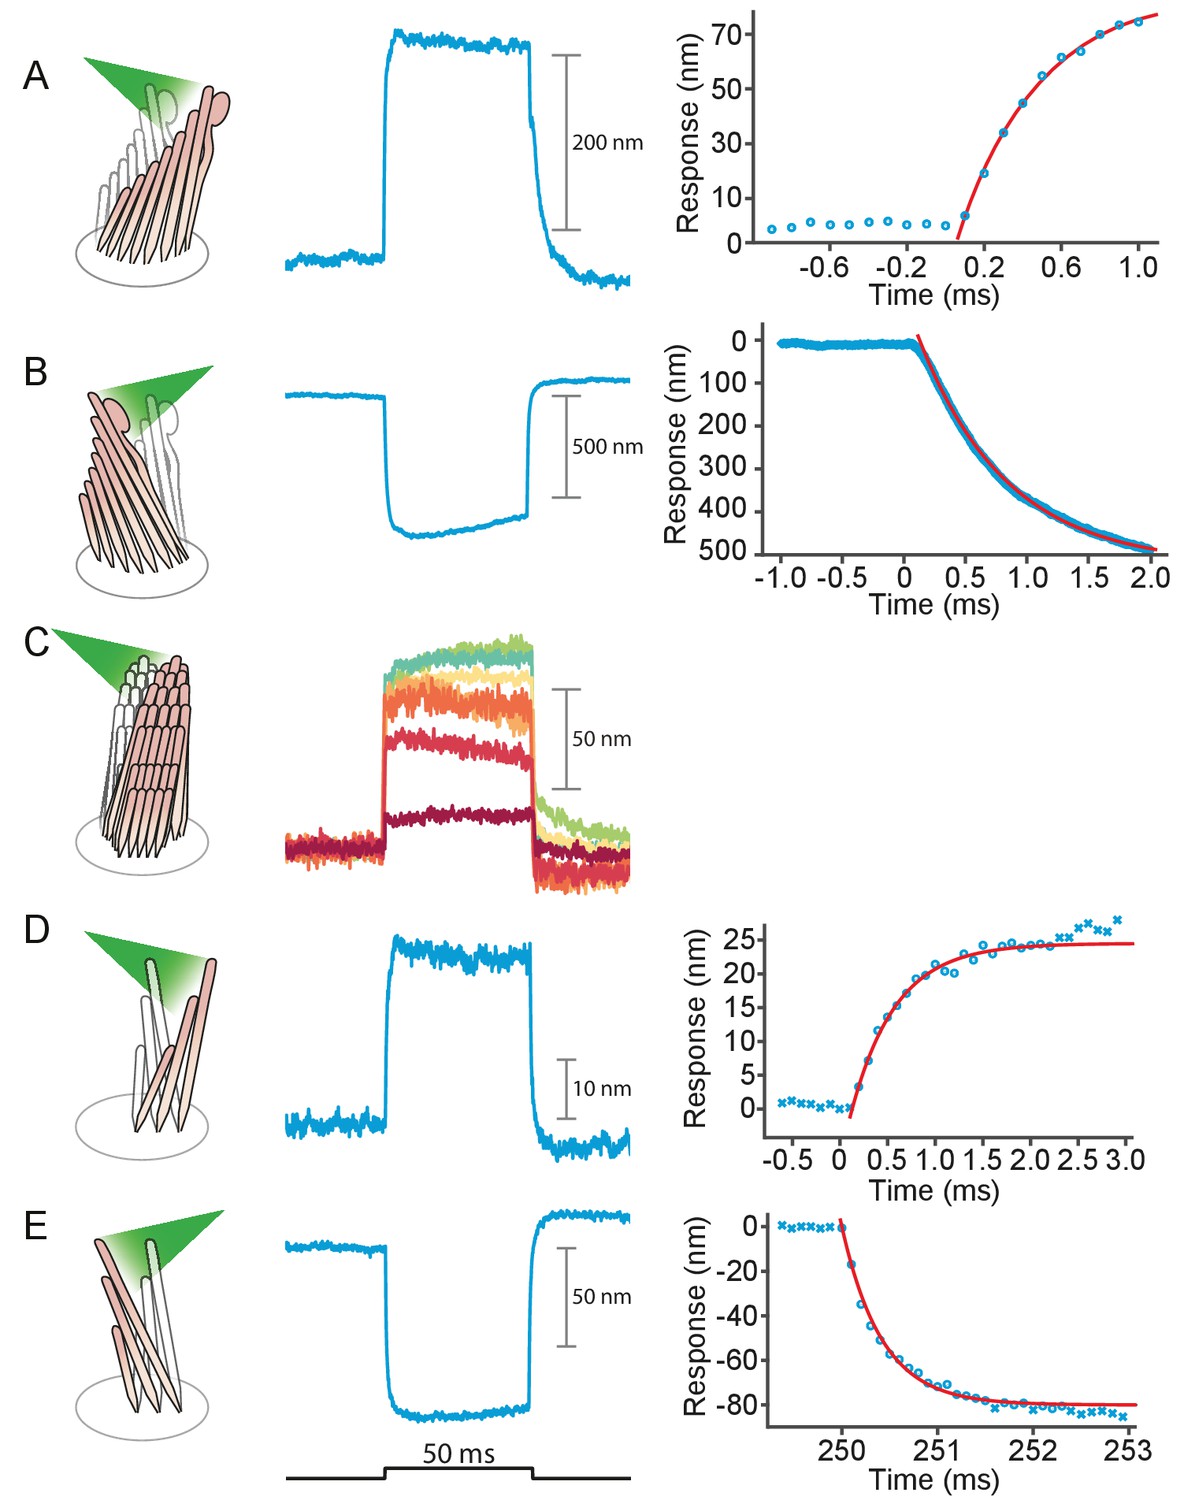
(A) Irradiation of the hair bundle from an inner hair cell evoked motion in the direction of light propagation, here the positive direction, with a time constant of 459 μs. In this and the other panels, the bundles were stimulated at 600 nm with 18 mW of input power and the records represent the average of 25 repetitions. This number of repetitions was sufficient to diminish the noise and isolate the characteristic shape of the hair-bundle response. (B) A similar experiment with negatively directed irradiation moved the hair bundle in the opposite direction. The time constant is 258 μs. (C) Stimulation of an outer hair cell’s bundle in the positive direction evoked a response with sharp transients at both the onset and the offset of irradiation. As shown in the associated plot, the response rose with a time constant of 123 μs and peaked in less than 1 ms. (D) Negative stimulation of an outer hair cell’s bundle evoked movement in the negative direction with an onset time constant of 377 μs. (E) When a negatively directed light beam was aimed at the soma of an outer hair cell, the bundle moved with a slow time constant of 2.1 ms in the positive direction-opposite the direction of light propagation-owing to the photothermal effect.
Figure 4
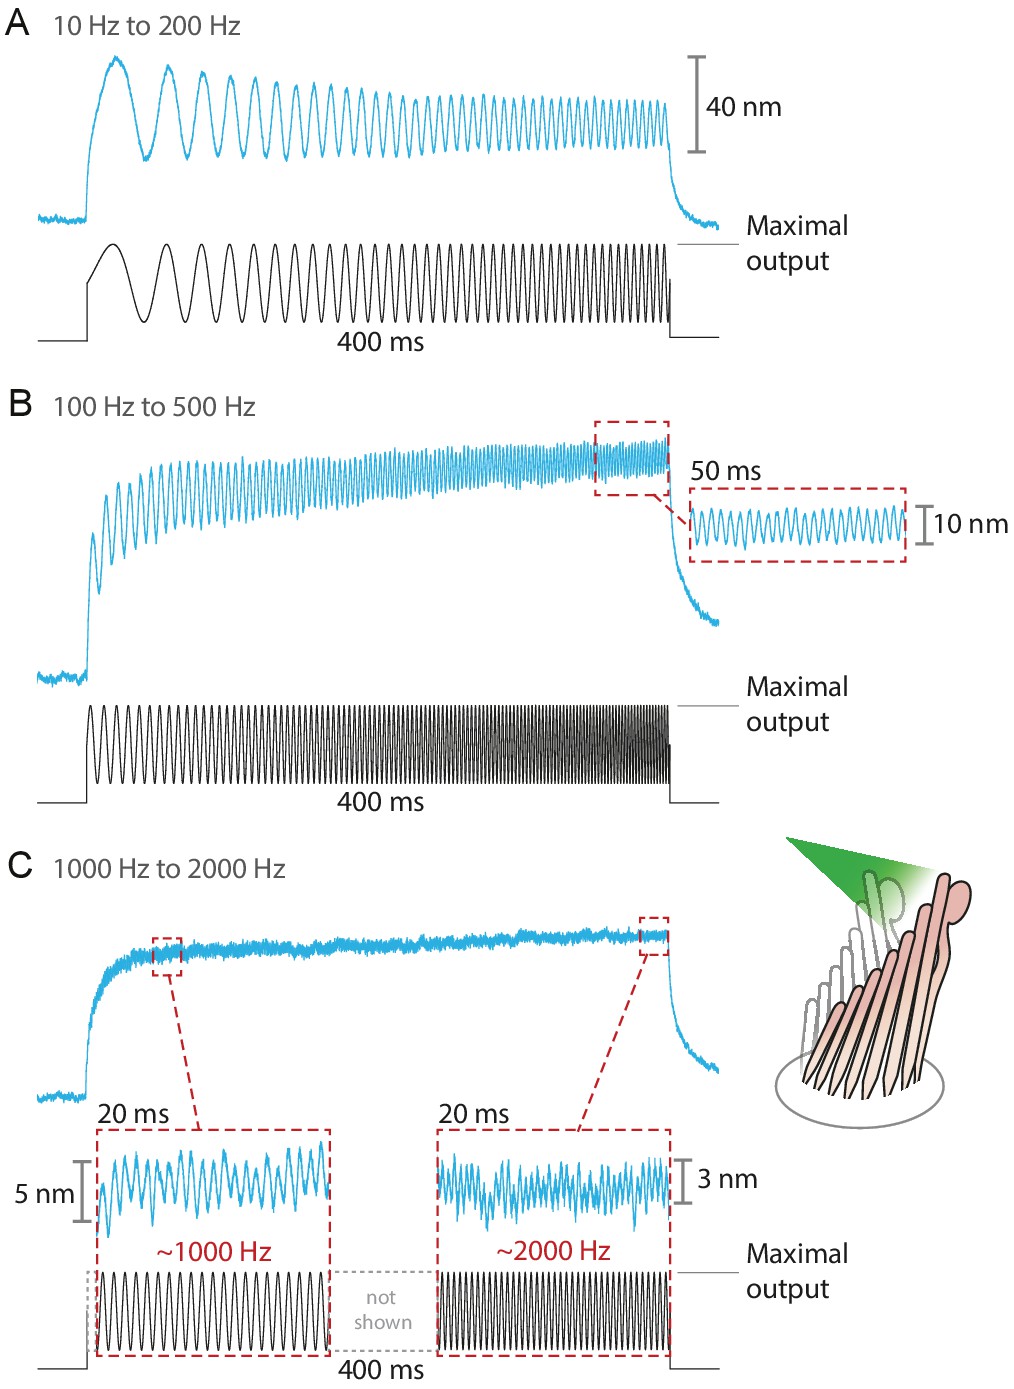
Responses of hair bundles from the bullfrog’s sacculus to sinusoidal frequency sweeps between 10 Hz and 200 Hz (A), 100 Hz and 500 Hz (B), and 1 kHz and 2 kHz (C).
Each stimulus was achieved by driving the laser’s source such that the amplitude of the sweep peaked at the maximum power output—12.5 mW for this fiber—while keeping its minimum above 0 mW. Each hair bundle was stimulated in the positive direction with 561 nm laser light; each trace is the average of 25 responses. Panel C portrays two 20 ms-long representative segments of the stimulus waveform, which would be unintelligible if displayed in full. These segments, located near the beginning and the end of the sweep, are aligned with the magnification of the simultaneous hair-bundle response (red dashed boxes).
Figure 5
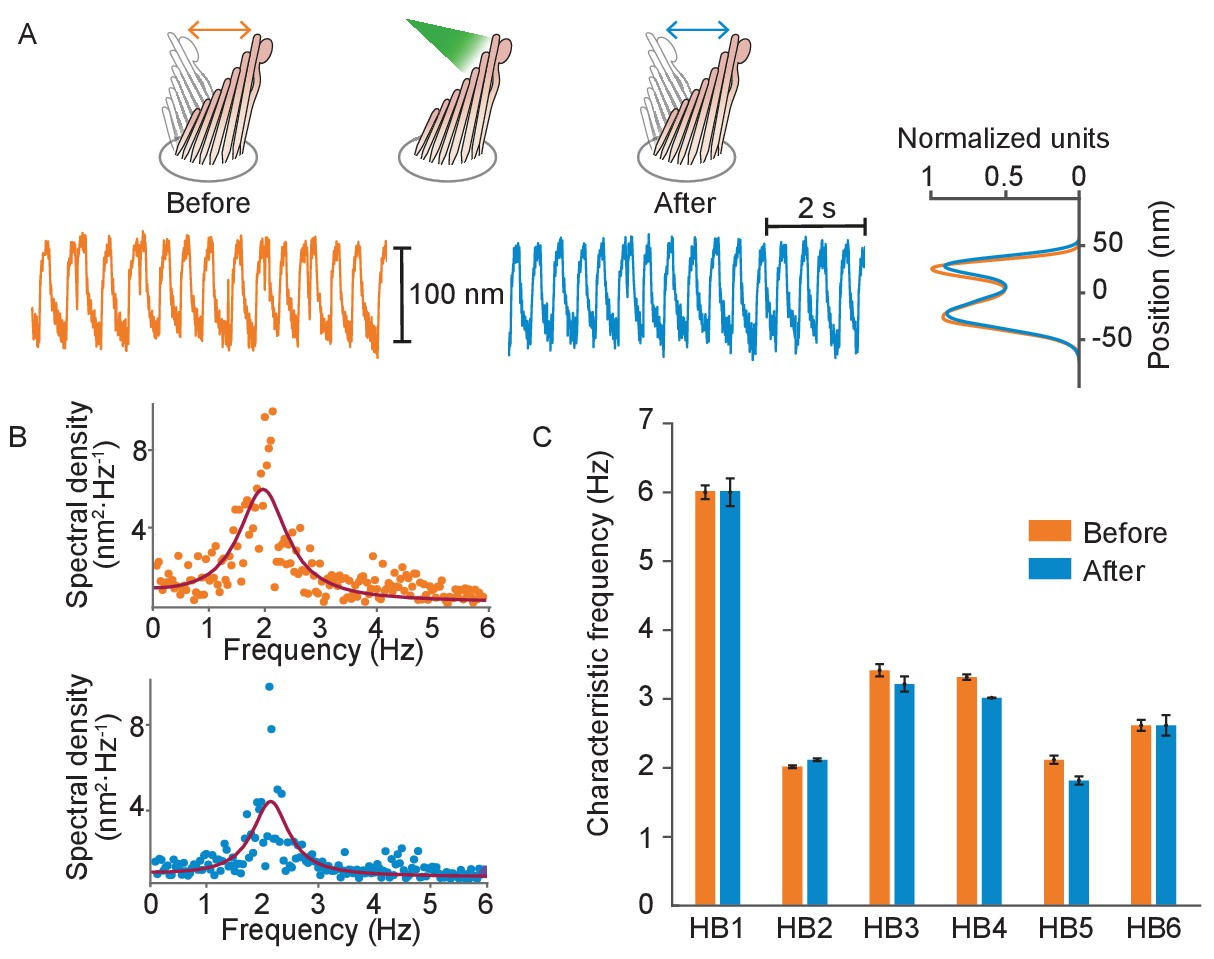
Normal operation of hair bundles after laser irradiation.
(A) A hair bundle from the bullfrog displayed regular spontaneous oscillations prior to irradiation (orange). After 25 pulses of 30 mW, 561 nm light from a fiber 5 μm away, the bundle continued to oscillate with a similar waveform (blue). The histograms portray the distribution of bundle positions under the two conditions and confirm that the amplitude of oscillation was similar before and after irradiation. (B) The power spectrum of the same bundle’s oscillations prior to irradiation shows a frequency peak around 2 Hz, as determined by a double-Lorentzian fit. The power spectrum after irradiation has a similar peak frequency. (C) Six hair bundles (HB1 - HB6) subjected to similar treatment showed insignificant changes in their peak frequencies of oscillation after irradiation. The bundle in panels (A) and (B) is HB2. The upper compartment of the experimental chamber contained endolymph in these experiments.
Figure 6
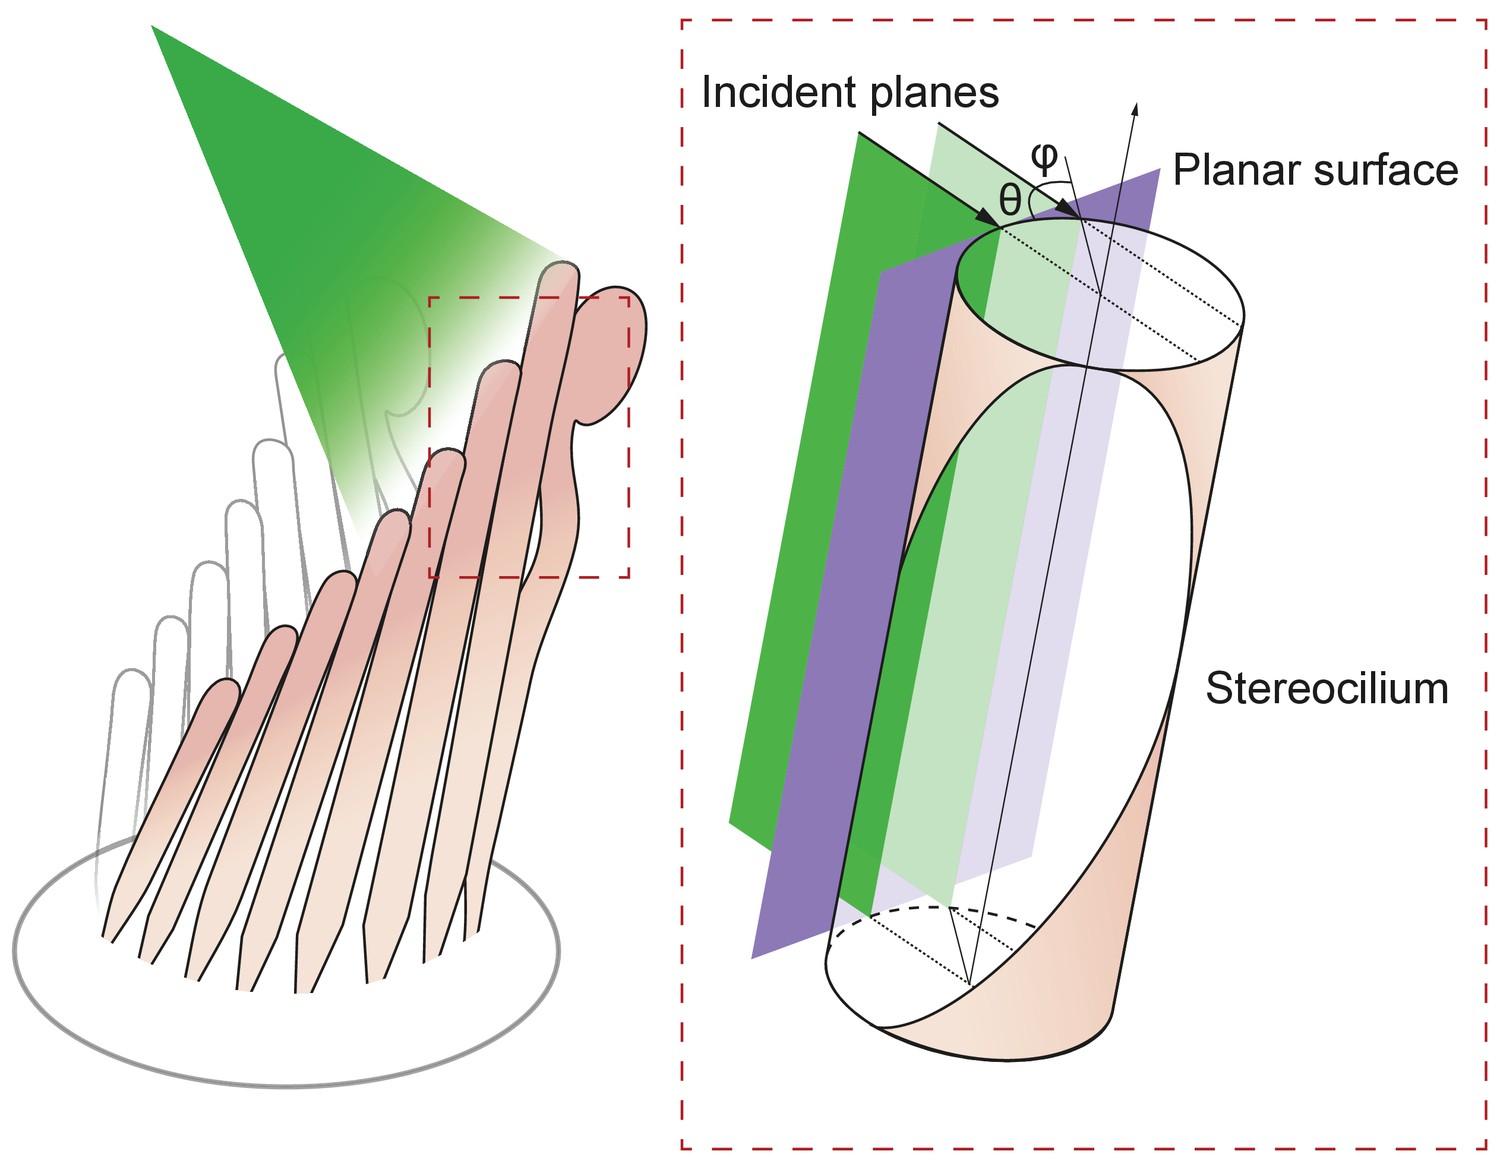
Geometry of irradiation of a cylindrical surface.
As the beam from an optical fiber strikes a hair bundle, two representative sheets of the incoming light (green) are depicted along with the propagation direction of each (black arrows) and their angle of incidence θ with respect to the long axis of the stereocilium. Both incident planes are perpendicular to a plane tangent to the stereociliary surface (purple). Along its line of incidence onto the stereocilium, the centered sheet of light (dark green) is radially normal to the cylinder. The off-center sheet of light (pale green) strikes the stereocilium at an angle φ with respect to the normal.
Figure 7

Potential fates of a plane wave incident on a stereocilium.
(A) Three representative rays of a light beam interact with a stereocilium; , and denote the incident, reflected, and transmitted portions of each ray. All superscripts and subscripts are defined in the figure. The rays , , (black arrows) indicate the direction of light in water (refractive index 1.33) as it strikes a stereocilium whose refractive index is 1.4 and whose section is shown in lavender. The ray is incident along the normal to the stereocilium, the axis of symmetry of the section. For parallel rays further from , the angle of incidence at which the light strikes the stereocilium's surface increases as measured with respect to the normal. These three rays of incident light impart distinct forces on the stereocilium. (B) When a ray is reflected, it forces the stereocilium in the opposite direction and the direction of this input reflection force is radially aligned with the center. (C) If the ray is deflected due to refraction, a deflection force () is generated on the stereocilium that is perpendicular to the direction of the ray as it propagates within the stereocilium. The incident angle is equal to the reflection angle, as is the case for the ray as it first strikes the stereocilium (). The light that is refracted propagates along (orange line) once inside the stereocilium until it reaches the boundary with water. At this second collision the incident angle is equal to the refractive angle , which is too small to cause another reflection; as a result, the ray exits into water and no deflection force is generated. (D) A third kind of force arises if total internal reflection (TIR) occurs, as happens when the angle of the incident light beam is such that a ray remains trapped inside the stereocilium as it is repeatedly reflected at the boundary with water. In the case of ray , the incident angle is equal to the critical angle for total internal reflection—72° in this case—and the light remains within the stereocilium as (blue arrow) and is reflected repeatedly each time it reaches the boundary with water. Three successive total internal reflections are shown; each generates a reflection force .
Figure 8
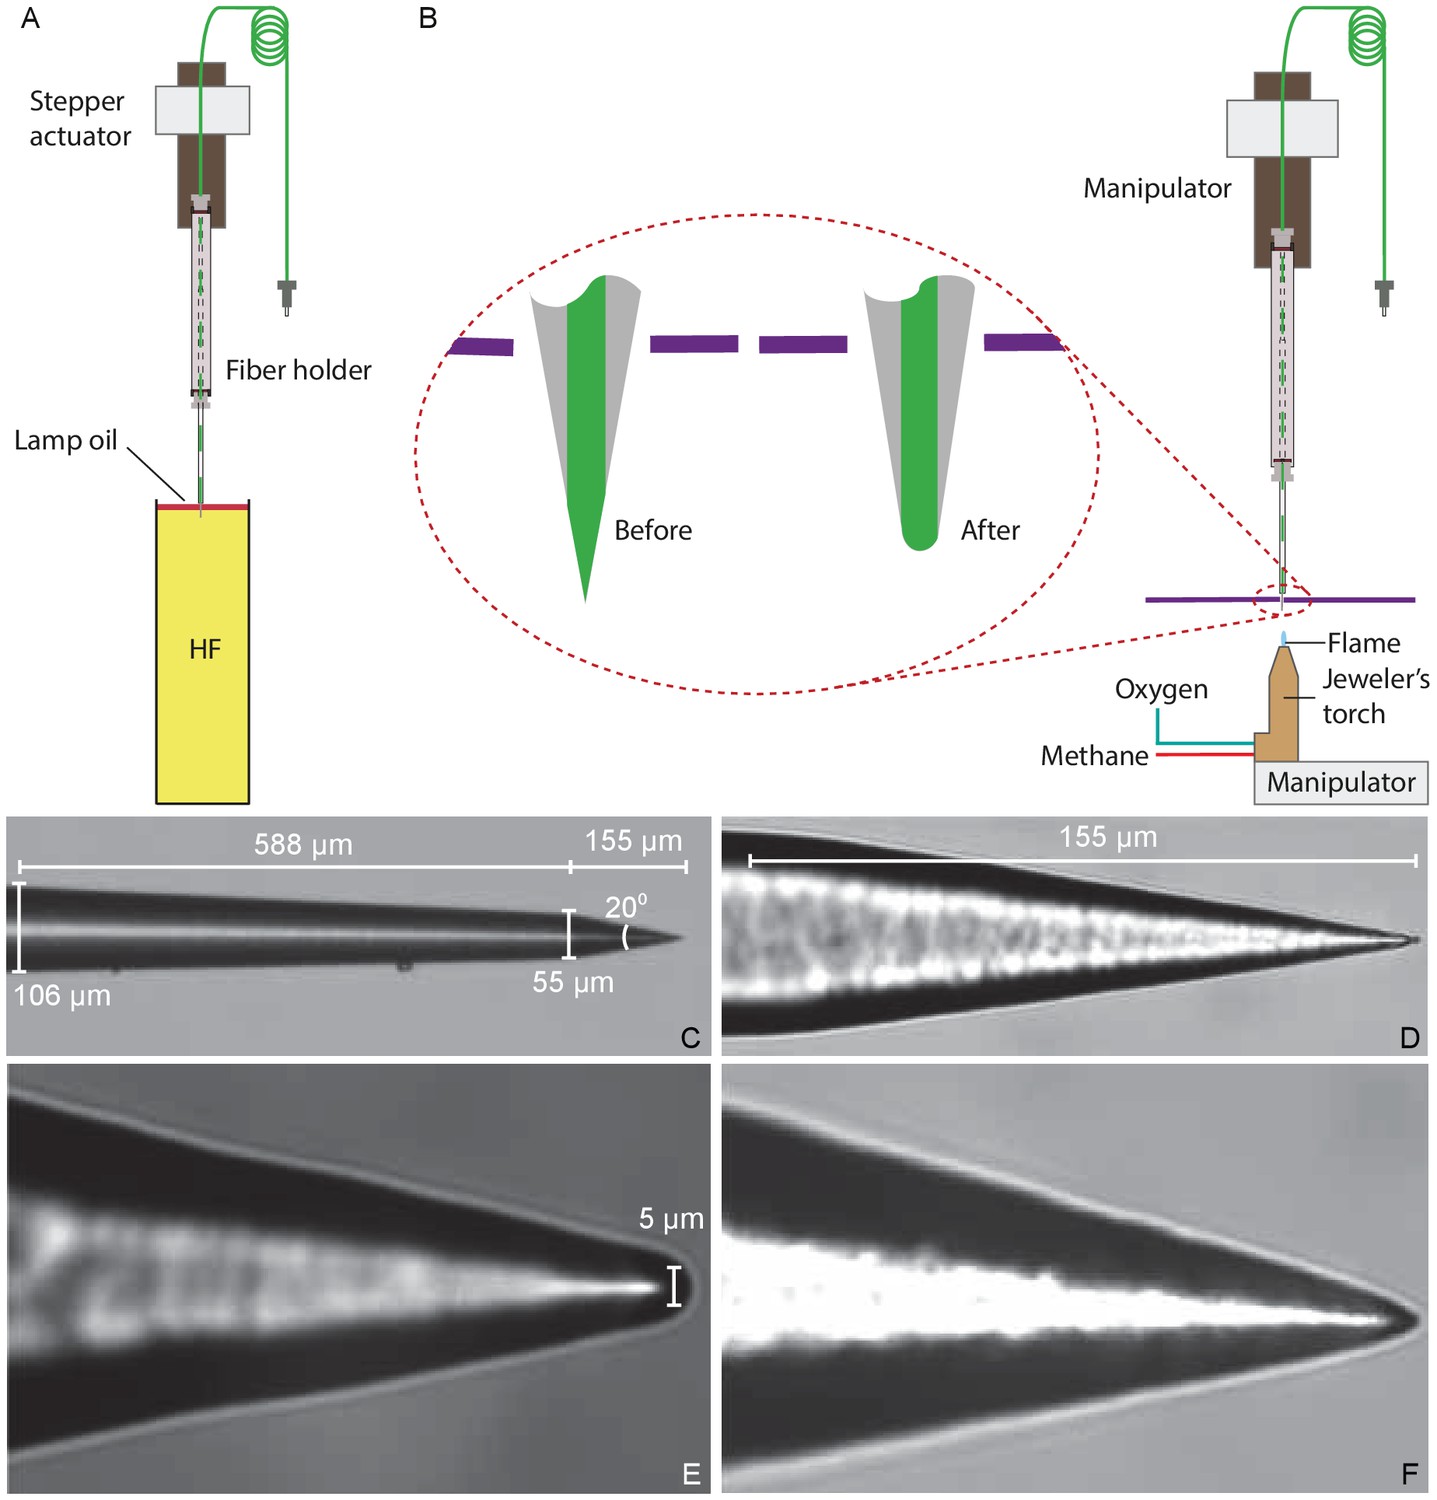
Preparation of a tapered optical fiber.
(A) A schematic diagram depicts the process of reducing the optical fiber's diameter by chemical etching. The tapered optical fiber is attached to the shaft of a linear actuator and lowered into a tube of hydrofluoric acid (HF) topped with a thin layer of lamp oil (kerosene). The convergence angle of the fiber’s tip is determined by the rate at which the tip is extracted from the acid. (B) A schematic diagram depicts the apparatus for creating a hemispherical lens at the fiber’s tip. With the aid of a three-axis micromanipulator, the fiber’s tip is inserted through a hole less than in diameter in a horizontally mounted metal plate (purple line). The nozzle of a jeweler’s torch is aligned with the optical fiber by means of a second micromanipulator. Careful adjustment of the flow of oxygen and methane yields a flame about 0.5 mm in height. Under microscopic observation, the flame is raised until the fiber’s tip melts, whereupon the fiber is immediately retracted. (C) An image of a fiber’s tip after chemical etching with 48% hydrofluoric acid and before polishing shows a slow taper over 588 μm followed by a steep taper over the final 155 μm. (D) At a higher magnification, the tapered but unpolished tip displays a cone angle of about 20°. (E) A high-magnification image depicts a polished tip with a relatively large hemispherical lens. (F) Another polished tip ends in a narrower lens.
Figure 9
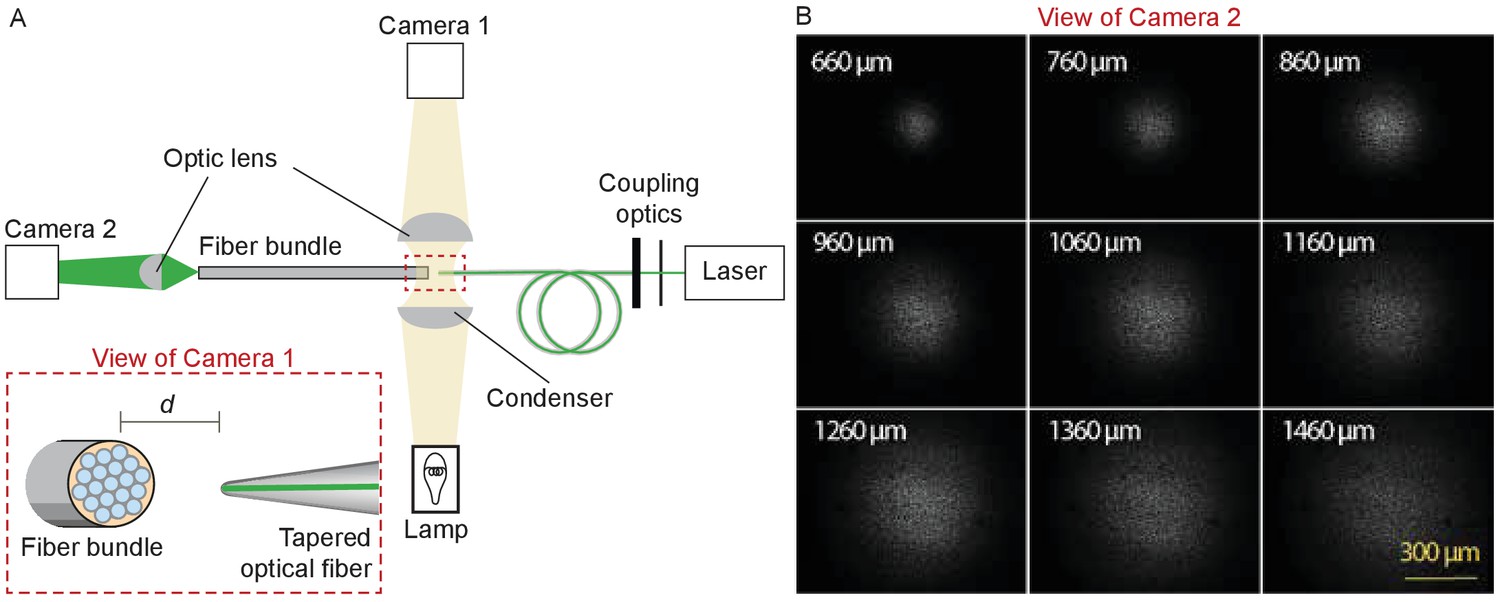
Characterization of the light spot produced by a polished fiber.
(A) A schematic diagram depicts the apparatus for characterization of a fiber’s output. During observation by camera one attached to the microscope, the tapered optical fiber is coupled to the laser and brought near the transverse surface of a fiber bundle (IGN-8/30, Sumitomo Electric, Japan). The view through camera 1, with the fiber tip pointing at one end of the fiber bundle a distance d away, is schematized in the inset. The fiber bundle has 30,000 inner cores, each 2 μm in diameter and with a center-to-center spacing of 4 μm. The distal end of the bundle is imaged by camera two at a magnification of 11.6X. (B) Images of the output, as captured with camera 2, show the divergence of the light beam as the tapered optical fiber is brought approximately 660 μm from the bundle and retracted by intervals of 100 μm.
Figure 10

Positioning fiber under an objective lens using a custom-made holder.
(A) Holder for the tapered optical fiber. The schematic drawing portrays a tapered optical fiber inserted in the mount constructed from a microelectrode holder and a glass capillary, from which the fiber’s distal tip protrudes 10 mm. The coiled optical fiber's inner core is depicted in gray inside the yellow jacket. As seen in the inset, the space between the glass capillary and the yellow jacket that protrudes 1 mm past the capillary’s tip is packed with vacuum grease (light blue). The distal end of the fiber is terminated with an FC/PC connector. Positioning of a fiber under an objective lens. (B) A schematic drawing (left) shows the length of the glass capillary that protrudes from the fiber-holder relative to the objective lens of working distance (WD) 3 mm. The photograph (right) shows the tapered optical fiber, objective lens of the microscope, and preparation chamber in an experiment.
Appendix 1—figure 1
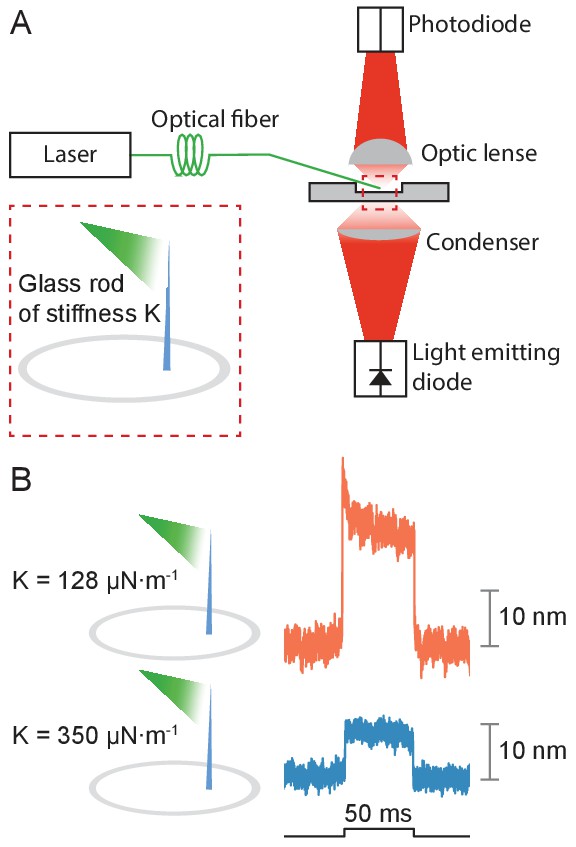
Application of photonic force applied to glass rods.
(A) Two glass rods were placed in the experimental chamber and irradiated through a tapered optical fiber for 50 ms. The average of 25 deflections was recorded for each rod. (B) The glass rod with lower stiffness of 128 μN•m–1 (orange) moved thrice as far as the fiber with a higher stiffness of 350 μN•m–1 (blue). The estimated power of irradiation falling upon each rod was 20 mW at a wavelength of 561 nm. The sudden movement at the onset of illumination for the rod of lower stiffness likely stemmed from thermoelastic effects.
Appendix 1—figure 2
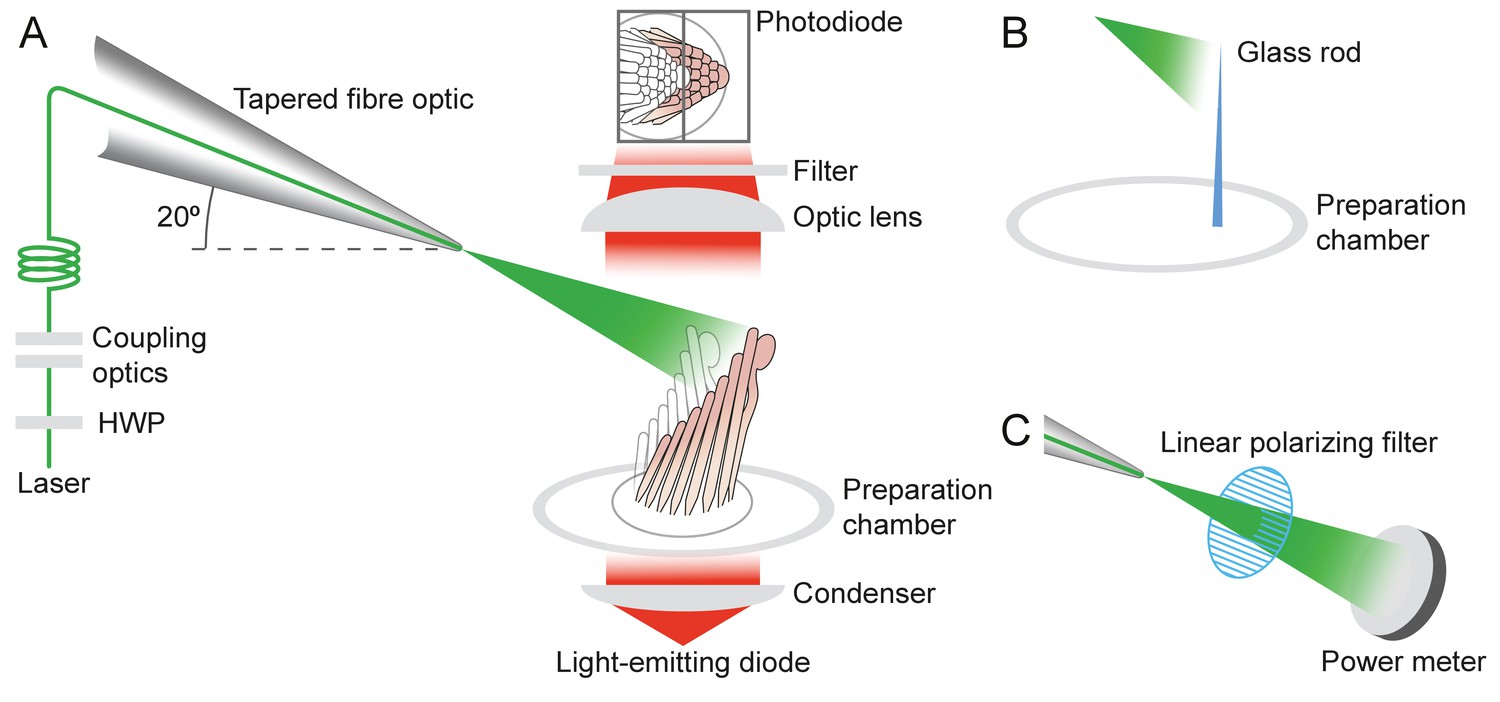
Experimental configuration.
The schematic drawing shows the arrangement of the main components in the experimental apparatus. (A) The laser beam of 561 nm wavelength (green line) traverses the half-wave plate (HWP) and is coupled to the tapered optical fiber. The fiber's distal end with the microlens is approximated to the experimental preparation under a microscope. Illumination from a light-emitting diode with a central wavelength of 660 nm (red) is focused by a condenser onto a hair bundle, which is imaged onto a dual photodiode with a 60X objective lens of numerical aperture of 1.0. A dichroic mirror blocks 562 nm laser light but it passes the light coming from the light-emitting diode. (B) In control experiments, a glass rod (blue triangle) of stiffness comparable to that of a bullfrog’s hair bundle is mounted vertically in the experimental chamber. The laser light (green triangle) deflects the rod, whose motion can be measured with the system in panel A. (C) To orient the plane of polarization of light with the long axis of the stereocilia, light from the tapered optical fiber is passed through a linear polarizing filter and its intensity is measured with a power meter. The maximal power is detected when the polarization plane is aligned with the transmission direction of the polarizing filter.
Appendix 1—figure 3
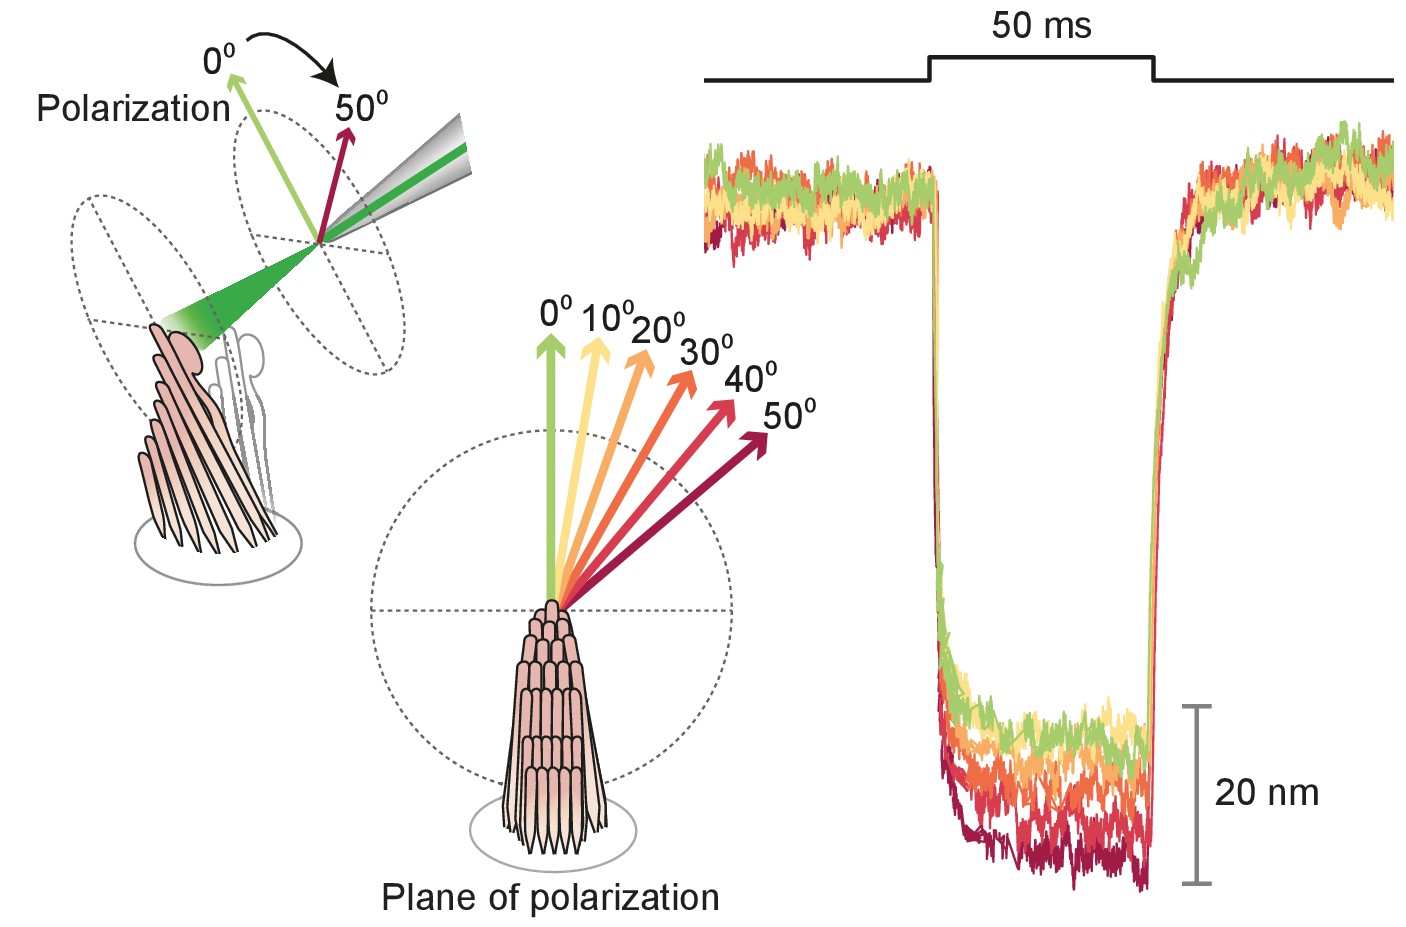
Effect of polarization on response amplitude.
After its tip links had been broken by exposure to 5 mM BAPTA for , a hair bundle from the bullfrog’s sacculus was stimulated in the negative direction with 50 ms, 30 mW laser pulses. Using a half-wave plate between the laser and the coupling optics, we rotated the polarization plane about the axis of propagation between 0 and 50. For a simple polarized object, the reflected power should decline by the cosine of the angle. Although the results showed a qualitative agreement with the prediction, we observed a significantly smaller reduction in amplitude consistent with the fact that stereocilia are birefringent, but exhibit significant scattering of light at all angles. Each trace represents the average of 25 recordings.
Appendix 1—figure 4
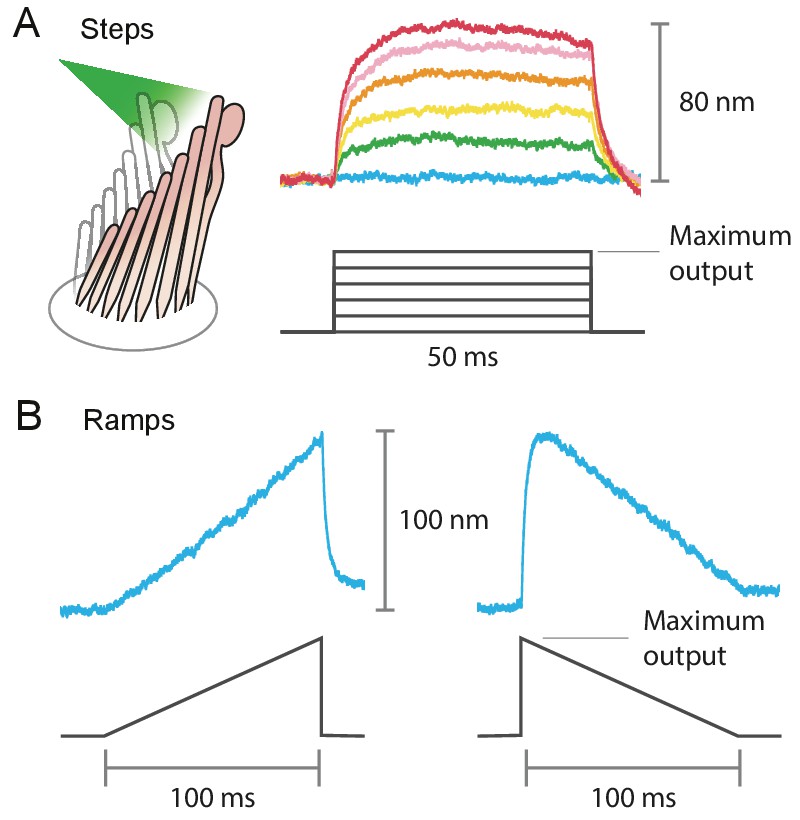
Example of the variety of stimuli offered by photonic-force stimulation.
(A) Frog hair bundles were stimulated in the positive direction with 561 nm light. The fiber’s power output was increased in five steps from 0 mW to the maximum, 12.5 mW for this fiber. Each colored trace shown is the average of 25 responses tracking the hair-bundle movement to a pulse of 50 ms at a constant laser power. (B) Frog’s hair-bundle responses to increasing (left) and decreasing (right) ramps of 100 ms, in which the laser power was varied continuously between 0 mW and 12.5 mW.
Appendix 1—figure 5
Deflection of hair bundles by optical radiation force without a photothermal effect.
(A) After tip links had been ruptured by a Ca2+ chelator (BAPTA), photonic force displaced a bullfrog’s bundle in the positive direction with a time constant of 415 s. In this and the other panels, the bundles were stimulated at 561 nm with 30 mW of input power and the records represent the average of 25 repetitions. (B) Stimulation in the negative direction evoked a negative movement with a time constant of 750 s. (C) Photonic force applied at 90° to the axis of sensitivity displaced a hair bundle in the direction of irradiation. (D) After the disruption of tip links, the hair bundle from a rat’s outer hair cell moved with a time constant of 467 s in the direction of photonic stimulation. (E) Negatively directed stimulation conversely evoked motion in the negative direction with a time constant of 418 s. The upper compartment of the experimental chamber contained endolymph in these experiments.
Appendix 1—figure 6
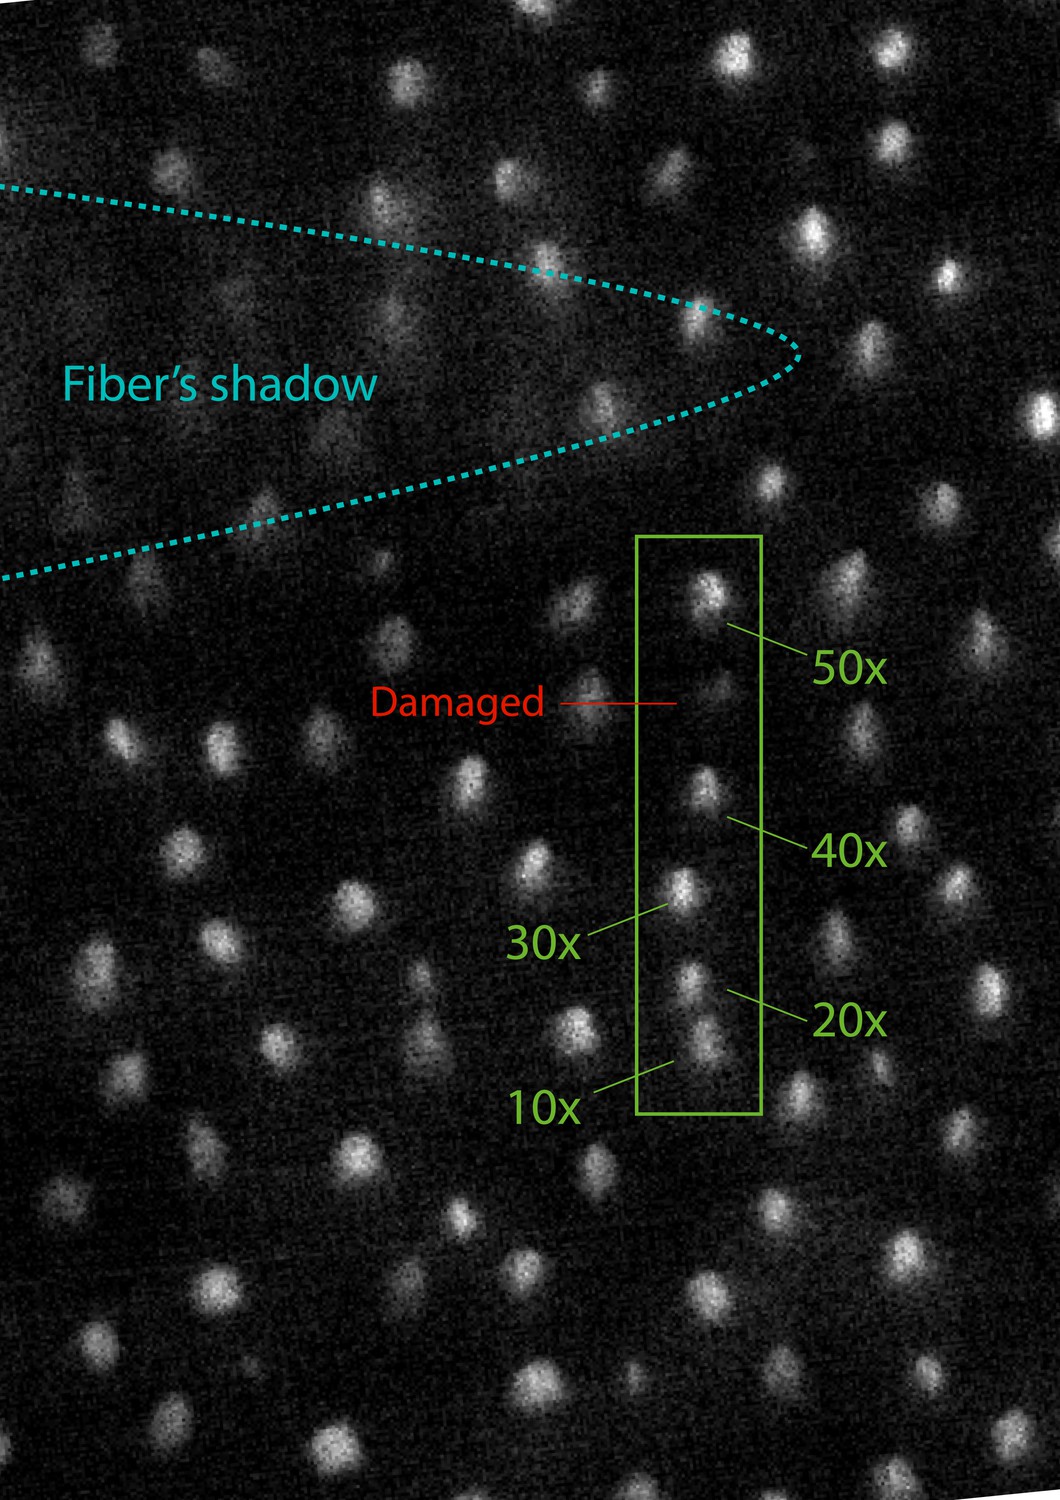
The fluorescence signal of bullfrog saccular hair bundles loaded with FM1-43 after exposure to laser irradiation.
We stimulated successive hair bundles in a row with 50 ms pulses at a power of 12.5 mW, the full power available for the fiber. The five hair bundles in the green box were subjected to 10, 20, 30, 40, and 50 pulses, as indicated. A sixth hair bundle in the same row, labeled in red, was damaged by being crushed a few times by the end of the optical fiber. Immediately after those procedures, the sample was exposed to 1 mM of FM1-43 for one minute, after which fluorescence was recorded. The stimulated hair bundles show comparable levels of brightness between each other and with respect to those in the surroundings. The loading of the dye is visibly reduced in the mechanically damaged cell owing to breakage of the tip links.
Appendix 1—figure 7
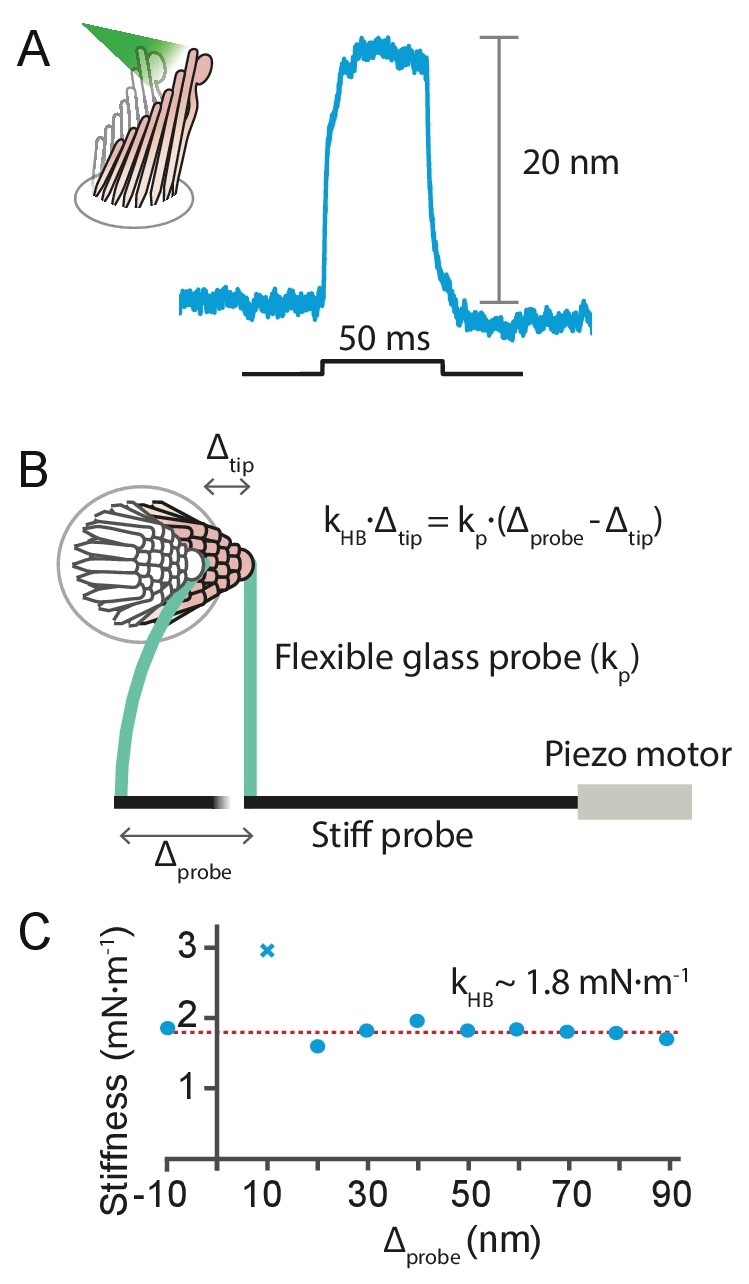
Estimation of the force exerted by radiation pressure onto a hair bundle of known stiffness.
(A) When a hair bundle from the frog’s sacculus was deflected by a 50 ms laser pulse at 12.5 mW output power, the bundle moved positively by 20 nm. The trace shown is the average of 25 repetitions. (B) The kinocilium of the same hair bundle was connected to the tip of a flexible glass probe of known stiffness , whose other end connected to a stiff probe driven by a piezoelectric actuator. To ensure adhesion between the glass and the kinocilium, concanavalin A was used to coat the flexible fiber. The motion of the fiber’s tip and the hair bundle was tracked with a dual photodiode. A movement of the stiff probe by translates into a force delivered by the flexible probe onto the hair bundle, whose reaction force depends on its stiffness times the bundle’s displacement . The balance of forces provides a way to estimate the hair-bundle stiffness: . (C) The stiffness of the hair bundle stimulated was measured by varying between –10 nm and 90 nm. The estimated stiffness of the hair bundle was (mean ± SEM). As a result we can estimate the force exerted by radiation pressure that elicited the hair-bundle response shown in panel A to be approximately 40 pN. The hair bundle was bathed in perilymph for the whole duration of the experiment. The data point marked with a cross was not included in the fit. The stiffness of the flexible fiber was measured by recording the Brownian motion of the fiber’s tip in water.
Additional files
Download links
A two-part list of links to download the article, or parts of the article, in various formats.
Downloads (link to download the article as PDF)
Open citations (links to open the citations from this article in various online reference manager services)
Cite this article (links to download the citations from this article in formats compatible with various reference manager tools)
Rapid mechanical stimulation of inner-ear hair cells by photonic pressure
eLife 10:e65930.
https://doi.org/10.7554/eLife.65930


